Smart Cash for the Climate: Maximising Auctioning Revenues from the EU Emissions Trading System
←
→
Page content transcription
If your browser does not render page correctly, please read the page content below
Smart Cash for the Climate:
Maximising Auctioning
Revenues from the EU
Emissions Trading System

                                                 Full report

An analysis of current reporting by Member
States and options for improvement

                                                     December 2016

    MaxiMiseR has been funded with the contribution of the LIFE financial instrument of the European Community and the MAVA Foundation.

                                   More information about the project can be found at www.maximiser.eu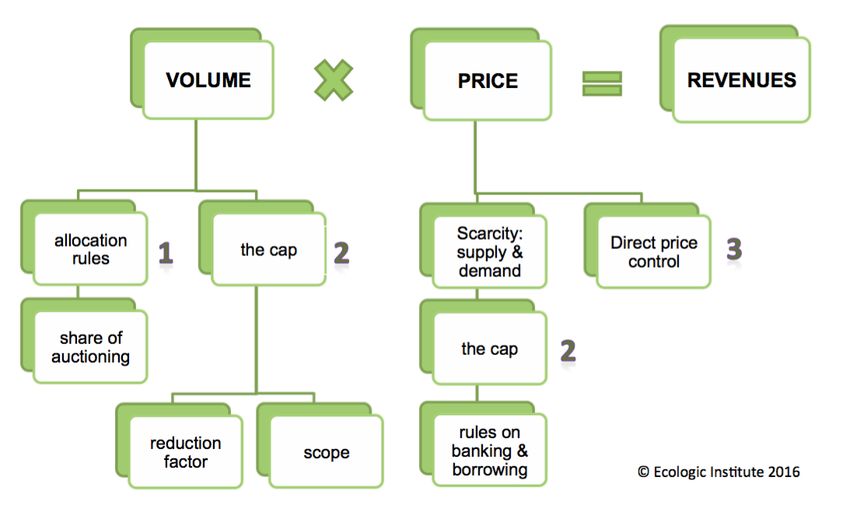
Authors at Ecologic Institute:
     Eike Karola Velten
     Matthias Duwe
     Elizabeth Zelljadt
     Nick Evans
     Marius Hasenheit

     Commissioned by WWF European Policy Office as part of the MaxiMiseR project:
     www.maximiser.eu

     MaxiMiseR has been funded with the contribution of the LIFE financial instrument of the
     European Community and the MAVA Foundation.

     More information about the project can be found at www.maximiser.eu

          MaxiMiseR has been funded with the contribution of the LIFE financial instrument of the European Community and the MAVA Foundation.

                                         More information about the project can be found at www.maximiser.eu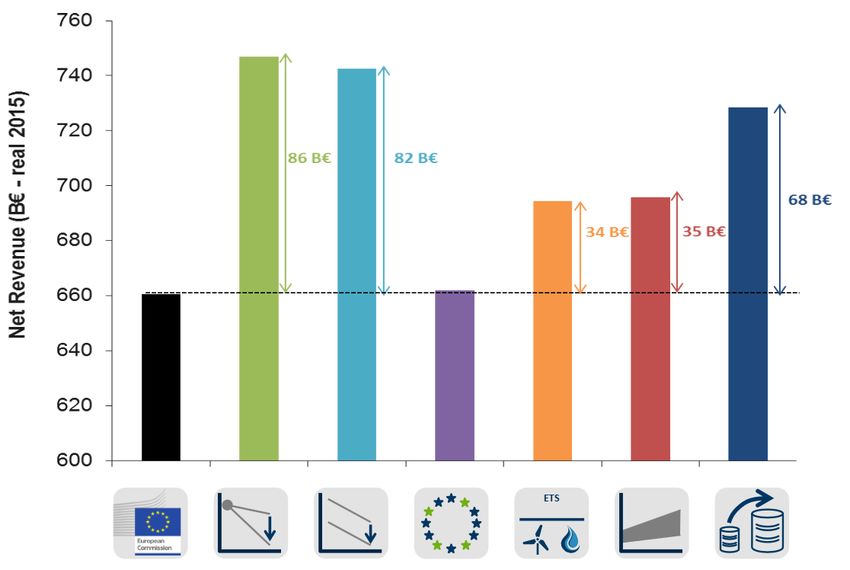
Current use of EU ETS auctioning revenues and reform options                                         3

Executive Summary
The European Emission Trading System (EU ETS) is one of the main policy instruments of the
EU to reach its climate targets. It sets a cap on emissions for a range of large point sources,
including power plants and industrial installations, as well as flights within the borders of the EU.
In the current third trading period (from 2013 to 2020), auctioning of emission allowances
became the default mode. However, almost half of all allowances are still given for free to the
manufacturing industries and, under a special exemption, to power generation in certain Eastern
European Member States (MS).

Member States earned close to EUR 12 billion from EU Emissions Trading 2013-2015
MS each receive a specific share of the total allowances to be auctioned mainly based on their
overall ETS emissions. From 2013 to 2015, Member States auctioned almost 2 billion
allowances amounting to EUR 11.7 billion in revenues. Germany, the biggest emitter in the EU,
received most of this money (over 20%) followed by the UK, Spain and Italy.
Member States agreed that at least half of these revenues should be used for climate action
inside or outside the EU. They can decide whether they allocate the revenues from auctioning of
allowances directly to a fund or support programme, a process known as earmarking, or count
the auctioning revenues as an additional income stream to the state budget. Earmarking has the
advantage of providing a transparent and consistent form of using auctioning revenues for
climate finance.

Over 80% of the money so far spent on climate action – most of it in the EU
On average, Member
States report to have spent           Misleading German reporting skews EU figures
85% of the total auctioning           Germany reports all expenditure under its national Energy and
revenues for climate                  Climate Fund as counting towards (domestic) climate action. It is
purposes over the period              not further differentiated into individual programmes and thus is
2013 to 2015. Of this                 counted fully as “cross-cutting”. The fund’s expenditure does
money, the majority was               contain payments to companies as compensation for the indirect
allocated to domestic                 cost of CO2. This cost arises through an increased electricity price
actions amounting to                  caused by the cost of carbon. Such state aid payments are
EUR 8,691 million (82%),              allowed under the ETS Directive – but counting them as a
whilst less than 9% was               mitigation measure is misleading at best, as the compensation
spent on international                eliminates the carbon price signal and may lead to additional
climate actions, amounting            emissions by the companies concerned. The respective
to EUR 1,048 million.                 payments amount to around EUR 700 million for the years 2013-
Figure 1 shows Member                 2015, a quarter of Germany’s auctioning revenues and 6% of total
States reported spending              EU wide revenues. Taking this amount off the EU wide sum
shares and groups them in             reported as spent on climate, the share would not be 85% but
clusters of similar                   79% instead. This would be further reduced in the future if other
characteristics. Most                 Member States should emulate this practice going forward (e.g.
Member States spent their             Belgium (Flanders), Finland).
auctioning revenues on

Current use of EU ETS auctioning revenues and reform options                                                           4

domestic climate action (upper right blue circle). Denmark and Ireland used (almost) 100% of
their auctioning revenues for climate change actions, with 50% going to domestic actions and
50% going to international climate actions (upper middle green circle). Luxembourg and Italy
also achieved an (almost) equal split between domestic actions and international actions over
the 2013-2015 average (but only report around 50% of all revenues going to climate related
expenditure). Only Finland uses 100% of the revenues for climate action to support international
climate actions (middle left violet circle). There are only two Member States that reported to
have spent less than 50% over the period 2013-2015: Hungary (36%) and Italy (47%) (see
orange circles).

Funding goes to renewables, efficiency and cross-cutting programmes
Member States mainly financed domestic actions in the field of cross-cutting activities (39% of
the revenues going to domestic action), renewable energies (32%) and energy efficiency (18%).
Thirteen of the Member States finance international actions with a focus on cross-cutting actions
which are either funds or bilateral support for projects and programmes that include climate
mitigation and adaptation but also actions to reduce emissions from deforestation (29%) and
mitigation activities (24%). A large share of international action is not further specified (41%).

Figure 1: Auctioning revenues and their use by Member States over the period 2013-2015

Source: based on Member States reporting under the MMR (EIONET 2016). Belgium and the Netherlands did not provide
information on domestic and international use and so these Member States are not included.
NOTE: Positions of Member States labels in this graph are indicative of the general positioning but do not in all cases
represent their accurate position, because the values for some Member States are the same. This graph has been
adjusted to show all MS labels.
The full set of values is included in the annex to this report. The figure excludes shares not specified by Member States
that are used for climate action. Details for the annual values of shares between domestic and international as well as
unspecified amounts are included in Table 7.
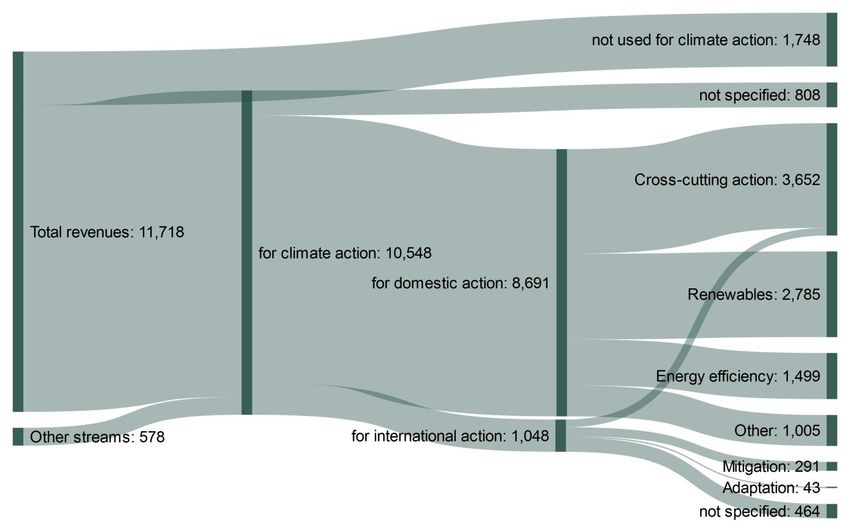
Current use of EU ETS auctioning revenues and reform options                                               5

Some Member States reported to have spent more money on climate action than what they
earned from auctioning of allowances. For example, Germany topped up their Energy and
Climate Fund from the state budget (beyond the amount financed from the ETS) while Cyprus
and Malta also reported to have spent 133% and 141% of their auctioning revenues on climate
action.

National reports contain mistakes – no frequent quality review at present
Getting at this data is not an easy task, despite the fact that all annual reports submitted by
Member States on their auction revenue usage are available online. Our assessment of these
reports shows that the reporting on ETS auctioning revenues and their use suffers from
deficiencies in the reporting framework and a lack of attention to detail in the preparation of
reports, that hamper transparency, comparability and the aggregation (and thus analysis) of the
data and can lead to misrepresentations, as in the case of indirect CO2 cost compensation in
Germany.
It is unclear why these weaknesses have not already been identified and appropriate
corrections requested by the European Commission (or the EEA) as part of a quality review to
ensure accuracy of the reporting and the data submitted through the system.

Figure 2: Main streams of auctioning revenues use in the EU over the period 2013-2015

Source: all numbers in million EUR; own compilation based on EIONET (2016), compiled using SankeyMatic ®

Structural surplus has depressed the carbon price and reduced auction revenue
Auctioning revenue is essentially a function of the volume of allowances available for sale at
auction and the respective price paid for these allowances (which of course may change for
each individual auction). In recent years, the price of European Union emission allowances
Current use of EU ETS auctioning revenues and reform options 6
(EUAs) in the EU ETS has been low, due to a structural surplus built up due to an inflow of
offset credits into the ETS and a decline in emissions from both power generation and
manufacturing faster than anticipated when the cap was set. The low price has thus led to much
lower than anticipated revenue from (an increasing volume of) EUAs being auctioned. To
address the surplus, a new mechanism has already been adopted, the so-called Market Stability
Reserve. However, negotiations are currently ongoing on the details of the EU ETS for the
period 2021-2030 – and decisions taken in this process will determine future auction revenues.
Commission free allocation proposal represents an additional EUR 120 billion in lost
revenue
The basis for political debate on the future design of the EU ETS beyond 2020 is the proposal
published by the European Commission in July 2015. Implementing the proposal would
increase auction revenue over current levels, as it contains a more stringent cap, which is
expected to increase the carbon price. However, taking the conclusions from the Heads of State
and Government Council of October 2014 as guidance, the Commission has done away with
the existing sentiment of auctioning as the default mode for allocation and extends free
allocation indefinitely. Compared to a scenario with the current phase-out of free allocation by
2027 (but a lower cap), this proposal threatens to lose around EUR 120 billion in auctioning
revenues (based European Commission EUA price assumptions). Several stakeholders have
made proposals on design elements relevant to auction revenues – and a broad selection of
these is assessed in the report.
Recommendations to maximise revenue and usage for climate action
On the basis of the information gathered for this report, we have defined recommendations in
three areas: 1. Increasing revenues, 2. Strengthening use, 3. Improving information.
1. Increasing revenues: increase both volume AND price
This assessment of the options leads to the conclusion that the most advisable strategy to
increase revenues is a combination of measures to increase the volume of EUAs available
for auction and the carbon price. This could be realised by
Reduce the level of free allocation compared to the Commission proposal - move
towards full auctioning as the current ETS Directive intended. A large and growing share
of the allowances in circulation should be auctioned, rather than given to emitters for
free.
Create more scarcity, and thereby a higher carbon price, by reducing the amount of
allowances in circulation with a higher linear reduction factor (= more rapidly declining
cap), a lower initial starting point for the cap (so that its downward trajectory is lower
to begin with), and cancellation of surplus allowances “stored” in the Market Stability
Reserve.
Implement measures at member state level to support the carbon price signal indirectly
through national cancellation of surplus allowances or directly by setting a carbon price
floor through implementing a minimum auction price.Current use of EU ETS auctioning revenues and reform options 7
2. Strengthening use: mandatory earmarking & a new EU Int’l Climate Finance Fund
There are several ways of strengthening provisions on the use of auction revenues in the ETS
Directive – options that the Commission proposal fails to entertain.
Require that Member States earmark or specifically designate auction revenue to
tackle climate action. This is by far the most-effective way of ensuring transparency of
and accountability for revenue use.
Require, rather than suggest, that the vast majority of auction revenue go toward
climate action by changing the wording in the Directive to “shall” rather than “should,”
and increasing that required percentage towards 100%.
No activities that can increase emissions (such as electricity price compensation
payments) should be allowed to count as contributing to the share specified for climate
related purposes.
A distinct minimum share should be formulated for revenues to be spent on
international climate action (only receives 9% in current reported spending).
Create a sizable new EU International Climate Finance Fund to ensure that a certain
guaranteed minimum amount of funding is going towards supporting developing
countries in tackling climate change and its impacts – in addition to expenditure for this
purpose by Member States
As a fall-back option, to ensure improvement over the current text of the Directive and
acknowledging good practice at Member State level right now, the legislation should
increase the use of funding for climate purposes and make this mandatory.
3. Better information: enhanced template with automatic checks, quality review
Several very specific technical adjustments should be made to enhance the quality of the data
generated by Member States under their reporting obligation. The main points are:
An improved template with input fields and underlying calculations and value checks
could help the Member States to submit consistent reporting while leaving enough room
for Member States to report on their specific circumstances.
Increase transparency by providing specific detail and additional information, including
on: details on any earmarking, the committed and the disbursed value, past funding,
individual programmes funded and their main purpose. Activities not contributing to
adaptation or mitigation should not be allowed to count as climate related expenditure –
or be reported separately from those types of actions.
The Commission (directly or via the EEA) should request updates or improvements of
the reports if information is contradictory or missing – installing a quality review.
Summary reports should be published regularly with all necessary data available in a
transparent fashion to empower stakeholders to verify national spending.Current use of EU ETS auctioning revenues and reform options 8
Table of Contents
Executive Summary ....................................................................................................................... 3
1. Introduction ............................................................................................................................. 9
2. Background: The EU Emissions Trading System ............................................................ 10
3. Country analysis on the use of auction revenues ............................................................ 11
3.1. Gaps and transparency of Member States’ reporting on auctioning revenues ............ 12
3.2. Revenues from auctioning of allowances ..................................................................... 15
3.3. The use of auction revenues ........................................................................................ 18
4. Options for a reform of the EU ETS and effects on auction revenues ........................... 30
4.1. Overview of auction revenues and how to maximise them .......................................... 30
4.2. Current ETS reform ideas and their relationship to auction revenues ......................... 34
4.3. Ensuring the use of auction revenues for climate finance ........................................... 45
5. Conclusions and recommendations .................................................................................. 51
5.1. Increasing revenues ..................................................................................................... 51
5.2. Strengthening use ......................................................................................................... 53
5.3. Better information.......................................................................................................... 56
6. Literature ............................................................................................................................... 59
7. Index....................................................................................................................................... 65
Annex: Allocation of auctioning revenues per Member State ................................................ 66
Annex: Country Sheets ................................................................................................................ 68Current use of EU ETS auctioning revenues and reform options 9 1. Introduction Moving towards a pathway consistent with keeping global temperature rise well below 2°C or even 1.5°C above preindustrial levels, as agreed under the international Paris Agreement, requires a radical transformation of the world’s economies. This transformation must include a massive shift of public and private expenditure towards low-carbon investment. For the EU, the decarbonisation of the economy will require additional investments of EUR 270 billion per year up to 2050; although this sum would likely be partially balanced out by savings in fuel costs (COM 2011). In addition, in the global arena, the EU and other industrialised countries have promised to mobilise international climate finance amounting to USD 100 billion annually from 2020 onwards and an even higher sum after 2025 (UNFCCC 2015). While a share of the USD 100 billion figure may come from the private sector, significant public funds will be required to leverage the total. In this context, innovative finance mechanisms are necessary to unlock additional investment in the EU and globally. Revenues generated from pricing pollution and notably auctioning allowances in the European Emissions Trading System (EU ETS) may constitute a crucial source of designated funding for climate actions, including domestic and international mitigation and adaptation projects. Domestic climate action and living up to its UNFCCC commitments with regard to climate finance are key priorities for the EU. To this end, the effective mobilisation of funds is one of the important determining elements for achieving the EU’s climate goals. Using revenues from the auctioning of allowances is especially attractive because they present a guaranteed source of annual funding; however, due to the variability of the carbon price auction revenues are also an unsatisfactory funding source for policies requiring fixed budgets or stable cash flow. This study aims to give input to the discussions on how EU ETS auctioning revenues can be used to help finance the low-carbon transformation in Europe, currently taking place in light of EU commitments under the Paris Agreement, and the ongoing debate over EU ETS reform. In this context, this report gives an overview on the current revenues from auctioning in the EU ETS and their use by the EU Member States (Chapter 3). Individual country sheets can be found in the Annex, and the underlying database is accessible on the internet to depict this data visually and comparatively for all EU Member States: visit www.maximiser.eu. In addition, the report includes an assessment of proposals for a reform of the EU ETS and their effects on the amount of auctioning revenues based on a literature review (Chapter 4). Recommendations for better reporting and improved use of auctioning revenues with respect to the EU ETS reform can be found in Chapter 5.
Current use of EU ETS auctioning revenues and reform options                                                 10

2. Background: The EU Emissions Trading System
Establishing a cap-and-trade system by setting a limit on emissions from a given set of emitters
creates a new asset class or tradable commodity unit: the allowance or “permit” to emit a certain
amount. For greenhouse gas cap-and-trade systems, this amount is usually one metric tonne of
carbon dioxide equivalent (CO2e). The government or regulator of the respective emissions
trading program (ETS) issues a finite number of permits allowing the emission of one metric
tonne of CO2e.
In the EU ETS1 these are called “European Union Allowances” (EUAs) and “European Union
Aviation Allowances” (EUAAs) – the latter are issued for the aviation sector specifically. Over
1.5 billion allowances are issued per year. The regulator brings these units into circulation
among emitters, who must then surrender one allowance for each tonne CO 2e they emitted
during the relevant ETS timeframe back to the regulator. Allocating allowances can be done in
two ways: allowances can be given to emitters for free or sold to them. The former is generally
referred to as “free allocation” (the recipients are handed these assets based on some
predetermined formula) while the latter is usually done via an allowance auction, the proceeds
of which go to the respective government or regulator, or are directly recycled into the covered
sectors. It is these proceeds – or auction revenue from the sale of EUAs and EUAAs, whose
use is being studied in this report.
According to “pure” economic theory, the most efficient and revenue-maximising allocation
method is simply to auction all allowances intended to go into circulation. No emitter should
receive allowances for free, as that would constitute a government subsidy for some recipients
as long as other allowance recipients had to pay for them (see Jouvet and Rotillon, 2005;
Cramton and Kerr, 1998). From a revenue perspective, the value of the allowances given away
for free constitutes money that the government cannot use for other purposes, e.g. climate
change mitigation or adaptation. In practice, however, most cap-and-trade systems established
around the world include an element of free allocation, as it is tied to other political factors
influencing the debate, such as employment rates and the concern that emissions-intensive
goods will simply be produced less in the region covered by the ETS and more in areas void of
greenhouse gas (GHG) caps (see e.g. Keohane and Olmstead, 2016).

1
 The legal basis is the EU ETS Directive: Directive 2003/87/EC of the European Parliament and of the Council of 13
October 2003 establishing a scheme for greenhouse gas emission allowance trading within the Community and amending
Council Directive 96/61/EC.
Current use of EU ETS auctioning revenues and reform options                                                        11

3. Country analysis on the use of auction revenues
For the third trading period of the EU ETS (running from 2013 to 2020), auctioning of
allowances has been the default mode of allocating allowances to stationary installations i.e.
industrial installations in the EU ETS. Allowances are mainly auctioned to the power sector as
free allocation is still granted for the manufacturing industry. For aviation 15% of allowances are
auctioned, 82% are granted for free to aircraft operators and 3% are held in a reserve (Article 3d
of the ETS Directive).
EU Member States each receive a specific share of the total allowances to be auctioned
pursuant to Article 10 and 3d of the ETS Directive. For allowances auctioned to stationary
installations the following rules apply: 88% of allowances are allocated to Member States based
on their verified emissions in 2005 or from 2005-2007 (the higher value applies), 10% are
allocated to the least wealthy Member States, and 2% to Member States that reduced their
greenhouse gas emissions by at least 20% by 2005 compared to the Kyoto base year, which is
1990 for most Member States (“Kyoto bonus”). For allowances auctioned to aviation, the
allowances are allocated to Member States based on their share of aviation emissions two
years prior to the year in which the auctions take place.
For the current third trading period, the European Commission estimates that around 57% of all
allowances will be auctioned. For stationary installations, 8,176 million allowances are available
for auctioning (COM 2016a). However, as another exception to the general principle of
auctioning as the default mechanism, around 500 million allowances from this total amount will
be allocated for free to electricity generators in some Member States2 based on Article 10c of
the ETS Directive, thus reducing the corresponding amount of revenues to those Member
States. In addition, the estimates for allowances to be auctioned from 2019 onwards do not yet
incorporate reductions due to the implementation of the Market Stability Reserve (MSR) (see
also p. 37) (COM 2016a,b). For aviation, the amount of allowances to be auctioned depends on
the overall aviation emissions (for annual numbers see below) with annual volumes to be
auctioned summing up to 15% of the expected aviation allowances in circulation (COM 2016b).
EU Member States agreed in 2008 that at least half of the revenues from allowance auctions in
the EU ETS should be used for climate actions (EU Council 2008). No higher share could be
adopted due to political disagreement and some constitutional concerns. The Committee on
Environment, Public Health and Food Safety (ENVI) of the European Parliament had originally
envisaged that 100% of revenues should go into climate and energy measures, and 50% of
these into international climate finance.

2
 These Member States have to have an electricity network that has no or only a limited connection to the UCTE network
or more than 30% of the electricity is produced from a single fossil fuel and the gross domestic product (GDP) per capita
has to be below the EU average.
Current use of EU ETS auctioning revenues and reform options                                                         12

3.1.      Gaps and transparency of Member States’ reporting on auctioning revenues

Article 17 of the Monitoring Mechanism Regulation (MMR) 3 requires Member States to submit
annual reports on the revenues gained from auctioning allowances, as well as their use. These
reports have to be submitted by the end of July of every year, with information on the year
before. The template for this purpose (established under Implementing Regulation 749/2014)
includes five tables4 covering information on revenues from auctioning of allowances, the
amount used for climate action, as well as information on domestic and international climate
action. Member States have to submit these reports to the Reporting Obligation Database
(ROD) which is managed by the European Environment Agency (EEA) as part of the European
Environment Information and Observation Network (EIONET) (see EIONET 2016).
To date, reports for the years 2013, 2014 and 2015 had to be submitted. We have analysed the
documents available through the ROD website archive on reports delivered, accessible online at
http://rod.eionet.europa.eu/obligations/698/deliveries.
Our assessment of these reports shows that the reporting on ETS auctioning revenues and their
use suffers from deficiencies in the reporting framework and a lack of attention to detail
in the preparation of reports, that hamper transparency, comparability and the aggregation
(and thus analysis) of the data. In the following table we highlight some of the main weaknesses
including examples from Member States’ reporting.

Table 1: Weaknesses of Member States reporting on auctioning revenues and their use

    Type of reported information                      Examples from Member States’ reporting
    Units                                             Finland provided monetary values in EUR instead of 1000
    MS should submit monetary values in               EUR
    1000 EUR
    Unit conversion                                   The Czech Republic, Hungary, Poland and Romania
    MS should submit monetary values in Euro          use different exchange rates to convert their auctioning
    and in local currency                             revenues and the funds spent on individual domestic
                                                      climate actions. Thus, local currency adds up while EUR-
                                                      values do not.
    Use of tables in the template                     Portugal listed funds spent on international climate action
    There are five tables covering different          not only in the respective tables on international actions
    information (see footnote 4).                     but also in the table on domestic actions.
                                                      Estonia listed the same international climate action both
                                                      as multilateral and as bilateral support.

3
  Regulation (EU) No 525/2013 of the European Parliament and of the Council of 21 May 2013 on a mechanism for
monitoring and reporting greenhouse gas emissions and for reporting other information at national and Union level relevant
to climate change and repealing Decision No 280/2004/EC
4
  Table 1 asks for revenues generated from auctioning, the amount spent on climate mitigation actions and carry-over from
previous years; Table 2 contains specific information on domestic actions; Table 3 contains overall amounts spent on
international actions; Table 4 asks for information on international support provided through multilateral channels and
Table 5 asks for information on bilateral or regional support.
Current use of EU ETS auctioning revenues and reform options 13
Type of reported information Examples from Member States’ reporting
Values do not add up Six Member States provided values for total funds spent
There are five tables covering overall and on individual types of climate action that are inconsistent
more specific information (see footnote 4). with the funds spent on domestic and international climate
action: e.g. Austria provides a list of projects that were
financed by the state budget adding up to a higher amount
than their auctioning revenues; Germany channels the
money to a fund which had higher expenses than the
auctioning revenues; and Portugal reported in the overall
table only on disbursed values while in the table on
domestic actions also committed values are included.
Committed vs. disbursed Where a programme received funds that have only partly
Member States should specify if funds are been disbursed, Member States provide different kinds of
committed and/or disbursed for a specific reporting e.g. they provide committed values that include
(domestic or international) programme or or exclude disbursed values. Thus, it needs to be checked
project. if values can be simply added.
Carry over About half of the Member States provided information that
Member States should report on those they carried over parts of the funds committed in former
funds not disbursed in the former years to years. Member States, however, treat the carry over
be disbursed in the respective year. differently and most do not include the values in their
reporting.
A good example is Lithuania, which lists the respective
amounts of “carry over” and the related projects and
references the years when revenues were earned.
Germany reports on a reserve for its fund.
Source: own compilation based on Member States’ reporting under the MMR (EIONET 2016)
Table 2: Gaps in Member States reporting on auctioning revenues and their use
Type of reported Examples from Member States’ reporting
information
Gaps on auctioning Belgium, Cyprus, France and Poland report to have no revenues from
revenues the auctioning of aviation allowances, but did receive revenues from the
auctioning of aviation allowances (EEX 2016a).
No details on the use of Belgium, Luxembourg and the Netherlands did not provide any
auctioning revenues information on the use of auctioning revenues besides the overall
amount, due to a variety of reasons (see country sheets in the Annex).
Cyprus and Romania did not outline how they used certain parts of the
revenues for climate action in individual years.
Denmark and Germany used parts of their auctioning revenues to
support international climate action, but did not provide further details on
the projects.
No details on specific Germany channels its auctioning revenues to its Energy and Climate
programmes and projects Fund and reports the total amount to be spent by the fund on a range of
purposes without specifying the specific amounts associated with the
different programmes. This has significant repercussions on what is
counted as “climate related” expenditure and includes activities that may
lead to increased emissions (see more below).
A good example is Slovenia, which also channels its auctioning
revenues to a Fund but reports on each of the projects financed, in a
transparent manner.Current use of EU ETS auctioning revenues and reform options 14
Type of reported Examples from Member States’ reporting
information
Incomprehensible Bulgaria reported that it transferred “funds from the budget of the
information on specific Ministry of Environment and Water (MoEW) in the central budget
programmes and projects account ‘SEBRA’ of the Ministry of Finance (MoF)”, but did not provide
any further details on how this relates to climate action.
Hungary reported that it used funds for its "central budget according to
9. § (2), Act CCIV. of 2012. on the Budget of Hungary for 2013”, but did
not state how this relates to climate action.
Lithuania spends funds on “Measures which do not result in quantitative
CO2 savings, but did not elaborate on what this means.
Germany reported that it spent funds on a “grant from the federal
budget” for its Energy and Climate Fund.
Source: own compilation based on Member States’ reporting under the MMR (EIONET 2016)
The fact that Member States sometimes report expenditure beyond their actual revenues as
relevant expenditure (see Table 1 on “Values do not add up“) results in there being more than
one overall total – in fact there are two different totals for overall expenditure and for
expenditure for climate purposes. This is due to the fact that in some cases Member States
report different totals or shares in different parts of the template (e.g. Germany and Austria,
which reported 100% of revenue spent, but then provide numbers going beyond that 100% in
the specific use sections of the report). Table 3 below has the calculations showing the
differences (in bold and red) - see also the Sankey Visualisation of the different streams in
Figure 5. In essence this leads to the calculation that an additional revenue stream of at least
EUR 578 million is required to allow for the total expenditure reported by Member States.
Comparability and analysis of revenue use is made more complex through this particular
inconsistency.
Table 3: Comparison of different reported totals (period 2013-2015) to identify inconsistencies (=
additional financing stream) (all figures in EUR thousand)
Total revenues generated 11.718.120
Revenue usage indication Sum of reported revenues used 11.718.120
(amounts to 100% of Not used for climate purposes 1.748.531
revenues) Used for climate purposes 9.969.589
Used for domestic action 8.691.259
Specified use - split
domestic and international Used for international action 1.048.409
(total does not match the Use not specified 808.110
above)
Sum of usage 10.547.777
Difference to total revenue: Other financing streams -578.188
Use reported relative to total revenue 104,93%
Source: COM (2016), own assessment of Member States’ reporting on Article 17 of the MMR (EIONET 2016). Excluding
2015 data for Ireland as this has not been reported so far and Croatia only started auctioning allowances in 2015. Belgium,
Cyprus, France and Poland reported to have no revenues from auctioned aviation allowances.
Some of the weaknesses listed can easily be identified and corrected, such as using the wrong
order of magnitude (EUR instead of 1000 EUR). Other weaknesses, such as incomplete andCurrent use of EU ETS auctioning revenues and reform options 15
incorrect statements, require additional information from the respective Member State.
However, even identifying incomplete or wrong information can require a good understanding of
the EU ETS, the underlying reporting requirements, and/or national circumstances and
budgetary systems.
This poses challenges also for the analysis of the reported data in this paper. We therefore used
the reported information as provided, implementing only minor changes to the data.
Specially, we made the following adjustments:
Converted EUR to 1000 EUR where required,
Deleted programmes that were provided several times in different tables, and
Used committed and disbursed values without double counting these values.
Used bottom-up total expenditure figure (see Table 3 above) to calculate relative shares
of revenue use
We did not include “carry over” in our assessment, as Member States’ reporting was not
consistent in this respect.
Where data was not provided or seemed incomplete, we checked other documents including
the assessments of former years (COM 2014, 2015): for Luxembourg, which did not report on
the use of auctioning revenues, we used information by the COM (2014, 2015) for the years
2013 and 2014 (which said that they spent half of their revenues on domestic climate actions).
Latvia and Slovakia reported to have spent only a minimal amount of their auctioning revenues
on climate actions, but COM (2014, 2015) states that they channel all their revenues into a fund
where it is accumulated for later use; thus, we also included that these countries use 100% of
their revenues for domestic climate actions. For Germany, we contacted the focal point as a
comment on revenues used for climate actions contradicted the entry - the inconsistency turned
out to be a typing error in the comment. We also clarified that the “grant from the federal budget”
for the Energy and Climate Fund is not meant to be an expenditure, but the source of additional
money for the fund. Thus, we added this amount to the revenues allocated to the Energy and
Climate Fund.
It is unclear why these weaknesses have not already been identified and appropriate
corrections requested by the European Commission (or the EEA) as part of a quality review to
ensure accuracy of the reporting and the data submitted through the system.
3.2. Revenues from auctioning of allowances
From 2013 to 2015, almost 2 billion allowances were auctioned to stationary installations and
aviation operators amounting to EUR 11.7 billion in revenues for Member States. Fewer
allowances were auctioned in 2014 than in 2013 due to the “backloading”5 of allowances to the
end of the trading period. In 2013, no auctions were held for aviation allowances due to the
“stop-the-clock” Decision.6 Aviation auctions started again in 2014.
For stationary installations, allowances were auctioned at prices ranging from below EUR 3 in
mid-2013 to around EUR 8.60 end of 2015 (EEX 2016a). On average, allowances were sold for
5
Commission Regulation (EU) No 1210/2011 stipulates the reduction of the auctioning volume by 400 million allowances
in 2014, 300 million allowances in 2015 and 200 million allowances in 2016.
6
Decision No 377/2013/EUCurrent use of EU ETS auctioning revenues and reform options 16
almost EUR 4.50 in 2013, almost EUR 6 in 2014, and for EUR 7.60 in 2015 (own calculations
and COM 2016c).
Auctions of aviation allowances are limited in number, with a price development similar to those
for stationary installations and a selling price generally below the prices for stationary
installations at the same point in time (EEX 2016a). The average selling price was EUR 6 in
2014 and EUR 7 in 2015 (COM 2016c).
Table 4: Number of allowances auctioned respective revenues
Auctioned stationary Auctioned aviation Total revenues in
installations allowances allowances million EUR
2013 808 million - 3,627 million
2014 528 million 9 million 3,210 million
2015 633 million 11 million 4,881 million
TOTAL 1,969 million 20 million 11,718 million
Excluding 2015 data for Ireland as this has not been reported so far and Croatia only started auctioning allowances in
2015. Belgium, Cyprus, France and Poland reported to have no revenues from auctioned aviation allowances.
Source: COM (2016), own assessment of Member States’ reporting on Article 17 of the MMR (EIONET 2016)
For almost all Member States, the trend of total revenues follows the overall EU28 trend: in
2014 less revenue was generated than in 2013, while in 2015 the revenues were higher than in
2013. The total amount of revenues for single Member States varied widely, just as their total
emissions covered by the EU ETS do. Thus, small countries such as Malta and Luxembourg
earned around EUR 4 million to 7 million per year, whilst the biggest emitter Germany had an
income of up to EUR 1.1 billion (over 22% of the total), followed by the UK which generated
almost EUR 600 million, Italy at EUR 550 million and Spain which earned almost EUR 500
million from auctioned allowances (all numbers for 2015) (see Figure 3 and Table 5).
Over the period of 2013-2015, the revenues were generated mainly from auctioning of
allowances to stationary installations, whilst allowances auctioned to the aviation sector amount
to a mere 1% of overall auctioned allowances (see also Table 4). In total, EUR 137 million were
generated by the Member States from auctioned aviation allowances. Looking at individual
Member States, the United Kingdom generated the largest amount of aviation related auctioning
revenues (EUR 33 million), followed by Spain (EUR 23 million), and then Italy (EUR 20 million).
Belgium, Cyprus, France and Poland reported to have no revenues from auctioning aviation
allowances between 2013 and 2015; although revenues from auctioning are allocated to all
Member States based on their annual aviation emissions. The exchange on which the aviation
allowances were auctioned (EEX in Leipzig) lists those sales monthly and includes revenue
figures by Member States: Belgium earned EUR 4.7 million; Cyprus EUR 1.7 million, France
EUR 22.2 million and Poland EUR 3 million (COM 2016c, EEX 2016a).Current use of EU ETS auctioning revenues and reform options 17
Figure 3: Total revenues from auctioning of allowances for each Member State (2013-2015)
1,200
million EUR
2013
2014
1,000
2015
800
600
400
200
0
AT BE BG CY CZ DE DK EE EL ES FI FR HRHU IE IT LT LU LV MT NL PL PT RO SE SI SK UK
Excluding 2015 data for Ireland as this has not been reported so far; Croatia only started auctioning allowances in 2015.
Source: own assessment of Member States’ reporting on Article 17 of the MMR (EIONET 2016)
Table 5: Member States’ revenues from auctioning of allowances over the period 2013-2015
MS Revenues from Revenues from Total national Share of Member
auctioning of auctioning of aviation revenues State revenues
allowances to allowances (in million EUR) in EU total
stationary installations (in million EUR)
(in million EUR)
AT 184.4 3.5 187.9 1.6%
BE 353.7 0.0 353.7 3.0%
BG 209.7 1.1 210.8 1.8%
CZ 246.2 1.7 247.9 2.1%
CY 4.1 0.0 4.1 0.0%
DE 2,633.6 16.9 2,650.5 22.6%
DK 171.6 3.9 175.5 1.5%
EE 46.6 0.2 46.8 0.4%
EL 467.8 6.1 473.9 4.0%
ES 1,142.8 22.9 1,165.7 9.9%
FI 221.3 2.9 224.2 1.9%
FR 746.7 0.0 746.7 6.4%
HR 86.5 0.5 87 0.7%
HU 173.1 1.3 174.4 1.5%
IE 76.8 0.9 77.7 0.7%
IT 1,318.2 19.7 1,337.9 11.4%
LT 65.4 0.3 65.7 0.6%Current use of EU ETS auctioning revenues and reform options 18
MS Revenues from Revenues from Total national Share of Member
auctioning of auctioning of aviation revenues State revenues
allowances to allowances (in million EUR) in EU total
stationary installations (in million EUR)
(in million EUR)
LU 16.1 0.9 17 0.1%
LV 35.6 0.7 36.3 0.3%
NL 443.4 9.2 452.6 3.9%
MT 13.9 0.7 14.6 0.1%
PL 454.9 0.0 454.9 3.9%
PT 234.9 4.2 239.1 2.0%
RO 413.9 1.9 415.8 3.5%
SE 117.1 4.7 121.8 1.0%
SI 58.7 0.1 58.8 0.5%
SK 203.6 0.2 203.8 1.7%
UK 1,440.5 32.6 1,473.1 12.6%
EU28 11,581.2 137.0 11,718.2 100.0%
Excluding 2015 data for Ireland as this has not been reported so far and Croatia only started auctioning allowances in
2015. Belgium, Cyprus, France and Poland reported to have no revenues from auctioned aviation allowances.
Source: own assessment of Member States’ reporting on Article 17 of the MMR (EIONET 2016)
3.3. The use of auction revenues
The EU ETS Directive stipulates that at least 50% of the revenues from auctioning of
allowances to stationary installations or the equivalent in financial value of the revenues should
be spent on different forms climate action, inside or outside the EU (ETS Directive, Article 10.3).
Revenues generated from the auctioning of aviation allowances should be used to finance
climate change actions (as per Article 3d of the ETS Directive). Both Articles have non-binding
character but provide a clear indication to Member States, that they have all agreed to.
In the following we give an overview on how much of the auctioning revenues Member States
spent on climate change action, and what types of actions were financed – as per their
respective reporting. In analysing this data, one needs to take into account that Member States
treat the revenues differently in their respective budgetary system i.e. some earmark revenues
from the auctioning of allowances, while others allocate them to the state budget, which then
finances climate change actions (see following section).
3.3.1. Earmarking of auctioning revenues
Assigning revenues directly to a specific purpose is known as earmarking, or hypothecation.7
Member States that earmark their ETS auctioning revenues have identified a specific support
programme or a fund that they will go towards, directly. These Member States report on the
fund as a whole (e.g. Germany) or on the different programmes financed by the fund (e.g.
Slovenia).
7
Another synonym is “to ring-fence”Current use of EU ETS auctioning revenues and reform options 19
Member States that do not earmark their revenues report on climate actions, which were
financed by the state budget by the same amount (i.e. same financial value) as their auctioning
revenues. However, the flow of funding from the income generated through the auctioning to the
financing provided for action on climate change cannot be established. This means that Member
States can show mitigation or adaptation spending in their budget that is at the level of half their
auction revenues as “proof” that they have used auction revenues toward the purposes laid out
in the guidelines. This is the case even if that spending would or could have taken place without
the additional ETS auction revenues.
Where earmarking is in place, it still does not mean a Member State is making the earmarked
amount of money available for additional climate-related purposes: the money may simply be
replacing amounts that previously came from the state budget. In other words, earmarking
auction revenue for climate purposes does not imply an “all other spending stays the same”
situation; instead cuts may be made to climate projects financed e.g. from the general budget
precisely because there is new funding from ETS allowance auctioning. It was, however,
beyond the scope of this report to assess the degree to which Member States’ auction revenue
use represents truly additional funding for climate-related projects. For the purposes of
interpreting the information on revenues, earmarking being in place or not, does not suggest a
qualitative difference with regards to additionality.
Table 6 shows a compilation of information on earmarking given by Member States in their
reporting under the MMR (EIONET 2016). There are seventeen Member States that do not
earmark their auctioning revenues, but instead finance climate actions from the state budget. As
an example, the UK puts ETS auction revenue into the general budget, which already supports
climate change mitigation and adaptation. A parliamentary document (DECC 2015) explains:
“Like all Government receipts, ETS revenue is remitted to the consolidated fund to support
general expenditure, allowing Government to allocate resources in the most efficient way across
the economy. As a result, we have been able to spend more on support for low carbon
technology and other action to mitigate climate change than has so far been raised by the ETS
auctions.”
Eleven Member States earmark their auctioning revenues by allocating the revenues to a
specific support programme or to an existing or new fund. For example, France channels all
auctioning revenues to the "Habiter Mieux" [live better] programme managed by the National
Agency for Housing (Anah) – this programme and supports measures to improve the energy
efficiency of housing. Latvia allocates almost all its revenues to an “Emission allowances
auction instrument,” but that programme has yet to finance any activities so revenues are
accumulated in the fund.
Table 6: Earmarking of auctioning revenues as reported by Member States
MS Financial instrument for the use of auctioning revenues
AT No earmarking
No cooperation agreement on the distribution of revenues between the federal
BE
government and the Flemish, Walloon and Brussels Capital regional governments
BG No earmarking
CZ State Environmental Fund of the Czech Republic
CY No earmarkingCurrent use of EU ETS auctioning revenues and reform options 20
MS Financial instrument for the use of auctioning revenues
DE Energy and Climate Fund
DK No earmarking
EE No earmarking
EL Special Account for Renewable Energy Sources
ES No earmarking
FI No earmarking
FR "Habiter Mieux" programme of the public housing authority as per a 2012 law
HR Environmental Protection and Energy Efficiency Fund
HU Large majority goes to the Green Economy Financial Scheme
IE No earmarking
IT No earmarking
LT Lithuanian Environmental Investment Fund (LAAIF)
LU No earmarking
LV New “Emission Allowances Auction Instrument”
NL No earmarking
MT No earmarking
PL No earmarking
PT Carbon Fund
RO No earmarking
SE No earmarking
SI Environmental Fund
SK Environmental Fund
UK No earmarking
Source: own compilation based on Member States’ reporting under the MMR (EIONET 2016); Esch (2013); IEA (2016),
WWF personal communication.
3.3.2. How much of the total revenues were used for climate action in- or outside the
EU?
Member States can use the revenues from auctioning to fund climate action both inside and
outside of the EU to reach the goal of at least 50% being spent on climate. Over the period
2013-2015, auctioned allowances generated about EUR 11.7 billion for EU Member States, of
which, 85% was used for climate action inside and outside of the EU, according to Member
States’ own reporting under the MMR (EIONET 2016).
As per Member State reporting, the majority of the revenues used for climate action (82%) were
allocated to domestic actions amounting to EUR 8,691 million, whilst only close to 10% was
spent on international climate actions, amounting to EUR 1,048 million. Another 8% (EUR 808
million) goes to unspecified climate related purposes.8 Figure 4 shows the allocation of
8
These figures are based on the bottom-up sums of reported usage by Member States – a total that is derived from
aligning reported detailed usage with overall expenditure for climate purposes, which comes to EUR 10,547 million (see
Table 3.Current use of EU ETS auctioning revenues and reform options 21 revenues at the Member State level and puts the split between domestic and international use in relation to the overall share of revenues spent on climate. Figure 4: Allocation of the EU ETS auctioning revenues over the period 2013-2015 as reported by Member States Source: based on Member States reporting under the MMR (EIONET 2016). Belgium and the Netherlands did not provide information on domestic and international use and so these Member States are not included. NOTE: Positions of Member States labels in this graph are indicative of the general positioning but do not in all cases represent their accurate position, because the values for some Member States are the same. This graph has been adjusted to show all MS labels. The full set of values is included in the annex to this report. The figure excludes shares not specified by Member States that are used for climate action. Details for the annual values of shares between domestic and international as well as unspecified amounts are included in Table 7. The Figure shows that most Member States report to have spent significantly more than 50% of their auctioning revenues on climate change actions. Only two Member States report to have spent less than 50% of their auctioning revenues on climate change actions over the period 2013-2015: Hungary (36%) and Italy (47%). Malta (141%), Cyprus (133%) and Germany (120%) on the other hand report spending more than their actual revenues. Of this expenditure, most Member States have spent the vast majority of their auctioning revenues on domestic climate actions (upper right blue circle). Denmark and Ireland used (almost) 100% of their auctioning revenues for climate change actions, with 50% going to domestic actions and 50% going to international climate actions (upper middle green circle). Luxembourg and Italy also achieved an (almost) equal split between domestic actions and international actions over the 2013-2015 average (but only report around 50% of all revenues going to climate related expenditure). Only Finland has used 100% of the revenues for climate action to support international climate actions (middle left violet circle). Its government set an ambitious 2015 goal for official development aid that could not be met by the funding made available from the state budget in
Current use of EU ETS auctioning revenues and reform options                                     22

the years leading up to 2015, so to bridge the financing gap, Finland’s auctioning revenues went
toward climate funding within the country’s overall development cooperation (see also Esch,
2013).
Two Member States are not included in Figure 4: Belgium did not provide information on the use
of auctioning revenues as the revenues are locked in an account. Funds should be distributed
among the four governments (federal, Flemish, Walloon and Brussels Capital) but so far no
agreement has been concluded on how to do so. The Netherlands reported that it was not able
to fill out the tables on domestic and international actions, as they do not earmark revenues.
However, the Netherlands report to spend an amount “that transcends many times [the] auction
revenue to [climate change actions].” (EIONET 2016).

Figure 5: Overview on the auctioning revenues and their use in the EU over the period 2013-2015

Source: all numbers in million EUR; own compilation based on EIONET (2016) using SankeyMatic ®
Current use of EU ETS auctioning revenues and reform options                                                     23

Table 7: Share of auctioning revenues used for climate actions allocated to domestic and
international climate actions for individual years

                      2013                                2014                                2015

                     nal action

                                                         nal action

                                                                                             nal action
                     internatio

                                                         internatio

                                                                                             internatio
          domestic

                                              domestic

                                                                                  domestic
                                  unspecifi

                                                                      unspecifi

                                                                                                          unspecifi
          Share

                     Share

                                  Share

                                              Share

                                                         Share

                                                                      Share

                                                                                  Share

                                                                                             Share

                                                                                                          Share
          action

                                              action

                                                                                  action
                                  ed

                                                                      ed

                                                                                                          ed
AT        81%         19%           -            87%       15%           -        89%          13%           -
BE                                                             n.a.
BG       100%            -          -         100%             -         -        100%           -           -
CZ       100%            -          -         100%             -         -        99%            -           -
CY        28%            -        72%            55%           -       45%        100%           -           -
DE        94%         31%           -         113%             -         -        120%           -           -
DK        50%         50%           -            50%       50%           -        50%          50%           -
EE       100%            -          -            88%       12%           -        89%          3%            -
EL       100%            -          -         100%             -         -        100%           -           -
ES       113%            -          -         100%             -         -        100%           -           -
FI          -         100%          -             -       100%           -          -            -        100%
FR       100%            -          -         100%             -         -        100%           -           -
HR                                        n.a.                                    75%            -        25%
HU       101%            -          -         100%             -         -        90%          10%           -
IE       100%            -          -            7%        93%           -                     n.a.
IT       100%            -          -            46%       54%           -        23%          77%           -
LT       100%            -          -         100%             -         -        98%          2%            -
LU        50%         50%           -            50%       50%           -         n.a.        n.a.        n.a.
LV       100%            -          -         100%             -         -        100%           -           -
NL          -            -        100%            -            -      100%          -            -        100%
MT       100%            -          -         100%             -         -        100%           -           -
PL       100%            -          -         100%             -         -        100%           -           -
PT        97%          3%           -            96%       5%            -        96%          13%           -
RO       100%            -          -            69%       0%          31%        22%            -        78%
SE        50%          0%         50%            0%       100%           -        30%          28%        42%
SI        51%          0%         49%         110%             -         -        64%            -           -
SK       100%            -          -         100%             -         -        100%           -           -
UK        61%         39%           -            82%       18%           -        98%          2%            -
EU28      87%         16%          5%            87%       11%          6%        87%          7%         11%
Source: based on Member States reporting under the MMR (EIONET 2016).
Current use of EU ETS auctioning revenues and reform options 24
3.3.3. What actions were financed with the auctioning revenues?
According to the ETS Directive, climate change actions include:
Domestic actions that reduce greenhouse gas emissions, such as the development of
renewable energies, the development of technologies required to increase energy efficiency, the
development of carbon dioxide capture and storage (CCS), measures to increase energy
efficiency in households and industry covered by the EU ETS, measures to shift to low-emission
and public transport, funding for aeronautics and air transport research and development, and
measures to enhance forestry sequestration. Also included are actions in the field of climate
change adaptation, such as research and development or demonstration of adaptation efforts.
Covering the costs of administering the ETS also counts as a domestic action.
International actions to reduce greenhouse gas emissions and fund adaptation to climate
change include avoiding deforestation and increasing afforestation and reforestation. Transfer of
low-carbon technologies and support for CCS also counts, as do contributions to international
funds like the Global Energy Efficiency and Renewable Energy Fund (GEEREF), the Adaptation
Fund, the Special Climate Change Fund (SCCF), the Green Climate Fund under the UNFCCC,
and the Least Developed Countries Fund.
For the purposes of presenting the data provided by Member States in this report, the following
categories were defined to distinguish between different types of domestic actions:
Cross-cutting actions including more than one type of action (e.g. a fund that finances
mitigation and adaptation action)
Renewable energy (RES)
Energy efficiency (EnEf)
Renewable energy and energy efficiency
Carbon Capture and Storage (CCS)
Transport
Forestry
Agriculture, including carbon sequestration in soils
Adaptation
Research, innovation and demonstration (R&D)
Covering administration costs of the ETS
Other actions (those programmes where Member States do not provide enough details)
and unspecified actions
For international actions, the level of detail is limited. Therefore the data provided by Member
States is represented in the following, smaller set of types of actions:
Cross-cutting actions including more than one type of action
Mitigation (i.e. the reduction of greenhouse gas emissions),
Adaptation
Domestic climate actions
Member States spent most of their auctioning revenues on domestic actions that were cross-
cutting (39% of revenues spent for domestic actions over the reporting period), followed by
renewable energies (32%) and energy efficiency (18%). There are rather small changes in the
distribution of funds for the different activities if compared over the period (see Figure 6). While
the share of cross-cutting actions stayed at almost 40% over the period, the share of renewableYou can also read