MASTER OF SCIENCE IN MASTERS FINAL WORK - CORTICEIRA AMORIM S.G.P.S., SA: VERTICAL AND HORIZONTAL INTEGRATION - UTL Repository
←
→
Page content transcription
If your browser does not render page correctly, please read the page content below
MASTER OF SCIENCE IN
 FINANCE

 MASTERS FINAL WORK
 PROJECT

 EQUITY RESEARCH:
 CORTICEIRA AMORIM S.G.P.S., SA:

VERTICAL AND HORIZONTAL INTEGRATION

 ŽARKO LJUBENOVIĆ

 OCTOBER 2019
MASTER OF SCIENCE IN
 FINANCE

 MASTERS FINAL WORK
 PROJECT

 EQUITY RESEARCH:
 CORTICEIRA AMORIM S.G.P.S., SA:

VERTICAL AND HORIZONTAL INTEGRATION

 ŽARKO LJUBENOVIĆ

 SUPERVISOR:
 VICTOR MAURÍLIO SILVA BARROS

 OCTOBER 2019
Abstract

This project consists of an Equity Research Report on Corticeira Amorim SGPS
SA. It contains extensive financial analysis on the company with a special
emphasis on the industry’s landscape and the M&A opportunities available to the
company and its competitors. This report follows the format recommended by the
CFA Institute and is based on the publicly available information until the 15th of
January 2019.
The company was chosen by the CFA society Portugal for the CFA Research
Challenge 2019.
Corticeira Amorim, one of the biggest Portuguese companies, is the world’s
largest cork stoppers producer. It dominates the market with 44% of the global
market share. The company is diversified within the cork industry as it produces
besides stoppers the floor and wall coverings, insulation, and composites.
We issue a buy recommendation with the price target of €10.9/sh and upside
potential of +21% from December 31st, 2018 closing price. To reach our price
target we used the Discounted Cash Flow (DCF) approach, as it is a mature
company with a stable cash flow stream. As the main model, we used the Free
Cash Flow to Firm (FCFF). Additionally, to complement our analysis we used the
Free Cash Flow to Equity (FCFE) and the Dividend Discount Model (DDM). In
our analysis, we did not rely on a relative valuation as there is only one listed
peer.
The main risks to our recommendation are the change in wine consumption (on
the demand side) and the availability of cork (on the supply side). In addition, we
extensively researched the risk that could come from further consolidation in the
market and we offered our analysis for that scenario.

JEL classification: G10; G32; G34;
Keywords: Equity Research; Valuation; Mergers & Acquisitions; DCF; Cork
stoppers

 i
Resumo

O presente projecto consiste numa avaliação da Corticeira Amorim SGPS SA.
Este contém uma análise financeira detalhada da empresa, focando-se ainda na
indústria e nas oportunidades de M&A para a Corticeira Amorim e os seus
concorrentes. Este relatório segue o formato recomendado pelo CFA Institute e
considera apenas informação pública disponibilizada até 15 de Janeiro de 2019.

A empresa em questão foi selecionada pela CFA Society Portugal no âmbito do
CFA Research Challenge 2019.

A Corticeira Amorim, uma das maiores empresas em Portugal, é a maior
produtora de rolhas de cortiça a nível mundial. A empresa domina a indústria
com uma quota de mercado de 44%, produzindo, não só rolhas de cortiça, mas
também revestimentos, aglomerados compósitos e isolamento de cortiça.

Da nossa análise resulta uma recomendação de COMPRA com um preço-alvo
de €10.9/ação, correspondente a um potencial de valorização de +21% face à
cotação de 31 de Dezembro de 2018. Para avaliar a Corticeira Amorim foi
utilizado o método de Fluxos de Caixa Descontados (DCF), uma vez que se trata
de uma empresa matura com fluxos de caixa estáveis. O principal modelo
utilizado foi o Free Cashflow to the Firm (FCFF). Como complemento à nossa
análise, foram ainda utilizados os modelos Free Cash Flow to Equity (FCFE) e
Dividend Discount Model (DDM). Dado que só existe uma empresa pública
comparável, não foi feita uma avaliação através de múltiplos.

Os principais riscos para a nossa recomendação são relativos às possíveis
mudanças no consumo de vinho e à não existência de cortiça suficiente para os
produtores. Adicionalmente, foi analisado o risco que advém de um cenário de
maior consolidação do mercado.

Classificação JEL: G10; G32; G34;
Palavras-chave: Avaliação de Empresas; Fusões e Aquisições; Fluxo de Caixa
Descontado; Rolhas de cortiça

 ii
Acknowledgements

To Joana, Filipa, Carolina, and Joana,
Most of us started this journey just as colleagues from the Master, but we are
ending it as friends. It seems some of those “unproductive” hours we spent in the
“CFA room” were not for nothing. And we made quite a decent report along the
way. Now, I have four new reasons to come to Portugal. Not just for the weather.

To Clara and Victor,
I am thankful for all the knowledge you gave me during the Master’s. Above that,
your energy and dedication were, and still are, very inspiring. Thank you for all of
the positivity that you spread.

To my family,
When nothing seems to work, the only place you can always go to is your family.
I consider myself privileged to have that place.

To Marina,
I feel enormously lucky that I found you. You are my stronghold and my biggest
support. Thank you for being always there for me.

 iii
Disclosure
A significant portion of this report was submitted by a group of students from
ISEG, including the candidate, for the 2019 CFA Institute Research Challenge
Portuguese Local Final. Upon winning the local final, the same report advanced
as the representative report for CFA Society Portugal in the 2019 EMEA Regional
Final in Zurich, Switzerland.

This report is published for educational purposes by Master students at ISEG and
is not an investment recommendation. This report must be read with the
Disclosures and Disclaimer. Appendices that support this report may be obtained
from the author upon request.

 iv
Index

Abstract .................................................................................................................i
Resumo ................................................................................................................ii
Acknowledgements .............................................................................................iii
Disclosure………………………………………………………………………………iv
Index ....................................................................................................................v
List of figures .......................................................................................................vi
List of tables.......................................................................................................viii
Research Snapshot .............................................................................................1
Business Description ...........................................................................................2
Corporate Governance ........................................................................................3
Industry Overview and Competitive Positioning...................................................4
Investment Summary ...........................................................................................7
Valuation ..............................................................................................................8
Financial Analysis ................................................................................................9
Investment Risks................................................................................................10
How to grow: Threats and possibilities with M&A activities ...............................11
Appendices ........................................................................................................13
References.........................................................................................................32
Disclosures and Disclaimer................................................................................33

 v
List of Figures

Figure 1: COR’s Price Target..............................................................................1
Figure 2: Market share in the cork stoppers industry 2017YE .............................1
Figure 3: Consolidated sales by BU 2018F (inside) vs 2023F (outside)..............2
Figure 4: Consolidated sales by region 2017YE..................................................2
Figure 5: EBITDA contribution by BU ..................................................................2
Figure 6: Sales vs EBITDA (in millions) ...............................................................2
Figure 7: Average selling price of the highest quality cork amadia (€/@)............3
Figure 8: No. of cork stoppers sold by top 3 companies (in billions) 2017YE......3
Figure 9: Avg. annual TCA detection (%) ............................................................3
Figure 10: Shareholder’s Structure ......................................................................3
Figure 11: Location of the cork oak forestry.........................................................4
Figure 12: Uses of cork bark...............................................................................4
Figure 13: Wine closures market (in billion units) ...............................................4
Figure 14: GDP vs Household Disposable Income (HDI) vs Wine Consumption
in the US ..............................................................................................................5
Figure 15: Wine consumption in 2017 (in mhl) ...................................................5
Figure 16: Top 4 wine producing countries in 2017 (in mhl) ...............................5
Figure 17: Wine consumption vs wine production (in mhl) .................................5
Figure 18: Risk of fires in Portugal vs Location of Montados..............................6
Figure 19: Average extraction costs per year (€/@) ...........................................6
Figure 20: Porter’s Five Forces...........................................................................6
Figure 21: Bottled wine price breakdown by type of wine, in the UK ..................6
Figure 22: Evolution of COGS and price of cork bark.........................................7
Figure 23: COR’s avg. selling price per stopper vs avg. cost per stopper ..........7
Figure 24: Net Debt vs EBITDA (in millions).......................................................7
Figure 25: Total CAPEX vs Sales .......................................................................7
Figure 26: Dividend vs FCF (in millions) .............................................................9
Figure 27: DPS vs Payout ratio...........................................................................9
Figure 28: Interest Coverage Ratio vs EBIT (in millions) ....................................9
Figure 29: Gross Debt vs EBITDA (in millions)...................................................9
Figure 30: Risk Matrix ........................................................................................10
Figure 31: Average annual temperature in Portugal by season.........................10

 vi
Figure 32: COR’s market share evolution..........................................................11
Figure 33: The most recent COR’s acquisitions (2017 and 2018) .....................11
Figure 34: Market share in the cork stoppers industry after possible M&A between
OENEO and M.A. Silva......................................................................................11

 vii
List of Tables

Table 1: COR’s market data ................................................................................1
Table 2: Impact on COR’s Price Target from change in worldwide wine
consumption CAGR .............................................................................................1
Table 3: COR’s trading data ................................................................................4
Table 4: Wine consumption by type of packaging ...............................................5
Table 5: COR's recent M&A activity.....................................................................6
Table 6: COR’s Enterprise Value.........................................................................8
Table 7: EV contribution per BU ..........................................................................8
Table 8: COR’s Price Target................................................................................8
Table 9: COR’s WACC ........................................................................................8
Table 10: COR’s liquidity ratios............................................................................9
Table 11: Sensitivity analysis for the arroba price .............................................10
Table 12: Sensitivity analysis for the Terminal Growth Rate .............................10
Table 13: Monte Carlo Simulation......................................................................10
Table 14: Herfindahl-Hirschman Index in the stoppers industry ........................11
Table 15: Herfindahl-Hirschman Index in the cork stoppers industry ................11
Table 16: Synergies in the possible M&A between OENEO and M.A. Silva .....11
Table 17: TP after possible M&A between OENEO and M.A. Silva ..................12
Table 18: TP after possible cork oak forest acquisition, financed with debt ......12
Table 19: Cork oak forest area and production per country...............................12
Table 20: WACC calculation with 30% debt in the capital structure ..................12

 viii
Forest & Wood Products - Cork
 Portuguese Stock Exchange (PSI)
 Corticeira Amorim S.G.P.S., SA

Date: 31/12/2018 Current Price: 9.00 Recommendation: BUY (21% Upside) Medium-Risk
Ticker: COR.LS (Bloomberg) EUR 1.000: USD 1.145 Price Target: EUR 10.9 (USD 12.48) 2019YE

Table 1: COR’s market data

 Closing price (December 31st)
 Market Profile
 € 9.0
 COR: Mature, solid, and adaptable
 52-week price range €8.4-€12.0
 Average daily volume 57,838 15,00
 Shares outstanding 133M +21% UPSIDE EUR 10,9
 13,00
 Market Capitalization 1.2B
 Free float 25.1% 11,00
 Dividend yield(2018F) 2.4%
 9,00
Source: Reuters
 EUR 9,0
 7,00
Figure 1: COR’s Price Target
 5,00
 Closing Price 9,0 €
 3,00
 FCFF 10,9 €

 DDM 10,6 €

 FCFE 10,8 €

 Residual Income 9,7 €
 We issue a BUY recommendation for Corticeira Amorim S.G.P.S., SA (COR) with a price target of €10.9/sh for
 2019YE using a DCF model, implying a 21% upside potential from the December 31 st, 2018 closing price of
 Avg. P ratios** 9,2 €
 €9.00/sh, with medium-risk. COR is a mature company with a dominant market position of 44% in the cork
 Avg. EV ratios* 9,8 € stoppers business worldwide. The company has been recovering from tough years in the supply side, with raw
 material prices rising 24.4% in the last two years. The company adapted to these market changes by anticipating
* EV/Sales; EV/EBITDA purchases of cork mostly for the stoppers’ division. COR also engaged in M&A activity to increase capacity, to
** P/B; PE; P/Sales enhance market share and to consolidate new markets. The upsurge in wine consumption, especially from
Closing price: December 31st, 2018 premium wines, should position COR in a track of steady growth in the coming years, allowing an attractive
 dividend.
Source: Team estimates
 Leading the game, setting the rules. COR is the undisputed leading provider of cork stoppers worldwide with a
 44% market share, benefiting from having 34% of the cork oak forestry located in Portugal. The company is a
Figure 2: Market share in the cork
 price setter which is reflected in the stability of margins in the cork stoppers division. COR’s size and longstanding
stoppers industry 2017YE
 relations with suppliers yield a competitive edge in the race for limited resources. Hence, high barriers to entry
 lead us to expect many additional years of COR dominance ahead.

 32% Steady growth and stable margins. COR’s sales growth at 4.4% CAGR during 2018-23 should be fueled by three
 43% main factors, namely: increasing consumer preferences towards cork-sealed wines; trends for premium wines
 that require higher quality stoppers; and the enlargement of the population base, boosted by a growing
 middle-class. Wine consumption worldwide is COR’s main revenue driver with an expected growth of 3.2% CAGR
 5% 2017-23. The increase in consumption of premium wines will raise the average selling price of cork stoppers by
 20%
 +1.0% CAGR from 2019-23, and together with increases in the global drinking age population should set growth
 COR OENEO for sales at 4.4% CAGR. China will play a role in this field, and recent trade wars are not expected to jeopardize
 M.A.Silva Others COR’s prospects in the medium-term. Yet, deviations from wine consumption forecasts are not likely to change
 COR’s value.
Source: COR (2017) & OENEO (2017)
 The price of raw materials skyrocketed +24.4% in 2016 to 2018 due to gaps in the harvesting cycle. Our research
 point that local producers forecast a decrease of ~10% in price to further stabilize around €33 per arroba (~15kg
Table 2: Impact on COR’s Price Target cork bark). The stabilization should drive gross margins up, recovering at ~51.5% from 2020F onwards. EBITDA
from change in worldwide wine margin will restore to 18%-19%, enabling a steady cash flow generation. COR’s strong cash from operations
consumption CAGR (€110M-€130M) will comfortably cover anticipated CAPEX and the growing dividend policy. We expect a DPS up
 Price Target to €0.5 in 2023F with an average payout ratio of 69.5% 2019-23.
 € 10.9
 -2.00% € 7.7
 Mature, solid, and adaptable. During the late 1990s, COR’s existence was put to the test due to the rising ‘’tainted
 -1.00% € 8.1
 Wine Consumption CAGR

 0.00% € 8.5 wine’’ issue. In those years, alternative closures emerged, pushing cork industry to its knees. The cork industry
 0.50% € 8.8 for closures tumbled from ~90% to ~60% market share, threatened to be overthrown by synthetic/plastic
 1.00% € 9.1 stoppers and screwcaps. However, the bad years in tainted wine by cork appear to be gone for good. COR’s
 1.50% € 9.4 investments in innovation (~€7.5M/year) offered the solution that dispelled dark clouds away and molded the
 2.00% € 9.8 company that we know today – mature, solid, and adaptable.
 2.50% € 10.2
 3.00% € 10.6 Beyond organic growth. Cork stoppers industry is divided between COR and OENEO, thus there are not so many
 3.23% € 10.9
 targets left out there. However, we see one potential target in the market, M.A. Silva. That acquisition would bring
 3.50% € 11.1
 4.00% € 11.7 equal joy to both possible acquirers. They could extract much the same synergies from the deal (€60M-€70M),
 due to the similar post-deal EBITDA margin convergence (∼13 pp) in the target company.
Source: Team estimates

 1
Figure 3: Consolidated sales by BU 2018F
(inside) vs 2023F (outside) Business Description
 Raw 1,3% 1,3%
 Corticeira Amorim SGPS SA (COR) is a Portuguese cork manufacturer, primarily focused on the production of cork
 Materials
 1,3% stoppers. Founded in 1870 as a family business, the group has maintained its core vision throughout the years of
 10,8%
 Cork adding value to cork in a sustainable and innovative way. COR has been the global market leader in this industry
 Stoppers 12,3% during roughly the last 148 years, and by 2018F sold 5.7B units of cork stoppers, accounting for 44% of the
 13,1% worldwide market for cork stoppers.
 Floor & 14,6% 1,4%
 Wall The cork manufacturing business started in 1870 with the production of cork stoppers, which to this day still
 Coverings 70,4% represents the main engine of profitability and growth for COR. By 1935, the company initiated its vertical
 Composite
 73,5% integration strategy, eliminating upstream suppliers by purchasing the raw material itself and transforming it
 Cork
 into usable cork. In the 1970s, COR opened its first factory dedicated to floor and wall coverings, thus entering
 Insulation the construction sector. The company first issued shares in 1988. Currently, COR is divided into 5 business units
 Cork (BUs) – Raw Materials (1.6% 2017YE Sales), Cork Stoppers (67.3%), Floor and Wall Coverings (16.8%),
 Composite Cork (12.9%) and Insulation Cork (1.4%). COR sees its international expansion as a leading strategy,
 as exports represented 95% of 2017YE sales.
Source: Team estimates
 COR has performed several acquisitions throughout its history. In 1989, it acquired the Swedish Wicanders, a
 company in the coverings industry. This acquisition allowed the diversification of the coverings’ portfolio,
Figure 4: Consolidated sales by region through a premium and innovative brand, and to expand the BUs distribution channels. Wicanders has a strong
2017YE presence in over 70 countries, particularly in central and northern Europe, allowing a higher penetration of COR’s
 products in these markets. More recently, in 2017, COR acquired 60% of French group Bourrassé, the third largest
 EU
 cork stopper manufacturer in the world (700M units in 2017) (Figure 8) and agreed to acquire the remaining
 40% in 2022. Bourrassé operates mainly in France, the world’s second largest wine consumer (16%) and
 USA
 producer (14.6%) and has high brand recognition in the country. Additionally, Bourrassé has subsidiaries in
 Rest of
 Portugal and in Chile, enabling COR to extend its facilities in Portugal and to strengthen its businesses in Latin
 America 7,20% America. In 2017 COR also acquired the French Sodiliège dedicated to stoppers for spirits, and in 2018 the
 Asia-Pacific 56,80% portfolio was expanded with the acquisition of the former Swedish supplier Elfverson.
 18,50%
 Portugal In 2017, COR had total sales of €701.6M. Excluding the effect of the recent acquisitions of Sodiliège and Bourrassé,
 the company experienced +5.3% YoY organic growth to €675M. COR’s sales in 2017 were mainly concentrated in
 Rest of the EU region (62.5%), especially in the major wine consuming countries of France, Italy and Spain. The US market
 Europe represented 18.5% of consolidated sales, followed by the other American countries (7.2%) and Asia-Pacific
 Africa (5.9%) (Figure 4). The biggest markets for the Cork Stoppers BU were France (22%) and the USA (17%). COR is
 expected to generate €764.3M 2018F (+8.9% YoY) total sales but EBITDA will grow -0.3% with margin at 17.4%.
 This decrease in margins results from the incorporation of higher-priced raw materials purchased in 2017.
Source: COR (2017) However, trends per BU are not the same (Figure 5).

 The Cork Stoppers BU sales are expected to represent 70.1% of consolidated sales 2018F, growing +12.3% YoY,
Figure 5: EBITDA contribution by BU which translates into 5.7B stoppers sold. Additionally, COR intends to invest between €30-35M in CAPEX to
 100%
 extend the current capacity of the Cork Stoppers BU, as it currently operates at full capacity. The 2017 and 2018
 acquisitions already adjusted capacity up. The Raw Materials BU has the mission of guaranteeing the supply of
 75% cork to other BUs while assuring the preservation and sustainability of cork oak forests. About 95% of sales are
 to other BUs. Starting in 2017, as a way of diminishing the exposure to the secondary market, COR’s managers
 50% decided to increase purchases of cork bark to internalize more production.
 25% The Floor and Wall Coverings BU is expected to contribute to 14.8% of 2018F sales (-7.1% YoY). Among the main
 0% markets of this BU, Germany and Scandinavia are growing the most, while the US is experiencing a slowdown.
 2018F 2023F EBITDA margin is expected to decrease to 2.9% due to the aforementioned underperformance of sales, although
 -25% growing in the period 2019-2023 from 6.7% to 11.2%. Currently, the BU is operating at 80% of capacity.
 Holding&Adjustment
 Insulation The Composite Cork BU with 13.4% of 2018F sales, EBITDA margin of 10.0% and contribution to 7.7% of COR’s
 Composites consolidated EBITDA, focuses on reusing the waste produced by the Cork Stoppers BU, creating innovative
 Floor & Walls products for 25 different industries. Our 2018F sales forecast reflects an increase in sales of 4.0% YoY. The
 Cork Stoppers
 Insulation Cork BU has the second smallest contribution to COR’s sales, at 1.5% of 2018F sales, representing 0.8%
Source: Team estimates of consolidated EBITDA. The segment produces both thermal and acoustic cork agglomerate insulation, known
 for its high quality and natural properties. Sales are expected to increase +9.1% YoY, following the recovery of
 the construction industry.
Figure 6: Sales vs EBITDA (in millions) In October 2018, COR announced the acquisition of its first forest property (Herdade da Baliza), with 2,866
 hectares, in Castelo Branco, in the east of Portugal. The acquisition totaled €5.5M and is part of the Forestry
 1.000 20% Intervention Project – a long-term program aiming to assure the valorization, maintenance and preservation of
 800 15% cork-oak forestry in Portugal. In this property, COR will plant cork oak trees using the micro-irrigation and
 600 fertilization system and will function as a showcase for landowners to convince them to plant cork oak trees.
 10%
 400 Future acquisitions of forest property are not expected, as it would lower COR’s return on invested capital.
 200 5%
 - 0% Key drivers of profitability
 Consumption of bottled wine drives the bulk of demand for cork stoppers, as 65% of wine bottles worldwide are
 sealed with this type of closure. Wine consumption towards premium wines should increase the average selling
 price of cork stoppers and growth in population, especially in Asia, will demand higher volumes.
 Sales (LHS)
 Cork bark is the main input of the business. The raw material is harvested from cork oak trees, located exclusively
 EBITDA (LHS)
 in the Mediterranean basin. Each tree needs to grow for 43 years until it produces the amadia cork, used for cork
 EBITDA margin (RHS) stoppers. Harvesting cycles of 9 years have driven prices of cork bark up over the last 2 years (+9.7% 2017,
 +13.4% 2018) due to scarceness of resources (Figure 7). This trend should not persist, as cork prices are expected
Source: COR (2017) and team estimates to decrease 10% in 2019F and stabilize from 2021F onwards, as more cork oaks will be available for harvesting.
 Trends in construction drive the other BUs of COR. The ongoing recovery from the financial crisis will ferment
 the growth in the other segments of the company, especially for the Floor & Wall Coverings BU and Insulation BU.

 2
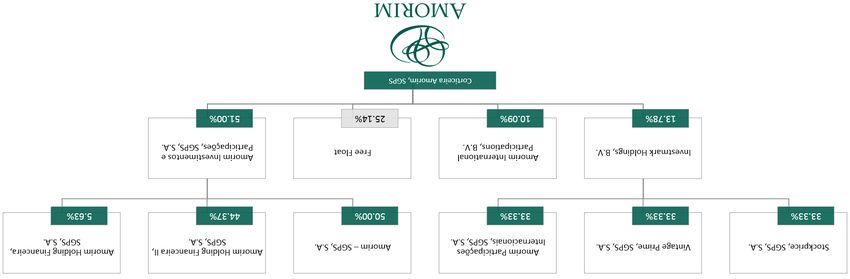
Figure 7: Average selling price of the Company strategies
highest quality cork amadia (€/@) R&D+I as a way of improving efficiency
 By 2017YE, the average annual investment in R&D totaled ~€7.5M, and this level of investment is expected to
 40 continue. R&D+I has been a key differentiation point for COR in the diversification and improvement of its
 35 products, yielding a clear competitive advantage over its peers. COR’s Rosa ® Mechanism is one example.
 30 Implemented at an industrial level in 2007, the mechanism was the main driver for the Cork Stoppers BU recovery
 25
 following the entrance of screwcaps and synthetic stoppers during the 2000s. The mechanism detects the
 presence of Trichloroanisole (TCA – a naturally occurring fungus present in cork) on a batch of stoppers and
 20
 allows the removal of the contaminated stoppers from the production. More recently, COR developed NDTech
 15 technology, a complement to Rosa ® Mechanism. NDTech enables individual quality control on cork stoppers,
 10 reducing the analysis time by 90%. It is fast, it is reliable, and results in material improvements to the final
 5 product. The first stage of TCA-free cork stoppers (below 0.5 nanograms/liter) was primarily directed at premium
 0 wines, yet plans are to expand to other wine segments. COR expected a high acceptance of the product, yet
 estimated sales of 50M units for 2018YE are still not significant for the overall BU results (less than 1%
 contribution).

Source: UNAC (2018) and team estimates Vertical and Horizontal Integration
 Over the last 17 years, COR has been active in M&A with 11 target companies from all over the world (Table 5).
 Almost all these companies’ businesses belonged to the cork stoppers industry, although a few were related to
 coverings. Through these acquisitions, COR augmented its production capacity and reinforced its presence in
 several markets, by simultaneously decreasing direct competition. Currently, the company is running at full
Figure 8: No. of cork stoppers sold by top capacity on its closures segment. Around 70% of COR’s sales can be attributed to its own distribution channels.
3 companies (in billions) 2017YE Therefore, the company controls the entire value chain from the manufacturing of cork, to the transportation and
 delivery to final consumers. This allows continuous quality control and direct contact with the final consumer,
 improving the image of the company and excellence of its products. Nevertheless, COR is highly dependent on
 COR 4,7
 cork availability and its suppliers.
 Diam 1,8
 Shareholder Structure
 Piedade 0,7 COR is a family-owned company, with the Amorim family controlling indirectly almost 75% of voting rights, with
 Bourrassé 0,7 free-float at 25.14% as of 2016. To remain in compliance with the maximum percentage of voting rights allowed
 MA Silva
 by the Portuguese Competition Authority (Article 20 of the Portuguese Securities Code - 25%), the ~75% of
 0,6
 shares belonging to the Amorim family are dispersed through three companies: (1) Amorim Investimentos &
 M.A.Silva
 MA Silva Group
 Participações SGPS SA (51%) through Amorim SGPS, SA, Amorim Holding Financeira I SGPS, SA, and Amorim
 COR Group
 Bourrassé Holding Financeira II; (2) Investmark Holdings B.V. (13.78%) and (3) Amorim International Participations B.V.
 Piedade
 OENEO Group (10.09%) (Appendix 26). Historically, the Amorim family has always been present in COR’s governance
 committees, to ensure the protection of the family’s best interests. Moreover, there is no activist shareholder.
Note: Total market 12.5bn 2017YE
Source: COR (2017) & OENEO (2017) Over the last 4 years, the shareholder structure has undergone some important changes. During September 2015,
 the company added shares to its free float by selling treasury stock, through a Seasoned Equity Offering. The aim
 was to increase liquidity and the proceeds were distributed as dividends. By 2016, Amorim International
Figure 9: Avg. annual TCA detection (%) Participations B.V. and Investmark Holdings launched a private sale offer of 5% of their participation, adding 10%
 to the free-float. This rise in free float increased the volume of transactions, which consequently impacted the
 4,5 share price (Table 3). On December 2017, Amorim Investimentos & Participações SGPS SA incorporated Amorim
 Capital SA, which is already fully controlled. According to 2018S1, the shareholder structure has since remained
 4
 unchanged. We do not foresee motivations from the family to find a buyer for the company because they use COR
 3,5 as a source of funding for diversification at the family level.
 3
 2,5 Corporate Governance
 2
 1,5 The company is 75% owned by the family Amorim and their members have been running it. Mr. António Amorim
 1 joined COR in 1989, having occupied several upper management positions within the Amorim Group before being
 0,5
 appointed as CEO and Chairman of the Board of Directors (BoD) in 2001. He holds a degree in International
 Commerce from the University of Birmingham. Mrs. Cristina Amorim Baptista, economist, serves as CFO and Vice
 2001
 2002
 2004
 2005
 2007
 2008
 2010
 2011
 2013
 2014
 2016
 2017

 Chairman of the Group, being also a non-executive member of the BoD.

Source: Cork Quality Council (2018) Board Structure and Remuneration Policy
 COR’s BoD is composed of 6 members, of whom 3 are non-executive, although it does not attempt to follow the
 Corporate Governance Code recommended by the Portuguese Securities Market Commission (CMVM) of
 including independent members in its structure. The company opted for having no independence in the BoD.
 Similar to the BoD, the Remuneration Committee is also entirely composed of non-independent members. The
Figure 10: Shareholder’s Structure remuneration policy consists of a fixed plus a variable component (only for executive BoD members) based on
 performance levels attained during the latest financial year. In further detail, such bonuses are determined
 according to the individual’s role on the current result, as well as its contribution to the medium/long-term
 economic sustainability goals of the organization. 2017 figures point to a fixed remuneration of €0.78M of the
 25%
 BoD, of which €0.23M correspond to a performance-based premium. Yet, the dividends received from indirect
 participations on COR’s shareholder structure have not been disclosed (Appendix 28).
 51%
 10% Corporate Governance
 COR follows the Reinforced Latin Governance model in which the controlling shareholder – family – elect the
 14% following corporate body members to 3-year office terms:

 - Board of Directors – 6 members whose main responsibility is the approval and implementation of
 Amorim Inv. & Part. SGPS SA
 management decisions at a strategic level;
 Investmark Holdings BV - Executive Committee – 3 members who implement decisions made by the BoD and manage the ordinary
 Amorim International Participations BV business activity of the company;
 Free Float - Supervisory Board – 4 members (3 incumbent, 1 alternate) that supervise the overall management, may
 dismiss directors in specific situations and monitor the independence of the Statutory Auditor;
Source: COR (2018)
 - Statutory Auditor - Ernst & Young ensures the truthful presentation of the financial reporting since 2017;

 3
Table 3: COR’s trading data - Remuneration Committee – 3 members who define the remuneration policy to be applied, none of which
 Avg daily belonging to the Amorim family.
 Avg closing
 volume
 price COR has been using CMVM Corporate Governance Recommendations as a benchmark to review its own model
 traded
 2013 9 630 2.04 € since 1999. Up to the moment, the company fully complies with 26 of the mentioned 43 recommendations. The
 lack of independence of the BoD and of the Remuneration Committee, along with the unclear remuneration policy,
 2014 14 211 2.85 € represents the main corporate governance risks that minority shareholders are exposed to. The
 2015 50 122 4.36 € one-share-one-vote policy does not jeopardize minority shareholders rights in the company by allowing them to
 participate in important decisions of the company. However, the family’s super-majority control prevents them
 2016 42 188 7.32 €
 from exercising a meaningful influence.
 2017 75 319 11.07 €
 Despite the concentration ownership and lack of independence of the executive team, we do not consider that
 2018 57 838 10.60 €
 COR is a poorly governed family firm. The company has been showing sustained growth, enhanced by the
Source: COR (2018) and Thomson Reuters management team’s expertise in the business. Additionally, COR is regularly distributing value to all investors
 through dividends. Our view is that family’s best interest is to have an active dividend policy while not
 jeopardizing COR’s potential to grow. The Amorim family owns a diversified portfolio of investments (e.g., 33.3%
 GALP with mkt value of €3.5B, 32.6% Estoril-Sol) (Appendix 20) that were accumulated in periods of strong cash
 flow distribution from the cork business. The apparent policy of distribution of dividends for diversification at
Figure 11: Location of the cork oak the family level is inadvertently also protecting minority interests.
forestry
 Social Responsibility
 Regarding Bloomberg’s ESG rating, COR’s score of 56.2 outperforms its peers’ average of 33.94. COR’s
 sustainability strategy meets 11 of the 17 Sustainable Development Goals (SDGs) proposed by the United Nations,
 reflecting the company’s continuous effort in combatting social, economic and environmental issues. Socially, the
 company is involved with a number of institutions dedicated to supporting local communities and those in need.
 Environmentally, COR has been actively committed to develop and promote the adoption of sustainability
 principles as well as forest management practices aimed at preserving the cork ecosystem and overall
 environment. The primary areas of concern are the reduction of CO 2 emissions and cork oak reforestation
 through the 2013 Forest Intervention Program. COR holds the Forest Stewardship Council Chain-of-Custody
 certification as well as several ISO certifications.

Source: APCOR (2018) Industry Overview and Competitive Positioning
 Cork industry and the Portuguese dominance
Figure 12: Uses of cork bark Cork oak trees provide bark for the cork industry in a sustainable process that does not require cutting the tree.
 The oak forestry is spread throughout the Mediterranean Basin (Figure 11), totaling an area of 2.2M hectares.
 5% About 34% of Mediterranean oaks are in Portugal, providing a competitive advantage for Portuguese players.
 Annual cork production worldwide is around 201.4 thousand tonnes, 50% of which originates in Portugal. From
 the total cork bark harvested, 40% is immediately used for natural cork stoppers, 30% is destined for disks and
 25% 40% blocks used in technical stoppers, while the rest are by-products (25%) and pieces (5%) (Figure 12).

 Natural cork stoppers are the priciest, ranging from €1 to €2/unit, as they are made from a single piece of cork.
 These serve as a sealing option mainly for still wines, being the preferred closure for premium wines. Technical
 stoppers are made from agglomerated (grinded) cork, being less expensive (starting at €0.02/unit) and directed
 30% for lower-priced wines. Around 70% of the production of cork is destined for the wine industry while the rest is
 divided between the construction sector (26%) and other cork products (4%) (APCOR, 2018). By 2017YE, the
 size of the world’s cork exports was close to €1.6B, with Portugal as the top exporter (62.4%), followed by Spain
 Stoppers Disks and blocks
 (18.6%) and France (5.1%).
 By-products Pieces
 The cork industry is very fragmented on a company level yet geographically concentrated, with 80% of the
Source: APCOR (2018) companies located in Portugal. However, the whole industry is dominated by the Portuguese company COR, with
 ~44% of global market share for cork stoppers, followed by the French OENEO, with around 20% of market share.
 Additionally, COR recently acquired the third player, Bourrassé, with a market share of 6%.

 The wine closures market
Figure 13: Wine closures market Wines bottles can be sealed with three types of closures: cork stoppers (natural and technical – 67.2% of wines),
(in billion units) plastic stoppers (8.6%) and screwcaps (24.2%). In 2017, the global wine market output added up to 18.6B bottles
 of wine, of which 12.5B were sealed with cork, 4.5B with screwcaps and 1.6B with plastic stoppers. (Figure 13)
 20
 Within the mentioned closures, cork stoppers are perceived as the highest quality option in countries with the
 15 highest wine consumption, being often associated with premium wines. Studies conducted by CTR Market
 Research (2017), have found that about 97% of consumers in China associate wines sealed with cork stoppers as
 10 having higher-quality, and the same conclusion was found in several other key markets (US – 97%, Spain – 95%,
 Italy – 86%, France – 83%). Consumers are willing to pay an average premium of 36% for cork-sealed wines over
 5 those with alternative closures. Screwcaps and plastic stoppers, on the other hand, consist of a more affordable
 and practical option, commonly used in cheaper wines and other alcoholic beverages.
 0
 During the 1990s, cork stoppers were the dominant choice for wine closures, with over 90% of market share.
 2004
 2006
 2008
 2010
 2012
 2014
 2016
 2018F
 2020F
 2022F

 However, concerns regarding TCA presence in cork stoppers and its negative impact on wines’ flavor and aroma
 started building up as 5% of all bottled wines sealed with cork were tainted (Figure 9). This led cork stoppers to
 Cork Stoppers lose market share during the first decade of the millennium in favor of alternative closures. Synthetic stoppers
 Plastic Stoppers and screwcaps took advantage and gained market share in the wine stoppers business, taking over 40-50% of
 Screw cap market share. The highest level of acceptance of screwcaps was found in Australia and New Zealand. Among the
 countries with the highest consumption of wine, the screwcaps acceptance was the highest in the UK (52% in
Source: APCOR (2018) and team 2013), Germany (47% in 2013) and USA (43% in 2013). Developments in TCA screening technology allowed the
estimates natural cork to regain winemakers’ trust, as nowadays only 0.5% of wines acquire the ‘corky’ flavor associated
 with TCA. Currently, cork stoppers account for close to 65% of the closures market for wine bottles, with high
 acceptance levels from both wine producers and the final consumer. There is no evidence regarding a new
 alternative closure to enter the market.
 4
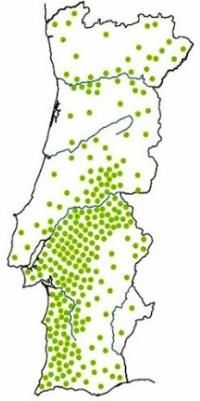
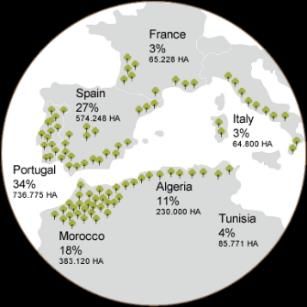
Figure 14: GDP vs Household Disposable Demand Drivers
Income (HDI) vs Wine Consumption in Economic Outlook
the US GDP per capita and Household Disposable Income (HDI) per capita are linked since consumption is a key factor
 for the growth of GDP. Historically, HDI and GDP had a positive correlation (Figure 14). Expansionary public
 80000 40 policies can influence the aggregated demand mainly through two mechanisms: (1) the cut of taxes; and (2) the
 60000 30 increase of government spending and a decrease of interest rates. The implementation of any of these policies
 40000 20 generates a positive impact in HDI. Global GDP is expected to grow +5.1% CAGR from 2018-23. China is expected
 20000 10 to grow the most with a 7.8% CAGR from 2018-23, while the US and Europe will follow behind at 3.8% and 3.9%,
 0 0 respectively (IMF , 2018). With the increased availability of income, the consumption of luxury goods rises. In the
 US, sales of luxury goods are expected to grow at 2% YoY, which includes fine and premium wines (SVB, 2018).
 2001
 2003
 2005
 2007
 2009
 2011
 2013
 2015
 In vino veritas
 GDP ($/capita) (LHS) Wine consumption is the main demand driver for the cork industry, with cork stoppers representing 70% of the
 industry. The value of the global wine market was USD 302.02B 2017YE, with an expected CAGR of +3.2% from
 HDI ($/capita) (LHS)
 2017-23 to about USD 423.59B by 2023YE (Shah, 2017). In 2017, the world’s wine consumption totaled 243 mhl,
 Total consumption in mhl (RHS) 65% of which was bottled wine (OIV , 2018). Almost 50% of the consumption can be linked to five countries – the
 USA, France, Italy, Germany and China (Figure 15). The consumption of wine decreased after the subprime crisis
Source: OIV (2017) & OECD (2019)
 but has stabilized since at around 241mhl. We expect an increase in consumption over the forecasted period as a
Figure 15: Wine consumption in 2017 result of the growing middle-class population. The middle-class has an increased availability of disposable income
(in mhl) (Kochhar, 2017), which is positively correlated to wine consumption. According to Kharas (2017), the global
 middle-class will grow at +4.6% CAGR from 2016-22, especially in China (+10.4% CAGR from 2016-22).
 US Additionally, consumers are shifting their preferences from lower-priced towards premium wines (see Appendix
 21 for more detailed information by region). For the cork stoppers industry this translates into a preference for
 France 32,6 natural cork stoppers.
 Italy 27 Unlike wine consumption, the production of wine is very unstable as it is very sensitive to weather conditions. In
 2017YE, global wine production decreased by 8.6% YoY mainly due to adverse temperatures in the EU, reaching
 Germany 122,7 historical lows. From the total wine production of 250mhl 2017YE, over 50% originated in four countries, which
 22,6
 also correspond to some of the leading countries in wine consumption – Italy (17.20%), France (16.45%), Spain
 China
 20,2 (14.50%) and the USA (8.48%) (Figure 16). Wine is an example of a product with constant demand but the
 17,9 production that is variable and tied to the harvest of grapes. The harvest is expected to recover during 2018,
 Rest of the
 World
 boosting wine production at +12% YoY 2018F. (OIV , 2018)

 Though production is heavily dependent on the harvest, historically, the production of wine always surpasses its
 consumption (Figure 17). For this reason, vineyards and winemakers estimate their sales of bottled wine based
Source: OIV (2017)
 on forecasted consumption. The excess production is used for industrial purposes, such as wine vinegar and
 distillations of wines. Therefore, we forecast orders for cork stoppers to follow a similar trend to that of wine
Figure 16: Top 4 wine producing consumption.
countries in 2017 (in mhl)
 Construction Industry
 The global construction industry amounted to USD 10.6T total sales at 2017YE and is expected to continue a
 recovery path during the 2018-2022 period. Increasing urbanization, improved economic conditions and growing
 US 23,3
 population will act as key drivers of growth, with a CAGR of +3.6% for the forecasted period and a total market
 value of USD 12.7 trillion by 2022YE (Global Data, 2018). Asia-Pacific should preserve its leading position, yet at
 Spain 32,5 a slower pace of growth due to the expected slowdown of the Chinese construction industry (see Appendix 22 for
 more detailed information per region).

 France Supply Outlook36,6
 Raw material Outlook
 The operations of the cork industry rely on the availability of this natural resource. To understand the level of
 Italy 42,5 uncertainty, we carried out a survey on the supply side (Appendix 25). The quantity of cork extracted is unstable
 since it depends on several factors, like extraction cycles and changes in weather conditions. Besides these
 concerning situations, cork oak trees are not considered to be endangered as the harvesting is controlled by the
Source: OIV (2017) cork industry and the Portuguese government to ensure its maintenance and continuity. For the past two years,
 the total amount of cork bark available for harvesting decreased, mainly due to unsmoothing of the 9-year
 harvesting cycles. Nevertheless, the harvest of cork bark is expected to ease during 2019, returning to previous
Figure 17: Wine consumption vs wine levels. Moreover, according to COR, there is enough cork to satisfy all demand for the following 100 years, if the
production (in mhl) total area of Montados does not decrease (APCOR, 2018).
 320
 Wildfires pose a problem for this industry as they delay the harvest of the burned trees. Even though these trees
 290 are highly resistant to elevated temperatures, due to their humidity content, the Portuguese government imposes
 some rules to assure their perseverance. According to Decreto Lei nº 155/2004, after being affected by fires cork
 260 oaks must recover for a minimum of one year before the harvest of the bark is allowed. However, the risk of fires
 is not significant in the main area of Montados (Figure 18). Another issue to be considered is climate change
 230 (Figure 31), especially the increase in droughts. The scarcity of water has a negative impact on the quality of cork
 barks, making the trees less resistant to diseases and consequently more prone to die. However, this effect might
 200
 be mitigated with the implementation of a micro-irrigation and fertilization system.
 170
 Cork price
 2000
 2002
 2004
 2006
 2008
 2010
 2012
 2014
 2016

 The price of cork bark is influenced by several factors. The type of cork will dictate its quality. Cork oak trees need
 to grow for 25 years before they start producing cork. The first harvest will yield virgin cork which is very hard
 Production Consumption
 to handle due to its irregularities. This cork is destined for applications other than stoppers and is the cheapest
 type of cork. After 9 years, the tree is ready for its second harvest. Secondary cork is softer and less irregular than
Source: OIV (2017)
 virgin cork, but still not suitable for cork stoppers. After the 3rd harvest, Mediterranean oaks produce the highest
Table 4: Wine consumption by type of quality cork, known as amadia or reproduction cork. The average price for amadia cork 2017YE was €33.51 per
 arroba (~15kg) (Figure 7).
packaging
 Type Volume The price of cork is also influenced by extraction costs. Extracting the bark of an oak tree is a highly specialized
 Bottled + sparkling 65% job and labor intensive. The process is completely dependent on human labor and is unlikely to be automatized.
 Bulk and >2L 35% Extraction costs at 2017YE totaled €4.37 per arroba (+4.3% YoY) (Figure 19). For COR, a rise in extraction costs
Source: OIV (2017)
 5
Figure 18: Risk of fires in Portugal vs would not hurt the company’s performance, because these can be passed to consumers through an improved
Location of Montados product mix.

 Finally, cork price is influenced by the big players in the industry, COR and OENEO. These companies are price
 setters, and smaller companies can only negotiate around the pre-defined value.

 Production Process and dependence on human labor
 The process of transforming cork bark into cylinder stoppers relies heavily on human labor. Cork oak trees are
 harvested between May and August. To remove the bark from the tree, harvesters carefully perforate the oak with
 the assistance of axes and remove the cork by hand. This is a highly specialized craft and takes years of experience
 to harvest the cork without damaging the tree. Cork bark is then transported to storage facilities where it is boiled,
 to increase softness and flexibility, and washed. Afterward, the cork is left outside to rest for 6 months to absorb
 humidity. After the 6-month rest, the cork is ready for processing. In factories, cork bark is cut into thick strips
 from which natural cork stoppers are produced. With the aid of a cutting machine, workers chose where to punch
 the cork, based on its pores, and manually identify and dispose of stoppers that fail to meet the quality
 requirements. Technical stoppers and other cork products are produced from the grinded cork that comes from
 the thin cork bark and from the natural cork stoppers’ production waste.
Source: ICNF (2017) & Árvores de
Portugal (2017) The heavy duty of punching the stoppers has already been automated, however this automation technique is still
 not fully utilized. Whereas one worker can produce, on average, 14,000 stoppers per day, the machine can more
Figure 19: Average extraction costs per
 than double this amount to 30,000 stoppers by working around the clock. Companies may feel compelled to invest
year (€/@)
 7,00
 in this machinery as these can run for 24 hours nonstop, which greatly increases output. Shortage of qualified
 labor force may also be a decisive factor, as the craft is becoming every year more obsolete.
 6,00
 5,00 Acquisition Activities
 Over the years, COR has made some important acquisitions which allowed them to reinforce their position in the
 4,00
 market (Table 5). More recently, the company acquired Bourrassé (2017), Sodiliège (2017) and Elfverson (2018).
 3,00 Bourrassé was considered the 3rd largest producer of cork stoppers in the world, with a well-known brand and
 2,00 high-quality products. The company had operations in France, Spain, Italy and Chile. Additionally, Bourrassé had
 1,00
 the loyalty of several important clients in the French market, constraining COR’s performance in this key market.
 With this acquisition, COR was able to reinforce its presence in France, which is now the most significant market
 0,00 for cork stoppers. Sodiliège, also a French-based company, was acquired by COR during 2017, with the goal of
 expanding the company’s portfolio to include high-quality personalized stoppers with bartops made from varied
 materials, like metal, glass and wood. In 2018, COR acquired 70% of the Swedish Elfverson to improve its spirits’
Source: UNAC - União da Floresta segment. Elfverson was a former supplier of COR, providing wood tops for the Cork Stoppers BU.
Mediterrânica (2018)
 COR does not expect to engage in M&A activities in the near future. However, future tactical acquisitions are not
Table 5: COR's recent M&A activity
 excluded by the company. If any smaller company with strong brand awareness and customer loyalty appears, it
 Year €M % Company
 may come through as an option for COR. Still, we do not expect any future M&A activity from the company. Yet, a
 2008 3.3 100 Cortex
 2008 7.1 25 US Floors possible acquisition between the 2nd and 3rd largest players could pose as a potential threat to COR’s leadership,
 2011 2.3 50 Corchos de Argentina since the combined company would have ~25% market share (see Appendix 23 for more detailed information).
 2012 15.1 91 Trefinos
 2017 3.0 100 Sodiliège Competitive Positioning
 2017 29.0 60 Bourrassé Although cork is a very versatile product, it is mainly used to seal wines (70%). The market for cork stoppers is
 2018 5.5 70 Elverson best described as a monopolistic competition with some oligopolistic features. The presence of many sellers does
 2022 19.0 40 Bourrassé* not restrain the pricing power of the two main players – COR and OENEO. Collectively, these two own over 60%
 * Financial obligation. See Appendix 10 of the market, primarily as a result of product differentiation strategies.
Source: COR (2017)
 Rivalry Among Existing Competitors
Figure 20: Porter’s Five Forces
 Within the cork industry, the rivalry between competitors varies significantly. Among smaller companies, the
 product offered is quite homogeneous because of low R&D investments. The small size prevents them from
 Threat of benefiting from economies of scale and having an advantage over pricing, which makes rivalry quite high.
 Substitutes Contrarily, COR and OENEO offer highly differentiated products. Their dimension allows them to be more
 5
 4 competitive and offer better, more specialized solutions for their clients. Both companies benefit from high brand
 Threat of 3 Bargaining recognition, competing mainly amongst themselves, yet COR has a clear advantage of having more than double
 New 2 Power of
 Entrants 1 Consumers
 OENEO’s market share (Figure 8). Overall, and considering the two main players own over 60% of the market,
 0 the existing rivalry is low although it is more intense between smaller players.

 Bargaining Threat of substitute products
 Rivalry Power of
 Suppliers
 Following the developments of the TCA screening technology, cork stoppers have been the unquestionable
 leaders in the wine closures market, with over 65% market share, followed by screwcaps and plastic stoppers.
 Still, screwcaps acceptance has been growing in some markets, especially in the UK and Australia. Nevertheless,
 Cork Stoppers
 around 90% of consumers prefer cork-sealed wines (APCOR, 2018). Furthermore, there is no evidence regarding
 Construction the appearance of new substitutes capable of cannibalizing the market share of cork stoppers.
Source: Team analysis
 Bargaining power of suppliers
Figure 21: Bottled wine price Cork suppliers are mostly small family-owned companies that possess cork oak forest and/or are in the business
breakdown by type of wine, in the UK of the cork oak extraction. Although cork oak forests are present only in the limited area of the Mediterranean
 basin, the power of the two dominant cork buyers (COR and OENEO) is so high that it often overwhelms the
 8 scarcity effect. Our analysis suggests that long-term contracts exist between main players and owners of Montados
 6 cork oak forests.
 4
 Bargaining power of customers
 2
 Packaging represents a small portion of the cost of a wine bottle (on average £0.36 in the UK in 2016) (Figure 21).
 0
 When deciding on the type of sealing option, wineries will consider both the price and the customers' preferences.
 5,00 5,39 10,00 20,00
 Therefore, switching costs are quite significant as, on average, 90% of consumers associate cork-sealed wines
 Money for wine Logistics
 with quality. Yet, cork stoppers producers face an elastic demand which narrows down their ability to increase
 prices. Wineries may opt for cheaper alternative closures if the price of cork is too high.
 Packaging VAT

 Exercise duty Total Margin

Source: Statista (2018) 6
You can also read