U.S. END MARKET ANALYSIS FOR KENYAN TEXTILE AND APPAREL - December 2017 - Agoa.info
←
→
Page content transcription
If your browser does not render page correctly, please read the page content below
U.S. END MARKET ANALYSIS FOR
KENYAN TEXTILE AND APPAREL
December 2017

DISCLAIMER The authors’ views expressed in this report do not necessarily reflect the views of the United States Agency for
International Development or the United States Government.
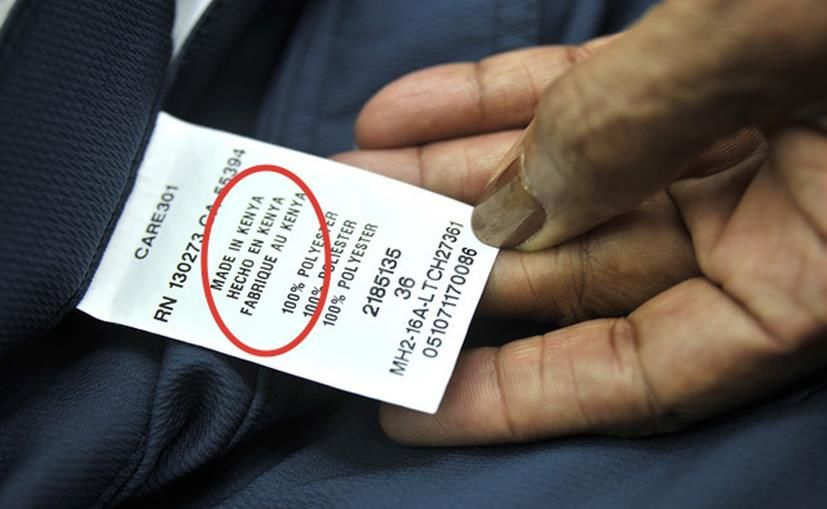
TABLE OF CONTENTS
ACRONYMS AND ABBREVIATIONS                                       IV
1.     EXECUTIVE SUMMARY                                          5
2.     TARGET PRODUCTS                                            6
3.     GENERAL CHARACTERISTICS OF THE U.S. MARKET FOR TARGET
       PRODUCTS                                                   7
4.     U.S. MARKET STRUCTURE, CHARACTERISTICS AND TRENDS         19
4.1 MARKET SIZE                                                  19
4.2 KENYAN EXPORTS TO THE U.S. ON BEST MATCHED CATEGORIES        21
4.3 MARKET SEGMENTS                                              25
4.4 MARKET TRENDS                                                26
4.5 MAIN BUYERS                                                  27
4.5.1 MASS MERCHANT                                              29
4.5.2 MASS APPAREL                                               29
4.5.3 PREMIUM APPAREL                                            30
4.5.4 LUXURY APPAREL                                             30
5.     U.S. TARIFF STRUCTURE                                     31
6.     U.S. NON-TARIFF STRUCTURE                                 32
6.1.   IMPORT REGULATIONS FOR TEXTILE AND APPAREL PRODUCTS       32
6.2.   AGOA RULES OF ORIGIN                                      33
6.3.   STANDARDS AND CERTIFICATIONS                              36
6.4.   PACKAGING AND LABELING                                    37
6.5.   CUSTOMS PROCEDURES                                        39
7.     U.S. DISTRIBUTION                                         40
7.1.   SUPPLIER SELECTION                                        40
7.2.   CONTRACT AND PAYMENT TERMS                                41
7.3.   DISTRIBUTION CHANNELS                                     41
7.4.   RETAIL CHANNELS                                           42
8.     SALES PROMOTION                                           44
8.1.   KEY TRADE FAIRS                                           44
8.1.1.   ALL-INCLUSIVE TRADE FAIRS                               44
8.1.2.   PRODUCT SPECIFIC AND LIFESTYLE TRADE FAIRS              44
8.2.   OTHER TRADE PROMOTION                                     47
9.     COMPETITION                                               49
9.1.   KEY COMPETITORS                                           49
9.2.   CRITICAL SUCCESS FACTORS AND PERFORMANCE ON EACH FACTOR   52
10.    RECOMMENDATIONS                                           59
10.1 SUGGESTED BUYERS                                            59
10.2 EXPORT STRATEGY – ACTION PLAN                               61

U.S. END MARKET ANALYSIS FOR TEXTILE AND APPAREL                      ii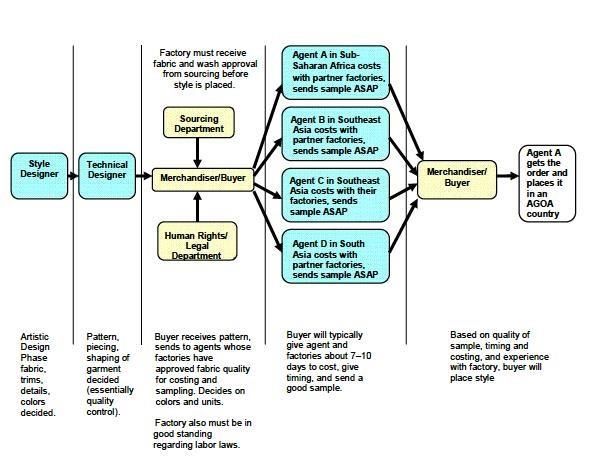
11.   APPAREL PROPOSED ACTION PLAN                 64
12.   FINAL SUMMARY STATEMENT                      67
APPENDIX I: WORKS CITED                            68
APPENDIX II. DATA AND INDUSTRY REFERENCES          69

U.S. END MARKET ANALYSIS FOR TEXTILE AND APPAREL        iii
ACRONYMS AND ABBREVIATIONS
AGOA           African Growth and Opportunity Act
ASTM           American Society for Testing and Materials
BoL            Bill of Lading
CAFTA          Central America Free Trade Agreement
CBP            Customs and Border Protection
CITA           Committee for the Implementation of Textile Agreements
CoC            Certificate of Conformity
CoO            Certificate of Origin
CPSC           Consumer Product Safety Commission
CPSIA          Consumer Product Safety Improvement Act
FTC            Federal Trade Commission
GCC            General Certificate of Conformity
GOTS           Global Organic Textile Standard
HTS            Harmonized Tariff Schedule
LDBC           Least Developed Beneficiary Countries
MOQ            Minimum Order Quantity
NAFTA          North American Free Trade Agreement
NRF            National Retail Federation
PNTR           Permanent Normal Trade Relations
PO             Purchase Order
QIZ            Qualifying Industrial Zone
RFID           Radio-Frequency Identification
RN             Registered Identification Number
SME            Small and Medium-Sized Enterprise
TPP            Trans-Pacific Partnership
TTIP           Transatlantic Trade Investment Partnership
UPC            Universal Product Code
U.S.           United States
USAID          United States Agency for International Development
WRAP           Worldwide Responsible Accredited Production

U.S. END MARKET ANALYSIS FOR TEXTILE AND APPAREL                        iv
1. EXECUTIVE SUMMARY
The apparel market in the United States (U.S.) is the largest in the world with a market value of $343
billion. In 2016, the U.S. imported apparel worth $105 billion, up from $88 billion in 2015 and $82 billion
in 2014.1 U.S. consumers spent $312 billion on apparel.
Ten countries account for almost 80 percent of all U.S. apparel imports with China topping the list with
a 30 percent share. While Kenya does not yet stand among these countries, there is an opportunity for
Kenya to take advantage of its trade preferences under the African Growth and Opportunity Act
(AGOA) to increase its exports to the U.S. market. Since AGOA was signed for an additional ten-year
term in 2015, there has been a growing trend toward sourcing and importing apparel to the U.S. If more
stakeholders in both countries realize AGOA’s full potential, Kenyan apparel exports can continue to
climb.
This report focuses on six target product opportunities for Kenyan exporters:
          A.   Knitted Shirts in Synthetics for all genders and ages
          B.   T-shirts in Cotton and Synthetic for all genders and ages
          C.   Sweaters in Synthetic for all genders and ages
          D.   Woven Pants and Shorts in Cotton and Synthetic for all genders and ages
          E.   Woven Shirts in Cotton and Synthetic for all genders and ages
          F.   Dresses for Women and Girls in Cotton and Synthetic as part of SME products
These products were determined by volumes and trends and are not unique to Kenyan production.
However, these products offer opportunities for large duty savings under AGOA. The report details the
channels of distribution, competition, potential buyers, promotional activities and a list of selected trade
fairs that could enhance Kenya’s ability to compete in the U.S. market.
Based on the identified constraints and challenges in Kenya and the U.S., the report offers
recommendations for increasing sector export competitiveness and proposes an action plan with
strategic sector objectives, actions, outputs and other items for implementation.
Critical take-aways include the following:
      •    Duty savings alone can be enough of a value add to entice U.S. buyers. Conversely, transport
           costs and other constraints could be a limiting factor. Therefore, reaching an advantageous
           goal for both the buyer and supplier requires working with each buyer, product and supplier
           to align parallel criteria on a case by case basis.
      •    AGOA has the potential to be an efficient process for Kenya’s private sector manufacturers
           once there is full understanding of the process. With training, certifications and logistics
           improvements, this process is bound to become increasingly more efficient.
      •    The U.S. buying community does not fully understand the benefits of AGOA. Kenya’s AGOA
           suppliers and spokespersons could play a role in educating the U.S. market and bring about
           new buyer linkages during trade shows.
      •    Although most of the target products in Section 2 are ready for export to the U.S., the best
           matched category list in Section 4.1 is recommended for promotion in the U.S. market, based
           on volumes and trends. Even dresses, which make up a lower trade volume, should be
           promoted as part of the Small and Medium Enterprises (SME) business in Kenya.

1As published by Office of Textiles and Apparel (OTEXA) under the International Trade Administration, U.S. Department of
Commerce.
U.S. END MARKET ANALYSIS FOR TEXTILE AND APPAREL                                                                           5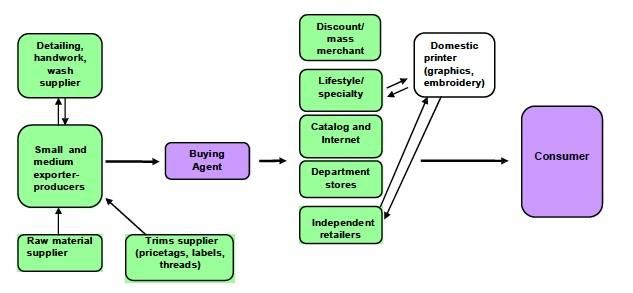
2. TARGET PRODUCTS
During the development of Kenya’s National AGOA Strategy and Action Plan, the Kenya Working
Group pre-selected knitted and woven garments, including tops, dress pants, jackets, shorts, jeans and
shirts as product targets. After a product analysis conducted during visits to selected in-country
suppliers, the following product categories were detailed by Harmonized Tariff Schedule (HTS) Code for
initial review.

 TABLE 1. HTS CODES FOR PRODUCT CATEGORIES

 HTS CODE HEADING            DUTY SAVINGS           DESCRIPTION
 6105.10                     19.7%                  Men & Boys, Shirts, Knitted, of Cotton
 6105.20                     32%                    Men & Boys, Shirts, Knitted, of Synthetic
 6106.10                     19.7%                  Women & Girls, Shirts, Knitted, of Cotton
 6106.20                     32%                    Women & Girls, Shirts, Knitted, of Synthetic
 6109.10                     16.5%                  T-shirts, Knitted, of Cotton
 6109.90                     32%                    T-shirts, Knitted, of Synthetic
 6110.20                     16.5%                  Sweaters (pullovers & cardigans), of Cotton
 6110.30                     32%                    Sweaters (pullovers & cardigans), of Synthetic
 6201.92                     6.2-9.4%               Men & Boys, Jackets/Outerwear, of Cotton
 6201.93                     7.1-27.7%              Men & Boys, Jackets /Outerwear, of Synthetic
 6202.92                     6.2-8.9%               Women & Girls, Jackets /Outerwear, of Cotton
 6202.93                     7.1-27.7%              Women & Girls, Jackets /Outerwear, of Synthetic
 6203.42                     16.6%                  Men & Boys, Trousers/Shorts, Woven, of Cotton
 6203.43                     27.9%                  Men & Boys, Trousers/Shorts, Woven, of Synthetic
 6204.62                     16.6%                  Women & Girls, Shorts & Trousers, Woven, of Cotton
 6204.63                     28.6%                  Women/Girls, Shorts & Trousers, Woven, of Synthetic
 6205.20                     19.7%                  Men & Boys, Shirts, Woven, of Cotton
 6205.30                     25.9%+29.1cents/kg     Men & Boys, Shirts, Woven, of Synthetic
 6206.30                     15.4%                  Women & Girls, Shirts, Woven, of Cotton
 6206.40                     26.9%                  Women & Girls, Shirts, Woven, of Synthetic
 6104.42                     11.5%                  Women & Girls, Dresses, Knitted, of Cotton
 6104.43                     14.9%                  Women & Girls, Dresses, Knitted, of Synthetic
 6204.42                     8.4%                   Women & Girls, Dresses, Woven, of Cotton
 6204.43                     16.0%                  Women & Girls, Dresses, Woven, of Synthetic

U.S. END MARKET ANALYSIS FOR TEXTILE AND APPAREL                                                          6
3. GENERAL CHARACTERISTICS OF THE U.S. MARKET FOR
   TARGET PRODUCTS
U.S. apparel imports have recently declined. As seen in Figure 1, both cotton apparel products and man-
made fibers apparel products have decreased, with the former showing a greater decline.
Figure 1: U.S. Apparel Imports from the World, 2015 to 2016

 45000

 40000

 35000

                                                                       OTEXA - MAJOR SHIPPERS
 30000
                                                                       REPORT, June 30, 2017,US World
                                                                       General Imports (in millions, USD)
 25000
                                                                       Cat. 31 - Cotton Apparel Products
 20000

 15000                                                                 Cat. 61 - Man-Made Fibers
                                                                       Apparel Products
 10000

  5000

     0
                    2015                       2016

To fully leverage AGOA’s duty-free benefits, Kenyan producers can focus their efforts on products that
are already being produced in the country and are in high demand by U.S. importers. This requires an
analysis of product categories by HTS code to determine which have the greatest growth potential
based on Kenyan export capability and U.S. import trends.
Figures 2 to 12 compare U.S. import figures with Kenyan export figures to find the best matched
categories. The figures used were provided by United States Agency for International Development
(USAID) statistics.

U.S. END MARKET ANALYSIS FOR TEXTILE AND APPAREL                                                            7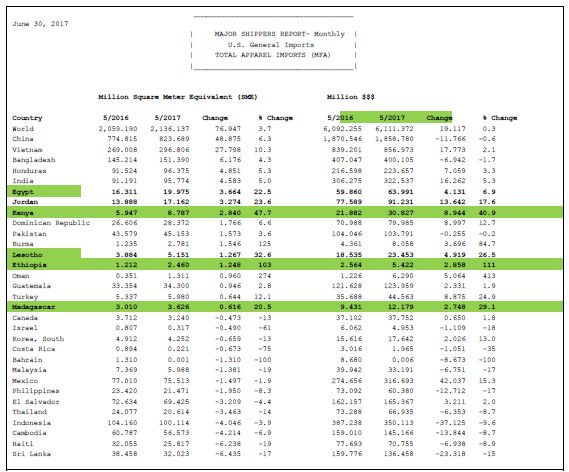
Figure 2a: U.S. World Import Trends – Category 6105 – Men & Boys, Shirts, Knitted

       $1,500,000,000

       $1,000,000,000

            $500,000,000                                              610510 Mens/Boys, Shirts of Cotton,
                                                                      Knit/Crochet
                     $-                                               610520 Mens/Boys, Shirts of
                            2012   2013                               Synthetics, Knit/Crochet
                                            2014     2015     2016
                             United States Import Statistics from
                                    World in US Dollars

Figure 2b: Kenya World Export Trends – Category 6105 – Men & Boys, Shirts, Knitted

  6000000
  5000000
  4000000
  3000000                                                                     610510 Mens/Boys, Shirts of
  2000000                                                                     Cotton, Knit/Crochet
   1000000
         0                                                                    610520 Mens/Boys, Shirts of
                2012                                                          Synthetics, Knit/Crochet
                           2013
                                     2014
                                                   2015
                                                              2016
                 Kenya Export Statistics to World in US Dollars

Category 6105.20 Men & Boys, Knitted Shirts, in Synthetics is a best matched category. It should
serve as a benchmark for the Kenya U.S. Export Strategy and Action Plan. The duty savings for this
category to U.S. importers under AGOA is 32 percent.

U.S. END MARKET ANALYSIS FOR TEXTILE AND APPAREL                                                            8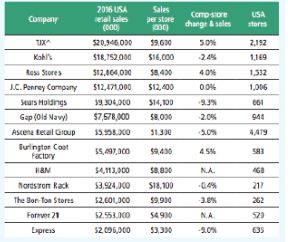
Figure 3a: U.S. World Import Trends – Category 6106 – Women & Girls, Shirts, Knitted

  $600,000,000
   $500,000,000
   $400,000,000
   $300,000,000
                                                                         610610 Women/ Girls, Blouses/Shirts
   $200,000,000                                                          Cotton, Knit
   $100,000,000
                                                                         610620 Women/Girls,
             $-                                                          Blouses/Shirts.of Synthetics, Knit
                         2012      2013
                                             2014
                                                       2015
                                                                  2016
                         United States Import Statistics from World in
                                          US Dollars

Figure 3b: Kenya World Export Trends – Category 6106 – Women & Girls Shirts, Knitted

  3500000
  3000000
  2500000
  2000000
   1500000                                                               610610 Women/ Girls, Blouses/Shirts
                                                                         Cotton, Knit
   1000000
    500000                                                               610620 Women/Girls,
         0                                                               Blouses/Shirts.of Synthetics, Knit
                  2012
                                2013
                                          2014
                                                    2015
                                                                2016
                  Kenya Export Statistics to World in US Dollars

Category 6106.20 Women & Girls Shirts, Knitted, in Synthetics is a best matched category. They
should serve as a benchmark for the Kenya U.S. Export Strategy and Action Plan. The duty savings for
this category to U.S. importers under AGOA is 32 percent.

U.S. END MARKET ANALYSIS FOR TEXTILE AND APPAREL                                                               9
Figure 4a: U.S. World Import Trends – Category 6109 – T-Shirts, Knitted
$5,000,000,000
$4,000,000,000
$3,000,000,000
$2,000,000,000 610910 T-Shirts, Singlets, Tank Tops
Etc, Knit , Cotton
$1,000,000,000
610990 T-Shirts, Singlets, Tank Tops
$- Etc, Knit , Synthetics
2012 2013 2014
2015
2016
United States Import Statistics from World
in US Dollars
Figure 4b: Kenya World Export Trends – Category 6109 – T-Shirts, Knitted
35000000
30000000
25000000
20000000
15000000 610910 T-Shirts, Singlets, Tank Tops
Etc, Knit , Cotton
10000000
5000000 610990 T-Shirts, Singlets, Tank Tops
0 Etc, Knit , Synthetics
2012
2013
2014
2015
2016
Kenya Export Statistics to World in US Dollars
Category 6109.10 Cotton Knit T-Shirts, and 6109.90 Synthetic Knit T-Shirts are best matched
categories. They should serve as a benchmark for the Kenya U.S. Export Strategy and Action Plan.
Although there is an upward trend in synthetics in the U.S. and an upward trend in cotton in Kenya,
demand for T-shirts and the mechanics of making T-shirts are complimentary regardless of fabric. Duty
savings for this category to U.S. importers under AGOA is 16.5 percent for cotton and 32 percent for
synthetic.
U.S. END MARKET ANALYSIS FOR TEXTILE AND APPAREL 10Figure 5a: U.S. World Import Trends – Category 6110 – Sweaters, Knitted
$10,000,000,000
$8,000,000,000
$6,000,000,000
$4,000,000,000 611020 Sweaters, Pullovers Etc, Knit,
Cotton
$2,000,000,000
611030 Sweaters, Pullovers Etc, Knit ,
$-
Synthetics
2012 2013 2014 2015
2016
United States Import Statistics from World
in US Dollars
Figure 5b: Kenya World Export Trends – Category 6110 – Sweaters, Knitted
6000000
5000000
4000000
3000000 611020 Sweaters, Pullovers Etc, Knit,
2000000 Cotton
1000000 611030 Sweaters, Pullovers Etc, Knit ,
0 Synthetics
2012
2013
2014
2015
2016
Kenya Export Statistics to World in US Dollars
Category 6110.30 Synthetic Sweaters is a best matched category. It should serve as a benchmark for
the Kenya U.S. Export Strategy and Action Plan. Duty savings for this category to U.S. importers under
AGOA is 32 percent.
U.S. END MARKET ANALYSIS FOR TEXTILE AND APPAREL 11Figure 6a: U.S. World Import Trends – Category 6201 – Men & Boys, Jackets/Outerwear
$1,400,000,000
$1,200,000,000
$1,000,000,000
$800,000,000
$600,000,000 620192 Mens/Boys Anoraks, Ski
$400,000,000 Jackets & Smlr Art Cotton, Not Knit
$200,000,000
620193 Mens/Boys Anoraks, Ski
$- Jackets & Smlr Art Synthetics,Not Knit
2012 2013 2014
2015
2016
United States Import Statistics from World
in US Dollars
Figure 6b: Kenya World Export Trends – Category 6201 – Men & Boys, Jackets/Outerwear
600000
500000
400000
300000 620192 Mens/Boys Anoraks, Ski
200000 Jackets & Smlr Art Cotton, Not Knit
100000 620193 Mens/Boys Anoraks, Ski
0 Jackets & Smlr Art Synthetics,Not Knit
2012
2013
2014
2015
2016
Kenya Export Statistics to World in US Dollars
Category 6201 Men & Boys Outerwear should not serve as a benchmark for the Kenya U.S. Export
Strategy and Action Plan. All export figures show a decline in this category. It is a niche business for
Kenya with very low volume. The duty savings for this category to U.S. importers under AGOA range
from 6.2 percent to 27.7 percent.
U.S. END MARKET ANALYSIS FOR TEXTILE AND APPAREL 12Figure 7a: U.S. World Import Trends – Category 6202 – Women & Girls, Jackets/Outerwear
$1,400,000,000
$1,200,000,000
$1,000,000,000
$800,000,000 620292 Womens/Girls Anoraks Ski
$600,000,000 Jackets & Smlr Article Cotton,Not
$400,000,000 Knit
$200,000,000 620293 Womens/Girls Anoraks Ski
$- Jackets & Smlr Articles Synthetics, Not
2012 Knit
2013 2014
2015
2016
United States Import Statistics from World
in US Dollars
Figure 7b: Kenya World Export Trends – Category 6202 – Women & Girls, Jackets/Outerwear
35000
30000
25000
20000 620292 Womens/Girls Anoraks Ski
15000 Jackets & Smlr Article Cotton,Not
Knit
10000
620293 Womens/Girls Anoraks Ski
5000
Jackets & Smlr Articles Synthetics, Not
0 Knit
2012
2013
2014
2015
2016
Kenya Export Statistics to World in US Dollars
Category 6202 Women & Girls Outerwear should not serve as a benchmark for the Kenya U.S.
Export Strategy and Action Plan. It is a niche business for Kenya. U.S. export figures show a decline in
this category, and the Kenya world export volume is very low. The duty savings for this category to U.S.
importers under the AGOA range from 6.2% to 27.7%.
U.S. END MARKET ANALYSIS FOR TEXTILE AND APPAREL 13Figure 8a: U.S. World Import Trends – Category 6203 – Men & Boys Trousers/Shorts, Woven
$6,000,000,000
$5,000,000,000
$4,000,000,000
$3,000,000,000
620342 Men's Or Boys' Trousers Etc,
$2,000,000,000 Not Knit, Cotton
$1,000,000,000 620343 Men's Or Boys' Trousers Etc,
$- Not Knit, Synthetics
2012 2013 2014
2015
2016
United States Import Statistics from World
in US Dollars
Figure 8b: Kenya World Export Trends – Category 6203 – Men & Boys Trousers/Shorts, Woven
60000000
50000000
40000000
30000000 620342 Men's Or Boys' Trousers Etc,
20000000 Not Knit, Cotton
10000000 620343 Men's Or Boys' Trousers Etc,
0 Not Knit, Synthetics
2012
2013
2014
2015
2016
Kenya Export Statistics to World in US Dollars
Categories 6203.42 and 6203.43 have perplexing data. While the U.S. import figures show no
growth or decline, Kenya’s export figures show an increase. These categories should therefore serve as
a benchmark for the Kenya U.S. Export Strategy and Action Plan, based on the high volume shown on
above. Duty savings for this category to U.S. Importers under AGOA is 16.6% for cotton and 27.9% for
synthetic.
U.S. END MARKET ANALYSIS FOR TEXTILE AND APPAREL 14Figure 9a: U.S. World Import Trends – Category 6204 – Women & Girls Trousers/Shorts, Woven
$6,000,000,000
$5,000,000,000
$4,000,000,000
$3,000,000,000 620462 Women's Or Girls'
Trousers/Shorts Of Cotton, Not
$2,000,000,000 Knitted
$1,000,000,000
620463 Women's Or Girls'
$-
Trousers/Shirts Etc Not Knit,
2012 Synthetic Fiber
2013
2014
2015
2016
United States Import Statistics from World in
US Dollars
Figure 9b: Kenya World Export Trends – Category 6204 – Women & Girls Trousers/Shorts, Woven
$50,000,000
$40,000,000
$30,000,000 620462 Women's Or Girls'
Trousers/Shorts Of Cotton, Not
$20,000,000 Knitted
$10,000,000 620463 Women's Or Girls'
Trousers/Shirts Etc Not Knit,
$- Synthetic Fiber
2012
2013
2014
2015
2016
Kenya Export Statistics to World in US Dollars
Categories 6204 should serve as a benchmark for the Kenya U.S. Export Strategy and Action Plan.
The drop in cotton is due to the rise of “Athleisure wear”. Both figures 9a and 9b show volume
opportunity. Duty savings for this category to U.S. importers under the AGOA is 16.6% for cotton and
28.6% for synthetic.
U.S. END MARKET ANALYSIS FOR TEXTILE AND APPAREL 15Figure 10a: U.S. World Import Trends – Category 6205 – Men & Boys Shirts, Woven
$3,500,000,000
$3,000,000,000
$2,500,000,000
$2,000,000,000
$1,500,000,000 620520 Men'S Or Boys' Shirts, Not
$1,000,000,000 Knit, Of Cotton
$500,000,000
620530 Men'S Or Boys' Shirts, Not
$-
Knit, Manmade Fibers
2012 2013
2014
2015
2016
United States Import Statistics from World in
US Dollars
Figure 10b: Kenya World Export Trends – Category 6205 – Men & Boys Shirts, Woven
$10,000,000
$8,000,000
$6,000,000
620520 Men'S Or Boys' Shirts, Not
$4,000,000 Knit, Of Cotton
$2,000,000 620530 Men'S Or Boys' Shirts, Not
Knit, Manmade Fibers
$-
2012
2013
2014
2015
2016
Kenya Export Statistics to World in US Dollars
Categories 6205 should serve as a benchmark for the Kenya U.S. Export Strategy and Action Plan.
Although the U.S. demand is somewhat flat, the volume is high, and Kenya could have a share.
Meanwhile, Kenya has shown a dramatic increase in world exports and therefore, the infrastructure
exists. Duty savings for this category to U.S. importers under AGOA is 19.7% for cotton and 25.9% plus
29.1 cents/kg for synthetics.
U.S. END MARKET ANALYSIS FOR TEXTILE AND APPAREL 16Figure 11a: U.S. World Import Trends – Category 6206 – Women & Girls Shirts, Woven
$1,600,000,000
$1,400,000,000
$1,200,000,000
$1,000,000,000
$800,000,000
$600,000,000 620630 W/G Blouses Shirts & Shirt
$400,000,000 Blouses Cotton,Not Knit
$200,000,000 620640 W/G Blouses, Shirts & Shirt
$- Blouses Mmf, Not Knit
2012 2013
2014
2015
2016
United States Import Statistics from World in
US Dollars
Figure 11b: Kenya World Export Trends – Category 6205 – Women & Girls Shirts, Woven
$6,000,000
$5,000,000
$4,000,000
$3,000,000 620630 W/G Blouses Shirts & Shirt
$2,000,000 Blouses Cotton,Not Knit
$1,000,000 620640 W/G Blouses, Shirts & Shirt
Blouses Mmf, Not Knit
$-
2012
2013
2014
2015
2016
Kenya Export Statistics to World in US Dollars
Categories 6206 should serve as a benchmark for the Kenya U.S. Export Strategy and Action Plan.
Kenya’s drop in world business could be a result of a particular supplier or customer. The U.S. business
is large enough to keep this category in focus. Duty savings for this category to U.S. importers under
AGOA is 15.4% for cotton and 26.9% for synthetic.
U.S. END MARKET ANALYSIS FOR TEXTILE AND APPAREL 17Figure 12a: U.S. World Import Trends – Category 6104 & 6204 – Women & Girls Dresses, Knit &
Woven
$1,400,000,000
$1,200,000,000
$1,000,000,000 610442 Women'S Or Girls' Dresses
Of Cotton, Knitted Or Cr
$800,000,000
610443 Women'S Or Girls' Dresses
$600,000,000
Synthetic Fibers, Knit
$400,000,000
620442 Women'S Or Girls' Dresses
$200,000,000 Of Cotton, Not Knitted
$-
620443 Women'S Or Girls' Dresses
2012 2013 Synthetic Fibers, Nt Kt
2014
2015
2016
United States Import Statistics from
World in US Dollars
Figure 12b: Kenya World Export Trends – Category 6104 & 6204 – Women & Girls Dresses, Knit &
Woven
$1,600,000
$1,400,000
$1,200,000 610442 Women'S Or Girls' Dresses
$1,000,000 Of Cotton, Knitted Or Cr
$800,000 610443 Women'S Or Girls' Dresses
$600,000 Synthetic Fibers, Knit
$400,000 620442 Women'S Or Girls' Dresses
$200,000 Of Cotton, Not Knitted
$-
620443 Women'S Or Girls' Dresses
2012 Synthetic Fibers, Nt Kt
2013
2014
2015
2016
Kenya Export Statistics to World in US
Dollars
Category 6104 & 6204 should not serve as a benchmark for the Kenya U.S. Export Strategy and
Action Plan. This is due to low volume exports from Kenya, which is a likely reflection of its being a
specialized fashion/niche collection SME. The support of SMEs includes various fashion categories in
apparel, which includes dresses. Duty savings for this category to U.S. importers under AGOA range
from 8.4% to 16%.
U.S. END MARKET ANALYSIS FOR TEXTILE AND APPAREL 184. U.S. MARKET STRUCTURE, CHARACTERISTICS AND TRENDS
4.1 MARKET SIZE
In 2017, the global womenswear industry was valued at $621 billion, the menswear industry at $402
billion, and the childrenswear industry at $186 billion.2 U.S. consumer clothing expenditure was $312
billion. The sheer size of this market creates opportunities for manufacturers to gain a global market
share.
Although the U.S. is not one of the largest exporters of fashion products globally, textile and apparel
exports were estimated at $22.9 billion in 2016. Over 50 percent of these exports were industrial
inputs as follows:
• Raw cotton: $4.41 billion
• Nonwoven textiles: $1.77 billion
• Cotton yarn of over 85 percent: $1.13 billion
• Artificial filament tow: $1.04 billion
• Synthetic filament yarn: $1.03 billion dollars
The U.S. is the largest importer of fashion-related products in the world. In 2016, imports were valued
at $105 billion. These were mostly manufactured apparel such as:
• Sweaters, pullovers, sweatshirts, etc.: $14.1 billion
• Women’s suits, not knit: $9.37 billion
• Men’s suits, not knit: $8.2 billion
• Women’s suits: $5.63 billion
• T-shirts: $5.2 billion
On February 6, 2015, the Joint Economic Committee of the United States Congress3 revealed that
almost 80 percent of U.S. apparel imports came from ten countries. The top ten countries for apparel
imports account for 78 percent of the total world apparel imports. China tops the list at 30 percent,
followed by Vietnam, Bangladesh, Indonesia, Honduras, India, Cambodia, Mexico, El Salvador and
Nicaragua. There is a steady increase in imports from four countries: Vietnam, which was expecting
trade preference to the U.S. under the Trans-Pacific Partnership (TPP); Honduras and Nicaragua, which
enjoy trade preference to the U.S. under the Central America Free Trade Agreement (CAFTA) and
Mexico, which enjoys trade preference to the U.S. under the North American Free Trade Agreement
(NAFTA). This indicates that trade preferences, such as AGOA, create market opportunities and fuel
growth.
2 FashionUnited, March 19, 2017.
3 Report entitled The Economic Impact of the Fashion Industry, and using statistics from OTEXA
U.S. END MARKET ANALYSIS FOR TEXTILE AND APPAREL 19Figure 53: Top 10 Apparel Exporting Countries to the U.S. Looking beyond the Top 10, Figure 14 shows the total apparel imports for 2017 compared to 2016.4 The data indicates steady market share growth for countries with trade preferences to the U.S. This is particularly apparent for African countries, with Ethiopia, Kenya and Madagascar registering significant gains in 2017 as compared to the previous year. One could argue that these East African countries registered high achievements because they had started from such a low base. Nonetheless, the growth is worth noting, and the figures in Figure 14 are a clear indication of a positive trend toward sourcing and importing apparel to the U.S. from East Africa since AGOA was signed for its ten-year term in 2015. 4 OTEXA’s Monthly Major Shipping, June 30, 2017 U.S. END MARKET ANALYSIS FOR TEXTILE AND APPAREL 20
Figure 64: Major Monthly Shippers Report – Total Apparel Imports

4.2 KENYAN EXPORTS TO THE U.S. ON BEST MATCHED CATEGORIES
Based on the global analysis in Section 3, U.S. global import demand was compared to Kenya global
exports, which created a best matched category. A decisive indicator was synthetic fabric content versus
cotton. We will use the following best matched category list as the focus for the remainder of the
report:

 TABLE 2. BEST MATCHED CATEGORIES

 HTS CODE                          DUTY SAVINGS              DESCRIPTION
 Knitted Shirts in Synthetic for ALL Genders and Ages
 6105.20                           32%                       Men & Boys, Shirts, Knitted, of Synthetic
 6106.20                           32%                       Women & Girls, Shirts, Knitted, of Synthetic
 T-Shirts in Cotton and Synthetic for ALL Genders and Ages
 6109.10                           16.5%                     T-shirts, Knitted, of Cotton

U.S. END MARKET ANALYSIS FOR TEXTILE AND APPAREL                                                            21
6109.90                          32%                         T-shirts, Knitted, of Synthetic
 Sweaters in Synthetic for ALL Genders and Ages
 6110.30                          32%                         Sweaters (pullovers & cardigans), of Synthetic
 Woven Pants and Shorts in Cotton and Synthetic for ALL Genders and Ages
 6203.42                          16.6%                       Men & Boys, Trousers/Shorts, Woven, of Cotton
 6203.43                          27.9%                       Men & Boys, Trousers/Shorts, Woven, of Synthetic
 6204.62                          16.6%                       Women & Girls, Shorts & Trousers, Woven, of Cotton
 6204.63                          28.6%                       Women/Girls, Shorts & Trousers, Woven, of Synthetic
 Woven Shirts in Cotton and Synthetic for ALL Genders and Ages
 6205.20                          19.7%                       Men & Boys, Shirts, Woven, of Cotton
 6205.30                          25.9%+29.1cents/kg          Men & Boys, Shirts, Woven, of Synthetic
 6206.30                          15.4%                       Women & Girls, Shirts, Woven, of Cotton
 6206.40                          26.9%                       Women & Girls, Shirts, Woven, of Synthetic
 Dresses for Women & Girls in Cotton and Synthetic as Part of SME Products
 6104.42                          11.5%                       Women & Girls, Dresses, Knitted, of Cotton
 6104.43                          14.9%                       Women & Girls, Dresses, Knitted, of Synthetic
 6204.42                          8.4%                        Women & Girls, Dresses, Woven, of Cotton
 6204.43                          16.0%                       Women & Girls, Dresses, Woven, of Synthetic

Figure 75: Kenyan Exports to the U.S. – Market Size and Growth for Years 2012-2016, Knitted
Shirts in Synthetic for ALL Genders and Ages
HTS 6105.20       Men & Boys, Shirts, Knitted, of Synthetic
HTS 6106.20       Women & Girls, Shirts, Knitted, of Synthetic

                                             Synthetic Knit Shirts
                                  610520 Mens/Boys, Shirts of Synthetics, Knit/Crochet
                                  610620 Women/Girls, Blouses/Shirts.of Synthetics, Knit
 $6,000,000
 $5,000,000
 $4,000,000
 $3,000,000
 $2,000,000
 $1,000,000
           $-
                      2012                2013                 2014                  2015                 2016
                                              Kenya to United States - Export Dollars

U.S. END MARKET ANALYSIS FOR TEXTILE AND APPAREL                                                                    22
Figure 86: Kenyan Exports to the U.S. – Market Size and Growth for Years 2012-2016, T-shirts in
Cotton & Synthetic for ALL Genders and Ages
HTS 6109.10 T-shirts, Knitted, of Cotton
HTS 6109.90 T-shirts, Knitted, of Synthetic
Knit T-Shirts
610910 T-Shirts, Singlets, Tank Tops Etc, Knit , Cotton
610990 T-Shirts, Singlets, Tank Tops Etc, Knit , Synthetics
$40,000,000
$30,000,000
$20,000,000
$10,000,000
$-
2012
2013
2014
2015
2016
Kenya to United States - Export Dollars
Figure 97: Kenyan Exports to the U.S. – Market Size and Growth for Years 2012-2016, Sweaters in
Synthetic for ALL Genders and Ages
HTS 6110.30 Sweaters (pullovers & cardigans), of Synthetic
Knit, Synthetic Sweaters, Pullovers, Etc.
611030 Sweaters, Pullovers Etc, Knit , Synthetics
$5,000,000
$4,000,000
$3,000,000
$2,000,000
$1,000,000
$-
2012
2013
2014
2015
2016
Kenya to United States - Export Dollars
U.S. END MARKET ANALYSIS FOR TEXTILE AND APPAREL 23Figure 108: Kenyan Exports to the U.S. – Market Size and Growth for Years 2012-2016, Woven
Pants and Shorts in Cotton & Synthetic for ALL Genders and Ages
HTS 6203.42 Men & Boys, Trousers/Shorts, Woven, of Cotton
HTS 6203.43 Men & Boys, Trousers/Shorts, Woven, of Synthetic
HTS 6204.62 Women & Girls, Shorts & Trousers, Woven, of Cotton
HTS 6204.63 Women & Girls, Shorts & Trousers, Woven, of Synthetic
Woven Pants & Shorts
620342 Men's Or Boys' Trousers/Shorts Etc, Not Knit, Cotton
620343 Men's Or Boys' Trousers.Shorts Etc, Not Knit, Synthetic Fiber
620462 Women's Or Girls' Trousers/Shorts Of Cotton, Not Knitted
620463 Women's Or Girls' Trousers/Shirts Etc Not Knit, Synthetic Fiber
$60,000,000
$50,000,000
$40,000,000
$30,000,000
$20,000,000
$10,000,000
$-
2012 2013 2014 2015 2016
Kenya to United States - Export Dollars
Figure 119: Kenyan Exports to the U.S. – Market Size and Growth for Years 2012-2016, Woven
Shirts in Cotton & Synthetic for ALL Genders and Ages
HTS 6205.20 Men & Boys, Shirts, Woven, of Cotton
HTS 6205.30 Men & Boys, Shirts, Woven, of Synthetic
HTS 6206.30 Women & Girls, Shirts, Woven, of Cotton
HTS 6206.40 Women & Girls, Shirts, Woven, of Synthetic
Cotton & Synthetic Woven Shirts
620520 Men'S Or Boys' Shirts, Not Knit, Of Cotton
620530 Men'S Or Boys' Shirts, Not Knit, Manmade Fibers
620630 W/G Blouses Shirts & Shirt Blouses Cotton,Not Knit
620640 W/G Blouses, Shirts & Shirt Blouses Mmf, Not Knit
$12,000,000
$10,000,000
$8,000,000
$6,000,000
$4,000,000
$2,000,000
$-
2012 2013 2014 2015 2016
Kenya to United States - Export Dollars
U.S. END MARKET ANALYSIS FOR TEXTILE AND APPAREL 24For the Best matched categories, there is a heavy surge in synthetics, even in bottoms. The initial 2014 drop in U.S. imports for women’s and girls’ cotton bottoms could be attributed to the surge in “athleisure” wear during this period. Knit leggings and sweat pants in stretch synthetics from brands like Lululemon and Nike became acceptable outside the gym - in schools and even in some offices, depending on the type of business. This could have displaced the core woven bottoms market. In 2014, around the time of the decrease in U.S. imports in this category, an article entitled “For the Active Wear Market, There’s No Way But Up” was published in https://www.businessoffashion.com/. The article states: “Wearing gym clothes beyond the gym has never looked more appropriate....The global sports apparel market — which includes women's active wear — is set to grow to $178 billion by 2019, according to Boston-based research firm Trefis.” 4.3 MARKET SEGMENTS The product groups in the best matched categories are captured in six major market segments: KNITTED SHIRTS. For all of the best matched categories, there is a heavy surge in synthetics. In particular, we narrowed down our focus category to Knit Shirts only in Synthetics due to the surge in “athleisure,” and the global sports apparel market which is driven by performance fabrics. Most of these fabrics are synthetic and carry attributes like “wicking” to relieve the feeling of moisture against the skin, quick dry to eliminate perspiration from hanging on to the garment and make for cross activity use, anti- microbial for more sanitary wearability and stretch components to make them more comfortable. It is stated on multiple sites including www.globenewswire.com and www.alliedmarketresearch.com that the global sports apparel market is set to grow to $184.6 billion by 2020. T-SHIRTS. Sourcing Journal online quotes NPD Group statistics, which claim that Americans spend $20 billion on T-shirts every year. Some selection of men’s, women’s, teens and/or children's T-shirts are sold by virtually every retail establishment that sells apparel, and even some companies that sell other non-apparel products. Quality, price and embellishments depend on the end-user demographic. This segment is the most vast and cross pollinates with other segments such as name brand, designer fashion, sportswear, performance wear, athletic wear, fast fashion, ethical fashion, promotional wear, commodity and work wear. There should be room for Kenyan suppliers to capture a portion of this massive opportunity. SWEATERS. For all genders, sweaters have typically been a seasonal business and prominent during the Fall/Winter selling season (August through December). Some of the South and West parts of the U.S. buy little to no sweaters due to the short and limited wearing cycle. Higher priced designer brands and some work wear companies’ stock sweaters year-round. Lighter weights are preferred due to their versatility. The duty on synthetic sweaters is 32%, therefore a trade preference program like AGOA would afford the buyer a measurable saving. In addition, because sweaters are a primarily vertical operation, a supplier most often only needs to import/keep “yarn” on hand to be able to knit garments to order. This is in contrast to other product categories that need imported fabrics, findings and trims. SPORTSWEAR AND WORKWEAR. (Men/Boys/Women/Girls – Woven Pants & Shorts; Men/Boys/Women /Girls – Woven Shirts) These categories are considered “sportswear components” as well as “work wear components” depending on styling and usage. Today, there is a cross-over sector where the work wear/uniform companies are producing styles that look more like sportswear increase versatility. These woven tops and bottoms are for all genders, and are part of name brand and private label collections and classification departments in all major department stores, apparel specialty stores, uniform and workwear suppliers and e-commerce sites. There is cross cutting with other segments such as designer fashion, performance wear, fast fashion and ethical clothing, to name a few. These categories are relevant to all size business. U.S. END MARKET ANALYSIS FOR TEXTILE AND APPAREL 25
SME COMPONENTS – INCLUDING DRESSES AND CHILDREN’S WEAR. Women’s
dresses - the wear to work essential in some professions such as banking and government posts - has
been in the news lately due to the U.S. Government requirement for women to have their shoulders
covered when sitting in session. But sleeves or no sleeves, “Dresses continue to lead assortments with
24% year-over-year growth.5 In Kenya, this is an SME which is generally higher priced and designer or
niche driven.
Over the years, children’s wear has incubated itself as a segment unto itself. However, that is all
changing. E-commerce and fast fashion have pushed the children’s market into trends, production cycles,
and challenges that are similar to adult commerce. The best news about children’s wear is that children
continue to be born and grow and thus, there is a constant need for wardrobe replenishment. It must
also be noted that in the U.S., the Consumer Product Safety Commission (CPSC) has a very strict set of
guidelines for exporters to follow when producing for this segment.
Each of the above market segments is diverse in their possible reach toward the end
consumer.

4.4 MARKET TRENDS
The U.S. market is vast and offers the opportunity for export growth in many segments.
KNIT SHIRTS The Lifestyle Monitor, produced by Cotton Inc., published an article entitled “Winning
in the U.S. Active Wear Market.” The article states:
           “A revolution in the U.S. active wear market is being driven by the convergence of several
           consumer and retail trends. According to Cotton Incorporated’s 2014 Sports Apparel Survey,
           more than 9 in 10 consumers say they wear athleticwear for activities other than exercise.
           Increased consumer demand has prompted U.S. athletic apparel sales to grow at double the rate
           of non-active apparel sales for several years. Strong sales growth has convinced mass merchants,
           fast fashion retailers, and luxury brands to enter or increase offerings in this $33 billion market,
           previously dominated by a smaller cadre of outdoor and sports apparel retailers and brands…
           The ability to sustain a thriving and lucrative activewear line that appeals to consumers will
           require attention to comfort, fashion, and performance.”
T-SHIRTS can be considered both a basic commodity as well as a fashion item in the U.S., depending
on usage, price point and brand name. Price point is typically driven by quality and construction, though
some notable brand names are able to sell even basic T-shirts for higher prices simply based on
marketing and their brand equity. Sourcing for large volumes as “commodity” is highly competitive
especially for the products called “blanks”, which are simple in nature and typically embellished (usually
with screen prints) later down the supply chain (and not by the manufacturer). Sourcing for small to
medium volumes as fashion items may include some embellishments (like printing or special stitching) at
the manufacturing level. They are typically more forgiving with prices, and often times are looking for, or
are already associated with mission statements aiming for sustainable and benevolent supply chains. In
addition to factors within the segment, cotton T-shirts find additional competition from the fast rising
“performance” category where T-shirts are made from technical synthetics that offer special features
like “wicking” and “temperature control” as mentioned in Section 4.2(A).
SWEATERS, fully fashioned, have been a “seasonal” category in the U.S. They are typically purchased
in the latter part of the calendar year for wearing in the colder winter months. However, with
unpredictable climate, and considering a large part of the U.S. is “warm” 12 months a year, consumer
buying habits for sweaters vary greatly. Lighter, finer gauge designs are more marketable. This category

5   The Sourcing Journal on line report “Womenswear Trends Channel Versatility for Spring/Summer 2018”
U.S. END MARKET ANALYSIS FOR TEXTILE AND APPAREL                                                            26
has also been affected by the “performance” factor. The SPINEXPO first edition report given by
www.knittingindustry.com notes that spinners exhibiting in July 2016, for goods to be in store by 2017,
offered technical and performance yarns, cotton and cotton blend yarns for jersey, and light soft fancy
yarns. Sustainability and efficiency in the use of resources was also a recurring trend.
WOVEN SHIRTS, PANTS AND SHORTS for men’s, women’s and children’s bottoms are
typically led by denim jeans. Tops are usually led by men’s dress shirts, sport shirts and women’s
blouses. In recent years however, the entire category has been under threat as the rise of “athleisure”
wear has challenged the rigid woven business tops and bottoms with the acceptance of knitted polos,
athletic style fashion tops, leggings, jeggings and other nonwoven fabrics. For men’s, women’s and
children’s apparel, the “athleisure” trend of knitwear keeps rising, challenging the growth of woven
apparel.
WOMEN AND GIRLS’ DRESSES have also been affected by the rise of sportswear and
“athleisure.” As women and girls strive for empowerment, their wardrobe follows suit. On December
13, 2016, Elle online published an article on fashion trends titled “How Women Owned Sport, And
Sport Ruled Women's Wear In 2016.” The article states: “Sportswear has been a hot topic for several
seasons, and the trend isn't slowing down. On the AW16 and SS17 runways, designers used athletic
wear as a tool to show the emotional and physical strength of women…” This attitude will have a
negative effect on the way “dresses” are purchased. However, all is not lost. Predictions for 2017 give a
new life to dresses as noted in Sourcing Journal online, Fashion Snoops Top Trends for Fall/Winter
2017/2018 posted on August 16, 2016, and the Spring 2018 article mentioned in Section 4.2(F)
CHILDREN’S WEAR, as a cross cutting market for the above mentioned product groups is
challenged by the same factors as adult wear. In 2016, the entire market was influenced by the
“performance” and “athleisure” rise, as well as fast fashion’s push on speed to market. The Sourcing
Journal online published its 2016 report “The Year in Children’s Wear” citing the Top 5 business trends
in the kids market as:
1. Influx of international brands making their way to the U.S.
2. Accelerated demands pushing faster production cycles and more frequent deliveries of new
products
3. Price and stock level competition between traditional brick and mortar retail stores against
e-commerce sellers, and regulations on sale prices and periods
4. Advertising truths and full disclosure for component parts and raw materials
5. Potential tariffs and/or compliance regulation changes that could come with the U.S.
government administration’s view on imports
4.5 MAIN BUYERS
It is sometimes confusing to figure out who the target buyers are for apparel. There are Retail Buyers
who purchase goods for their own stores. There are Wholesaler Buyers who purchases goods and then
sell the goods to the retailers. Both groups sell on e-commerce/online websites.
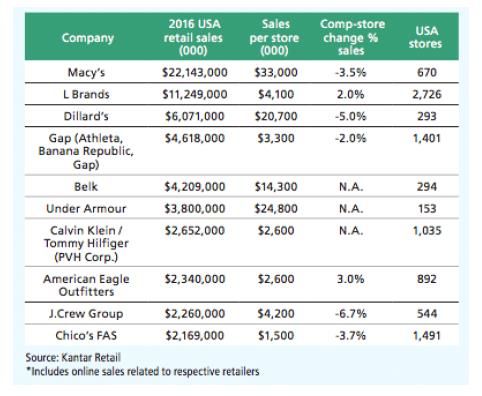
The National Retail Federation (NRF), the world’s largest retail trade association, notes on their website
that there are 286,225 clothing and clothing accessory “Retail” stores in the U.S. Figure 20 below
provides examples of some of these stores selected from top retail and trade data in 2016. It is intended
as a guide for discussion on U.S. market potential for Kenya’s apparel exporters.
U.S. END MARKET ANALYSIS FOR TEXTILE AND APPAREL 27Figure 20: Partial Listing of U.S. "Principle Buyers" U.S. END MARKET ANALYSIS FOR TEXTILE AND APPAREL 28
The NRF publishes their annual Top 100 Retailers ranking each year in June based on sourced data from
Kantar Retail. In an article published on June 29, 2017, the Sourcing Journal online highlighted NRF’s Top
100 breakdown based on 2016 sales, spotlighting the top retailers selling apparel in four sections based
on price tier:
• Mass Merchant: Lowest price/highest volume; usually sells apparel in addition to other goods;
sells multiple brands including private label.
• Mass Apparel: Value price/high volume; usually only sells apparel and apparel accessories
including shoes; sells multiple brands including private label.
• Premium Apparel: Medium price/medium to large volume; usually only sells apparel and apparel
accessories including shoes and may sell multiple brands; private label or may only sell their own
brand.
• Luxury Apparel: High price/small to medium volume; usually only sells apparel and apparel
accessories including shoes and may sell multiple brands; private label or may only sell their own
brand.
4.5.1 MASS MERCHANT
Walmart remained in the Number 1 slot overall with an estimated $363 billion in sales in the U.S. alone.
Walmart is an American multinational “mass merchant” retailing corporation that operates as a chain of
hypermarkets, discount department stores, and grocery stores. They are value price driven and the
discount department stores sells apparel among other things. Walmart also owns and operates the
Sam's Club retail warehouses which sell apparel, in addition to other product sectors.
4.5.2 MASS APPAREL
This category of retail stores selling apparel includes mid-tier department stores, off-price chains, and
fast fashion retailers.
Figure 21: NRF’s Top Mass Apparel Stores
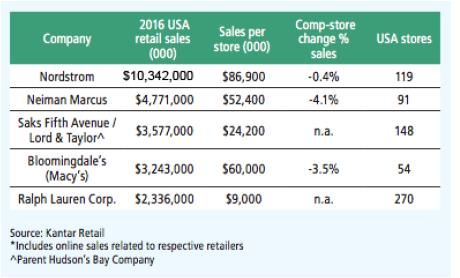
U.S. END MARKET ANALYSIS FOR TEXTILE AND APPAREL 294.5.3 PREMIUM APPAREL This category of retail stores selling apparel includes multi-brand mall stores, as well as better brand labels. Figure 22: NRF’s Top Premium Apparel Stores 4.5.4 LUXURY APPAREL This category of retail stores sells the best and higher price apparel, apparel accessory and shoes. Tables 6 shows NRF’s top stores in this category. Figure 23: NRF’s Top Luxury Apparel Stores Noticeably absent from the Top 100 extract above is Amazon. The same Sourcing Journal article noted: “Though it’s not ranked as an apparel retailer, it’s important to note that Amazon’s apparel sales – through third parties and direct – were estimated to be $22 billion for 2016. This places it just behind Macy’s which racked up $22.1 billion.” U.S. END MARKET ANALYSIS FOR TEXTILE AND APPAREL 30
5. U.S. TARIFF STRUCTURE
All pre-selected products in this analysis are imported duty-free into the U.S. from Kenya under AGOA.
To be eligible for trade preferences under the textile and apparel provisions, AGOA beneficiary
countries must have in place an effective visa system to prevent unlawful transshipments and the use of
counterfeit documents.

U.S. END MARKET ANALYSIS FOR TEXTILE AND APPAREL                                                    31
6. U.S. NON-TARIFF STRUCTURE

6.1. IMPORT REGULATIONS FOR TEXTILE AND APPAREL PRODUCTS
    •   All textiles and apparel must have permanently affixed and visible labels indicating the country of
        origin. If this is not feasible, they should be packaged in such a way that the country of origin is
        obvious to the ultimate purchaser. The country of origin for assembled products would be
        Kenya, as long as the cut and/or sew operations take place in Kenya and the final product is
        AGOA-eligible.
    •   The Certificate of Origin (CoO) is issued by Kenyan authorities. The exporter’s invoice is
        stamped with the official AGOA Stamp by the same Kenyan authorities.
    •   Wearing apparel must have permanently affixed (usually sewn-in) labels inside the garment,
        specifying fabric content and care instructions in English. The exact design, wording and
        placement of this information is usually provided by the buyer. In addition, most U.S. buyers
        require this information in one additional designated language (usually Spanish, and sometimes
        French) which would be specified at the time of ordering.
    •   More information on US Labeling Laws for apparel can be found on the Federal Trade
        Commission (FTC) website: www.ftc.gov
    •   The U.S. importers Registered Identification Number (RN) may be required, but is not
        mandatory. The RN is a number issued by the FTC, upon request, to a business residing in the
        U.S. that is engaged in the manufacture, importing, distribution, or sale of textile, wool, or fur
        products. Such businesses are not required to have RNs. They may, however, use it in place of a
        name on the label or tag that is required to be affixed to these products.
    •   Children’s wear is a consistently growing sector, and products require a mandatory “tracking
        label” permanently affixed to the garment and printed with the following information:
            o   Manufacturer or private labeler name
            o   Location where product was made (country/city)
            o   Date of production (month/year)
            o   Detailed information of the manufacturing process such as batch number, run number,
                order number, or other identifying characteristics
            o   Any other information to facilitate ascertaining the specific source of the product
    •   More information on children's wear guidelines can be found on the CPSC government website:
        www.cpsc.gov
Other regulations can be product specific such as:
Certificate of Conformity (CoC), which is granted to a product that meets a minimum set of
regulatory, technical and safety standards. Generally, type approval is required before a product is
allowed to be sold in a particular country, so the requirements for a given product will vary around the
world.
General Certificate of Conformity (GCC) in which the manufacturer or importer certifies that its
non-children's (general use) product complies with all applicable consumer product safety rules (or
similar rules, bans, standards, or regulations under any law enforced by the Commission for that
product).
Consumer Product Safety Commission (CPSC), which has requirements for flammability and
other specifics, most notably for children’s clothing and sleepwear. The CPSC and the Consumer

U.S. END MARKET ANALYSIS FOR TEXTILE AND APPAREL                                                         32
Product Safety Improvement Act (CPSIA) are among the regulations. Testing requirements and
authorities are also regulated.
The following websites can provide more information:
• U.S. Consumer Product Safety Commission
• American Apparel and Footwear Association
• Informed Compliance Publications Africa Growth Opportunity Act AGOA "Importing into the U.S.,"
AGOA Chapter 23
6.2. AGOA RULES OF ORIGIN
Certain textile and apparel articles that are imported directly into the customs territory of the U.S. from
a beneficiary sub-Saharan African country will enter the U.S. free of duty and free of any quantitative
limitations, if the country has satisfied the requirements set forth in the Act. The Harmonized Tariff
Schedule of the United States (HTSUS) has been amended to cover the new benefits by inserting new
U.S. notes in Subchapter II of Chapter 98 and a new Subchapter XIX in Chapter 98.
http://www.cbp.gov/sites/default/files/documents/icp065_3.pdf
Under a Special Rule, Least Developed Beneficiary Countries (LDBCs) will enjoy an additional
preference in the form of duty-free/quota-free access for apparel made from fabric originating anywhere
in the world. The Special Rule is in effect until September 30, 2025 and is subject to a cap.
The full details of the wearing apparel provisions can be on the International Trade Administration
OTEXA website http://web.ita.doc.gov
Main features of the “wearing apparel provisions” from the ITA website:
• APPAREL PROVISIONS. AGOA provides duty-free and quota-free treatment for eligible apparel
articles made in qualifying sub-Saharan African countries until September 30, 2025. Qualifying articles
include: apparel made of U.S. yarns and fabrics; apparel made of sub-Saharan African (regional) yarns
and fabrics until September 30, 2025, subject to a cap; apparel made in a designated lesser-developed
country of third country yarns and fabrics until September 30, 2025, subject to a cap; apparel made of
yarns and fabrics not produced in commercial quantities in the U.S.; textile or textile articles
originating entirely in one or more lesser-developed beneficiary sub-Saharan African countries;
certain cashmere and merino wool sweaters; and eligible hand loomed, handmade, or folklore
articles, and ethnic printed fabrics.
• QUALIFYING TEXTILE AND APPAREL ARTICLES. The Africa Investment Incentive Act of
2006 (signed by President Bush on December 20, 2006) amended the textile and apparel portions of
AGOA and is referred to as "AGOA IV". The legislation extended duty-free and quota-free
treatment to a wider range of eligible articles made in qualifying sub-Saharan African countries:
− Apparel made of U.S. yarns and fabrics
− Apparel made of sub-Saharan African (regional) yarns and fabrics, subject to a cap
− Apparel made in a designated lesser-developed country of third country yarns and fabrics, subject
to a cap
− Apparel made of yarns and fabrics not produced in commercial quantities in the United States
− Certain cashmere and merino wool sweaters
− Eligible hand loomed, handmade, or folklore articles and ethnic printed fabrics
− Textiles and textile articles produced entirely in a lesser-developed beneficiary country
U.S. END MARKET ANALYSIS FOR TEXTILE AND APPAREL 33• SPECIAL RULE FOR APPAREL APPLYING TO LESSER-DEVELOPED AGOA
COUNTRIES. Under a Special Rule for lesser-developed beneficiary countries, they will enjoy an
additional preference in the form of duty-free/quota-free access for apparel made from fabric
originating anywhere in the world. The Special Rule is in effect until September 30, 2025 and is
subject to a cap (see below for details on the cap). Lesser-developed countries are those with a per
capita gross national product of less than $1,500 a year in 1998 as measured by the World Bank.
AGOA IV grants lesser-developed beneficiary country status to Botswana and Namibia; Public Law
110-436 of October 16, 2008 re-designates lesser-developed beneficiary country status to Mauritius,
qualifying all three countries for the Special Rule. Public Law 114-27 of June 29, 2015 extends the
AGOA third country fabric provision until September 30, 2025.
• TEXTILE AND TEXTILE ARTICLES (CATEGORY 0). AGOA IV expanded AGOA benefits
to textile articles originating entirely in one or more lesser-developed beneficiary sub-Saharan
African country(ies). This new provision will extend preferential treatment to textile articles such as
fibers, yarns, fabrics and made up goods (i.e., towels, sheets, blankets, floor coverings) and will be
implemented by incorporation into the AGOA Visa Arrangement.
• OTHER TEXTILE AND APPAREL PROVISIONS. The Committee for the Implementation of
Textile Agreements (CITA), an interagency group chaired by the Commerce Department's Deputy
Assistant Secretary for Textiles and Apparel, has the authority to implement certain provisions of
AGOA's textile and apparel benefits. These provisions include:
− Determination of the annual cap on imports of apparel that is assembled in beneficiary countries
from fabric formed in beneficiary countries from yarn originating either in the U.S. or in
beneficiary countries. Until September 30, 2025, the statute permits lesser-developed beneficiary
countries to obtain preferential treatment for apparel assembled in beneficiary countries
regardless of the origin of the fabric;
− Determination that yarn or fabric cannot be supplied by the U.S. industry in commercial quantities
in a timely manner, and to extend preferential treatment to eligible apparel from such yarn or
fabric (commercial availability);
− Determination of eligible handloomed, handmade, or folklore articles and ethnic printed fabrics;
− A "tariff snapback" in the event that a surge in imports of eligible articles causes serious damage or
threat thereof to domestic industry;
− Determination of whether U.S. manufacturers produce interlinings in the U.S. in commercial
quantities, thereby rendering articles containing foreign interlinings ineligible for benefits under
AGOA; and
− Determination of whether exporters have engaged in illegal transshipment and denial of benefits
to such exporters for a period of five years.
• REGIONAL CAP. AGOA limits imports of apparel made with regional or third country fabric to
a fixed percentage of the aggregate square meter equivalents of all apparel articles imported into the
U.S. Beginning October 1, 2007, the annual aggregate quantity of imports eligible for preferential
treatment under these provisions is an amount not to exceed 7% of all apparel articles imported
into the U.S. Of this overall amount, apparel imported under the Special Rule for lesser-developed
countries is limited to an amount not to exceed 3.5% of apparel imported into the U.S. in the
preceding 12-month period. Apparel articles entered in excess of these quantities will be subject to
otherwise applicable tariffs. The duty-free cap is not allocated among countries. It is filled on a "first-
come, first-served" basis. For the most current data on aggregate imports under the cap, visit the
OTEXA website and click on "AGOA".
U.S. END MARKET ANALYSIS FOR TEXTILE AND APPAREL 34You can also read