WASTE 2018 MARKET INTELLIGENCE REPORT - GREENCAPE
←
→
Page content transcription
If your browser does not render page correctly, please read the page content below

Waste
–
2018
Market Intelligence Report
–

GreenCape
                                                 GreenCape is a non-profit organisation that drives the
                                                 widespread adoption of economically viable green economy
                                                 solutions from the Western Cape. We work with businesses,
                                                 investors, academia and government to help unlock the
                                                 investment and employment potential of green technologies and
                                                 services, and to support a transition to a resilient green economy.

                                                 Acknowledgments
                                                 We thank Sam Smout for the time and effort that went into
                                                 compiling this market intelligence report. We also thank Quinton
                                                 Williams, Kirsten Barnes and Tawanda Songo for the time and
                                                 insights provided. We thank Mike Pienaar and Linda Godfrey
                                                 for their feedback on draft versions of this report. We also thank
                                                 Francois de Clercq (Averda), Alistair Schorn (PETCO), Leon
                                                 Livesey (Wastebusters), Mawande Mtyi (City of Cape Town),
                                                 Melvi Todd (Averda), Reg Barichievy (SmartWaste) and
                                                 Tyron Hartle (Interwaste) for their contributions.

                                                 Disclaimer
                                                 While every attempt has been made to ensure that the
                                                 information published in this report is accurate, no responsibility
                                                 is accepted for any loss or damage to any person or entity
                                                 relying on any of the information contained in this report.

                                                 Copyright © GreenCape 2018

                                                 This document may be downloaded at no charge
                                                 from www.greencape.co.za. All rights reserved.

                                                 Subscribe to receive e-mail alerts or GreenCape news, events
                                                 and publications by registering as a member on our website:
                                                 www.greencape.co.za.

                                                 Image Copyright © GreenCape 2017

                                                 18 Roeland Street, Cape Town, 8001, South Africa

                                                 Editorial and review:               Lauren Basson, Salomé Bronkhorst and Nicholas Fordyce
                                                 Images: 			                         GreenCape, Bruce Sutherland and Pxhere
                                                 Layout and design: 		               Deep Agency

II   Waste: Marketing Intelligence Report 2018   Waste: Marketing Intelligence Report 2018                                                   III
Contents

Executive summary                                                                                    1        4.4. Builders’ rubble                                                                     54
What’s new?                                                                                          3             4.4.1. Market size                                                                   55
1. Introduction and purpose                                                                          4             4.4.2. Opportunities                                                                 57
2. Sector overview                                                                                   5             4.4.3. Barriers                                                                      60
    2.1. Industry structure                                                                          6             4.4.4. Recent developments                                                           60
    2.2. South African market size                                                                  11        4.5. Municipal opportunities                                                              61
         2.2.1. Cost of landfilling in South Africa                                                 12        4.6. Opportunities identified by the Western Cape Industrial Symbiosis Programme (WISP)   64
    2.3. Western Cape market size                                                                   13     5. Funding and incentives                                                                    65
         2.3.1. Cost of landfilling in Cape Town                                                    15         5.1. Support for waste sector start-ups                                                  65
    2.4. Market size according to recycling industry associations                                   16         5.2. General funding opportunities                                                       68
    2.5. Key highlights in 2017/2018                                                                16              5.2.1. Green Finance Database                                                       68
         2.5.1. Operation Phakisa                                                                   16              5.2.2. Other databases                                                              68
         2.5.2. Industry waste management plans                                                     18              5.2.3. Ecosystem observations                                                       69
         2.5.3. Renewable Energy Independent Power Producers Procurement Programme                  19              5.2.4. How the GreenCape Green Finance Desk assists investors                       69
         2.5.4. National Minimum Wage Bill                                                          19        5.3. Manufacturing incentives                                                             70
3. Legislation and regulations                                                                      20     6. The Western Cape: Africa’s growing greentech hub                                          71
    3.1. The legislative framework for waste management in South Africa                             20     7. GreenCape’s support to businesses and investors                                           75
    3.2. New regulatory updates                                                                     21     Annex A: Western Cape waste tonnages                                                         77
    3.3. Draft regulations                                                                          24     References                                                                                   79
    3.4. Anticipated legislation                                                                    25
4. Opportunities                                                                                    27
    4.1. Organics                                                                                   28
        4.1.1. Market size                                                                          29
        4.1.2. Opportunities                                                                        31
        4.1.3. Barriers                                                                             36
        4.1.4. Recent developments                                                                  38
    4.2. Electronic waste                                                                           39
                                                                                                    40
                                                                                                    44
                                                                                                    43
                                                                                                    44
     4.3. Plastics                                                                                  46
         4.3.1. Market size                                                                         47
         4.3.2. Opportunity                                                                         50
         4.3.3. Barriers                                                                            52
         4.3.4. Recent developments                                                                 53

IV                                                                Waste: Market Intelligence Report 2018   Waste: Market Intelligence Report 2018                                                        V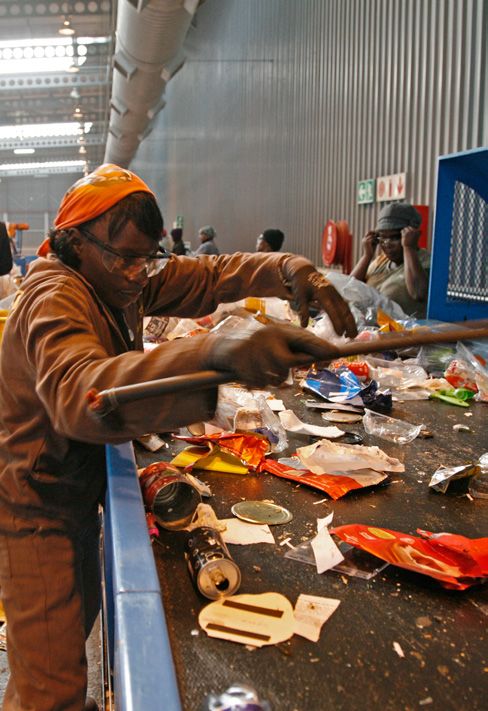
List of figures
Figure 1                                                                                                       Figure 16
Waste collection and treatment responsibilities in South Africa                                           6    Proportion of plastic waste (green) relative to total waste (grey) generated in the Western Cape   46
Figure 2                                                                                                       Figure 17
Classification of total waste generated in South Africa in 2011                                          11    Major plastics converted in 2016                                                                   47
Figure 3                                                                                                       Figure 18
Municipal landfill gate fees for general waste for eight metros in South Africa 2017/2018                13    Types and tonnages of plastic recycled in South Africa and exported for recycling in 2016          48
Figure 4                                                                                                       Figure 19
Western Cape total waste characterisation – waste streams and proportions                                14    Source of recycled plastics in 2016                                                                49
Figure 5                                                                                                       Figure 20
General and hazardous waste gate fees for the City of Cape Town (2007 – 2021)                            15    Provincial plastic distribution based on GVA distribution in 2016                                  49
Figure 6                                                                                                       Figure 21
Proportion of organic waste relative to total waste generated in the Western Cape                        28    Market share of plastic recyclate in South Africa in 2016                                          50
Figure 7                                                                                                       Figure 22
Organic waste and sewage sludge generated in the Western Cape                                            30    Proportion of builders’ rubble (green) relative to total waste (grey) generated in the
Figure 8                                                                                                       Western Cape                                                                                       54
Number of existing organic waste solutions in the Western Cape identified through GreenCape                    Figure 23
engagements                                                                                              31    Volumes of builders’ rubble crushed and landfilled, and crushing capacity in the CoCT in 2015
Figure 9                                                                                                       and 2016                                                                                           56
Processing capacity of organic waste solution providers in the Western Cape identified through                 Figure 24
GreenCape engagements                                                                                    32    Change in building costs over time                                                                 57
Figure 10                                                                                                      Figure 25
Average tonnages of annual green waste produced per local municipality and the extent                          Price comparison of virgin and recovered aggregate in Cape Town                                    58
of diversion from landfill		                                                                             33    Figure 26
Figure 11                                                                                                      GreenCape’s focus areas 		                                                                         76
Annual tonnages of abattoir waste generated across the Western Cape                                      34    Figure 27
Figure 12                                                                                                      Organic waste, sewage sludge and agricultural residues generated in the Western Cape               78
Biogas plant capital expenditure versus electrical capacity up to 1 500 kWe and comparison to
German context                                                                                           35
Figure 13
Proportion of e-waste (green) relative total waste (grey) generated in the Western Cape                  39
Figure 14
Distribution of e-waste generation across the Western Cape                                               40
Figure 15
E-waste value chain of the Western Cape                                                                  41

VI                                                                    Waste: Market Intelligence Report 2018   Waste: Market Intelligence Report 2018                                                             VII
List of tables List of acronyms
and abbreviations
Table 1 AD Anaerobic digestion
Estimated population growth for the Western Cape 13 AWT Alternative waste treatment
Table 2 C&DW Construction and demolition waste
Total waste tonnages generated per district municipality / metro for 2016 14 C&I Commercial and industrial
Table 3 CoCT City of Cape Town
Industry association and recyclables processed / available – 2016 17 CCA Customs-controlled area
Table 4 DEA Department of Environmental Affairs
Description of the 20 Phakisa initiatives and their potential impacts 18 DEA&DP Western Cape Department of Environmental Affairs and Development Planning
Table 5 DEDAT Western Cape Department of Economic Development and Tourism
Waste related budget allocation for various municipalities of the Western Cape (2017 – 2020) Doe Department of Energy
and some key infrastructure proposed 61 DST Department of Science and Technology
Table 6 dti Department of Trade and Industry
Agencies that provide services for the new entrepreneurs, start-ups and SMEs 66 EIA Environmental impact assessment
Table 7 eWASA e-Waste Association of South Africa
List of funding solutions and incentives – waste-specific 68 EPR Extended producer responsibility
Table 8 ETI Employment tax incentive
Total waste tonnages generated per district municipality / metro for 2016 77 GDP Gross domestic product
GIZ Deutsche Gesellschaft für Internationale Zusammenarbeit
GRI Gestamp Renewable Industries
GW Gigawatt
IDC Industrial Development Corporation
IT Information technology
ITAC International Trade Administration Commission of South Africa
IPP Independent power producer
ISO International Organization for Standardization
IIWTMP Integrated Industry Waste Tyre Management Plan
IndWMP Industry Waste Management Plan
IWMP Integrated Waste Management Plan
KfW Kreditanstalt für Wiederaufbau (Reconstruction Credit Institute)
KfW Entwicklungsbank KfW Development Bank
kWh Kilowatt-hours
LDPE Low-density polyethylene
MFMA Municipal Finance Management Act, No. 56 of 2003
MIG Municipal Infrastructure Grant
MIR Market intelligence report
MRF Material recovery facility
MSA Municipal Systems Act, No. 32 of 2000
MSW Municipal solid waste
MW Megawatt(s)
NDP National Development Plan
NEMA National Environmental Management Act, No. 107 of 1998
NEMWA National Environmental Management: Waste Act, No. 59 of 2008
NPSWM National Pricing Strategy for Waste Management
NWIB National Waste Information Baseline
NWMS National Waste Management Strategy
VIII Waste: Market Intelligence Report 2018 Waste: Market Intelligence Report 2018 IX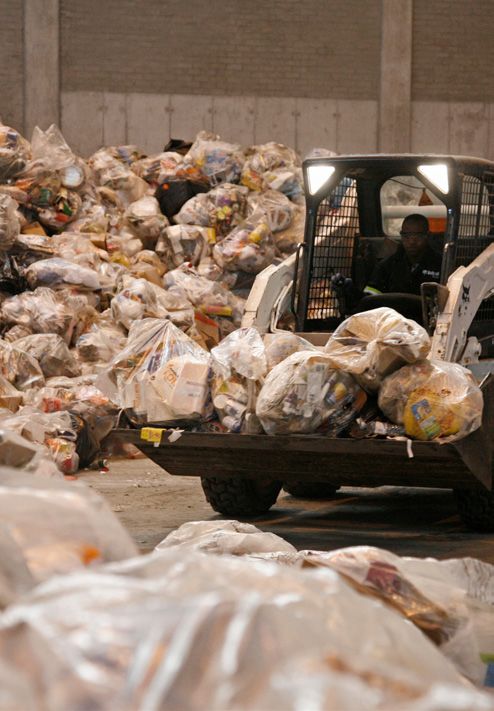
ORASA     Organic Recyclers Association of South Africa
PE-HD     High-density polyethylene
PE-LD     Low-density polyethylene
PE-LLD    Linear low-density polyethylene
PET       Polyethylene terephthalate
PETCO     PET Recycling Company of South Africa
Polyco    Polyolefin Recycling Company
PP        Polypropylene
PPP       Public-private partnership
PRASA     Paper Recycling Association of South Africa
PRO       Producer responsibility organisation
PS        Polystyrene
PS-E      Polystyrene expanded
PSPC      Polystyrene Packaging Council
PVC       Polyvinyl chloride
R&D       Research and development
RDF       Refuse delivered fuels
REDISA    Recycling and Economic Development Initiative of South Africa
REEEP     Renewable Energy and Energy Efficiency Partnership
REIPPPP   Renewable Energy Independent Power Producer
          Procurement Programme
rPET      Recycled polyethylene terephthalate
SABIA     Southern African Biogas Industry Association
SAEWA     South African e-Waste Alliance
SALGA     South African Local Government Association
SANEDI    South African National Energy Development Institute
SAVA      Southern African Vinyls Association
SAWIS     South African Waste Information System
SEZ       Special economic zone
SMEs      Small- and medium-sized enterprises
SMMEs     Small, medium and micro-sized enterprises
StEP      Solving the e-waste problem
TA        Transactional Advisor
TGRC      The Glass Recycling Company
UNIDO     United Nations Industrial Development Organization
VAT       Value-added tax
WCG       Western Cape Government
WCPS      West Coast Power Solutions
WISP      Western Cape Industrial Symbiosis Programme
WMB       Waste Management Bureau
WtE       Waste to energy
WWTW      Wastewater treatment works

                                                                                               Copyright © GreenCape
X                                                     Waste: Market Intelligence Report 2018   Waste: Market Intelligence Report 2018   11
Executive summary
          The South African waste management landscape is set to experience
      a raft of legislative and regulatory changes that will advance the country
      toward a more resource-efficient economy. This will create opportunities for
      business and investors in the waste sector who focus on plastics, organics,
                     e-waste, and construction and demolition waste.

Disposal continues to dominate the South African           include 45 000 additional formal jobs and 82 000           ■■   Builders’ rubble: The supply of and demand              Key drivers of these opportunities include:
waste landscape. Based on official 2011 estimates,         indirect jobs, as well as the creation of 4 300 SMMEs.          for builders’ rubble as an alternative to virgin
108 million tonnes of waste material were generated        The DEAs' overall target is to increase waste diverted          material are growing. National government and           ■■   Legislation and regulation: New and changing
that year, of which 10% was recycled or reused             from landfill from an estimated 13% (14 million                 local municipalities are focusing increasingly on            national and provincial legislation and regulations
with the remaining 90% landfilled (DEA 2012). The          tonnes) in 2016 to 25%1 (29 million tonnes) by 2023;            diverting rubble from landfill. The private sector           are set to unlock a number of key waste streams,
national Department of Environmental Affairs (DEA)         hence greater business and job creation benefits are            is starting to consider builders’ rubble as an               notably organics. These changes will also help
has extrapolated the 2011 statistics to unofficially       expected.                                                       alternative, in the context of rising virgin material        to simplify rules and procedures for alternative
represent 2016 estimates. These show the generation                                                                        costs. Crushing contracts in Stellenbosch and                waste treatment technologies and activities.
of 111 million tonnes of waste in 2016, of which 83        The waste sector is broad and complex, consisting of            CoCT, green procurement by the private sector,
million tonnes (75%) were landfilled. Furthermore,         various waste streams, stakeholders and technologies.           and red tape reduction are further unlocking            ■■   Industry waste management plans: The paper
a large proportion, approximately 65 million tonnes        This provides a variety of opportunities:                       reuse potential of builders’ rubble.                         and packaging, e-waste and lighting industries
(59%), was handled by local municipal waste                                                                                                                                             will be legally required to implement mechanisms
management systems (DEA 2017).                                                                                        ■■   Municipal contracts: A number of municipalities              to ensure extended producer responsibility. This
                                                           ■■   Organics: Solutions are needed for municipal               will    need     waste    related   infrastructure           will ensure access to feedstock, and support
The Western Cape generates an estimated 7.7 million             green waste, abattoir waste, and the organic               development / expansion / maintenance over                   demand for recovered materials.
tonnes of waste annually, of which 3.6 million (47%)            fraction of municipal solid waste (MSW); there             the next three years. They include CoCT; Eden
consist of commercial and industrial waste. The                 is also biogas investment potential of R100                District; and the Drakenstein, Knysna, Langeberg,       ■■   Government initiatives: The initiatives identified
remaining 4.1 million tonnes (53%) is municipal solid           million.                                                   Saldanha, and Stellenbosch local municipalities.             by the national government’s fast results delivery
waste (MSW). Of the total for the province, the City                                                                                                                                    programme, Operation Phakisa, should increase
of Cape Town (CoCT) generates a substantial portion        ■■   E-waste: The forthcoming promulgation of              ■■   Opportunities identified through industrial                  access to feedstock and stimulate growth in
(48%) of the waste, which includes 2.8 million tonnes           an e-Waste Industry Waste Management                       symbiosis include the need for solutions for slag            market demand.
(36%) of MSW and 0.9 million tonnes of commercial               Plan (IndWMP), coupled with a national focus               (540 000 tonnes/year), paper/pulp effluent (240
and industrial waste (12%).                                     on legacy electronics, signal a rise in the                000 tonnes/year), foundry sand (74 000 tonnes/          ■■   Cost of disposal: Dwindling landfill space and
                                                                availability of e-waste. This will provide an              year), treated wood (760 000 tonnes/year),                   rising management costs are pushing up the
Household waste is managed by municipalities and/or             increase in feedstocks for dismantlers and                 laminate glass (200 tonnes/year) and cardboard               price of landfilling in the Western Cape, and the
by their appointed service providers. Commercial and
                                                                refurbishers, and an opportunity to establish              cores (170 tonnes/year).                                     CoCT in particular. This increases demand from
industrial waste is typically managed by the private                                                                                                                                    waste generators for alternative waste treatment
                                                                the Western Cape’s first licensed processing
sector in larger municipalities, and to some extent                                                                                                                                     solutions, which in turn improves the financial
                                                                facility for processing large volumes of
the municipalities themselves. Although private                                                                                                                                         viability of solutions.
stakeholders also own landfills, municipal landfills are        e-waste.
open for private sector disposal.                          ■■   Plastic: The promulgation of the paper
According to DEA (2017), the waste economy                      and packaging IndWMP will unlock greater
contributed approximately R24.3 billion to the South            volumes of clean feedstocks and more business
African GDP in 2016. It provided 36 000 formal jobs             support for the sector, with further support
and supported an estimated 80 000 informal jobs/                likely through Operation Phakisa. There is a
livelihoods. A further R11.5 billion per year could be          need for thermal treatment technologies for
unlocked by 2023 by diverting up to 20 million tonnes           dirty mixed plastics, refuse derived fuels (RDF)
of waste (DEA 2017). The anticipated spin-offs could            and thermoform PET

1   Of the 2012 waste figures.

1                                                                            Waste: Market Intelligence Report 2018   Waste: Market Intelligence Report 2018                                                                              2
What’s new?                                                                                                              1–
                                                                                                                                                          Introduction and purpose
            For investors and business owners who have read GreenCape’s 2017
            Waste MIR, the following are new developments discussed in this
                           report of which they should take note:                                                                                             This report provides insights into opportunities for investors and
                                                                                                                                                              businesses active or interested in providing alternative waste
                                                                                                                                                              treatment solutions to the South African market, with particular
■     Industry Waste Management Plans: The                                              Development Initiative of South Africa (REDISA).                                         focus on the Western Cape
      National Environmental Management: Waste Act                                      The Minister has since published a call for new plans
      (59 of 2008) Section 28 Notice was published                                      to be submitted. The DEA Waste Management
      on 6 December 2017. It calls for the paper and                                    Bureau (WMB) has been managing the waste tyre
      packaging, electrical and electronic, and lighting                                stream in the interim until another plan is approved.        The report has been compiled by the GreenCape          Key investment opportunities and barriers to
      industries to submit industry waste management                                                                                                 Waste Sector Desk. It highlights key insights and      these are highlighted, followed by emerging
      plans (IndWMPs) to the Minister of Environmental                            ■     National Minimum Wage Bill: The National                     opportunities identified in the past year across the   trends (Section 4). Section 5 outlines finance and
      Affairs for approval. IndWMPs must be submitted                                   Minimum Wage Bill (B 31-2017) is expected to be              waste value chain (collection, sorting, processing     incentives that may be relevant or of interest to
      to the Minister by 6 September 2018 and                                           enacted by May 2018. The legislation introduces              and treatment) in a dynamic and evolving waste         investors.
      producers (including converters and refurbishers)                                 a blanket minimum payment (R20/hour or R3 500                sector.
      must register with the Minister by 6 February 2018.                               per month [for a 40-hour week]) for most South                                                                      The case for the Western Cape as a greentech
                                                                                        Africans in employment, including those in the               The section that follow provides an overview of        hub for Africa is covered (Section 6), followed by
■     Operation Phakisa: Chemicals and Waste                                            waste sector.                                                the waste industry in South Africa, with particular    an outline of GreenCape’s work in supporting the
      Economy: The national Department of                                                                                                            focus on the Western Cape (Section 2). This is         growth of South Africa’s green economy (Section 7).
      Environmental Affairs (DEA) chemical and waste                              ■     Organics landfill diversion targets (Western                 followed by an overview of policies and regulations
      economy programme has engaged extensively                                         Cape): The Western Cape Government (WCG)                     that guide and affect the waste sector, as well as     For questions or queries, or to access GreenCape’s
      with stakeholders through Operation Phakisa2.                                     Department of Environmental Affairs and                      updates since the previous MIR (Section 3).            services, contact the Waste Sector Desk at
      The engagements aimed to identify key waste                                       Development Planning (DEA&DP) has made the                                                                          021 811 0250 or via email at waste@greencape.co.za.
      issues and government / private sector initiatives                                bold decision to implement an organic waste
      to persue. The 2017 Operation Phakisa:                                            diversion plan. The plan seeks to divert 50%
      Chemicals and Waste Economy embodies the                                          of organic waste from landfill by 2022, and to
      political will to implement enabling legislation                                  achieve 100% diversion by 2027. The plan will
      that would promote waste beneficiation. DEA                                       include addendums to the licences of waste
      has identified 20 initiatives across four work                                    disposal facilities. These addendums will require
      streams to divert 20 million tonnes of waste from                                 municipalities to set annual targets and identify
      landfill. If implemented, this could unlock an                                    procedures to meet the organic waste diversion
      additional R11.5 billion per year to help create                                  targets. In effect, this will restrict disposal of all
      45 000 direct jobs and 4 300 small, medium and                                    organics to Western Cape landfills by 2027. The
      micro-sized enterprises (SMMEs).                                                  underlying motivation is to divert organics from
                                                                                        landfill. This will reduce the need to comply
■     Promulgation of National Norms and                                                with stricter landfill designs required by national
      Standards for Sorting, Shredding, Grinding,                                       government, which would otherwise have
      Crushing, Screening or Baling of General                                          substantial (and potentially unaffordable) cost
      Waste (GN 1093 of 2017): It has removed the                                       implications for local municipalities.
      legislative hurdle of requiring an environmental
      authorisation / waste management licence for                                ■     Landfill gate fee increases (City of Cape Town):
      waste-handling facilities with an operational area                                CoCT is to increase its landfill gate fees for both
      greater that 1000 m2.                                                             general and hazardous waste. Indications are
                                                                                        that general waste fees will increase well beyond
■     Waste tyre management plan withdrawn:                                             inflation (5.33%) year on year for the next three
      In October 2017, the national Department                                          years. The CoCT will confirm the new gate fees in
      of Environmental Affairs (DEA) withdrew the                                       the first quarter of 2018.
      Integrated Industry Waste Tyre Management
      Plan submitted by the Recycling and Economic

1   A cross-sector, fast-results delivery programme launched in 2014 to help implement the National Development Plan.

3                                                                                                           Waste: Market Intelligence Report 2018     Waste: Market Intelligence Report 2018                                                                     4
2–
Sector overview 2.1. Industry structure Figure 1 illustrates the relationship between the
The waste economy in South Africa is structured three sectors. The figure also illustrates that the
into three broad sectors: waste generators, South African waste sector comprises four key
waste collectors, and waste treatment. The most types of stakeholders — public sector, private
This section provides a broad overview of the South African sector, households and associations. They all
common form of waste treatment has historically
and Western Cape waste sectors. been landfilling, with AWT now becoming part of interact in some form or another, and their roles
the ‘treatment’ sector. and responsibilities are governed by a well-defined
legal framework.
Collection
It outlines the industry structure and key players, The number of AWT projects (implemented and
followed by overviews of the South African and planned) has increased. However, the actual impact
Western Cape waste economy markets. The of these has not yet been assessed. The national Local Municipalities Private Sector
section also highlights key 2017 investments in Department of Environmental Affairs (DEA) has
Local municipalities are constitutionally Waste management companies can be
and insights related to the Western Cape’s waste established the South African Waste Information
mandated to ensure that household waste contracted by local municipalities (through
economy. System (SAWIS) in accordance with Section 60 of Household is collected. They can provide the service a procurement process) to collect
the National Environment Management: Waste themselves or appoint private waste household waste, or to manage drop-off
Over the last five years, GreenCape has been Act 59 of 2008 (NEMWA). The aim is to record, contractors. facilities used by households.
producing an annual Waste Economy MIR. This collect, manage and analyse data and information Generation Local municipalities are not required to Commercial and industrial waste
period has seen growth in the uptake of alternative on waste flows. However, the DEA has noted service commercial or industrial waste generators are responsible for managing
waste treatment (AWT) solutions and increased that the information acquired to date is limited Commercial/ generators. However, commercial and their own waste, including safe disposal.
diversion of waste from landfill, both in the Western and not a clear representation of what is actually Industrial industrial waste generators may request a However, this is usually outsourced to
municipality to collect their waste, but this private waste management contractors.
Cape and in South Africa. This has been the result occurring. This is largely due to inadequate/ incurs a service fee.
of, among others: ineffective reporting and the lack of enforcement of
Municipalities are mandated to ensure The private sector can either have its
the SAWIS.
the availability of disposal facilities, such own waste treatment and/or disposal
■■ increasing pressures on municipalities as landfills. They can also support AWT facilities; or it can be contracted by local
(e.g. limited landfill airspace); The National Waste Management Strategy Treatment/
by means of providing material recovery / municipalities to manage municipal
Disposal
■■ extensive investment and activity (NWMS) came into effect in 2011, and the targets aggregation infrastructure. Such facilities recovery / aggregation / disposal facilities.
by voluntary material organisations and set therein are required to be monitored at least are managed internally or contracted to
the private sector through a procurement
producer responsibility organisations; and every five years (DEA 2012). In accordance with the process.
■■ some increase in awareness of sustainability NWMS action plan, a national national baseline
imperatives by business and industry. assessment was undertaken in 2012 (using 2011 as Figure 1: Waste collection and treatment responsibilities in South Africa
the baseline year). It estimated that South Africa
Furthermore, the government is increasingly produces 108 million tonnes of waste with a 10%
focusing on the waste economy as a job creator diversion rate (DEA 2012). At the time of writing this Public sector
through various green economy policies and report, the DEA has published a tender requesting All spheres of government (local, district, provincial The national DEA is the overarching authority
strategies. This has manifested in several key an update to the national baseline study, which is and national) are legally responsible for waste for waste management in South Africa. The DEA,
developments over the last year: expected to be concluded in 2018. management, and for upholding the Constitution through its Waste Management Bureau, will most
and the NEMWA. However, roles vary depending likely oversee the implementation of the IndWMPs
■■ a Phakisa3 on the chemical and waste on department and sphere. Understanding these (see Section 2.5.2). Its role will include supporting
economy took place in July 2017; roles and responsibilities allows investors to assess and advising industry on the development of the
■■ several progressive legislative updates the spheres on which to focus their energies when plans, monitoring implementation of plans, and
(Section 3); and accessing opportunities. managing disbursement of funds.
■■ the call for submission of industry waste
management plans (IndWMPs) for the paper
and packaging, electrical and electronics, and
lighting industries.
3 Phakisa’ means ‘hurry up’ in Sesotho. Operation Phakisa is an initiative by government to fast track the implementation of solutions on critical development
issues under the National Development Plan.
5 Waste: Market Intelligence Report 2018 Waste: Market Intelligence Report 2018 6
The provincial government’s Department of These facilities are operated either by the local
Environmental Affairs and Development Planning municipality or can be outsourced to the
(DEA&DP) is the Western Cape’s provincial waste private sector through a procurement process.
authority. Its functions include promulgating provincial
legislation, municipal support, and monitoring of Private sector
municipal and private sector activites. The commercial and industrial sectors are responsible
for managing their own waste. They are bound by
Waste generators and handlers triggering the legal and regulatory requirements, whether they are
thresholds stipulated in Annex 1 of the National waste generators or waste handlers.
Waste Information Regulations (59 of 2008) must
register with and report waste figures to the national ■■ Waste generators are solely responsible
DEA via the South African Waste Information System for the management, i.e. collection, storage
(SAWIS)4. In the Western Cape, this reporting must and disposal, of their own commercial and
be done through the provincial Integrated Pollutant industrial waste. The management of their
and Waste Information System (IPWIS) managed by waste is generally outsourced to private waste
DEA&DP. Investors looking to develop waste activities service providers, or alternatively done by local
/ facilities that will require a waste management municipalities on request. Both these options will
licence will have to apply with the DEA if hazardous incur a service fee. In practice, municipalities do
waste is handled (see Section 3.1), and the DEA&DP not involve themselves with hazardous waste.
for general waste (see Section 3.1). The DEA&DP has
commenting authority for hazardous waste. ■■ Waste handlers are responsible for providing
waste management services to their clients,
Local municipalities are constitutionally5 mandated such as commercial and industrial entities,
to provide waste management services to households as well as households, if they are contracted
within their boundaries. These services include by municipalities as service providers. These
removal / collection, storage and disposal of waste services range from advice, onsite waste
generated by households. Collection can be done by coordination, storage, collection/transport,
the local authority or outsourced to the private sector. treatment, disposal and/or reporting. Waste
Local municipalities are not mandated to provide handlers are required to adhere to both national
the commercial and industrial sectors with waste and local waste regulations.
collection services.
For investors, gaining access to waste streams is
Municipalities are also expected to provide waste easier when working with the private sector and
collection and disposal infrastructure6. AWT is not their service providers / waste handlers, compared
explicitly required by the Municipal Systems Act to transacting with municipalities, mainly because
(MSA) 32 of 2000; it is considered to be a municipal investors and the private sector have fewer legal
support activity in terms of the MSA (National requirements with which to comply. (See ’How
Treasury 2008) and as such municipalities will need to to work with municipalities’ for additional legal
motivate for the provision of services via a Section 78 obligations on municipalities regarding transactions
process of the MSA. However, both the NEMWA7 and with the private sector).
the NWMS require local municipalities to implement
AWT mechanisms to divert waste from landfill and
minimise environmental degradation. In some cases, Private waste handlers typically
municipalities provide infrastructure for aggregation allow easier access to waste
(drop-offs) and separation (e.g. material recovery
streams than municipalities
facilities), rather than providing the actual recycling
infrastructure for conversion into a secondary material.
4
A system used by government and industry to capture data on the tonnages of waste generated, recycled and disposed of in South Africa on a monthly
and annual basis.
5
Schedule 5b of the Constitution of the Republic of South Africa (Act 108 of 1996), further entrenched by Sections 152.1b and d of the Constitution, assigns
a variety of functions to the local government sphere.
6
The Western Cape has one landfill site, Vissershok, that is permitted to receive level 3 and level 4 waste. Level 1 and level 2 waste types are only permitted
to be received by privately owned landfill operators.
7
NEMWA (Act 107 of 1998).
Copyright © GreenCape
7 Waste: Market Intelligence Report 2018 Waste: Market Intelligence Report 2018 8■■ In the Western Cape, the linear value chain, The associations currently fall within the following
i.e. collection, aggregation and disposal, categories: ■■ Service contracts: These are standard This kind of contract is beneficial to
is dominated by several large waste short-term contracts that usually run for no the private sector as it allows investors
management companies, namely Averda, ■■ Producer responsibility organisations longer than three years. The municipality to generate revenue from providing a
Enviroserv, Interwaste, Waste-Mart and (PRO): generally non-profit organisations with pays a service provider to manage / provide municipal service, whilst the municipality
WasteControl. Averda and Enviroserv jointly a national footprint and primarily funded by a particular aspect of a municipal service. will gain new infrastructure. An example
own the only private landfill in Cape Town. producers (manufacturers / brand owners / This could be waste collection, providing of such a contract could be a composting
There are five other landfills in the Western converters / refurbishers) of a product. vehicles, or designing and constructing facility where a service provider treats the
Cape owned by the private sector: Mossel infrastructure. organic fraction of municipal solid waste
Bay (Petro SA), De Hoek and Riebeek West ■■ Material specific organisations: generally non- (MSW) and benefits from the sale of the
(PPC), Vredenburg (Exxaro) and Saldanha Bay profit organisations with a national footprint and ■■ Management contracts: These are compost that it produces from the waste.
(ArcelorMital). However, waste management is primarily funded by material producers. medium-term contracts of between three The advantage for the municipality is that
not these companies’ core business. and five years. The municipality will pay they tap into the private sector for both
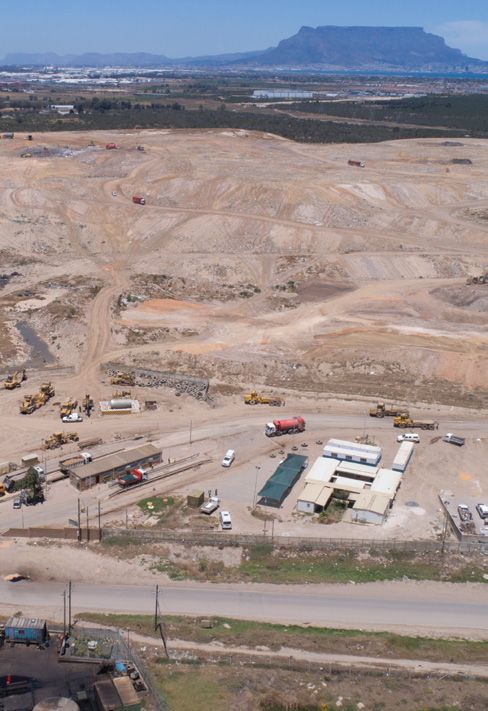
■■ Recycling organisations: primarily funded by a service provider to manage an aspect expertise and funding that would otherwise
Households recycling companies for support in collecting of a municipal service. However, the not be accessible to the municipality.
Households are generally serviced by their local municipality will still be responsible for
financing the operations, maintenance, ■■ Concessions: Much like the BOT, the
municipality, or the municipality’s contracted Currently, membership and financial contributions to
repair, or capital costs of the service. Such service provider is responsible for all
collectors. Some municipalities require households the industry associations are voluntary. However, this
contracts are used when municipalities aspects of the municipal service,
to separate recyclables from non-recyclables, and will most likely change with the implementation of the
to ensure that the recyclables are disposed of envisioned IndWMPs (see Section 3.2). Two options outsource the operation of their existing
infrastructure, such as transfer stations or ■■ but it includes recovery of service costs
responsibly. This can be done by either contracting have been discussed10.
waste drop-offs. / service tariff collection. The service
the municipality (at a service fee, unless the
provider generally pays the municipality
municipality has a recycling collection service), Industry members along the value chain will either
Leases: These are long-term contracts that a concession fee for the rights to operate
contracting an accredited waste service provider, or be legally required to register with a relevant PRO ■■
can run from 8 to 15 years. In this case, the the municipal function. At the end of
delivering recyclables to a licensed waste facility and and subsequently pay levies, or registration will be
service provider pays to use the municipal the contract any new infrastructure is
drop-offs. Voluntarily contracting the private sector is required but levies will be voluntary. However, those
assets to undertake the municipal service transferred to the municipality. The
becoming more common, especially in communities industry stakeholders that do not pay levies
or support service. The service provider municipality would normally engage the
falling outside of municipal recyclable collection
is responsible for operating, repairing, private sector via a tender process when
schemes.
and maintaining those assets. The benefit seeking to partner. However, at times these
engagements can be instigated by the
Recycling industry associations How to work with municipalities for the private sector is the use of the
infrastructure and any revenue generated private sector via an unsolicited bid. An
South African legislation has made provision for The Municipal Systems Act 32 of 2000 governs
from operating the service. For instance, unsolicited bid is an offer submitted by any
recycling to divert waste from landfill. Recycling municipalities when they improve, extend or
these contracts would be used for entity at its own initiative without having
activities in South Africa are largely driven by industry upgrade a municipal service, or establish a new
operating material recovery facilities, where been invited by a municipality to do so. It
through the establishment of industry associations. municipal service. For various reasons such as
the service provider makes an income from should be noted that according to Section
There are various industry associations in South budgetary constraints, municipalities may require
the sale of recyclables. 113 of the Municipal Finance Management
Africa, all contributing to promoting the recovery the assistance of the private sector to ensure
Act (MFMA) 56 of 2003 the municipality
and recycling of materials at different points of the that their service delivery needs are met. The
■■ Build, Operate, Transfer (BOT): These is not obliged to consider an unsolicited
value chain. necessary steps required before a municipality
contracts are in place for more than 15 years bid received outside normal bidding
can partner with the private sector are outlined in
until a return on investment is achieved. processes. However, if a municipality should
There is no clear distinction between the roles, Section 76 – Section 78 of the Act.
The service provider accepts most of the consider such a bid, it may do so only in
responsibilities and mission statements of the
risk in this contract, taking responsibility accordance with a prescribed framework,
different industry associations. During this process a municipality will
and paying for nearly all aspects of such as a supply chain management policy
identify the type of contractual arrangement
delivering the municipal service, i.e. that includes public participation. Such a
However, there are specific industry associations for needed should it decide to partner with
construction, operation and maintenance. supply chain management policy must be
all mainstream recyclables8 (paper, glass, plastics the private sector. Based on the need, a
At times design is also included. At the end drafted in line with the National Treasury’s
and metal), electronic waste (e-waste) and recently, variety of contractual arrangements can be
of the contract, once the service provider Municipal Supply Chain Management
organics9, with these associations involved in considered, of which the most common are
has obtained a return on the investment, Regulation of 2005.
diverting ‘their’ material from landfill. They provide (COGTA, 2004)11:
the facility is transferred to the municipality.
varying levels of support to their members along the
waste value chain (disposal, recovery and recycling).
8
Management Bureau until a new IndWMP has been finalised and a PRO has been confirmed.
An industry association focused on the management of organic waste has been registered as the Organic Recyclers Association of South Africa (ORASA).
9
As voiced by DEA at the Industry Waste Management Forum hosted by DEA&DP on 06 September 2017.
10
This is a generic list – contract durations and agreement conditions may well change based on requirements. For example, service contracts may run beyond
11
three years if required. As of 2017, REDISA has been liquidated and has fallen away as the tyre PRO.
9 Waste: Market Intelligence Report 2018 Waste: Market Intelligence Report 2018 102.2. South African market size The ‘business as usual’ approach to waste The DEA presented extrapolated waste figures for
In the absence of a mature South African Waste According to this NWIB, in 2011 South Africa management is focused on landfilling. This is 2016 as part of the Operation Phakisa for chemicals
Information System12, and poor standard data generated approximately 59 million tonnes of illustrated by the estimated 90% of waste being and waste economy (Section 2.5.1). The estimates
collection and reporting, it is difficult to present general waste, 48 million tonnes of unclassified landfilled14. In 2014, the formal waste sector was indicated that waste generation had increased by
a true picture of the size of the South African waste, and 1 million tonnes of hazardous waste13. estimated to be worth at least R15.3 billion in 3 million tonnes to 111 million tonnes since 2011.
waste sector. The 2011 National Waste Information This equates to a total of 108 million tonnes in 2011 revenue (DST 2014). The same sector employed The waste economy contributed R24.3 billion to
Baseline (NWIB) is the most current official source (DEA 2012). Figure 2 illustrates this breakdown as a close to 30 000 people, primarily in the recycling the South African GDP, provided 36 000 formal
of information used by national decision makers percentage of total waste. / reclamation sector, and supported between jobs and supported an estimated 80 000 informal
when presenting the state of waste and developing 60 000 and 90 000 livelihoods in the informal jobs/livelihoods.
plans and policies. sector (DST 2014). Capital investment from the
public sector has been and remains primarily in The South African government has recognised the
collection infrastructure (transport), aggregation, role that waste can play in creating jobs and socio-
and landfilling. At the time, the private sector economic opportunities, and in moving South Africa
invested considerably in material recovery, AWT towards a more resource efficient economy. This
Total: 108m tonnes / year and landfilling (DST 2014). is evident in a number of initiatives and legislative
reforms that have been proposed by government to
The 2012 NWIB estimated that only 10% of waste boost growth in this sector. However, more accurate
was recycled. However, it is estimated that 65% and updated waste figures will help policy makers
of the waste (approximately 38 million tonnes) is to make informed decisions, and assist the private
recyclable and could subsequently be diverted sector to assess the benefits and risks of investing in
from landfill and recovered to be reprocessed / the sector.
repurposed (DEA 2012). Based on global trends,
by diverting waste from landfill South Africa 2.2.1. Cost of landfilling in South Africa
could increase the revenue from this sector. In The cost of landfill disposal (gate fee charged per
2014, the DST’s Waste Research, Development tonne) is relatively low in South Africa compared
and Innovation (RDI) Roadmap estimated that an to benchmarks in the EU and other developed
additional R17 billion per year worth of resources economies. However, disposal costs are still regarded
could be unlocked if 100% of the identified 13 as a costly overhead for many waste generators.
waste streams15 could be beneficiated. However, Figure 3 provides the landfill gate fees for general
achieving the goal of the Roadmap by 2022 waste in the eight metropolitan municipalities in
(Scenario 316) would unlock R9.2 billion resource South Africa for 2017/2018, gathered via GreenCape
Figure 2: Classification of total waste generated in South Africa in 2011 value to the economy. engagements with the respective municipalities. The
Source: DEA (2012) large cost variance, although not in all cases, can
be attributed to limited management of the landfill
resulting in (artificially) deflated operational costs,
and / or not doing full cost accounting. Consequently,
gate fees are not fully reflective of the true cost
of disposal.
12
The national repository for waste information is currently available and is capturing data on a national scale.
13
Waste streams were grouped under ‘unclassified’ because it was impossible to distinguish between general and hazardous wastes due to companies using an older
categorisation system.
14
This does not take into account leakage, e.g. materials that enter oceans or are exported and are effectively ‘lost’ from the accounting system.
15
Municipal waste (non-recyclable portion); organic component of municipal waste; biomass waste from industry; construction and demolition waste; paper;
12
The national repository for waste information is currently available and is capturing data on a national scale. plastic; glass; metal; tyres; e-waste; slag; ash; and waste oils.
13
Waste streams were grouped under ‘unclassified’ because it was impossible to distinguish between general and hazardous wastes due to companies using an older 16
Achieving: 20% reduction in industrial waste and a 60% reduction in domestic waste
categorisation system.
11 Waste: Market Intelligence Report 2018 Waste: Market Intelligence Report 2018 12Total: 7.7m tonnes / year
28% Agriculture residues
22% Construction/Demolition
11% Commercial / Industrial
9% Non-recyclables
7% Metals
6% Municipal organics
4% Paper
4% Settled sewage sludge
3% Plastics
2% Glass
2% Volatile animal waste
1% Forestry residues
1% E-waste
Figure 3: Municipal landfill gate fees for general waste for eight metros in South Africa 2017/2018
Figure 4: Western Cape total waste characterisation – waste streams and proportions
Source: GreenCape
Source: DEDAT 201618
2.3. Western Cape market size Table 2: Total waste tonnages generated per district municipality / metro for 2016
As is the case in other provinces, one key driver The Western Cape generated an estimated 7.7 Source: DEDAT (2016), Stats SA 2016 Community Survey
for the increase in waste generation in the Western million tonnes of waste in 2016. Figure 4 and Table
Cape is population growth. The population of the 2 show the tonnages generated in the Western
Cape (DEDAT 2016). Annex A provides a more Tonnages19 Tonnages of
Western Cape has grown substantially over recent
detailed waste distribution by municipality. In Municipal Solid
decades and is expected to grow by an average Municipality Municipal Solid Commercial/ Population20
2012, compared to the other provinces of South Total Waste per per-
of 1.1% per year up to 2040 (WCG 2016). Table 1 Waste Industrial son per annum
illustrates this growth since 2001 and provides a Africa, the Western Cape had the second highest
projected population size for 2040. per capita MSW generated per year (675kg). City of Cape Town 2 762 100 951 600 3 713 700 4 004 793 0.7
Gauteng was the highest at 761 kg, and the lowest Cape Winelands 559 200 453 300 1 012 500 866 223 0.6
was Limpopo at 103 kg (DEA 2012).
Eden 332 500 606 100 938 600 611 278 0.5
West Coast 204 700 938 600 1 185 500 436 403 0.5
Table 1: Estimated population growth for the Western Cape Overberg 180 700 587 300 768 000 286 786 0.6
Central Karoo 40 900 43 080 83 980 74 247 0.6
Total 4 080 100 3 622 180 6 279 730 0.6
Year 2001 2011 2016 204017
The CoCT is the central hub for commerce and This is because primary agriculture is located
Population Size 4.5 m 5.8 m 6.3 m 8.1 m industry in the province and provides more than outside the CoCT and agricultural residues account
72% of its GDP (Quantec 2017). However, the city for 28% (2 million tonnes) of the overall waste
only generates a share of 26% (951 600 tonnes) of generated in the Western Cape21.
Growth % - 28% 9% 29% the total commercial and industrial waste, i.e. non-
household waste.
Source Strats SA 2011 Strats SA 2016 Strats SA 2016 Strats SA 2016
18
Western Cape Department of Economic Development and Tourism.
19
Figures taken from DEDAT 2016.
20
Based on StatsSA’s 2016 Community Survey.
17
As per Base Case scenario, reported in the Futures Cape Policy Research Paper (WCG 2016), which assumes no major policy changes / significant disruptions to 21
These figures do not necessarily mean that the wastes are landfilled or available for processing – some, such as certain agricultural residues, are often used on the
current trends. farm for soil fortification or animal rearing.
13 Waste: Market Intelligence Report 2018 Waste: Market Intelligence Report 2018 142.3.1. Cost of landfilling in Cape Town Government regards Operation Phakisa as a
2.4. Market size according to
Landfill costs increase annually due to the rising Landfill closures positive step to support the beneficiation of waste,
recycling industry associations and the diversion of waste from landfill. However, to
operating costs (logistics, labour and infrastructure) In September 2018 one of CoCT’s three landfills, Table 4 lists active industry associations and achieve the goals of Phakisa a substantial amount
of providing municipal waste services, together with Bellville South, will be closing permanently. their stream-specific estimates of tonnages of work and continued collaboration between
compliance costs associated with national legislation. However, the material recovery facility and generated and diverted for South Africa. government (national, provincial and local) and the
The CoCT has the highest landfill gate fees in South refuse transfer station situated nearby The table also provides two estimated tonnage private sector are needed.
Africa. This is expected to remain the case in the will continue as usual. figures available in the Western Cape. One
future with one of the three landfills (Bellville South)
is based on the proportion of the population Current legislation (MSA, MFMA) does not require
expecting to close in 2018. Figure 5 illustrates the rise
compared to other provinces, and the other is municipalities to divert waste from landfill, thus
in gate fees over the last five years, and provides a
based on the nominal output compared to other budgeting to implement the municipal focused
conservative projection for the next three years. The
provinces. (DEA 2012). intervention will be a challenge. The DEA will
projections are based on the inflation rate, and the
highest and lowest gate fee increases recorded over need to provide guidance to municipalities
the last five years. 2.5. Key highlights in 2017/2018 on new municipal waste management rules
Investors should take note of the other important and regulations, on how to access funding for
developments below. projects, and on appropriate cost structures that
take into account diversion from landfill, in order
2.5.1. Operation Phakisa to safeguard revenue generation. This support
The DEA hosted a five-week chemical and waste is required, given that many municipalities still
economy Phakisa between July and August 2017 struggle to provide basic services.
to discuss the state of waste in the country and to
identify key work areas. The participation by business, 2.5.2. Industry waste management plans
government and civil society identified 20 key An initial NEMWA Section 28 notice to the paper
initiatives across four work streams. Table 5 provides and packaging, electrical and electronics, and
a description of each of the 20 initiatives, coupled lighting industries to prepare and submit IndWMPs
with estimates of the projects’ job creation, coupled for approval in 2016, was retracted as a result of
with estimates of the projects’ job creation, GDP industry feedback. A new notice was published on
contribution and waste diversion potential. 06 December 2017 (GN 1353 of 2017) requiring the
said industries to prepare and submit IndWMPs to
Collectively, additional outcomes of the the Minister for approval within by 06 September
initiatives include: 2018. IndWMPs are a key milestone towards
ensuring that producers in the respective industries
■ Landfill diversion: 20 million tonnes per practise extended producer responsibility.
year (75% industrial and 50% municipal)
■ Jobs created: 127 000 (45 000 direct and The IndWMPs are intended to:
82 000 indirect)
■ GDP contribution: addition R11.5 billion ■ reduce pollution and ecological degradation;
per year ■ incorporate the informal sector into the waste
■ SMMEs created: 4 300 management;
■ unlock funds to support the waste sector;
To implement all the initiatives, R9.1 billion ■ create employment; and
Figure 5: General and hazardous waste gate fees for the City of Cape Town (2007-2021) bring about transformation.
of investment over the next five years is required. ■
Source: GreenCape, based on CoCT gatefees since 2013 Of this, it is expected that R7.3 billion can be
attracted from private sources, while the remaining Please see Section 3.2 for more information
R1.8 billion will be used to provide critical on what is required of producers.
infrastructure and awareness campaigns. This will
have to be financed from public funds.
15 Waste: Market Intelligence Report 2018 Waste: Market Intelligence Report 2018 16Table 3: Industry association and recyclables processed / available – 2016 Table 4: Description of the 20 Phakisa initiatives and their potential impacts
Material in Collected/ GDP Annual waste
Jobs Created
circulation diverted from Tonnes available for recycling Theme Initiative contribution diverted (est
(est)
(imported/ landfill (est) tonnes)
manufactured) Increase ash uptake for alternate
WC 1 24 500 10 300 000
Name of the industry Industry building materials
Bulk industrial waste
association Association Ash, slag and Accelerate innovation and
Tonnes % SA Population- National gypsum 2 1 000 500 000
commercialise existing R&D
based asset Out-put-
R7.4 billion
est. based est. 3 Export ash and ash products 1 000 4 000 000
4 Zero sewage sludge to land 29 100 000
PET PET Biomass waste
Beverage (PET Recycling 164 063 90 749 55% 73 314 8 252 10 244 Towards zero meat production
5 890 800 000
bottles Company) waste to land(fill) by 2023
PET No formal industry ntroduction of an e-waste levy to
77 20622 0 0% 77 206 8 690 10 788 6
Thermoform association increase collection rate
E-waste
177 Unlocking government ICT legacy
PE-LD 277 008 100 000 36% 19 924 24 733 7
008 volumes
POLYCO 113 Achieving minimum of 50% of 15 100 (Direct) R2.1 billion
Plastics
Municipal
PE-DH (Polyofein Recycling 171 554 58 500 34% 12 726 15 797
Company) 054 Organic 8 households separating at source
by 2023 21 000 3 700 000
PP 90 308 20 500 23% 69 808 7 858 9 754 (Indirect)
Introduction of MRFs and
Packaging 9 pelletising plants to increase
SAVA
PVC (South African Vinyl Unknown recycling rates
Association)
Produce building aggregates and
Construction
PASA 10 construction inputs from rubble
PS (Polystyrene 67 712 5 261 8% 62 451 7 030 8 726 and demolition
Association of SA)
and glass
Developing capacity through a
Product design and waste minimisation
PRASA 646
Paper (Paper recycling 2 046 784 1 400 000 68% 72 803 90 373 specialised programme which
784 11
Association of SA) upskills agri-stakeholders to R1.2 billion
Food minimise food loss 287 245 000
TGRC 413 (loss avoided)
Glass (The glass recycling 3 183 908 2 770 000 87%
908
46 590 57 834
Consumer awareness campaign to
company) 12
use and consume ugly food
SAEWA
Other (South African E-waste Compilation/update of packaging
Alliamce) 624 13
Metal * 3 121 000 2 497 000 80% 70 238 87 189 design guidelines
000
Aluminium Collect-A-Can Packaging Formalising the packaging 2 464 R36 million 146 000
14 industry producer responsibility
SAEWA plans
(South African E-waste
Alliamce) Refuse Derived Establish refuse derived fuel
E-waste* 322 000 38 000 12% 284 000 31 968 39 682 15 305 R80 million 120 000
Fuel plants across South Africa
EWASA
(E-waste association Establish a refrigerant reclamation ~2 000
of SA) 16
Harmful and reusable cylinder industry (Direct)
225 000
Chemicals ~1 000 R540 million
C hemi c al s
ORASA cylinders
Organic Recyclers (Organic Recycling Not Applicable Imports Ban import of harmful chemicals, (Indirect)
Association of SA) 17
eg. leaded pain/pain pigments
No industry
Tyres association23
270 000 189 000 70% 81 000 9 117 11 318 Dangerous collect and dispose stockpiles
chemical 18 of harmful substances (esbestos, NA NA NA
stockpiles mercury)
Sources: Most recent industry association annual reports and direct engagements during 2017 SMME development 19 Coordinate SMME development opportunities across initiatives
Awareness 20 Roll out national awareness campaigns
22
Information provided by PETCO, which is actively seeking solutions for the material.
*
Based on 2017 MIR figures
23
In October 2017, the Minister of Environmental Affairs withdrew the IndWMP of the Recycling and Economic Development Initiative of South Africa(REDISA).
In the meantime, the Waste Management Bureau will manage waste tyres until a new plan has been put in place. The Minister has since released a call call for new
plans. The figures provided are therefore based on the 2017 MIR.
17 Waste: Market Intelligence Report 2018 Waste: Market Intelligence Report 2018 18You can also read