Ecodesign Impact Accounting - European Commission
←
→
Page content transcription
If your browser does not render page correctly, please read the page content below

Ecodesign Impact Accounting
                OVERVIEW REPORT
                2018

                Prepared by
                VHK for the European Commission
                December 2018 (rev. Jan. 2019)

                 The information and views set out in this study are those of the author(s) and
                 do not necessarily reflect the official opinion of the European Commission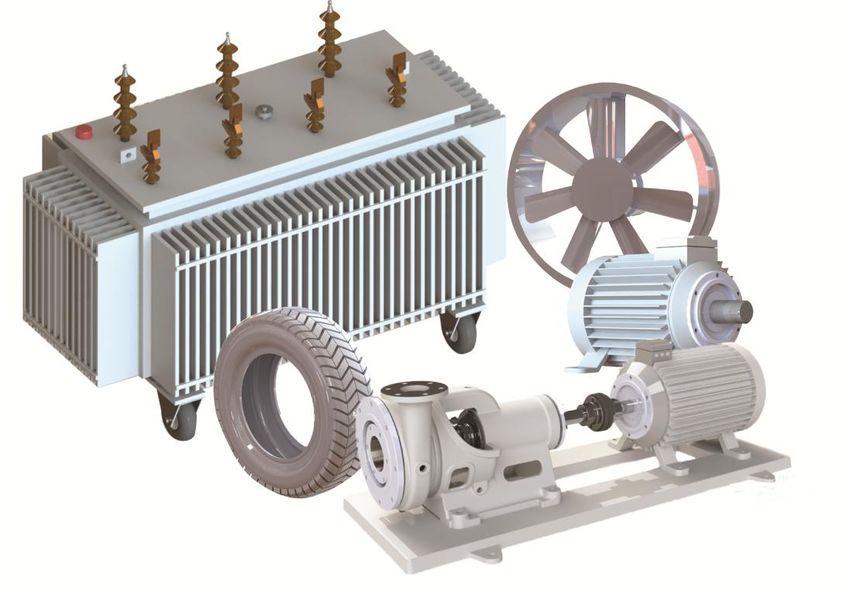
European Commission                       Ecodesign Impacts Accounting, Overview Report 2018

Prepared by:

Van Holsteijn en Kemna B.V. (VHK)
Rotterdamseweg 386 B-18,
2629 HG Delft, The Netherlands
www.vhk.nl
Authors: Leo Wierda, René Kemna, Sanne Aarts (VHK)

Date: 16 December 2018, revision January 2019

Prepared for the European Commission, DG Energy, unit C.3
Contact person: Juan MORENO-ACEDO
SPECIFIC CONTRACT No ENER/C3/2013-523/09/FV2015-543/SI2.722015

Status: Annual Overview Report 2018

This report was ordered and paid for by the European Commission, Directorate-
General for Energy.
The information and views set out in this report are those of the author(s) and do not
necessarily reflect the official opinion of the Commission. The Commission does not
guarantee the accuracy of the data included in this study. Neither the Commission nor
any person acting on the Commission’s behalf may be held responsible for the use
which may be made of the information contained therein.
The data in this report and in other associated deliverables have been retrieved and
analysed to the best of the author’s ability and knowledge. However, many forward
looking statements are implicitly or explicitly presented and neither the contractor nor
the author personally assume any liability for damages, material or immaterial, that
may arise from the use of these documents and the data therein.

© European Union, January 2019
Reproduction is authorised provided the source is acknowledged.

More information on the European Union is available on the internet
(http://europa.eu).

                  Building Installation Products
                                           1
European Commission                      Ecodesign Impacts Accounting, Overview Report 2018

                                     Contents
EIA Summary                                                               (page 8
- Emissions
- User Expense
- Revenues and Jobs
- Material Resources

Building Installation Products                                            (page 14)
- General information on space heating and cooling
- Central Space Heating (combi-boilers)
- Water Heating (dedicated water heaters and combi-boilers)
- Solid Fuel Boilers
- Local Space Heaters
- Air Heating and Cooling (Air Heaters, Air Conditioners, Chillers)
- Circulators
- Room Air Conditioners
- Ventilation Units
- Lighting
Electronic Products                                                       (page 36)
- Electronic Displays
- Set Top Boxes
- Sound and Imaging Equipment (video)
- Computers
- Enterprise Servers
- Imaging equipment (copiers, printers)
- (Networked) Standby
- External Power Supplies
- Uninterruptible Power Supplies
Appliances                                                            (page 48)
- Household Refrigeration
- Commercial Refrigeration
- Professional Refrigeration (cabinets, process chillers, condensing units)
- Cooking Appliances (ovens, hobs, range hoods)
- Coffee Makers
- Washing Machines
- Dish Washers
- Laundry Driers
- Vacuum Cleaners
Industrial and Other Products                                             (page 58)
 - Industrial Fans
 - Electric Motors
 - Water Pumps (clean water)
 - Compressors (standard air)
 - Distribution Transformers
 - Tyres

Annex: Key Facts summary tables                                           (page 68)

                  Building Installation Products
                                          2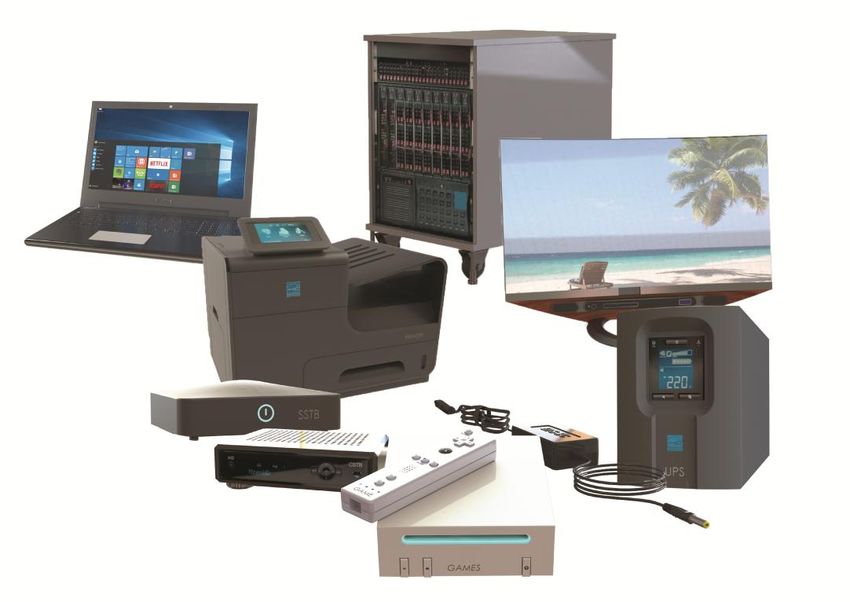
European Commission                                                    Ecodesign Impacts Accounting, Overview Report 2018

Abbreviations
a               annum
AEC             Annual Electricity Consumption
BAU             Business As Usual (scenario without measures)
bn              billion (109)
CR              Commission Regulation
CDR             Commission Delegated Regulation
ECO             Scenario with Ecodesign and/or Labelling applied
EEI             Energy Efficiency Index
EIA             Ecodesign Impact Accounting
EU-28           European Union of current 28 member states
eq.             equivalent
GHG             Greenhouse gas
HT              High temperature
IA              Impact Assessment
LT              Low temperature
M               Mega (106)
MEI             Minimum Efficiency Index
mln             million (106)
MT              Medium temperature
SRI             Self Regulatory Initiative
t               ton (1000 kg)
T               Tera (1012)
VA              Voluntary Agreement
WD              Working Document
Wh              Watt hour

Facts & Figures graphics
At the beginning of each product sheet a ‘Facts & Figures’ graphic provides key
information on the product group. It shows the sales, stock, energy consumption
(primary, electric or fuel), greenhouse gas emissions, consumer expenses and
business revenues for years 2010 and 2030. The values inside the bar-graphs are
those from the EIA ECO-scenario, i.e. they include the effects of Ecodesign and Energy
Labelling measures. The difference with the (BAU) scenario without these measures
are shown in italic font next to the bar-graph. These figures indicate the savings
obtained due to the measures.

                                 FACTS & FIGURES
                                                                                                           EFFECT
         Product group
                                 Product: [CHC] Central Heating Combi, space heating
                                 Measure(s): CR (EU) No. 813/2013 and CDR (EU) No. 811/2013
 Regulation reference(s)         sales (x1000 units)               stock (x1000 units)         primary energy [TWh/a]
                                                                                                                            Savings due to
 ECO-scenario values,                                                                         -53                           the measures
 considering measures              6,987    9,508
                                                                                                                     -766
                                                                   111,531 148,980                  2265     1030
                                    2010      2030                  2010      2030                  2010      2030
                                    GHG-emission                   consumer expenses                  revenues
                                    [Mt CO2 eq./a]                       bn €

                                                                                     -44                             +48
                           -11                                -2
                                                       -162                                   +1
                                    466      196                    176      253                     44       106
                                    2010      2030                   2010     2030                  2010      2030

                     Building Installation Products
                                                                        3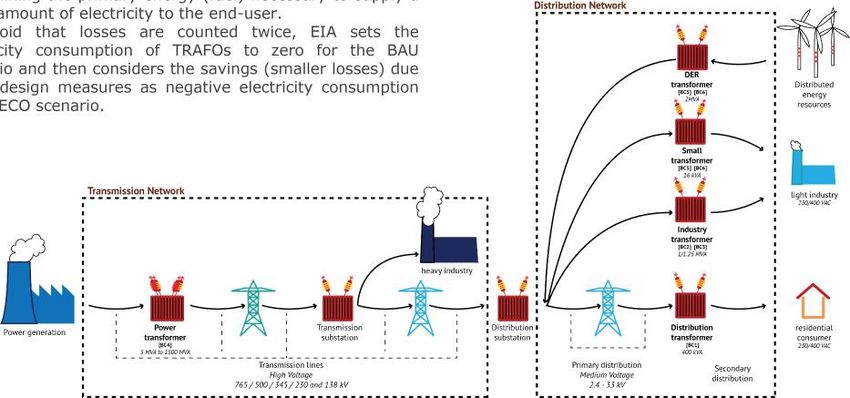
European Commission                               Ecodesign Impacts Accounting, Overview Report 2018

Executive Summary
The European Commission has identified a need to systematically monitor and report
on the impact of Ecodesign, Energy Labelling, Energy Star and Tyre Labelling
measures, including potentially new forthcoming actions, with a view to improve its
understanding of the impacts over time as well as its forecasting and reporting
capacity.
In a previous study 1 that ran from September 2013 to November 2015 an Ecodesign
Impact Accounting (EIA) methodology was developed, providing a practical tool to
achieve those goals. That study also applied the accounting method to the existing
Ecodesign preparatory studies and impact assessment reports. The results were first
published in May 2014 2, and updated and extended in December 2015 3.
The accounting covers projections for the period 2010-2050, with inputs going as far
back as 1990 and earlier. Studies of over 35 product groups with over 180 base case
products have been harmonised and complemented to fit the methodology. For the
period up to 2025-2030 inputs were derived from the available studies. The period
beyond 2025-2030 is an extrapolation of the existing trend without any new
measures, i.e. it is not in the scope of this study to develop new policies.
Projections use two scenarios: a ‘business-as-usual’ (BAU) scenario, which represents
what was perceived to be the baseline without measures at the moment of the (first)
decision making, and an ECO scenario that is derived from the policy scenario in the
(most recent) studies which comes closest to the measure taken.
The Ecodesign Impact Accounting is being continued in the current study 4 (EIA II) for
a period of three years starting from December 2015. The interim report of June 2016
updated the accounting to the information available on 1st January 2016 5, and also
contained a first issue of the special report on material resources contained in EIA-
products 6. The latter report is based on the Bills-of-Materials of the Ecodesign
preparatory studies. The product weights per material category are multiplied by the
EIA-sales or –stock to obtain the total amounts of material contained in EIA products
sold in 2010 or installed in 2010. These amounts are compared to the EU-28 material
consumptions per category.

1
    SPECIFIC CONTRACT No ENER/C3/412-2010/FV575-2012/12/SI2.657835 (previous EIA study)
2
    ECODESIGN IMPACT ACCOUNTING Part 1 – Status Nov. 2013, VHK May 2014 for the European
      Commission,
      https://ec.europa.eu/energy/sites/ener/files/documents/2014_06_ecodesign_impact_accounting_part1.
      pdf
3
    ECODESIGN IMPACT ACCOUNTING Part 2 - Status May 2015, VHK December 2015 for the European
      Commission
4
    SPECIFIC CONTRACT No ENER/C3/2013-523/09/FV2015-543/SI2.722015 "Extended impact accounting of
      Ecodesign, Energy Label and Tyre labelling legislation as well as actions under the Energy Star
      programme (EIA II)" (current ongoing EIA II study)
5
    ECODESIGN IMPACT ACCOUNTING – Status Report January 2016 – VHK for the European Commission,
      June 2016,
      https://ec.europa.eu/energy/sites/ener/files/documents/Ecodesign%20Impacts%20Accounting%20%20
      -%20status%20January%202016%20-%20Final-20160607%20-%20N....pdf
6
    Special Report Material Inputs for Production, pertaining to the study on Ecodesign Impact Accounting,
      VHK for the European Commission, June 2016,
      https://ec.europa.eu/energy/sites/ener/files/documents/EIA%20Special%20Report%20Material%20Con
      sumption%2020160607.pdf

                        Building Installation Products
                                                      4
European Commission                       Ecodesign Impacts Accounting, Overview Report 2018

The December 2016 EIA reporting took into account the information available on 1st
September 2016 and consisted of:
   -   EIA Annual Status Report 2016
   -   EIA Annual Overview Report 2016
   -   Special Report on Materials in EIA products (issue of June 2016)
   -   EcoReport for the average EIA product
   -   related Excel files
The December 2017 EIA reporting took into account the information available on 1st
October 2017 and provided updates for:
   -   EIA Annual Status Report (2017 issue)
   -   EIA Annual Overview Report (2017 issue)
   -   related Excel files
As further detailed in the Status Report, the 2017 EIA issue differs from the 2016
issue mainly as regards:
   -   the interaction between Ventilation Units (VUs) and Space Heating (SH). In the
       new implemented methodology, heat savings due to VUs are handled as a load
       reduction (less heat output required) for SH-appliances;
   -   light sources: data from the Model for European Light Sources Analysis,
       MELISA, and from the Commission Working Document of October 2017 have
       been inserted in EIA;
   -   electric motors: data from the October 2017 Impact Assessment have been
       inserted in EIA.
The December 2018 EIA reporting takes into account the information available on 1st
October 2018 and provides updates for:
   -   EIA Annual Status Report (2018 issue)
   -   EIA Annual Overview Report (2018 issue; this report)
   -   related Excel files
As further detailed in the separately issued Status Report, the 2018 EIA issue differs
from the 2017 issue mainly as regards:
   -   Update of product data, following review studies and 2018 impact assessments
       accompanying Commission proposals for new regulations: light sources,
       electronic displays, external power supplies, enterprise servers and data
       storage products, (household) refrigerating appliances, and tyres;
   -   Price level: all monetary data are now expressed in 2015 euros (was 2010
       euros in previous EIA issues);
   -   Rates: nominal prices for energy and consumables have been updated with the
       latest available data from Eurostat, the Oil Bulletin and other sources. Real
       rates (inflation corrected to 2015 euros) are derived from the nominal rates, up
       to year 2018, using Eurostat’s inflation index. Projections of real energy rates
       beyond 2018 now assume an annual escalation (on top of the inflation) of 1-
       2%/a depending on the energy type (was 4%/a for all types in earlier EIA
       issues). A new set of rates has been introduced for the tertiary/services sector.
       These changes bring projected EIA rates closer to the rates used in the PRIMES
       2015f reference scenario;

                  Building Installation Products
                                           5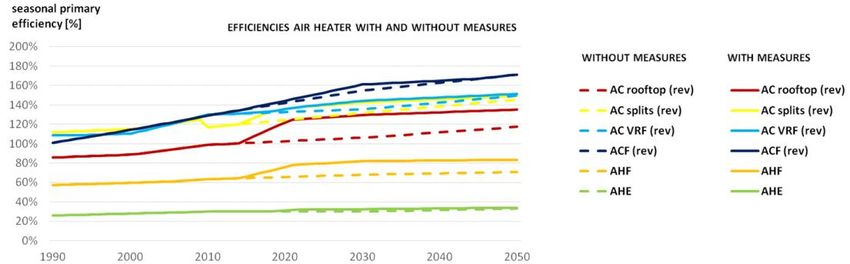
European Commission Ecodesign Impacts Accounting, Overview Report 2018
- Final Energy: an accounting of final energy has been added to EIA (electricity
plus direct fuel used as input to the products).
- Primary Energy Factor (PEF): in the light of ongoing discussions, changes have
been implemented in EIA to facilitate the use of different PEFs, variable with
the years if desired. However, on request of the Commission this report
continues to use PEF=2.5 for all years (inverse factor CC=40% in EIA,
representing the efficiency of electricity generation and distribution).
The Status Report is the main EIA document, containing full and detailed data and a
description of the EIA-methodology. It is mainly organized per parameter, e.g. sales,
stock, load, efficiency, energy, emissions, prices, expenses. The Status Report is
intended for insiders/experts and for analysts requiring detailed figures.
The Overview Report (this document) addresses a wider, non-technical audience and
aims at making the EIA data more easily accessible.
The first part of the Overview Report summarizes the main EIA results, presenting the
combined impact of all EIA products on EU energy consumption, emissions, user
expenses, business revenues and jobs. This section also includes the main results
from the Special Report on Materials and the EcoReport for the Average EIA product
(not updated in 2018).
The second part of the Overview Report is organized per product, giving a quick
overview and discussion of the key facts and figures for that product, and describing
the product and its most relevant features.
EIA Results summary
In 2015 the products included in the accounting represent approximately 39 200 PJ
(937 Mtoe) of direct and indirect primary energy consumption. This is 58% of total
EU-28 gross energy consumption in 2015 (1627 Mtoe).
For these products the following main results were obtained for the EU-28 in 2020
(ECO versus BAU):
Primary energy saving 6292 PJ (150 mtoe, 1748 TWh), i.e. a saving of 15%
versus Business-As-Usual;
Of this, 3851 PJ (92 mtoe, 1070 TWh) is primary energy saving due to saving
428 TWh (37 mtoe, 1540 PJ) of electricity, and 2441 PJ (58 mtoe, 678 TWh) is
direct fuel saving. The sum of electricity saving and direct fuel saving (‘final’
energy saving) is 1099 TWh (95 mtoe);
306 Mt CO2 equivalent (7% of 2015 EU-total) less greenhouse gas emissions;
2545 million m³ drinking water and 0.4 Mt printer paper saving; avoided 149 kt
SO2 equivalent direct NOx-emissions, 189 kt direct CO-emissions, 13 kt direct
OGC-emissions and 13 kt direct PM-emissions;
€ 63 bn net saving on consumer expenditure (€ 124 bn energy saving, € 12
consumables saved, € 74 bn extra acquisition costs);
€ 66 bn extra revenue for industry, wholesale, retail and installation sector;
0.93 million extra direct jobs for industry, wholesale, retail and installation
sector.
Nearly 58% of the 2020 final energy savings come from the residential sector,
26% from the tertiary sector, 10% from industry, 3% from transport, and 2%
from other sectors.
Building Installation Products
6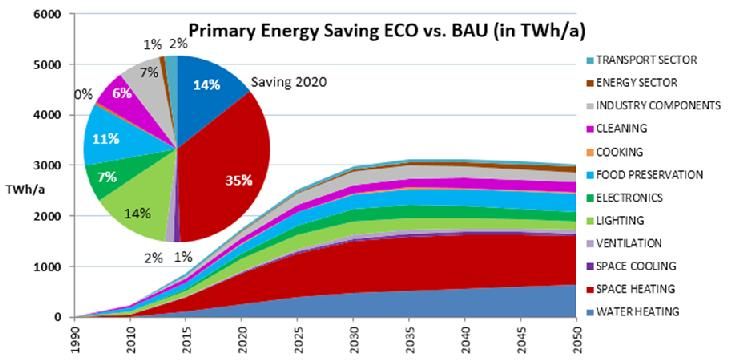
European Commission                        Ecodesign Impacts Accounting, Overview Report 2018

For 2030 these results increase by over 60%. The monetary consumer savings on
expenditure increase by a factor 2.4, also due to rising energy prices. The projections
for the period 2030-2050 show that without new measures the pace of improvements
slows down and eventually evens out.
The 2020 savings represent approximately 9% of the current EU energy consumption
total (1627 mtoe in 2015) and 7% of the carbon emission total (4319 MtCO 2 eq. in
2015). In 2030 this is projected to grow to 16% of EU energy consumption and 11%
of carbon emission totals. The consumer’s monetary saving is 0.4% (in 2020) and 1%
(in 2030) of the current GDP of the European Union (14800 billion euros in 2015).

For further details see the EIA Summary in the first part of this report.

                  Building Installation Products
                                            7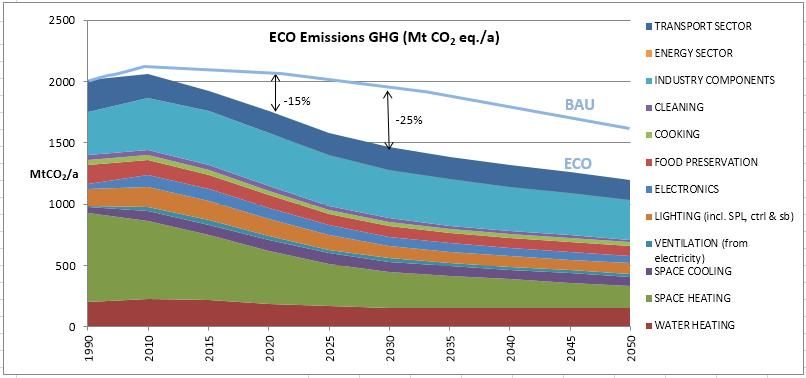
EIA Summary, Primary Energy
                                EIA Summary - Primary Energy
PRIMARY ENERGY 2010
In 2010 the products included in the accounting represent            As regards the sector subdivision of primary energy: 36% is
40 580 PJ (969 Mtoe) of direct and indirect primary energy           consumed for the residential sector, 32% for the tertiary
consumption. This is 55% of total EU-28 gross energy                 sector, 21 % for industry, 6% for transport (rolling
consumption in 2010 (1765 Mtoe, source: Eurostat Energy              resistance losses for tyres only), and 4% for other (e.g.
Balance Sheets). The major energy consumers are Space                agriculture, forestry, fishing)
Heating (31% of total), Industry Components (24%), Water
Heating (11%) and Lighting (9%).

PRIMARY ENERGY SAVING 2020 AND 2030                                  Nearly 58% of the 2020 savings comes from the residential
                                                                     sector, 27% from the tertiary sector, 11% from the industry
In 2020 the primary energy savings due to Ecodesign and              sector and 4% from transport and other sectors (agriculture,
Energy Labelling measures (ECO 2020 versus BAU 2020) is              forestry, tyres).
6292 PJ (150 mtoe, 1748 TWh) , i.e. a saving of 15% versus
BAU 2020 for the average product in scope.                           In 2030 the primary energy savings increase to 10 758 PJ
                                                                     (257 mtoe, 2988 TWh), i.e. a saving of 24% versus BAU
Of this, 3851 PJ (92 mtoe, 1070 TWh) is primary energy               2030 for the average product.
saving due to saving 428 TWh (37 mtoe, 1540 PJ) of
electricity, and 2441 PJ (58 mtoe, 678 TWh) is direct fuel           The 2020 savings represent 8.5% of the 2010 total EU-28
saving. The sum of electricity saving and direct fuel saving         gross energy consumption (1765 mtoe in 2010). In 2030
(‘final’ energy saving) is 1099 TWh (95 mtoe).                       this is projected to grow to 12.3%.

ASSUMPTIONS
                                                                     -    Product interactions assessed, e.g. Ventilation Units
-    Net caloric value (NCV) of fuels used, in line with
                                                                          have own electricity savings but also lead to savings on
     Eurostat;
                                                                          Space Heating;
-    40%     efficiency   for   electricity   generation   and
                                                                     -    Double Counting issues addressed for Motors, Fans,
     distribution;
                                                                          Circulators, Condensing Units, External Power Supplies
-    1% load reduction per year for space heating (better                 and Distribution Transformers. Full data are reported at
     insulation, ventilation);                                            the lowest level. Double Counted amounts are removed
-    Increase in load where appropriate (trend towards                    from the aggregated totals.
     more and bigger appliances, lamps, computers,
     displays);

                                 Building Installation Products
                                                                 8
EIA Summary - Emissions
GHG EMISSIONS
Greenhouse Gas (GHG) emissions in EIA are the sum of fuel          2020) is 306 MtCO2eq, i.e. a saving of 15% versus BAU
related emissions and refrigerant losses, expressed in their       2020 for the average product. The reduction is 6.4% of the
Global Warming Potential (GWP100 in Megatonnes CO2                 EU total emissions in 2010.
equivalent, MtCO2eq).
                                                                   In 2030 the emission reduction increases to 496 MtCO2eq,
In 2010 the products included in the accounting were               i.e. a saving of 25% versus BAU 2030 for the average
responsible for 2062 MtCO2eq of GHG-emissions. This is             product. The reduction is over 10% of the EU total in 2010.
43% of the total EU-28 emissions of 4777 MtCO2eq (source:
EEA 2018, Annual European Union greenhouse gas inventory           For electricity the GWP (in kgCO2equivalent/kWh) is
1990–2016, excl. LULUCF).                                          assumed decreasing from 0.41 in 2010 to 0.34 in 2030. For
                                                                   other fuels and for refrigerants the GWP is taken constant
In 2020 the reduction in GHG-emissions due to Ecodesign            over the years, see details in the EIA Status Report.
and Energy Labelling measures (ECO 2020 versus BAU

OTHER EMISSIONS
Other direct emission reductions in 2030:
        -    NitrogenOxides (NOx):                  -233 ktSO2equivalent (3% of EU-total)
        -    CarbonMonoxide (CO):                   -568 kt (2.0% of EU total)
        -    Organic Gaseous Carbon (OGC):          -25 kt (0.2% of EU-total)
        -    Particulate Matter (PM):               -43 kt (1.6% of EU total)
Direct emissions are intended here as those that occur during the use of products burning fuels (mainly for heating). This does
not include emissions during the generation of electricity or emissions during non-use phases, e.g. manufacturing, distribution,
end-of-life. Direct emissions are included in EIA as far as available data permitted.

                                Building Installation Products
                                                               9
EIA Summary - Expenditure
COSTS
The User Expenses for EIA products include Acquisition costs Energy costs are computed multiplying the energy
(purchase and installation) and Running costs (energy, consumption by the electricity- or fuel-rate. Separate rates
consumables and maintenance). All prices and costs are in are used for the residential, tertiary and industry sectors.
2015 euros. Until 2018, rates are based on Eurostat data; in later years a
1-2% increase per year is assumed. Consumable costs are
Acquisition costs are computed multiplying a unit product computed multiplying the consumable consumption (paper,
price by the number of products sold in a given year. For toner, water, detergents, vacuum cleaner bags) by a unit
most products, prices in EIA are defined in function of the price. Maintenance costs are computed multiplying the
product efficiency. In the ECO-scenario the average product maintenance cost per product per year by the quantity of
efficiency is typically higher, leading to a higher product products installed (stock) in the EU-28 in a given year. In
price than in the BAU scenario. Prices cover purchase and EIA there are no differences in maintenance costs between
installation and include 20% VAT for residential users. the BAU and ECO scenarios.
EXPENSE AND SAVINGS
In 2010, users spent 1286 billion euros for EIA-products, of saving is 0.4% (in 2020) and 1% (in 2030) of the current
which 435 bn for acquisition, 735 bn for energy, 59 bn for GDP of the European Union (14800 billion euros in 2015).
maintenance and 57 bn for consumables.
In 2030, the largest contributors to user expense savings
Without measures, by 2020 this would increase to 1475 bn are Cleaning (30 bn euros), Water-Heating (23), Lighting
euros, but due to Ecodesign and Labelling regulations this is (23), Food preservation (22) and Electronics (21), followed
expected to be limited to 1412 bn euros. The saving of 63 bn by Industry components and Space-Heating (14 bn euros
is the balance of 74 bn euros additional acquisition costs (for each) (graph at bottom of page).
better products) and 136 bn euros savings on costs for The savings strongly depend on the escalation rate for
energy and consumables (e.g. 2545 million m³ drinking energy prices. E.g. changing this rate from the current 1-
water and 0.4 Mt printer paper saving). By 2030 the total 2%/a to 4%/a, Space-Heating becomes the largest expense
expense savings are expected to increase to 152 bn euros, saver in 2030 (42 bn euros, not shown in graph).
also due to rising energy prices. The consumer’s monetary
350 350
TRANSPORT SECTOR
Additional Acquisition (ECO-BAU, bn €/a) TRANSPORT SECTOR
SAVED Energy Costs (BAU-ECO, bn euro/a)
ENERGY SECTOR
300 300
ENERGY SECTOR
INDUSTRY COMPONENTS
INDUSTRY COMPONENTS
250 250 CLEANING
CLEANING
COOKING COOKING
200 200
FOOD PRESERVATION FOOD PRESERVATION
bn €/a € bn/a
ELECTRONICS
150 ELECTRONICS
150
LIGHTING (excl. SPL & ctrl) LIGHTING (incl. SPL,ctrl,sb)
100 VENTILATION
100 VENTILATION (elec)
SPACE COOLING
SPACE COOLING
50 50
SPACE HEATING
SPACE HEATING
WATER HEATING
0 WATER HEATING
0
1990
2010
2015
2020
2025
2030
2035
2040
2045
2050
1990
2010
2015
2020
2025
2030
2035
2040
2045
2050
User expenditure
ECO scenario and saving vs. BAU 2030, in bn. €
TRANSPORT SECTOR 170
ENERGY SECTOR 27 1
INDUSTRY COMPONENTS 204 14
CLEANING 85 30 ECO
COOKING 43 0 saving
FOOD PRESERVATION 53 22
ELECTRONICS 316 21
LIGHTING 67 23
VENTILATION 124 2
SPACE COOLING 71 3
SPACE HEATING 324 14
WATER HEATING 113 23
0 50 100 150 200 250 300 350 400
Building Installation Products
10EIA Summary – Business revenue & jobs
REVENUES AND JOBS
The unit product price in EIA is split in revenue shares for For industry the jobs include OEM’s and industry services.
business sectors: industry, wholesale, retail, installation (and Direct jobs means jobs in the value-added chain. Indirect
VAT). The total EU-28 revenues per sector are derived employment effects may be a factor 3 to 5 higher, but no
multiplying the total acquisition costs by the sector share. In consensus agreed factor is available.
general, in the ECO-scenario, the products sold have a
higher average efficiency, a higher price and therefore lead In 2020 the additional business revenue due to Ecodesign
to higher business revenues than in the BAU-scenario. and Energy Labelling measures is 66 billion euros and this
can increase to 91 billion euros by 2030. The related jobs
The direct sector jobs related to EIA products are derived increase by more than 930 thousand in 2020 and by around
dividing the revenue by a revenue per employee. The latter 1.26 million in 2030.
values differ per sector (see details in the Status Report).
Total Revenue by functional group (in bn €)
1990 2010 2020 2030
BAU BAU ECO inc BAU ECO inc BAU ECO inc
WATER HEATING 15 21 21 0 23 34 10 25 38 13
SPACE HEATING (excl. reversible AC) 43 69 70 1 83 117 34 96 151 55
SPACE COOLING 3 17 17 0 27 28 1 34 35 1
VENTILATION 35 83 83 0 93 96 2 105 107 2
LIGHTING 9 18 18 0 22 22 0 20 19 -1
ELECTRONICS 33 146 146 0 162 162 0 206 207 0
FOOD PRESERVATION 12 13 14 1 13 16 2 14 17 3
COOKING 11 16 16 0 18 19 1 18 19 1
CLEANING 11 23 25 2 32 36 4 37 39 3
INDUSTRY COMPONENTS 8 15 15 0 18 21 3 20 23 3
ENERGY SECTOR 3 5 5 0 6 7 1 8 9 1
TRANSPORT SECTOR 22 28 29 1 36 44 8 46 57 10
TOTAL in bn euros 205 453 458 5 534 600 66 629 720 91
Total Revenue by sector (in bn €)
1990 2010 2020 2030
BAU BAU ECO inc BAU ECO inc BAU ECO inc
Industry 83 205 208 3 239 270 31 284 326 41
Wholesale 15 33 33 0 39 46 7 45 55 10
Retail 41 87 89 2 104 115 11 126 141 15
Installation 36 76 76 0 88 105 17 98 123 25
Maintenance 30 53 53 0 64 64 0 75 75 0
TOTAL in bn euros 205 453 458 5 534 600 66 629 720 91
TOTAL direct jobs by sector (in 1000 jobs)
1990 2010 2020 2030
Sector BAU BAU ECO inc BAU ECO inc BAU ECO inc
Industry (incl. OEM & business services) 1532 3793 3843 50 4429 5009 579 5265 6030 765
Wholesale 54 121 122 2 145 171 25 165 203 37
Retail 638 1348 1379 31 1607 1779 172 1947 2174 227
Installation 333 700 702 2 815 970 155 912 1142 230
Maintenance 278 487 488 0 590 591 1 695 696 1
TOTAL in 1000 jobs 2835 6449 6534 86 7587 8519 933 8985 10245 1260
Building Installation Products
11EIA Summary – Material Resources
MATERIAL IN EIA PRODUCTS
In the Ecodesign preparatory studies, Bills-of-Materials The total weight of EIA-products sold in 2010 is 14.6 Mt.
(BoM) have been defined for typical products. Multiplying the This is 4.6% of the total EU consumption of plastics, metals,
BoM weights per material category (metals, plastics, glass, cardboard and rubber. The ‘heaviest’ product groups
electronics, etc.) by the EIA-sales or –stock, the total are Tyres (3075 kt, 21% of total), Household Refrigerators
amount of materials contained in sold or installed products is (1204 kt, 8%) and Washing Machines (952 kt). Ferrous
obtained. Summing the contributions of all products, the metals (galvanized steel sheet, cast iron, steel tubes and
total material in all EIA-products is derived, subdivided in profiles, stainless steel) represent 46% of the total weight.
material categories. Different from the situation for other Plastics (bulk and technical) account for 14%, and non-
EIA data, material resource data are not a time series, but ferrous metals (e.g. aluminium, copper) for 8%. The
for one given year (around 2010). ‘miscellaneous’ category mainly consists of rubber for the
tyres (natural and synthetic). 3075
For details see the ‘EIA Special Report on Materials’.
Amount of material per category contained in EIA-products sold in EU-28 in 2010
kton/a weight composition (sales 2010)
1,200
Tyres
Household 3075 kt PACKAGING [kt]
Total 14.6 Mt
Refrigeration (21%) MISCALLANEOUS
1,000 4.6% of EU-total
1204 kt Washing
[kt]
ELECTRONICS [kt]
(8%) Machines COATING [kt]
800
952 kt
NON-FERRO [kt]
(7%)
600 FERRO [kt]
TEC PLASTICS [kt]
400
BLK PLASTICS [kt]
200
-
SFB
UPS
FAN
CIRC
STB
AHC
LS_ECO
RAC
VIDEO
TYRES
E6/VU
TRAFO
ES
EP
LH
PC
WH
DP
PF
LD
CHC
BC
RF
VC
CH
CF
CA
WM
DW
MT
WP
CP
CM
PACKAGING
765 BLK PLASTICS
5% [kt]
MISCELLANEOUS
Rubber 75% 1,399
[kt]
Glass 15% 10%
3,689
Concrete 9% 25% TEC PLASTICS
[kt]
619
4%
ELECTRONIC
334
2%
COATINGS [kt] St Sheet 52%
52 Cast iron 21%
0% FERRO [kt]
6,619 St tube/prof 13%
46% Stainless St 13%
NON-FERRO [kt]
1,090 Material weight (100%):
8%
14 557 kton total
Building Installation Products
12EIA Summary – Material Resources
ECOREPORT
The EcoReport is a standard Excel tool to assess life cycle This EcoReport confirms the EIA data regarding energy
environmental and economic impacts of products. It has consumption, GHG-emissions and costs related to the Use-
been developed as part of the ‘Methodology for the phase of the products, but provides additional information on
Ecodesign of Energy-related Products’ (MEErP). spare parts, consumables and refrigerants (that are not
A single EcoReport has been created for the average EIA- present in the BoMs), on the end-of-life distribution of
product, using e.g. the Bill-of-Materials of the average materials over ‘disposal’ and ‘recycling’, on the energy and
product (Total EIA-material of the previous page divided by emissions due to materials processing, manufacturing,
Total Sales of all products), total sales and stock, and distribution and end-of-life phases, and on waste caused by
average unit electricity consumption and price. materials processing, manufacturing and energy generation.
For details see the ‘EcoReport for the average EIA product’.
Amount of material contained in EIA products,
consumed during use (excl. energy), and end-
of-life waste destinations.
In addition to the 14.5 Mt of materials contained in EIA
20,000
products sold in 2010, 8 Mt per year of spare parts,
consumables and refrigerants are related to the use of EIA 15,000
products, for a total of 22.5 Mt. Of this material, 66% is 10,000 14,459
recycled (including re-use and incineration with heat
recovery) and 34% is disposed of (landfill, fugitive, 5,000 7,999
incineration without heat recovery). kt 0
-5,000 -7,526 -622
-10,000 -14,309
-15,000
-20,000
PRODUCTION DISPOSAL STOCK
USE RECYCLING
EU Domestic
TotalMaterial
EU Domestic Consumption 2011,7.3
Material Consumption, inGton.
Gt
Non-energy materials related to EIA-products represent only 0.6%.
Fuel consumed by EIA products represents 13%.
o/w Ecodesign: 0.05% biomass
Fuels ErP
for paper, natural rubber (Ecodesign)
Biomass food
Biomass non-food
1.44 0.91 o/w Ecodesign: 0.15% oil for plastics,
0.29 13%
20%
Fuels other
synthetic rubber, detergents
4%
0.80
Metal ores (other) 11%
0.24
3% Minerals
3.59
Metal ores ErP 49%
(Ecodesign) o/w Ecodesign: 0.01% minerals
0.03 for glass, concrete
0.4%
Total 7.3 Gton
The EcoReport shows an additional waste due to materials extraction, materials processing, product manufacturing, and
generation and distribution of energy (fuel or electricity) of 21.3 Mt per year. Adding this to the amount derived above, the total
waste related to EIA-products is 43.8 Mt per year. This is 0.6% of the total EU domestic material consumption of 7300 Mt. The
weight of fuel consumed by EIA products is 910 Mt (13%), and thus a factor 20 higher than non-energy materials related to EIA
products.
Building Installation Products
13INSTALLATION PRODUCTS
Building Installation Products
14INSTALLATION PRODUCTS
Building installations include heating, cooling, HEAT BALANCE
ventilation and lighting products. In terms of energy,
Space heating and cooling products are the most The average indoor temperature, 24/7 and over all rooms, is
important. This section introduces the basic 18°C. This means that on average heating systems are
terminology used in this area. required to offset a temperature difference of 11.5°C. The
sun and the heat from people and equipment inside the
buildings increase 3.5°C. On average 8°C is needed from the
BUILDING STOCK heating system during the heating season, to compensate
The total heat output that is required from heating and for the heat dissipated through the building shell (60%) and
cooling appliances depends first of all on the size and the the cold air entering the building from ventilation and
geometry of the buildings. The total heated surface area of infiltration (40%). These are EU-averages, i.e. the
all buildings in the EU is approximately 32,800 km² (32.8 proportion between transmission and ventilation losses
billion m2). Spread out at ground floor level, this surface is varies and depends on the insulation and type of ventilation
comparable to that of a country like Belgium. The land (e.g. windows or mechanical). For individual cases also the
surface covered, taking into account on average 3.1 floors, is orientation, wind, etc. are relevant.
little over 10 billion m2. The total heated indoor volume is
EU BUILDING STOCK HEAT BALANCE
estimated at 114 billion m3 (EU 2010). The geometry is also
relevant, because it determines the outer surface of the
building walls, roof and floor in proportion to its volume, the
so-called ‘S/V ratio'. The next page shows reference
buildings that are used to estimate the S/V ratio. The
diagram below gives the split-up of heat load, floor area and
volume by sector.
EU BUILDING STOCK HEAT LOAD BY SECTOR (2010)
From the previous can be estimated that the space heating
demand, i.e. the 'heat load' that space heating solutions
have to deliver, is around 2400 TWh and the space cooling
load around 220-260 TWh (EU 2010). This heat load is the
total EU heat demand. The heat load of EIA products covers
70% - 80% of this amount.
TREND
Trends in space heating and cooling load are affected by
many factors. Improved insulation, optimised ventilation
CLIMATE (with heat recovery), increased urbanisation (heat islands)
The second factor is climate. Almost two-thirds of the EU and global warming decrease the load. Growth of population,
population lives in a relatively mild climate (green area in dwelling size, comfort level and lower internal gains increase
figure below). Around 10% live in a colder winter-climate, in the space heating load.
Eastern and Northern regions or in mountain areas (blue For the future, a slightly decreasing heating demand can be
area in figure). One quarter of Europeans live in a warm expected. By contrast, a rising trend for cooling demand, in
Mediterranean climate. Almost 70% live in a city, which is 1- absolute numbers much smaller than heating demand, is
2°C warmer than the countryside and 41% live in coastal foreseen. Local climate conditions, economical and
regions, which is also warmer in winter. The orange area in behavioural patterns play a dominant role but are difficult to
the figure below indicates these warmer climate zones. It predict.
should be noted that small areas with the hottest European
climate, such as cities in the south and the Mediterranean
coast, were not split into a separate category.
In Europe, the average outdoor temperature is 6.5°C during
the 7 months buildings are heated (5 months in a warm
Total for EIA products only.
climate, 9 months in a colder climate).
HEATING SEASONS IN EUROPE
Three indicative heating season zones as defined by EC.
Building Installation Products
15INSTALLATION PRODUCTS
GEOMETRY
Residential reference buildings
DETACHED OVERALL SURFACE/VOLUME RATIO 0.51
8 x 10 x 5 m (mix bungalow/2 storey)
shell surface area 340 m²
block volume 400 m³
Surface/volume ratio ca. 0.85
1.6 floors 128 m² heated floor area
SEMI-DETACHED
12 x 9 x 7.5m (2 dwellings/house)
shell surface area 495 m²
block volume 810 m³
Surface/volume ratio ca. 0.61
2.5 floors 128 m² heated floor area
LOW RISE
12 x 35 x 23 m
shell surface area 3002 m²
TERRACED block volume 9660 m³
90 x 7.5 x 7.5 m (15 dwellings) Surface/volume ratio ca. 0.31
shell surface area 3712 m² 4 floors 1680 m² heated floor area
block volume 6750 m³ (25 dwellings)
Surface/volume ratio ca. 0.55
2.5 floors 128 m² heated floor area
180 m
23 m
HIGH RISE
12 x 80 x 42 m
shell surface area 9648 m²
block volume 40320 m³
12 m Surface/volume ratio ca. 0.24
13 floors 12480 m²
heated floor area (130 ap. dwellings)
CITY BLOCK 4 top floors apartments
block shell surface area 13152 m² 1 ground floor services or parking
block volume 49680 m³ 1 heated basement (workshop, office) or attic (bedroom, hobby room)
Surface/volume ratio ca. 0.28 Total on average 6 heated floors 12960 m² floor area (130 apartments+3000 m² services)
(corrected for slant roof, otherwise 0.264) Split AV 0.29 (11232/38880) for apartments 0.18 (2073/11664) for services (take out 5 m layer)
Central Heating Solid Fuel Boiler
boiler
NON-RESIDENTIAL REFERENCE BUILDINGS
RETIREMENT HOME LARGE OFFICE NON-RESIDENTIAL
36 x 37 x 13 109 x 11.5 x 36 m SURFACE/VOLUME RATIOS
shell surface area 4195 m² shell surface area 11154 m²
block volume 11750 m³ block volume 45000 m³
Surface/volume ratio ca. 0.36 Surface/volume ratio ca. 0.25
4 floors 3916 m² floor area 12 floors 15000 m² floor area
HYPERMARKET SHOPPING MALL
FACTORY LARGE FACTORY Local Heater
WAREHOUSE 500 x 24 x 7 m (shops, cinema, hall) Solid fuel
100 x 60 x 7 m (sales, store, office area) shell surface area 33816 m²
shell surface area 14240 m² block volume 93430 m³ Air Conditioner
block volume 42000 m³ Surface/volume ratio ca. 0.36
Surface/volume ratio ca. 0.34 1 floor 12940 m² floor area
1 floor 6000 m² floor area
HOSPITAL
Circulator
MEDIUM OFFICE
138 x 54 x 17 m (400 beds) SECONDARY SCHOOL Local Heater
block shell surface area 21102 m² 18 x 69 x 12 m gas
block volume 91035 m³ shell surface area 4598 m²
Surface/volume ratio ca. 0.23 block volume 15000 m³
5 floors 30345 m² floor area Surface/volume ratio ca. 0.31
HOTEL 4 floors 5000 m² floor area SMALL OFFICE
61(23)x 35(14) x 17(3) L-shape PRIMARY SCHOOL
shell surface area 4428 m² 36 x 14 x 6 m
block volume 9832 m³ shell surface area 1451 m²
Surface/volume ratio ca. 0.45 block volume 2721 m³
4 floors 3668 m² floor area Surface/volume ratio ca. 0.53
2 floors 1008 m² floor area
Building Installation Products
16INSTALLATION PRODUCTS
PRODUCTS REGULATIONS
Installation products covered by Ecodesign and Energy Energy losses due to the building shell (insulation, fighting
Label regulations are: infiltration) are not (yet) regulated through Ecodesign, but
primarily through Energy Performance of Buildings (EPB)
legislation. Ecodesign and Energy Label concern the
Central Heating Boilers (CH) efficiency with which installation products provide heating,
Solid Fuel Boilers (SFB) cooling or lighting. Improvements of the building shell are
Local Space Heaters (LH, Solid inherently slow, because of the large inertia of the building
Fuel and Other) stock (average life 40-50 years), whereas heating and
cooling appliances are changed every 17 years.
Room Air Conditioners (RAC)
Central Air Cooling and Space heating products covered by Ecodesign and Energy
Heating equipment (CAC, Label measures represent approximately 70% or 2000
Ecodesign only) TWh/year of the building heat load. Not covered are district
Circulators (CIRC, Ecodesign heating and very large appliances, e.g. boilers over 400
only) kW.
Ventilation Units (VU)
Building installation products, including but not limited to
Light Sources (LS) space heating and cooling appliances, make up more than
half of the energy use and greenhouse gas emissions of all
Ecodesign-regulated products.
Ventilation Units (VU) and Light
Sources (LS) are indirectly related to
space heating and cooling but are part
of installation products especially in
non-residential buildings.
ENERGY
Although only introduced in 2013, the Ecodesign and
labelling measures for space heaters and coolers were
anticipated by industry since 2011. There are large
differences of up to a factor 10 in primary energy efficiency
of space heating appliances, ranging from 30% for an open
fire place to over 300% for the best heat pumps. Average
efficiency is less than 60% (EU 2010), leading to an energy
consumption of over 3300 TWh/a to provide the required
heat output of 2000 TWh heat/a for Ecodesign-regulated
products.
The graph shows the primary energy consumption (direct
fossil fuels plus fuels to generate electricity) from 1990 till
2050. In 2015 the savings with respect to a scenario
without measures were 299 TWh/a (heating) and 4 TWh/a
(cooling). Combined, this equals 35% of the total 859
TWh/a savings on primary energy by regulated products.
In 2030 savings are expected to be 1035 and 51 TWh/a
respectively, which then accounts for 36% of the total 2030
savings. The cumulative savings in the 2015-2030 period
(for both heating and cooling) would be 11,939 TWh.
EMISSIONS
The reduced energy consumption also causes less
greenhouse gas emissions. The combined 2015 GHG-
emissions for space heating and cooling amount to 619 Mt
CO2 eq./a. This is 16% of the total EU GHG-emissions
(4,319 Mt CO2 eq./a in 2015). Through Ecodesign and
Energy Label measures a saving of 126 Mt CO2 eq./a is
expected for 2020. In 2030, these savings rise to 210 Mt
CO2 eq./a, which would then be 42% of the savings on EU
GHG-emissions by regulated products.
Several regulations for space heaters have limit values for
other emissions (NOx, CO, CxHy and PM).
Building Installation Products
17Central Space Heating
FACTS & FIGURES EFFECT
REGULATIONS
Product: [CHC] Central Heating Combi, space heating
Measure(s): CR (EU) No. 813/2013 and CDR (EU) No. 811/2013
sales (x1000 units) stock (x1000 units) primary energy [TWh/a]
-53
-848
6,987 9,508 111,531 148,980 2265 949
2010 2030 2010 2030 2010 2030
GHG-emission consumer expenses revenues
[Mt CO2 eq./a] bn € bn €
-3 +52
-11 -2
-179 +1
466 179 196 202 48 116
2010 2030 2010 2030 2010 2030
INTRODUCTION
Since 2013 Ecodesign and Energy Label measures are in
place for Central Heating Boilers (CHB). The Ecodesign- Because the measures cover such a wide range of
scope includes gas- and oil-fired boilers, electric resistance technologies and efficiencies, and because –depending on
boilers and electric or gas-fired hydronic heat pumps with local circumstances—not all boiler-solutions are feasible, the
power output ≤400 kW (≤70 kW for the Energy Label) as 7 standard classes ‘A’ to ‘G’ are not enough and the Energy
well as cogeneration boilers producing both heat and Label uses 9 classes ranging from ‘A++’ to ‘G’.
electricity having a maximum electric output ≤50 kW.
The preparation of the new Ecodesign and Label measures
Solid fuel or biomass boilers, central air heaters and local for CH-boilers took 7 years, involving a myriad of stake-
space heaters are excluded here but addressed through holders and their experts. It is probably the most ambitious
other Ecodesign and Labelling measures. District heating and innovative piece of legislation ever developed in the field
end-use equipment as well as very large, typically custom- of space heating and firmly places the sector in the 21 st
made CH-boilers are excluded because they are outside the century, far ahead of other continents.
scope of the Ecodesign Directive. The Ecodesign and
Labelling measures rate the space heating performance. If The implementation of the measures, i.e. the obligation to
the boiler also provides sanitary hot water (‘combi-boiler’), display the labelling information and phase out less efficient
that functionality is rated separately to make them products, started only in 2015 and will probably take many
comparable to the Ecodesign-rating of dedicated water years for consumers and other market actors to get used to.
heaters for which there are separate regulations. The European Commission has anticipated that process and
has foreseen regular reviews, for the first time in 2018, to
Ecodesign introduced –for the first time-- the space heating optimise the methodology and repair possible flaws.
performance rating not only of single boilers, but also of
boiler-packages with possibly a series of boilers (‘cascades’),
multiple boiler-technologies (‘hybrids’ e.g. of conventional
boiler and heat pump), thermal solar assistance and
temperature control devices. This increases transparency for Energy label for a
installers and consumers and promotes the use of these Central Heating combi-
often more energy efficient but also more complex heating boiler, showing space
solutions. heating efficiency class
and (sanitary) water
Ecodesign also introduced a ‘seasonal’ boiler efficiency heating efficiency
rating, comparable across technologies, that is based on class.
real-life boiler-operation with an important role for part-load
efficiency, start-stop losses, etc. The measures thus aim to
realise real-life energy savings, real-life greenhouse gas
emissions and also, through specific requirements, realise
decrease of NOx-emissions and noise power level.
To address the very frequent problem of ‘oversizing’ the
Ecodesign and Label measures introduced a new, easy-to-
understand metric for boiler capacity, ranging from very
small sizes for ‘Near-Zero’ dwellings (3XS) to very large
(4XL) boiler-solutions for apartment blocks.
XXS: new XS: new S: old M: large L: d XL: 8 new XXL: ± 8 XXL: ± 20 3XL: ± 3
apartment house apartment old house apartments old new apartment
apartment apartment apartment blocks
s s
Building Installation Products R
E
18 F
R
I
GCentral Space Heating
GENERAL INFO
Central heating boilers are the largest Ecodesign- and Energy Label regulated product group in terms of energy and other
impacts, making up 20% of the total.
In 2015, 120 million CH-boilers were installed in the EU, 50 million more than in 1990. They covered a building heat load of
~1,240 TWh/a, i.e. over 60% of the total heat load of regulated space heating products. The efficiency of the average installed
CH-boiler is 67% and thus consumed ~1,850 TWh of primary energy annually to realise the 1240 TWh output. The energy input
consisted of fossil fuels (84%) and electricity (16%). The electricity, expressed in primary energy equivalent, was used for heat
pumps, resistance boilers and auxiliaries such as the circulator pump.
The 1,850 TWh primary energy input caused 376 Mt of greenhouse gas (GHG) emissions as well as (together with other space
heating appliances) direct emissions of 0.42 Mt nitrogen-oxides (NOx), 2.4 Mt carbon-monoxide (CO), 0.18 Mt organic gaseous
carbon (OGC) and 0.17 Mt of particulate matter (PM).
For 2020 an annual energy use of ~1,440 TWh is foreseen, i.e. 22% less than in 2015, due to an increased share of condensing
boilers, heat pumps, better controls, smarter heating packages and increased use of ventilation units. For 2030 an annual energy
use of ~949 TWh is expected, with a 28% share of electricity mainly for heat pumps. Around 9% of the savings is due to
increased use of (improved) ventilation units that decrease the heat load for CH-boilers.
The emissions from combustion processes are expected to decrease proportionally to these saving figures.
SIZES AND MARKETS
More than half of the systems (51%) are medium sized and
fit e.g. the heat demand of an apartment in an older
building. However, since energy consumption of these
systems is also moderate, the total energy consumption of
all M sized systems accounts for only 29.4% of the total
energy consumption of central heating. Most energy is
consumed by systems of size 4XL (19.8% of total) and XL
(18.9% of total) with related sales shares of 0.6%
respectively 9.8%. This phenomenon can be seen in all of
the larger products: Systems sizes L – 4XL only have a
23.5% sales share, but consume 62.6% of the energy.
Building Installation Products
19Water heating
FACTS & FIGURES EFFECT
REGULATIONS
Product: [WH] Dedicated Water Heaters
Measure(s): CR (EU) No. 814/2013; CDR (EU) No. 812/2013
sales (x1000 units) stock (x1000 units) primary energy [TWh/a]
-293
10,918 11,878 158,079 173,129 801 535
2010 2030 2010 2030 2010 2030
GHG-emission consumer expenses revenues
[Mt CO2 eq./a] bln € bln €
-45 +5.2
-18
140 82 68 66 12 17
2010 2030 2010 2030 2010 2030
INTRODUCTION
In 2015, EU citizens and businesses owned ~250 million
water heaters, producing almost 8 billion cubic metres of hot
water (60 °C equivalent) for showers, baths and taps. This is
43 litres per capita per day, compared to 30 litres in 1990.
For 2030, at current annual growth rate of 2%, a rise to 60
litres per capita is expected. Hot water consumption per
capita varies greatly within the EU, with the Scandinavians
using twice as much and Mediterranean countries using
considerably less than the EU average. Roughly three
quarters of hot water volume is consumed in private
households, with the service sector using the rest. Water
heaters take up as much as 5.6% of the total EU primary
energy consumption. In 2013 two different sets of Ecodesign
and Energy Label regulations entered into force: one set for
dedicated water heaters and one set for combi-boilers, i.e.
integrated with the space heating functionality of these
boilers discussed in the previous section.
SIZE
The EU Energy Label introduced, for the first time after 20 years of struggle at the level of standards, a reference for the
capacity (‘size’) of water heaters that helps consumers to make the right choice. The capacity is determined by the ability to
deliver a certain tapping pattern, ranging from very small 3XS electric water-heaters up to very large 4XL indirectly fired water
heaters that can service a multitude of apartments. Most individual households use water heaters in the medium (M) or large (L,
XL) range for their main hot water supply. For example, an ‘M’-appliance can deliver a 7 minute shower (6 litre/minute) in
morning and evening, with intermediate draw-offs for kitchen and other taps. An ‘L’-appliance can deliver twice as much and
would be enough to take a bath.
Building Installation Products
20Water heating
ENERGY
In 2015, despite a 40% higher hot water use, the energy
consumption per capita increased only by 10% with respect
to 1990. In 2020, with a continued growth of hot water use,
energy consumption per capita is expected to be lower than
in 1990 because primary energy efficiency of new water
heaters will have more than doubled over that period. This is
due to using more efficient combi-boilers, more solar and --
recently-- heat pump water heaters. It is only because of the
inertia of the market, i.e. it takes 17 years before all existing
water heaters are replaced, that the efficiency of the
average installed water heater is not even higher (e.g. the
water heating efficiency of combi-boilers selling in 2020 is
expected to be 76%, but the average of installed boilers in
the same year will be only 58% as many older less efficient
models are still in use).
Consumer Expenditure Saving due to Ecodesign
CONSUMER EXPENDITURE bn euros
measures on Water Heating: Additional Acquisition
Costs and Savings on Energy Costs
Water heater efficiency has been promoted through national 40
rulemaking for years, but it is believed that EU Ecodesign 35
and labelling act as a catalyst. Over the last 3 years, since
30
the introduction of the EU Ecodesign and Energy Label, it is
25 net
estimated that consumer expenditure on water heater
savings
energy has decreased by as much as 7 billion Euros per year 20
(€ 33 per household per year). In 2030 the projected energy 15
cost saving amounts to 37 billion Euros per year, compared 10
to a 'Business-as-Usual' scenario without those EU
5
measures.
0
2010 2015 2020 2025 2030
Energy Cost Savings Additional Acquisition Costs
WATER HEATER DESIGN OPTIONS
Functionality
There are several types of water heaters. Dedicated
water heaters [WH] will supply hot water for
sanitary purposes only. Combination boilers [CHC]
combine space heating of the dwelling with the
supply of sanitary hot water. The majority of the
products is either electric, gas or liquid fuel
powered. Newer technologies involve solar
dedicated water combi boiler (assisted) powered systems or heat pump systems.
heater
Energy source
Water heaters may have a storage tank or heat the
water instantaneously when you open the tap. A
storage water heater has the advantage that hot
(pre-heated) water is immediately available and
that the heating element inside the tank can be
relatively small. On the other hand, the capacity of
the storage tank heater is limited and it takes
solar liquid and gas electricity energy to keep the water warm. Instantaneous
fuels heaters might take 10-30 seconds to start and
Storage require a larger heater (more kW), but hot water
supply is limitless and there is no energy loss when
not in use. Hybrid solutions of an instantaneous
heater with a small storage to shorten the waiting
time also exist.
storage instantaneous
tank Building Installation Products
21Solid fuel boiler
FACTS & FIGURES EFFECT
REGULATIONS
Product: [SFB] Solid Fuel Boilers
Measure(s): CR (EU) No. 2015/1187 and CDR (EU) No. 2015/1189
sales (x1000 units) stock (x1000 units) primary energy [TWh/a]
-15
438 365 5,292 6,636 168 129
2010 2030 2010 2030 2010 2030
GHG-emission consumer expenses revenues
[Mt CO2 eq./a] bn € bn €
+0.3
-0.5
-0.4 2.8 3.3
15 4 9 11
2010 2030 2010 2030 2010 2030
woodlog coal pellets woodchips
GENERAL INFO
Solid fuel boilers are similar to central heating boilers. Their
SALES
purpose is to heat multiple rooms by means of the transport The market for solid fuel boilers has been variable over the
of hot water through a plumbing system. The difference is last two decades. Their use was mainly popular in Eastern
the input source, which are solid fuels instead of gas, liquid European countries, but during the 1990s the demand for
fuels or electricity. SFBs was decreasing in that region. Boilers using coal
tended to disappear from the market, with annual sales of
64 thousand units in 1990 dropping to 45 thousand in 2000
and only 4 thousand unit sales left by 2015. However, at the
beginning of the 21st century, modern SFBs came onto the
market. Especially the increase in sales of more efficient
automatic wood boilers and pellet boilers led to peak annual
sales of 438 thousand units in 2010. The underlying cause
can be found in measures encouraging the use of biomass
fuels. Additionally, the increasing prices of gas and oil played
a part in these increasing sales numbers. After this peak in
sales, numbers are decreasing again, with an expected low
in 2025 of 315 thousand units, a decrease of 28% compared
to 2010. After this low, sales of the biomass fuelled product
are expected to grow once again.
ENERGY EFFICIENCIES
Ecodesign measures and labelling for Solid Fuel Boilers were
introduced in 2015. The graph on the right shows how the
efficiencies increase over time. Especially improvements for
manual wood boilers (22 %point) in 2030 are significant. In
2030, all SFB are expected to reach an efficiency of either
77% or 78%. These improvements (combined with increased
use of ventilation units) yield energy savings of 14.9 TWh/a
in 2030, with corresponding GHG-savings of 0.4 Mt CO2
eq./a. A large part of these savings are due to manual wood
boilers, which account for 5.1 TWh/a primary energy savings
(34%) and 0.11 Mt CO2 eq./a (26%). A large part (60%) of
the energy savings on SFB derives from increased use of
(improved) ventilation units that decreases the heat load.
EMISSION SAVINGS
In addition to minimum efficiency requirements, the regulations also enforce limitations on emissions. Besides GHG-emissions,
SFBs produce organic gaseous carbon [OGC], particulate matter [PM] and carbon monoxide [CO]. These emissions arise when
the combustion of fuels is incomplete, due to a lack of oxygen or too low temperatures. The use of improved combustion
technology can not only cause more energy efficient, but also cleaner products.
From 2015 to 2030, OGC emissions will decrease from 87 kt/a to 15 kt/a (-53% vs. no measures in 2030), PM emissions from
58 kt/a to 22 kt/a (-31% vs. no measures in 2030) and CO emissions from 1009 kt/a to 207 kt/a (-45% vs. no measures).
Building Installation Products
22Local space heater
FACTS & FIGURES EFFECT
REGULATIONS
Product: [LH] Local Heaters
Measure(s): CR (EU) No. 2015/1188, CR (EU) No. 2015/1185, CDR (EU) No. 2015/1186
sales (x1000 units) stock (x1000 units) primary energy [TWh/a]
-94
24,464 28,534 267,511 331,013 603 541
2010 2030 2010 2030 2010 2030
GHG-emission consumer expenses revenues
[Mt CO2 eq./a] bn € bn €
-11 -5
+1.6
84 58 52 65 13 20
2010 2030 2010 2030 2010 2030
Fireplace (gas or Stove Cooker (Slow
GENERAL INFO wood; open or (gas or wood) Heat
closed) Releasing or
Local space heaters (LH) are heating products that heat the
coal)
room they are installed in. The products range from simple
open fireplaces fuelled by wood to tube heaters used for
commercial and agricultural applications. The variety of
products led to two separate Ecodesign regulations,
separating the solid fuel devices from oil/gas-fired and
electric products. Energy labelling also applies to LH, except
electric-, tube- and luminous-heaters. Electric Electric storage Electric
convection heater underfloor
heater heater
SALES
The wide scope of LH makes it one of the largest groups of
EIA in terms of stock units and definitely the largest of the
Space Heating segment, with almost 285 million units
installed in 2015. This number is expected to rise over the
years, to over 331 million units (plus 16%) in 2030. The Electric mobile Luminous Tube heater
upswing of the pellet stoves is the most significant of all. The heater heater
amount of operational pellet stoves in 2010 is expected to
almost triple in 2030, while in 1990 these products were not
even on the market. SAVINGS ON EXPENSES
Furthermore the closed fireplaces gain popularity, with 2030
stock almost double that of 2010. Other significant stock The improved product quality leads to an increase of product
growth can be seen with cookers (77% increase from 2010 prices. The highest additional annual acquisition costs for LH
to 2030) and slow heat release stoves (+66% for the same are expected in 2025: +30% (4.7 billion Euros) compared to
period). Products with a decreasing stock are coal stoves (- 2015. These additional costs are mainly caused by increased
30% from 2010 to 2030) and flueless fuel heaters (-17% prices for solid fuelled appliances such as open and closed
over the same period). fireplaces, stoves and cookers. For these appliances, no
savings are yielded up to 2033.
SAVINGS ON ENERGY Costs of electric appliances are not expected to change
significantly, except electric storage heaters (+€45, or +7%
The Ecodesign requirements and labelling promote improved from 2015 to 2030). This makes electric heaters an
product design by manufacturers. This will lead to products attractive product group for Ecodesign requirements. The
with higher energy efficiency, but also with higher prices. additional acquisition costs are more than compensated by
lower energy costs. As a balance, consumer expenditure
The highest energy savings are expected on electric local savings on LH of 5.4 billion Euros are expected in 2030.
heaters. Total primary energy savings of LH are 94 TWh/a in Other heaters, such as pellet stoves and commercial
2030, of which 67% (63 TWh/a) on electric appliances. This appliances have only minor savings on consumer expenses.
is due to their high share of installed LH (71%). Most
opportunities for improvements are found in electric Consumer Expenditure Saving due to Ecodesign
convector appliances (accounting for 41% of the expected measures on Local Space Heaters: Additional
2030 LH energy savings). A large part (43%) of the energy bn euros Acquisition Costs and Savings on Energy Costs
savings on LH derives from increased use of (improved) 10
ventilation units that decreases the heat load.
8
6
net
savings
4
2
0
2010 2015 2020 2025 2030
Energy Cost Savings Additional Acquisition Costs
Building Installation Products
23You can also read