World Energy Investment 2021 - NET
←
→
Page content transcription
If your browser does not render page correctly, please read the page content below

World Energy
Investment
2021
INTERNATIONAL ENERGY
AGENCY
The IEA examines the               IEA member            IEA association
full spectrum                      countries:            countries:
of energy issues
including oil, gas and             Australia             Brazil
coal supply and
                                   Austria               China
demand, renewable
                                   Belgium               India
energy technologies,
electricity markets,               Canada                Indonesia
energy efficiency,                 Czech Republic        Morocco
access to energy,                  Denmark               Singapore
demand side                        Estonia               South Africa
management and                     Finland               Thailand
much more. Through                 France
its work, the IEA                  Germany
advocates policies that            Greece
will enhance the                   Hungary
reliability, affordability
                                   Ireland
and sustainability of
                                   Italy
energy in its
30 member countries,               Japan
8 association countries            Korea
and beyond.                        Luxembourg
                                   Mexico
                                   Netherlands
                                   New Zealand
                                   Norway
                                   Poland
                                   Portugal
Please note that this              Slovak Republic
publication is subject to          Spain
specific restrictions that limit
its use and distribution. The      Sweden
terms and conditions are           Switzerland
available online at                Turkey
www.iea.org/t&c/
                                   United Kingdom
                                   United States
This publication and any
map included herein are            The European
without prejudice to the           Commission also
status of or sovereignty over      participates in the
any territory, to the
delimitation of international      work of the IEA
frontiers and boundaries and
to the name of any territory,
city or area.

Source: IEA. All rights
reserved.
International Energy Agency
Website: www.iea.org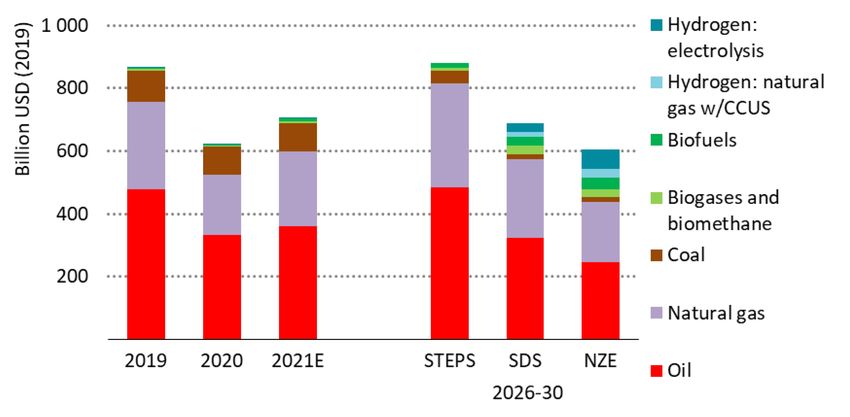
World Energy Investment 2021 Abstract
Abstract
This year’s edition of the World Energy Investment report presents the latest data
and analysis of how energy investment flows are recovering from the shock of the
Covid-19 pandemic, including full-year estimates of the outlook for 2021. It
examines how investors are assessing risks and opportunities across all areas of
fuel and electricity supply, efficiency and research and development, against a
backdrop of a recovery in global energy demand as well as strengthened pledges
from governments and the private sector to address climate change.
The report focuses on two key questions:
Whether the growing momentum among governments and investors to accelerate
clean energy transitions is translating into an actual uptick in capital expenditures
on clean energy projects.
Whether the energy investment response to the economic crisis caused by the
Covid-19 pandemic will be broad-based or if some sectors, geographies and
vulnerable parts of the world’s population will be left behind.
IEA. All rights reserved.
PAGE | 2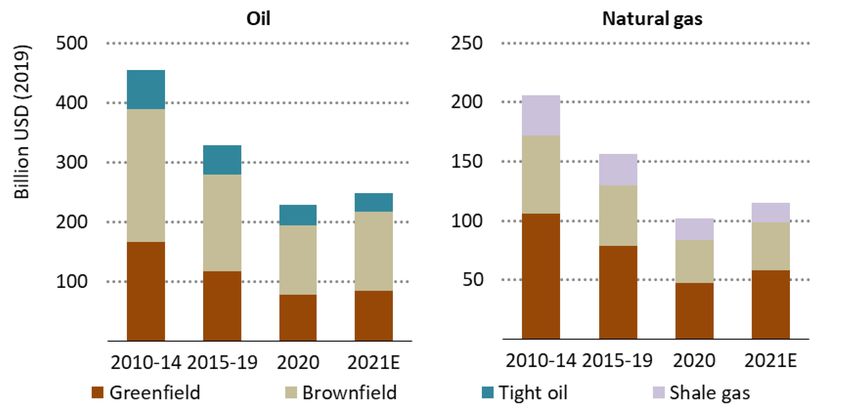
World Energy Investment 2021                                                  Acknowledgement

Acknowledgements, contributors
and credits

          This report was prepared by the Energy Investment Unit in the Energy Supply and
          Investment Outlook (ESIO) Division of the Directorate of Sustainability,
          Technology and Outlooks (STO). Michael Waldron was the lead author and
          designed and directed the report with Tim Gould, Head of Division for Energy
          Supply and Investment Outlooks. Tanguy de Bienassis coordinated the report; he
          and Inchan Hwang authored the End-Use and Efficiency Section. Lucila Arboleya
          and Pablo Gonzalez authored the Electricity section. Tim Gould and Becky Schulz
          authored the Fuel Supply section; Pawel Olejarnik co-ordinated fossil-fuel supply
          modelling. Simon Bennett authored the R&D and Innovation and Hydrogen
          sections. Ryszard Pospiech co-ordinated modelling and data across sectors. Eleni
          Tsoukala and Marie Fournier-S'Niehotta provided essential support.

          The report benefited greatly from contributions from other experts within the IEA:
          Carlos Fernandez Alvarez (coal), Adam Baylin-Stern (CCUS), Tae-Yoon Kim
          (refining and petrochemicals), Lilly Lee (Transport), Suzy Leprince (public R&D
          funding), Jean-Baptiste Le Marois (corporate R&D and venture capital), Ariane
          Millot (buidlings, renewables), Jeremy Moorhouse (biofuels), Yannick Monschauer
          (buildings efficiency), Leonardo Paoli (transport), Alison Pridmore (transport
          efficiency), Paul Hughes (industry), Hugo Salamanca (industry efficiency),
          Apostolos Petropolos (Transport), and Peter Zeniewski (LNG).

          The report is indebted to the high calibre of advice, data and support provided by
          other colleagues in the IEA, including Thibault Abergel, Heymi Bahar, Alessandro
          Blasi, Louis Chambeau, Davide D’Ambrosio, Chiara Delmastro, Araceli
          Fernandez Pales, Marine Gorner, Ian Hamilton, Kevin Lane, Domenico Lattanzio,
          José Miguel Bermudez Menedez, Nikita Patil, Amalia Pizarro, Tess Sokol-Sachs.

          The report also benefited from valuable inputs, comments and feedback from
          other experts within the IEA, including Mechthild Wörsdörfer (Director of
          Sustainability, Technology and Outlooks), Keisuke Sadamori (Director of Energy
          Markets and Security), Laura Cozzi (Chief Energy Modeller), Laszlo Varro (Chief
          Economist), Peter Fraser, Timur Gül, Tom Howes, Randi Kristiansen and Brian
          Motherway. Thanks also to Jad Mouawad, Astrid Dumond, Merve Erdem, Jethro
          Mullen, Rob Stone and Therese Walsh of the Communications and Digital Office.
          Erin Crum edited the manuscript.
                                                                                                IEA. All rights reserved.

                                             PAGE | 3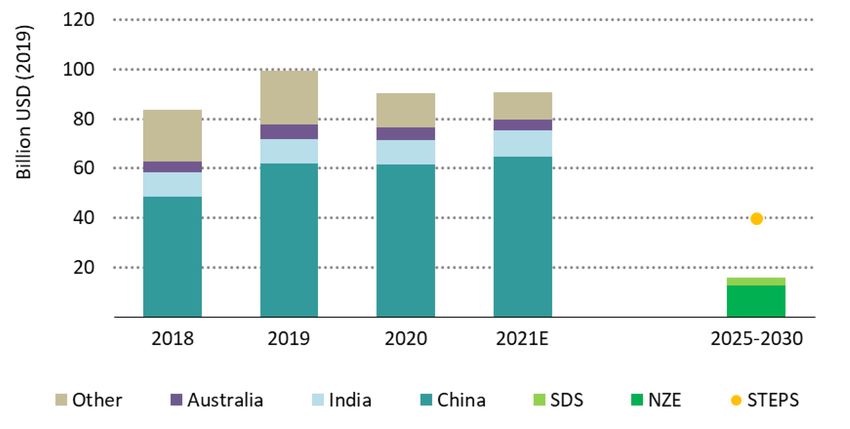
World Energy Investment 2021                                                    Acknowledgement

          Many experts from outside of the IEA provided input, commented on the
          underlying analytical work, and reviewed the report. Their coments and
          suggestions were of great value. They include:

          Rigoberto Ariel Yepez-Garcia     Inter-American Development Bank

          Manuel Baritaud                  European Investment Bank

          Thiago Barral                    EPE-Brazil

          Harmeet Bawa                     Hitachi ABB Power Grids

          Markus Becker                    GE Power

          Leila Benali                     Apicorp

          Kanika Chawla                    Sustainable Energy for All (SEforALL)

          Olivia Coldrey                   Sustainable Energy for All (SEforALL)

          Jonathan Coony                   World Bank

          Deirdre Cooper                   Ninety-One

          Adil Hanif                       European      Bank    for   Reconstruction     and
                                           Development (EBRD)

          David Hart                       Information      Technology    and      Innovation
                                           Foundation

          Donald Perry Kanak               Prudential Plc

          Lahra Liberti                    Organisation for Economic Co‐operation and
                                           Development (OECD)

          Delphine Marchi                  International Finance Corporation (IFC)

          Espen Mehlum                     World Economic Forum

          Valerio Micale                   Climate Policy Initiative

          Baysa Naran                      Climate Policy Initiative

          Richard Norris                   Pandreco Ltd

          Ignacio Perez Arriaga            Massachusetts Institute of Technology

          Andrea Pescatori                 International Monetary Fund (IMF)

          Davide Puglielli                 Enel

          Lazeena Rahman                   International Finance Corporation (IFC)

          Justine Roche                    World Economic Forum (WEF)
                                                                                                  IEA. All rights reserved.

                                          PAGE | 4
World Energy Investment 2021                                                   Acknowledgement

          Gagan Sidhu                        CEEW Centre for Energy Finance

          Gurdeep Singh                      NTPC Limited

          Maria-Antonietta Solinas           Eni

          Sandhya Srinivasan                 World Bank

          Jessica Stephens                   Africa Minigrids Developers Association

          Cecilia Tam                        Organisation for Economic Co‐operation and
                                             Development (OECD)

          Wim Thomas                         Independent

          Akhilesh Tilotia                   National Investment and Infrastructure Fund
                                             (NIIF)

          David Victor                       UC San Diego

          Merte Villum Pedersen              UNEP DTU Partnership

          Andrew Walker                      Cheniere Marketing Ltd.

          Kelvin Wong                        DBS Bank

          Peter Wood                         Royal Dutch Shell

          The work could not have been achieved without the support and co-operation
          provided by many government bodies, organisations and companies worldwide,
          notably: European Commission and European Union's Horizon 2020 research and
          innovation programme funding under grant agreement No 952363; Ministry of
          Economy, Trade and Industry, Japan; Ministry of Foreign Affairs, Japan; and
          Ministry of Economic Affairs and Climate Policy, Netherlands.

          This publication has been produced with the financial assistance of the European
          Union as part of the Clean Energy Transitions in Emerging Economies
          programme. The Clean Energy Transitions in Emerging Economies programme
          has received funding from the European Union’s Horizon 2020 research and
          innovation programme under grant agreement No 952363. This publication
          reflects the views of the IEA Secretariat but does not necessarily reflect those of
          individual IEA member countries or the European Union (EU). Neither the IEA nor
          the EU make any representation or warranty, express or implied, in respect to the
          publication’s contents (including its completeness or accuracy) and shall not be
          responsible for any use of, or reliance on, the publication.
                                                                                                 IEA. All rights reserved.

                                            PAGE | 5
World Energy Investment 2021 Executiive summary
Executive summary
Global energy investment is set to rebound by around
10% in 2021, reversing most of the drop caused by the
pandemic
In 2021, annual global energy investment is set to rise to USD 1.9 trillion,
rebounding nearly 10% from 2020 and bringing the total volume of investment
back towards pre-crisis levels. However, the composition has shifted towards
power and end-use sectors – and away from traditional fuel production.
Prospects for investment have improved markedly along with economic growth,
although there are significant country-by-country variations. Global energy
demand is set to increase by 4.6% in 2021, more than offsetting the 4%
contraction in 2020, according to the latest IEA estimates. While many energy
companies remain in a fragile financial state, there are signs developers are using
the window provided by accommodative monetary policy and government backing
to plan infrastructure developments and investments in new projects.
Global energy investment, 2017-2021
2 500
Buildings
Billion USD (2019)
2 000 Transport
1 500 Industry
1 000 Energy
infrastructure
500 Power generation
Fuel production
2017 2018 2019 2020 2021E
IEA. All rights reserved.
Notes: Energy infrastructure includes midstream and downstream oil and gas infrastructure, electricity networks and
batteries.
Investment is measured as the ongoing capital spending in energy supply capacity (fuel production, power generation and
energy infrastructure) and energy end-use and efficiency sectors (buildings, transport and industry). The scope and
methodology for tracking energy investments is available in the methodology document.
IEA. All rights reserved.
PAGE | 6World Energy Investment 2021 Executiive summary
The anticipated upswing in investments in 2021 is a mixture of a cyclical response
to recovery and a structural shift in capital flows towards cleaner technologies. But
despite an urgent need to shift to a more sustainable energy pathway, global
carbon dioxide (CO2) emissions are again on the rise, following the largest-ever
annual decline in 2020.
Electricity, led by buoyant spending on renewable
power, continues to take the largest share of overall
supply investment
After staying flat in 2020, global power sector investment is set to increase by
around 5% in 2021 to more than USD 820 billion. Renewables dominate
investment in new power generation and are expected to account for 70% of
2021’s total of USD 530 billion spent on all new generation capacity. Investment
in grids and storage makes up the remainder. Thanks to rapid technology
improvements and costs reductions, a dollar spent on wind and solar photovoltaic
(PV) deployment today results in four times more electricity than a dollar spent on
the same technologies ten years ago.
Global energy supply investment by sector
500
Billion USD (2019)
400
300
200
100
2019
2020
2019
2020
2019
2020
2019
2020
2019
2020
2019
2020
2019
2020
2019
2020
2021E
2021E
2021E
2021E
2021E
2021E
2021E
2021E
Upstream Mid/down- Coal supply Low- Renewable Fossil fuel Nuclear Electricity
stream carbon power power networks
fuels and battery
Oil and gas storage
Fuel supply Electricity
IEA. All rights reserved.
Renewable investment has thrived in markets with well-established supply chains
where lower costs are accompanied by regulatory frameworks that provide cash
flow visibility – and where lenders and financiers that understand these sectors
well are seeking sustainable projects to support. Demand from the corporate
sector for clean electricity to meet sustainability targets has also played a role.
IEA. All rights reserved.
PAGE | 7World Energy Investment 2021 Executiive summary
Much of the spending resilience in 2020 was concentrated in a handful of markets,
most notably the People’s Republic of China (hereafter, “China”), which saw a
remarkable year for wind power investment, as well as the United States and
Europe. For the fifth consecutive year, capital spending in the power sector in 2020
was higher than for oil and gas supply.
Electrification was also a major driver of investment spending by final consumers.
Electric vehicle sales continue to surge along with a proliferation of new model
offerings by automakers, supported by fuel economy targets and zero-emissions-
vehicle mandates.
Policies remain a crucial driver for many energy
investments, with the impact of recovery plans becoming
visible in some countries
In economies where governments have more fiscal space and are able to borrow
at low rates, recovery strategies offer a major opportunity to boost investment in
infrastructure, efficiency and clean energy technologies. In the case of
infrastructure, after declining for the fourth consecutive year in 2020, spending on
electricity grids is expected to rise in 2021, led by China and Europe. Proposed
infrastructure spending in the United States, if approved, would add to this
momentum.
Spending on energy efficiency improvements is set to increase in 2021 by nearly
10% in response to renewed economic growth and initial effects of recovery
programmes. However, against a backdrop of relatively low fuel prices, growth is
heavily concentrated in markets and sectors with clear government policies, such
as the buildings sector in Europe. Policies and stimulus spending are spurring
projects in new areas such as low-carbon hydrogen and carbon capture utilisation
and storage (CCUS).
Yet despite these encouraging signs, stimulus spending on clean energy
technologies is falling well short of what is needed to ensure a sustainable
recovery from the Covid-19 crisis. Many developing countries lack the means to
pursue expansive recovery strategies, and early signs of inflation in some
economies has led to questions about how long the current environment of low
interest rates will last.
IEA. All rights reserved.
PAGE | 8World Energy Investment 2021 Executiive summary
Momentum from net zero pledges and sustainable
finance is yet to translate into large increases in actual
spending on clean energy projects
Over the last year, there has been a proliferation of commitments by governments,
companies and financial institutions to achieve net zero emissions by 2050 or soon
thereafter. The financial community in many advanced economies has rallied
around sustainable finance, launching funds and initiatives to channel growing
appetite from capital markets and to comply with new disclosure rules. Sustainable
debt issuance 1 has risen rapidly, reaching a record USD 600 billion in 2020, and
the mainstreaming of green bonds is increasingly accompanied by new types of
securities and performance-based instruments to support more complex
transitions.
Clean energy companies have performed well on financial markets, with
renewable power companies outperforming both listed fossil fuel companies and
public equity market indices in recent years, and with lower volatility. Valuations
remain high after a particularly strong run-up in prices in the second half of 2020,
even though there was some pullback in early 2021.
Even if spending on clean energy is set to rise in 2021 by around 7%,
financial flows have grown more rapidly than actual capital expenditures.
There is a shortage of high-quality clean energy projects. This is compounded
by inadequate channels to guide available funds in the right direction and a lack
of intermediaries capable of matching surplus capital with the sustainability
needs of companies and consumers.
Clean energy investment is on a moderate upswing, but
remains far short of what will be required to avoid severe
impacts from climate change
The USD 750 billion that is expected to be spent on clean energy technologies
and efficiency worldwide in 2021 remains far below what is required in climate-
driven scenarios. Clean energy investment would need to double in the 2020s to
maintain temperatures well below a 2°C rise and more than triple in order to keep
the door open for a 1.5°C stabilisation. Moving to a climate-aligned energy
pathway hinges on a broad range of government actions, including attention to the
financial architecture that can accelerate direct investments in market-ready
solutions and promote innovation in early-stage technologies. As emphasised in
1
Excluding social bonds.
IEA. All rights reserved.
PAGE | 9World Energy Investment 2021 Executiive summary
the new IEA Roadmap to Net Zero by 2050, policies need to drive a historic surge
in clean energy investment this decade.
Global investment in clean energy and energy efficiency, 2017-2021
800 45% CCUS
Billion USD (2019)
Low-carbon fuels
40%
600
Renewables for end-use
35%
Energy efficiency and
400 electrification
30% Battery storage
200 Nuclear
25%
Renewable power
20% % clean energy in total
2017 2018 2019 2020 2021E (right axis)
IEA. All rights reserved.
Clear policy signals from government would not only reduce uncertainties
associated with clean energy but also avoid potential costs from investing in
assets that risk being underutilised or stranded. Mismatches in the speed of
adjustment can create risks, for example, if a slow pace of grid investment leads
to bottlenecks for wind and solar PV, or if oil and gas suppliers transition away
from hydrocarbons faster than do their consumers. As financial regulators work to
align capital flows with climate goals, slower progress in the real economy can
lead investors to over-value some sectors while penalising others, creating a
volatile ride along the way.
The gap between today’s investment trends and a
sustainable pathway is larger in emerging market and
developing economies
In contrast to advanced economies and China, investment in emerging market
and developing economies (EMDEs) is set to remain below pre-crisis levels in
2021, in large part because their twin public health and economic crises are more
prolonged. EMDEs outside China account for nearly two-thirds of the global
population but only one-third of global energy investment and just one-fifth of clean
energy investment.
IEA. All rights reserved.
PAGE | 10World Energy Investment 2021 Executiive summary
These EMDEs need to achieve a large increase in investment from a starting point
of less fiscal space and more constrained access to sources of finance than
advanced economies. Financial pressures on utilities and other major investment
players in EMDEs have been exacerbated by the pandemic, which has also
resulted in setbacks in the drive to expand access to modern energy. This is a
major fault line in global energy transitions, which we will examine in detail in a
major new IEA special report, entitled Financing Clean Energy Transitions in
Emerging Market and Developing Economies. 2
The balance of investment in fossil fuels is shifting
towards state-owned companies
Upstream oil and gas investment is expected to rise by about 10% in 2021 as
companies recover financially from the shock of 2020, but spending remains well
below pre-crisis levels. Firmer demand and higher oil and gas prices have led to
diverging investment strategies. Cost control remains a common theme, but some
major national oil companies are looking to invest counter-cyclically to gain market
share. Qatar’s decision to move ahead with the world’s largest liquefied natural
gas (LNG) expansion, and to include carbon capture in its development plans, is
a strong statement of intent to maintain a leadership position in LNG.
There are strong pressures on private companies to keep oil and gas portfolios in
check. Despite higher prices, the major oil companies are holding aggregate oil
and gas spending flat in 2021, and their share of overall upstream spending is now
at 25%, compared with nearly 40% in the mid-2010s. The shale sector is, for the
moment, sticking to its newfound commitment to capital discipline, using higher
revenues in 2021 to pay down debt and return money to shareholders rather than
to increase output.
The predominance of state-owned companies is also visible in coal supply, with
investment dynamics largely determined by what happens in China and India. In
China, the policy priority is to modernise the sector by shutting down small,
inefficient mines and investing instead in large, fully mechanised mines. In India,
the main driver behind domestic investment is to reduce coal imports.
Overall, the overwhelming bulk of fuel supply investment in 2020 went into fossil
fuels – 84% to oil and gas and 14.5% to coal (which is a much less capital-
intensive sector). Around 1.3% was spent on low-carbon fuels. Today’s
2
This report is being produced by the IEA in collaboration with the World Bank and the World Economic Forum, for launch
on 9 June 2021.
IEA. All rights reserved.
PAGE | 11World Energy Investment 2021 Executiive summary
investment spending on fuels appears caught between two worlds: neither strong
enough to satisfy current fossil fuel consumption trends nor diversified enough to
meet tomorrow’s clean energy goals.
An uptick in investment decisions for new coal-fired
power plants underscores that coal is down, but not out
The rising share of renewables in new power generation investment has been
accompanied by a sharp drop in approvals for new coal-fired power plants, which
are some 80% below where they were five years ago. However, there was a slight
increase in go-aheads for new coal-fired projects in 2020. This was largely due to
China, where the government lowered restrictions on building new plants, giving
a green light for construction in more provinces. Cambodia, Indonesia and
Pakistan were other countries where coal-fired final investment decisions (FIDs)
picked up in 2020. Those three countries together approved almost 5 gigawatts
(GW) of new coal capacity in total. In India, the amount approved dropped below
1 GW, its lowest level in a decade.
China’s coal-fired FIDs in 2020 were about 25% their 2010 level, India’s less than
5%. FIDs for gas-fired power plants edged down globally in 2020 but were still
more than double those of coal (50 GW versus 20 GW). A large reduction in FIDs
for new gas-fired capacity in the United States more than offset growth in parts of
Asia (outside China and India).
From a low base, investments by the oil and gas industry
in clean energy technologies are starting to pick up.
Oil and gas companies are coming under increasing pressure to adapt their
investment strategies to the needs of clean energy transitions. This takes different
forms, including commitments to reduce emissions resulting from oil and gas
supply or to invest into new areas such as clean electricity or sustainable fuels.
In 2020, clean energy investments by the oil and gas industry accounted for only
around 1% of total capital expenditure. However, our tracking suggests that
commitments to diversify investment, led by large European companies, are
already starting to have an impact. If performance so far in 2021 is maintained for
the full year, the share of capital investment by the oil and gas industry going to
clean energy investments could rise to more than 4% in 2021. Project financing
for offshore wind – closely aligned with industry strengths – was considerably
higher in the first quarter of 2021 than in the whole of 2020.
IEA. All rights reserved.
PAGE | 12World Energy Investment 2021 Executiive summary
Support for innovation is a key pillar of net zero plans,
but 2020 saw diverging trends between government and
corporate spending on energy research & development
Public spending on energy research & development (R&D) continued to rise in
2020, with the share of low-carbon technologies in the total rising to 80%.
However, energy R&D spending by the private sector dropped by around 2% as
the pandemic caused cuts to corporate budgets. Governments have a key role to
play in ensuring that the world’s capacity to bring new technologies to market is
not disrupted by the pandemic.
The signals for investment in low-carbon energy innovation in early 2021 are
broadly positive. Major economies have highlighted innovation and increased
funding as part of their drive to net-zero emissions. In total, we estimate that
through 2030, over USD 50 billion of public funds could be available for major
demonstration projects for large-scale low-carbon energy technologies, including
CCUS and other ways to mitigate industrial emissions. Another source of optimism
is the observed resilience in 2020 of early-stage venture capital funding for low-
carbon energy technologies.
IEA. All rights reserved.
PAGE | 13World Energy Investment 2021 Electricity
Electricity
Overview
Investment in the global electricity sector is expected to increase by around 5% in
2021. The pandemic flattened investment in this sector in 2020, as the resilience
of spending on renewables compensated for drops in electricity grids and larger
reductions in fossil fuel generation. The resumption of growth in electricity
spending is a reflection of the central role of electricity in development strategies
and energy transitions, alongside expectations of improvements in the economy
and in the overall public health situation.
Global investment in the power sector by technology, 2011-2021E
1 000 100% Battery storage
Billion USD (2019)
Electricity networks
800 80%
Nuclear
600 60%
Fossil fuel power
400 40% Renewable power
EMDEs (share,
200 20% right axis)
2011-15 2016 2017 2018 2019 2020 2021E
IEA. All rights reserved.
Note: EMDEs = Emerging Market and Developing Economies, excluding China.
China and the United States continue to attract about half of global power sector
investment, both showing positive investment growth in 2020 despite the
pandemic. This was driven by a large increase in spending on renewables projects
– especially wind – in advance of a withdrawal of the previous subsidy regime in
China, and a deadline for eligibility for tax credits in the United States. After a
record year, investments in renewables could fall in China in 2021 (though they
are likely to stay at levels well above 2019), despite the country’s announced 2060
carbon-neutrality target. New support for clean energy investment in the United
States includes both financial aspects as well as permitting and regulatory
IEA. All rights reserved.
PAGE | 14World Energy Investment 2021 Electricity
changes, which are likely to spur increased investment in 2021 and beyond.
Investment in Europe’s power system was also relatively resilient through the
pandemic, and is likely to grow in 2021, led by higher spending on renewables,
especially as disbursements of the European Union (EU) Green Recovery
package kick in during the second half of 2021 and beyond.
However, the overall state of play in EMDEs (excluding China) is less upbeat.
Power sector investment in EMDEs was more affected by the pandemic and the
economic downturn in 2020, down by 10% compared with the previous year. The
anticipated recovery is not enough to bring spending back to pre pandemic levels,
in large part because the twin public health and economic crises are more
prolonged. EMDEs account for nearly two-thirds of the global population but for
less than one-third of power sector spending. Market uncertainty, lockdowns and
reduced revenues fed into lower spending outlays on new projects, especially in
India, the Middle East and North Africa, and Southeast Asia. Despite the 2021
increase, trends in EMDEs remain well out of step with the massive scale-up in
investment required in these countries to meet sustainable development goals.
Electricity generation
Investment in renewables was remarkably robust in 2020
and continues to dominate spending on new generation
Renewables are dominating inflows of capital to new power generation capacity,
and these investments remained robust in 2020 given the disruption caused by
Covid-19. The share of renewables in total power sector spending (including
network infrastructure) was above 45% in 2020. A further increase in renewable
investment is expected in 2021 as economies recover.
Capital expenditures for renewables increased by around 7% in 2020 compared
with 2019, despite capital costs continuing on a downward trend. For example,
utility-scale solar PV installation costs decreased by 10% in 2020 while onshore
wind decreased by 5%, on a global average basis. Overall, a dollar spent on wind
and solar PV deployment in 2020 is associated with four times more output than
a dollar spent on the same technologies ten years earlier, because of technology
improvements and reduced costs.
IEA. All rights reserved.
PAGE | 15World Energy Investment 2021 Electricity
Investment in solar PV and wind power and its expected generation output, 2010-2020
Investment spending Output from new capacity
600 600
Billion USD (2019)
TWh
500 500
400 400
300 300
200 200
100 100
2010 2015 2020 2010 2015 2020
Solar PV Wind: onshore Wind: offshore
IEA. All rights reserved.
Source: IEA calculations with capital cost data from IRENA (2021) and capacity factors from IRENA (2019).
The 45% increase in renewable deployment in 2020 was largely due to a record
year for wind power installations. Wind capacity almost doubled compared to
2019, to 114 GW, while solar PV also expanded by almost a quarter, reaching
almost 135 GW. An astonishing 70 GW of new wind power capacity was brought
online in China, while the United States followed in second place, connecting more
than 15 GW of onshore wind.
There was a negative shock to renewable investments in many EMDEs in 2020
but there were also some exceptions. Viet Nam, for example, managed the crisis
remarkably well while continuing to attract capital to renewables: the phase out of
feed-in tariffs (FITs) for solar PV projects resulted in a drop in utility-scale
investment, but distributed PV drove a continued boom in 2020, with over 9 GW
of rooftop solar installed.
Investments in renewables are set to continue growing in 2021, consolidating the
record growth of 2020 albeit at a slightly slower rate. Renewables are central to
achieving enhanced emissions targets, including net-zero pledges, announced by
countries and companies around the world. Costs and capacity factors for key
technologies continue to improve, especially for solar PV that reached new record
lows in various tenders and auctions across the world during 2020 and the
beginning of 2021. This included around USD 13 per megawatt-hour (MWh) in a
700 megawatt (MW) auction in Portugal in August 2020 (PV Magazine, 2020),
followed by a record low of just over USD 10/MWh announced in Saudi Arabia in
early 2021 for a 600 MW project (Taiyang, 2021). In addition, the stocks of
IEA. All rights reserved.
PAGE | 16World Energy Investment 2021 Electricity
renewable players have also done well, helped by expansive monetary policy and
a generally positive market sentiment towards low-carbon assets.
Solar PV – rather than wind – is set to lead the growth in renewables spending in
2021, given its competitiveness and the existing pipeline of projects committed in
tenders, auctions and corporate power purchase agreements (PPAs).
Investments in solar PV are anticipated to grow by more than 10% in China, India,
the United States and Europe. This growth stems not only from the commissioning
of utility-scale solar PV projects, but also from an uptick in investments in
distributed solar PV facilitated by improving economic and public health
conditions.
While net-zero strategies and low financing costs set a very positive context for
renewable generation in advanced economies, permits and licences could hinder
some of this momentum, especially for onshore wind. These factors are starting
to represent a bottleneck in Europe, where permits take long to obtain and
decisions are at times challenged in court (Wind Europe, 2021). Under
subscription was also a problem in wind auctions in Germany. This is also true in
many EMDEs, on top of land- and grid-related issues. In India, wind auctions were
at a standstill in the first half of 2020 and 60% of the capacity auctioned in the
second half was not allocated.
These constraints are less visible in relation to investment in offshore wind, which
is expected to continue to show strong growth, given rising policy support in
Europe and around the world. There are strong expectations of low prices for new
offshore wind tenders in Germany, Japan, the United Kingdom and the
United States. In May 2021, the US authorities gave the green light for the
construction and operation of the 800 MW Vineyard Wind project off
Massachusetts, the country’s first large-scale offshore wind project.
Nuclear power, which represents around 5% of total global investment, was also
quite resilient in 2020 and is set to increase in countries with well-defined nuclear
expansion plans such as China, India and the Russian Federation (hereafter,
“Russia”). China, for example, commissioned 2 GW in 2020, but started
construction of 3 GW, about three times more than in 2019, and has plans to build
more nuclear plants in the coming years to align with its 2060 target for carbon
neutrality.
Investment in fossil-based generation decreased considerably in 2020, by more
than 10%, given lower demand and electricity prices, although there were notable
differences between countries and regions. Around a third of the 2020 drop came
from India, driven by lower spending in coal-fired plants, disruptions caused by
IEA. All rights reserved.
PAGE | 17World Energy Investment 2021 Electricity
lockdowns and lower electricity demand. In the United States, investment
increased, stemming from an uptick in investment in gas-fired plants, as firm
capacity becomes scarcer given the continued penetration of variable renewables
and the continuation of coal retirements (around 10 GW in 2020). Spending on US
fossil-fired plants is anticipated to rise in 2021. In China, investment in fossil fuel
generation declined in 2020 and is expected to do so again in 2021, although the
reduction in 2021 is at a much lower rate than in previous years, consistent with
our findings on project approvals.
Final investment decisions for dispatchable
power
An uptick in investment decisions of coal-fired power in
2020 shows that, while coal is well down, it is not out
In addition to our estimates of today’s investment flows to different parts of the
energy sector, i.e. current annual capital spending, our tracking of projects that
reach financial close or begin construction provides an additional forward-looking
indicator of future activity. These FIDs for large-scale dispatchable power
increased in 2020 to almost 95 GW.
This includes an uptick in FIDs for coal-fired power, which reached 20 GW in 2020,
the first increase since 2015. Even though these FIDs are now 80% below where
they were five years ago, this is nonetheless a reminder that energy transitions do
not follow a simple storyline. The increase came largely from China, with a 45%
increase compared with 2019, reaching almost 13 GW Nearly three times more
capacity obtained approvals for construction.This came after the government
lowered restrictions on building new plants, giving a green light for construction in
more provinces. Cambodia, Indonesia and Pakistan were other countries where
coal-fired FIDs picked up in 2020, approving almost 5 GW in total, while they
dropped in India to less than 1 GW, the lowest level of the decade. China’s coal-
fired FIDs in 2020 were a quarter of where they were in 2010, India’s less than
5%.
A considerable amount of coal is still included in power expansion plans across
several Asian countries, even in countries that are also pushing strongly for
renewables. Viet Nam is a good example, in that it is targeting almost 130 GW of
renewable capacity by 2045 while also more than doubling its anticipated coal-
fired capacity over the same period, according to the latest national power
development plan draft .
IEA. All rights reserved.
PAGE | 18World Energy Investment 2021 Electricity
FIDs for coal and gas, 2015-2020 (GW)
Coal-fired Gas-fired
100 100
GW
80 80
60 60
40 40
20 20
2015
2016
2017
2018
2019
2020
2015
2016
2017
2018
2019
2020
China India Southeast Asia United States MENA Rest of world
IEA. All rights reserved.
Note: MENA = Middle East and North Africa.
Source: IEA calculations based on McCoy (2021).
Investment decisions for gas-fired plants edged down in 2020, largely due to a
considerable reduction in FIDs in the United States, which more than offset growth
in Asia (outside China and India). FIDs for the largest sources of low-carbon
dispatchable generation – hydropower and nuclear – were more than 20 GW, 40%
higher than the previous year, driven by FIDs of hydro power in India, to provide
balancing for increased shares of variable renewable generation.
Grids and storage
The decline in grid investment is likely to be reversed in
2021 with rising infrastructure spending in Europe and
China – and major plans announced in the United States
After declining for the fourth consecutive year in 2020, spending on electricity grids
is expected to go up substantially in 2021. Most of the 2020 decline stemmed from
a reduction in China and several EMDEs, which more than outweighed increases
in the United States and Europe. In China, the majority of the drop came in the
distribution sector, as targets for rural power grid expansion had been met and
focus shifted to transmission, which represents a smaller share of grid
investments. However, there are large expansion plans expected for 2021 –
especially in China and Europe – which are set likely change this trend. In Europe,
IEA. All rights reserved.
PAGE | 19World Energy Investment 2021 Electricity
for example, the 2021-30 grid expansion plans provide the foundation for
increased investment, supported by the recovery plans.
Investment in grids by geography and segment, 2016-2021E
350 350
Billion USD (2019)
300 300
250 250
200 200
150 150
100 100
50 50
2016
2017
2018
2019
2020
2021E
2016
2017
2018
2019
2020
2021E
United States China India Distribution Transmission
Europe Rest of the world
IEA. All rights reserved.
Note: Investment in electricity networks is calculated as capital spending for installed lines, associated equipment and
refurbishments.
In the United States, the proposed American Jobs Plan includes measures to build
a more resilient electricity transmission system as part of the drive for carbon-free
electricity by 2035. This includes the creation of a targeted investment tax credit
and efforts to better leverage existing rights-of-way along roads and railways for
high-voltage lines. These kinds of measures underline the broader importance of
policies and regulation in faciltating network investments, by incentivising
connections to the grid, especially for new wind and solar projects; simplifying
procedures to make public land available for electricity infrastructure; speeding up
response times; or rethinking authorisation procedures for minor categories of
projects.
Despite the pandemic, investment in battery storage increased by almost 40% in
2020, to USD 5.5 billion. Given the strong momentum of the sector and the big
pipeline of projects, this trend is set to continue over 2021. Spending on grid-scale
batteries rose by more than 60%, driven by the push for renewables investment
and growing presence of hybrid auctions with storage. Average costs continued
to reduce substantially, by an average 20%. This also helped drive the impressive
resilience of grid-scale batteries, especially in the United States and China – which
installed over 1 GW – followed by Korea and Europe.
IEA. All rights reserved.
PAGE | 20World Energy Investment 2021 Electricity
On the other hand, investments in behind-the-meter storage decreased by 12%,
as these assets are generally financed by households and small and medium
companies that were generally more affected by the Covid-19 pandemic.
Nonetheless, behind-the-meter storage is expected to pick up again in 2021 as
the global economy improves.
Battery storage investment, 2014-2021E
Grid-scale battery storage Behind-the-meter battery storage
5 Rest of the world
Billion USD (2019)
Middle East
4
China
3 Korea
Japan
2
Australia
1 Europe
United States
2014
2015
2016
2017
2018
2019
2020
2021E
2014
2015
2016
2017
2018
2019
2020
2021E
IEA. All rights reserved.
Source: IEA calculations based on Clean Horizon (2021), BNEF (2021), China Energy Storage Alliance (2021).
Implications
Electricity investment is still a long way short of what is
needed for a cleaner and more electrified energy future
The headline numbers for investment in electricity show some positive signs,
notably the resilience in 2020 and the prospective increase in 2021. However,
analysis of some of the details – and a comparison with what would be required
in climate-driven scenarios – present a much more sobering picture. The world is
a long way short of the path that needs to be followed to avoid severe impacts
from climate change. The slight increase in FIDs of new coal-fired plants in 2020
shows that not all indicators are pointing in the right direction.
IEA. All rights reserved.
PAGE | 21World Energy Investment 2021 Electricity
Global investment in the electricity sector compared with annual average investment
needs, 2025-2030, by scenario
2 500
Billion USD (2019)
Battery storage
2 000 Fossil fuels with CCUS
Electricity networks
1 500
Nuclear
1 000
Fossil fuels without CCUS
500 Renewable power
2011- 2016- 2021E STEPS SDS NZE
15 20 2026-30
IEA. All rights reserved.
Note: STEPS = Stated Policies Scenario, SDS = Sustainable Development Scenario, NZE = Net Zero Emissions by 2050.
In advanced economies and in China, the availability of money for power sector
investments does not appear to be a binding constraint – there is strong
competition for high-quality investment opportunities against a backdrop of low
lending rates and pressure to increase exposure to clean energy. However, the
flow of projects is often intermittent, due to time-limited subsidy programmes or
other administrative and permitting constraints. Improving the certitude and clarity
of investment frameworks will be key to unlocking private capital at scale for
mature technologies such as wind and solar PV.
At the same time, policy makers need to ensure that the pace of change on the
generation side is matched by investment in robust energy grids, storage and all
forms of flexibility: the priority attached to infrastructure in recovery strategies is a
positive signal in that regard.
By contrast, the signals from many EMDEs are a source of much greater concern.
With few exceptions, the downside risks to investment from the pandemic are
more substantial, the risks facing new clean electricity and infrastructure
investments are higher, and sources of finance more constrained. This topic is
examined in much more detail in forthcoming IEA analysis, entitled Financing
Clean Energy Transitions in Emerging Market and Developing Economies.
IEA. All rights reserved.
PAGE | 22World Energy Investment 2021 Fuel supply
Fuel supply
Overview
After a precipitous fall in 2020 of more than 25%, total fuel supply investment is
expected to rebound by about 14% from just over USD 620 billion to nearly
USD 710 billion in 2021. The vast majority of fuel supply investment in 2020 went
into fossil fuels – around 84% to oil and gas and just over 14.5% to coal (which is
a much less capital-intensive sector). Only around 1.3% was spent on low-carbon
fuels. However, as we explore later in this section, companies – including in the
oil and gas industry – are starting to allocate more capital spending to projects in
low-carbon fuels and CCUS; this is set to have a tangible influence on future
investment trends.
Oil and gas upstream
Upstream spending set to rise in 2021, but the oil and
gas industry remains under strong pressure from the
pandemic and from energy transitions
The oil and gas industry has never seen a year like 2020, and the reverberations
are still being felt in the finances and strategies of companies across the sector.
After a sharp decline in 2020, our bottom-up analysis of publicly announced oil
and gas company spending plans shows an 8% increase in upstream spending in
2021, taking the total spending to over USD 350 billion, but this remains well below
2019 levels.
IEA. All rights reserved.
PAGE | 23World Energy Investment 2021 Fuel supply
Upstream spending by selected company, 2020-2021E
Majors
ExxonMobil 25%
Shell 3%
Chevron 4%
Total 14%
BP 8%
Eni 22%
ConocoPhillips 5%
National oil companies
Petrochina 3%
Saudi Aramco 30%
Petrobras 40%
Equinor 14%
Independents
EOG Resources 3%
Suncor Energy 0%
Occidental 18%
Repsol 27%
Continental 17%
Hess 0%
10 20 30
2020 2021E Billion USD (2019)
IEA. All rights reserved.
Source: IEA calculations based on company reporting.
Prices and revenues have been higher in the first quarter of 2021, but it is far from
certain that this will trigger additional upstream spending. Companies face multiple
dilemmas as they put together their spending plans. Demand uncertainties related
to the pandemic and the speed of energy transitions are accompanied on the
supply side by the large spare capacity held by countries in the OPEC+ 3 grouping,
and questions over the pace at which OPEC+ supply cuts will be unwound.
There are variations among companies but, in aggregate, the Majors are holding
a conservative line on upstream capital spending plans: these are essentially flat
compared with 2020 (-2%). Continued investor pressure to diversify into low-
carbon energy underpins more modest spending programmes, which are also
aimed at reducing debt and supporting dividend payments (see discussion below
3
OPEC+ comprises the members of the Organization of the Petroleum Exporting Countries as well as Azerbaijan, Bahrain,
Brunei, Kazakhstan, Malaysia, Mexico, Oman, the Russian Federation, South Sudan and Sudan.
IEA. All rights reserved.
PAGE | 24World Energy Investment 2021 Fuel supply
on the industry in transition). Upstream spending by the Majors as a group has
traditionally been well above the levels from their peers in the Middle East, Russia
and China; this is no longer the case.
Upstream spending by selected company types
160 Majors
Billion USD (2019)
140
Chinese
120 NOCs
100 Russian
companies
80
Middle East
60 NOCs
40
20
2015 2016 2017 2018 2019 2020 2021E
IEA. All rights reserved.
Source: IEA calculations based on company reporting.
The shale sector is another crucial bellwether for investment trends and market
balances. After another round of belt-tightening in 2020, shale players face the
unfamiliar prospect of generating significant free cash flow in 2021. For the
moment, the industry is using the influx of cash to pay down debt and return money
to shareholders, rather than increase output. Investors have welcomed this
commitment to capital discipline. However, if or when a leaner and more profitable
sector starts to regain the confidence of capital markets, priorities could swing
again back towards growth.
Caution remains the watchword also for the exploration sector, which slumped
already in the 2010s as companies turned to shale (which does not require
exploration in the usual sense). Exploration activity is sharply down in most parts
of the world, with the main pocket of activity outside of the Middle East being in
offshore Brazil, Guyana and Suriname.
The overall expectation is that upstream investment by National Oil Companies
(NOCs) increases by around 10% in 2021, but this average figure masks a range
of spending plans, strategies and financial pressures. While many NOCs still face
severe revenue and spending constraints, some are stepping up countercyclical
investments. China’s NOCs – PetroChina, China National Offshore Oil
IEA. All rights reserved.
PAGE | 25World Energy Investment 2021 Fuel supply
Corporation (CNOOC) and Sinopec – have announced large capital budgets for
2021, with PetroChina having the largest upstream programme of any company.
Some large players in the Middle East are also in expansion mode, with Saudi
Aramco and Abu Dhabi National Oil Company (ADNOC) both charged with
increasing production capacity by around 1 mb/d in the coming years. ADNOC
announced a USD 120 billion spending programme for 2021-25 with this in mind.
Saudi Aramco plans total capital expenditures of USD 35 billion in 2021 (versus
USD 27 billion in 2020); although the need to keep revenue flowing to the state
during the crisis has pushed up the company’s borrowing, taking on an extra
USD 90 billion in debt in 2020.
Refining
Pressure to consolidate and retool for a new age is
growing in the refining sector
The refining industry had an extremely challenging year in 2020 with the collapse
in oil demand. Estimated refining investment (greenfield and upgrades) fell by
more than a quarter to just under USD 38 billion, a sharp reversal from the record-
high investment in 2019. As the most lucrative products such as gasoline, diesel
and jet fuel registered large declines, refinery runs fell to 74.4 mb/d, a level last
seen in 2010, and margins plunged to their lowest in at least two decades. This
triggered a wave of announcements of closures for 2020-26, mostly in advanced
economies, amounting to 3.6 mb/d in total.
However, refining expansion plans are continuing in parallel in regions with access
to cheap feedstock and growing markets, most notably in developing economies
in Asia and the Middle East. These regions, which accounted for 80% of the
investment in 2020, are expected to underpin a rebound in investment in 2021.
Some 8.5 mb/d of new refining capacity is still expected to come online over the
period to 2026, resulting in 4.9 mb/d of net capacity additions. The projected scale
of net capacity additions is much larger than that of refined product demand
growth, which is likely to force further capacity closures or repurposing.
A number of refiners have started to retool for a new age characterised by
structural demand shifts from transport fuels to non-combustion uses (such as
petrochemical feedstock) and accelerating momentum for energy transitions.
Some are betting on the most resilient part of demand – petrochemicals – by
making investments in petrochemical integration. Others are expanding into low-
carbon businesses such as advanced biofuels, chemical recycling and low-carbon
hydrogen in order to secure new sources of revenue. For example, some
IEA. All rights reserved.
PAGE | 26World Energy Investment 2021 Fuel supply
345 thousand barrels per day (kb/d) of refining capacity has already been
converted to biorefineries and there are plans for 840 kb/d more. These strategic
shifts are set to grow against a backdrop of increasing electro-mobility.
Liquefied natural gas and pipelines
Qatar makes a strong statement of intent with its move
to expand LNG capacity
LNG liquefaction investment dropped by more than a third in 2020 but is expected
to grow by more than two-thirds in 2021 to over USD 23 billion. Qatar, Russia and
the United States are set to pick up construction project activity, although the
outlook remains very uncertain in Mozambique due to security concerns. LNG
demand grew by 1% in 2020 (net of reloads), setting it apart from natural gas
consumption as a whole, which recorded a 1.9% decline. However, the record
year for financial close on new LNG projects in 2019 was followed by a year in
which only one project reached FID – the 3.25 million tonne per annum (Mtpa)
Costa Azul project in Mexico – from a queue of over 200 Mtpa worth of potential
projects worldwide. This investment standstill was due to a combination of excess
supply and low global gas price benchmarks, widespread capex cuts by the major
national and international oil companies, uncertainty about future LNG demand
related to the economic impacts of the pandemic, and a lack of buyer appetite for
long-term LNG contracts.
Sanctioned LNG export capacity (LH) and annual investment spending on sanctioned
projects (RH)
100 40 800
Billion USD (2019)
bcm per year
bcm per year
80
30 600
60
20 400
40
10 200
20
2010
2012
2014
2016
2018
2020
2010
2013
2016
2019
2022
2025
Europe Russia North America Middle East
Cumulative capacity
Africa Others Australia (right axis)
IEA. All rights reserved.
Note: bcm = billion cubic metres.
IEA. All rights reserved.
PAGE | 27World Energy Investment 2021 Fuel supply
Market signals for LNG picked up in late 2020, with a sharp rebound in prices due
to colder weather across Asia, a drop in nuclear and coal in Japan and Korea, and
unplanned outages of LNG terminals: in early 2021, some spot LNG cargoes were
bought for up to USD 40 per million British thermal units. US LNG exports ramped
up to record highs in late 2020 and entered 2021 with strong growth, spurred in
part by falling charter rates.
The announcement in February 2021 of an FID for Qatar Petroleum’s 33 Mtpa
North Field East expansion, the largest single LNG project by capacity ever
sanctioned, ensures continued capacity growth from the mid-2020s. The company
also launched a trading arm in 2020 to participate in the growing spot market for
LNG through physical and derivatives trading. As the lowest-cost supplier with
ample gas reserves, Qatar and its expansion, inclusive of carbon capture, casts a
long shadow over other aspiring LNG projects, particularly those in the
United States where there is a long queue of potential projects seeking to move
to FID. Qatar’s bid to offer low-emissions LNG is also a statement of intent to
burnish the environmental credentials of LNG. It comes at a time where a growing
contingent of buyers have made net-zero commitments and appear interested in
measuring, and in some cases offsetting, the emissions associated with their
contracted cargoes.
On the import side, there are nearly 200 bcm of regasification capacity under
construction worldwide. Despite construction delays due to Covid-19 and project-
specific issues, a pipeline of new projects, particularly in Asia, is aiming to ensure
that infrastructure is in place to satisfy anticipated growth in demand.
Natural gas pipelines saw a mixture of traditional project advances and delays in
2020 while natural gas grid operators in mature markets began to eye
opportunities to build and operate cross-border hydrogen networks. In the United
States, additional Permian associated gas volumes secured routing to export
options in Mexico and the US Gulf Coast with the completion of KinderMorgan’s
Permian Highway pipeline and Whitewater/MPLX’s Aqua Blanca Delaware
gathering system, which will connect to Whistler in 2021. In Europe, gas
infrastructure and hydrogen network planning are becoming increasingly
integrated: the industry-led European Hydrogen Backbone initiative foresees
some 40 000 km of hydrogen pipeline infrastructure in Europe by 2040, with
two-thirds of this being repurposed pipelines.
IEA. All rights reserved.
PAGE | 28World Energy Investment 2021 Fuel supply
Biofuels (liquids and gases)
Policies are cushioning some of the effects of the slump
on biofuels
Near-term investment prospects for liquid and gaseous biofuels are heavily reliant
on government policies to counteract the uncertainties created by the pandemic,
in particular the lower operating margins arising from lower fuel prices. Investment
in these projects dipped in 2019 and fell further in 2020 to just over USD 8 billion.
In the case of liquid fuels, the focus for new production capacity is changing from
ethanol to hydro-treated vegetable oil (HVO), also known as renewable diesel, for
which global production capacity is set to triple by 2025. For example, in the United
States, policy-driven demand of HVO from the federal Renewable Fuel Standard
(RFS2), California’s Low Carbon Fuel Standard (LCFS) and the reintroduced
Blender’s Tax Credit has not only counterbalanced the effects of the pandemic but
also caused a flurry of investments in production capacity, including the
conversion of several traditional refineries. Investment in biodiesel capacity
remained strong also in Asia and Brazil.
Ethanol capacity investments are driven by Brazil and China, which together
represent around half of global investments, followed by Southeast Asia, but
Covid-19 has affected investment plans in several markets. Capacity in China has
doubled since 2017, and several large new plants are under development. In
2020, due to ethanol shortages associated with the Covid-19 pandemic, the Thai
government pushed back the policy making E20 the principal blend for passenger
vehicles. Brazil scaled back the 2020 target for its RenovaBio policy by 50% and
the 2021 target by 40%, due to Covid-19 demand decreases.
Biomethane is emerging as a promising low-carbon alternative to natural gas. The
current market is about 8 bcm – a tiny fraction of total natural gas supply – but
investment activity has picked up in recent years as several countries, particularly
in Europe and North America as well as Brazil, China and India, have encouraged
its use, primarily in the transport sector. There are now more than
1 000 biomethane plants around the world, incentivised by a variety of policy
instruments such as quotas, direct subsidies, tax exemptions and guaranteed
offtake agreements. Several oil majors, notably Total, BP, Shell and Chevron,
have recently announced forays into biomethane, following earlier initiatives by
many European utilities and gas grid operators.
IEA. All rights reserved.
PAGE | 29You can also read