Large Water Bodies - Air ...
←
→
Page content transcription
If your browser does not render page correctly, please read the page content below

The
                        The Magazine
                            Magazine for
                                      for Environmental
                                          Environmental Managers
                                                        Managers   October
                                                                   October 2020
                                                                           2020

Analyzing Ozone Pollution Near
Large Water Bodies
SEEING IS
BELIEVING
Measurement is proof
Hyperlocal PM2.5 and PM10
Air Quality Monitoring
Pollution can affect air quality across a region or
city, but can also be localized to a community,
neighborhood, or even a single building.
The TSI BlueSky™ Air Quality Monitor is a                   222
lightweight, laser-based particle instrument
designed to simultaneously measure PM2.5
and PM10 mass concentrations, as well as                                     53
temperature and relative humidity.
                                                                  77
+ TSI factory-calibrated PM sensor for
  precision data
+ Strong correlation to reference
+ Real-time map of live data, without
  additional software or an app
+ Easy and quick installation
                                                      159
To learn more, visit tsi.com/BlueSky-EM

                                                                       111
                   40

                           88

            BlueSky                      ™
Table of Contents

                                         Recent Advances in
                                         Understanding Ozone Pollution
                                         Near Large Water Bodies
                                         by Susan Wierman, Leiran Biton, and Joel Dreessen
                                         The interplay between emissions and meteorology near large
                                         water bodies requires in-depth technical analysis. Research has
                                         shown that high ozone concentrations can form over water and
                                         affect both nearby and more distant coastal areas, and that
                                         high-resolution air quality models are needed to represent local
                                         conditions more accurately. The four studies highlighted in this
                                         issue of EM exemplify inter-agency and inter-state cooperative
                                         efforts to advance scientific understanding of air pollution near
                                         the land–water interface.

Features

LISTOS: Toward a Better Understanding of                 OWLETS: An Enhanced Monitoring Strategy
New York City’s Ozone Pollution Problem                  Directly within the Chesapeake Bay
by Alexandra Karambelas                                  by John Sullivan, Joel Dreessen, Timothy Berkoff,
                                                         Ruben Delgado, Xinrong Ren, and Tad Aburn

LMOS: 2017 Lake Michigan Ozone Study                     SCOAPE: Satellite and Shipboard Views of
by Zachariah E. Adelman, R. Bradley Pierce,              Air Quality along the Louisiana Coast
Charles O. Stanier, and Donna M. Kenski                  by Anne M. Thompson, Debra E. Kollonige,
                                                         Ryan M. Stauffer, Nader Abuhassan,
                                                         Alexander E. Kotsakis, Robert J. Swap, and
                                                         Holli (Ensz) Wecht
Departments
            Message from the President:                 Back In Time:
            2020: Our Year to ‘Pivot’                   A&WMA’s Annual Critical Review Turns 50
            by Kim Marcus                               1984 Annual Critical Review:
                                                        Source-Receptor Relationships for
                                                        Acid Deposition: Pure and Simple?
2021 EM Editorial Calendar Preview                      by George M. Hidy

                      em • The Magazine for Environmental Managers • A&WMA • October 2020
Cover
                                                   Message
                                                       Story by
                                                             from
                                                                Melanie
                                                                  the President
                                                                         L. Sattler

                                               2020
                                               Our Year to ‘Pivot’
                                               Kim Marcus » president@awma.org

A&WMA has been through challenging times this year,                  As I started this month’s message, I used the word “pivot,”
brought on by a unique set of events, including a global             which has become something of a buzzword over the past
pandemic, renewal of racial justice movements, and a his-            few months. To me, to pivot means to do things differently,
toric presidential race. The last time the Association faced a       to think outside the box, to use ingenuity and technology,
pandemic was the Spanish flu in 1918, the 11th year of the           and, most importantly, to take this opportunity to update
Association. I do not know how they made it through those            and upgrade ways of doing things that have become rou-
tragic times, but they did; as will we, even though the path         tine and about which we have become complacent. Do I
may not yet be fully clear to us. The past five years have           wish that the world was not having to reinvent itself in the
generally been good financially, which gives us some                 face of a global disaster? Of course. But it is, so we need
economic freeboard to weather these uncertain times.                 to think about how best to pivot. A&WMA’s Board of
Our ability to pivot to a Virtual ACE and expand and deliver         Directors is looking at opportunities, and there are many,
webinars and other virtual programming would not have                to enhance the Association’s mission. While we have many
been possible over a century ago and has ensured some                ideas, some of which will be easily implemented, others
continuity in our activities. With the continued support of          will be harder, and still others are likely to be culled as too
membership and an excellent, resourceful, and diligent               hard to do. Some of our current thinking includes:
staff we will persevere and find new ways of thriving.
                                                                        • Recording content -- ACE has shown us that we
As we move into fall, A&WMA is increasing the frequency                   can host content online for viewing in any time
and diversity of virtual content delivery. Many thanks to                 zone, and that participants are able to view every
the members who participate, organize, collaborate, and                   paper, plenary session, or meeting;
deliver this wide variety of programs. In parallel and collab-
oratively, headquarters’ staff organizes, promotes, designs,            • Sharing content -- We can share content among
and delivers the content to members and non-members. If                   our Sections and Chapters. A talk given in a
you have a topic idea, think a new or amended regulation                  Section or Chapter meeting in Vancouver, Bogota,
is important, or a court case would be of interest to                     Mexico City, Shanghai, Paris, Baton Rouge,
members, please contact the webinar committee, Technical                  St Paul, or Portland can be seen by any member
Council, headquarters’ staff, or any member of the Board                  anywhere;
of Directors. Be sure to check out our new and dynamic
programming by visiting www.awma.org often and look                     • Mixing live and recorded sessions -- Conferences
for emails and notices for the latest on upcoming webinars,               could have a mix of recorded papers and live
workshops, and virtual conferences.                                       presentations with Q&A sessions enabling people
                                                                          in all time zones to participate; and
This month, EM focuses on air quality studies of the land
and water interface, with a variety of articles that address            • Messaging -- The A&WMA President and/or
observations and impacts at the interface of waterbodies                  Executive Director could be “in” the room at
and land that often generate marine layers that trap,                     any Section and Chapter event for a five-minute
concentrate, and then release air pollutants. Case studies                update of what’s happening at the International
address these issues in Lake Michigan, Long Island Sound,                 Association level.
Chesapeake Bay, and along the Louisiana Coast. While
the focus is on North American waterbodies, clearly this             These opportunities allow us to the things that we all
happens around the world and gives us an opportunity                 enjoy—learning, teaching, sharing, and connecting—which
to ponder the global, interconnected nature of the                   is really A&WMA’s raison d’être and is more important
environmental issues we face.                                        now than ever. em

                             em • The Magazine for Environmental Managers • A&WMA • October 2020
Cover Story by Susan Wierman, Leiran Biton, and Joel Dreessen

      Recent Advances in
 Understanding Ozone Pollution
   Near Large Water Bodies
The four studies highlighted in this issue of EM exemplify inter-agency and inter-state
cooperative efforts to advance scientific understanding of air pollution near the
land–water interface.

                   em • The Magazine for Environmental Managers • A&WMA • October 2020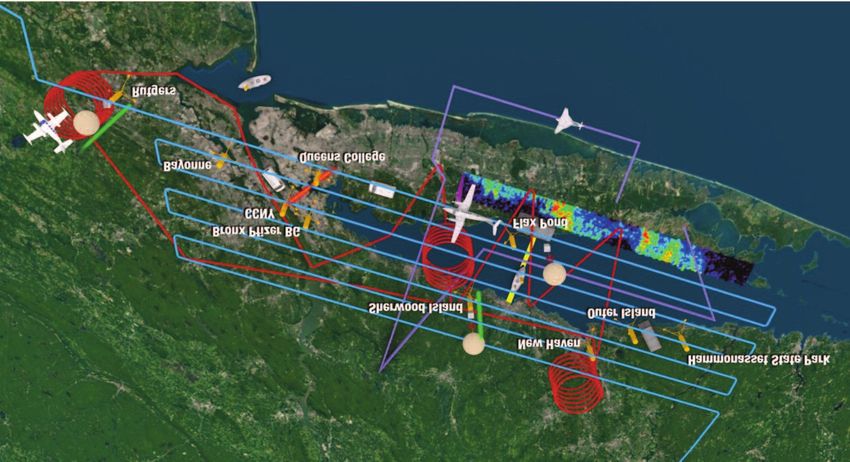
Cover Story by Susan Wierman, Leiran Biton, and Joel Dreessen

The interplay between emissions and meteorology near                   billion (ppb) 8-hr O3 National Ambient Air Quality Standard
large water bodies requires in-depth technical analysis.               (NAAQS) in 2015, the agency also substantially revised the
Research has shown that high ozone (O3) concentrations                 requirements for enhanced monitoring plans for O3 and its
can form over water and affect both nearby and more                    precursors. To help states develop plans to comply with new
distant coastal areas, and that high-resolution air quality            monitoring requirements, in 2017 EPA published a “Techni-
models are needed to represent local conditions more                   cal Note”4 describing optional long-term monitoring meth-
accurately.1,2 Though major regional and local reductions in           ods, but also encouraging states to work collaboratively with
O3 precursors have significantly improved air quality in the           other agencies to conduct short-term intensive monitoring
eastern United States, episodic high O3 events persist,                campaigns if needed to help understand the formation of
particularly over large bodies of water and adjacent coastal           ozone in their particular areas. The results of special studies
areas, contributing to violations of the federal O3 standard.          like these, along with other analytical techniques and
Motivating the four studies described in this issue were               information, can help air quality managers develop effective
questions about the relative importance of emissions from              pollution control measures.
nearby industrial or urban centers versus more distant
sources of air pollution, the potential to use advanced                The first study included in this issue focuses on the complex
monitoring techniques to better understand pollution                   atmospheric chemistry and physics of Long Island Sound.
episodes, and the importance of improving the ability of air           High amounts of O3 precursors from the New York City met-
quality models to simulate the fine-scale dynamics of the              ropolitan area and areas upwind are transported over the
land–water interface. Scientists continue to stress the                Sound, where weak mixing allows intense O3 concentrations
importance of measuring O3 aloft (as was done in studies               to form. Then, an afternoon sea breeze transports the high O3
described here) to help resolve questions about local and              onshore in coastal Connecticut. As a result, the highest O3
long-distance transport of O3 and precursor pollutants.3               levels in the region consistently are not seen in New York City
                                                                       itself, but downwind along coastal Connecticut. Alexandra
The U.S. Environmental Protection Agency (EPA) has recog-              Karambelas’s article describes the context for the 2018 Long
nized the value of short-term special studies, such as those           Island Sound Tropospheric Ozone Study (LISTOS). She also
described in this issue. When EPA adopted the 70 parts per             looks ahead to how these data will be used in modeling to
                                                                                         better understand and develop controls to
                                                                                         reduce O3 pollution.

                                                                                       The next article focuses on the Baltimore
                                                                                       area, which has made steady progress to-
                                                                                       ward attaining the EPA O3 standards in part
                                                                                       due to targeted regional emissions reduc-
                                                                                       tions efforts such as the oxides of nitrogen
                                                                                       (NOX) SIP Call and also due to Maryland
                                                                                       regulations and the state’s Healthy Air Act.
                                                                                       However, episodes of high O3 over and
                                                                                       near the Chesapeake Bay have kept the
                                                                                       Baltimore area from attaining the 2015
                                                                                       ozone standard. Sites northeast of Baltimore
                                                                                       and adjacent to the northern coast of the
                                                                                       Chesapeake Bay continue to be the highest
                                                                                       reading O3 monitors in the area, despite
   Figure 1. Long Island Sound (July 28, 2019).                                        improvements in other parts of the region.
   Strong temperature gradients between the land and water on                          NASA’s Ozone Water–Land Environmental
   July 28, 2019, force a line of clouds along Long Island, while                      Transition Study (OWLETS) intensive moni-
   keeping the Long Island and Connecticut coastlines along the                        toring programs focused on the Chesapeake
   Long Island Sound cloud free. Every single coastal Connecticut                      Bay region, integrating in-situ and remotely
   O3 monitor exceeded 70 ppb on this day, along with a New                            sensed data from ground, water, air, and
   York monitor on the northern coast of Long Island.                                  satellite platforms. The article in this issue by
   Source: True color imagery from VIIRS instrument on the Suomi NPP                   John T. Sullivan and colleagues describes the
   satellite. NOAA JSTAR Mapper (https://www.star.nesdis.noaa.gov/jpss/mapper.).
                                                                                       2018 OWLETS-2 campaign. The highlights

                              em • The Magazine for Environmental Managers • A&WMA • October 2020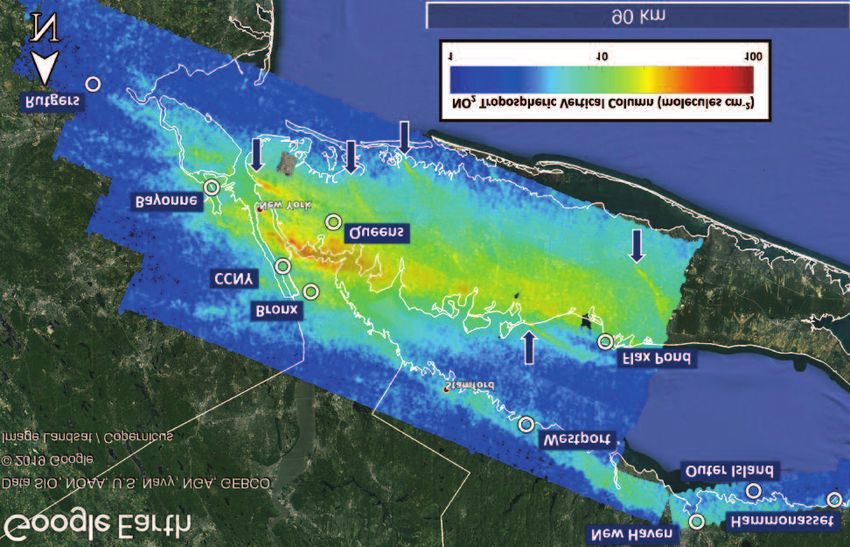
Cover Story by Susan Wierman, Leiran Biton, and Joel Dreessen

                                                                                       Next, the article by Zac Adelman and col-
                                                                                       leagues describes the 2017 Lake Michian
                                                                                       Ozone Study (LMOS), an important addition
                                                                                       to ongoing efforts to better understand the
                                                                                       formation and transport of O3 across and
                                                                                       along Lake Michigan. Despite many years of
                                                                                       air quality improvements, persistent air quality
                                                                                       problems in meeting newer NAAQS remain.
                                                                                       The questions addressed in this study in-
                                                                                       cluded the relative importance of local and in-
                                                                                       terstate pollution sources, the importance of
                                                                                       NOX and volatile organic compound (VOC)
                                                                                       precursors, and how well air quality models
                                                                                       represented atmospheric chemistry in the
                                                                                       Lake Michigan region. Contributions to O3
                                                                                       problems were traced to both anthropogenic
                                                                                       and natural sources, and the study docu-
   Figure 2. Chesapeake Bay (July 3, 2018).
                                                                                       mented how and when the importance of
   Differential heating between the land and water create visible
                                                                                       VOC and NOX sources varied.
   bay breezes on July 3, 2018, on both the Chesapeake and
   Delaware Bays. The OWLETS-2 campaign measured localized
                                                                                        Finally, the article by Anne M. Thompson
   O3 in excess of 90 ppbv over the northern Chesapeake Bay,
                                                                                        and colleagues takes us to the Gulf of Mex-
   resulting in 8-hr maximums around 80 ppbv. Similar O3 was
                                                                                        ico where NASA and the Bureau of Ocean
   not observed over the Delaware Bay.                                                  Energy Management conducted the Satellite
   Source: True color imagery from VIIRS instrument on the Suomi NPP
   satellite. NOAA JSTAR Mapper (https://www.star.nesdis.noaa.gov/jpss/mapper).
                                                                                        Coastal and Oceanic Atmospheric Pollution
                                                                                        Experiment (SCOAPE) to assess the utility of
                                                                                        satellite data to help assess the impact of ex-
presented in this article exemplify a special study integrated         panded offshore oil and gas development. Satellite measure-
into an Enhanced Monitoring Program implemented by the                 ments of total column pollutants were compared to surface
state to assess the formation and transport of pollution over          measurements taken at oil and gas platforms and onboard
and near the Chesapeake Bay.                                           the University of Southern Mississippi’s Research Vessel

In Next Month’s Issue…
Background Ozone
Air pollution regulators use “background ozone” to describe ozone originating from sources outside of
their control. In the United States, background ozone has been defined as originating from transport of
ozone from the stratosphere, ozone formed from natural precursor sources (lightning, fires, biogenic
sources, etc.), and ozone formed from international anthropogenic precursors. Quantifying background
ozone is complicated by the fact that many emissions sources are impacted by both anthropogenic and
natural processes. The November issue explores the current state of understanding regarding
background ozone.

                             em • The Magazine for Environmental Managers • A&WMA • October 2020
Cover Story by Susan Wierman, Leiran Biton, and Joel Dreessen

   Figure 3. Lake Michigan (June 9, 2017).                                             Figure 4. Gulf of Mexico (June 9, 2017).
   Lake Michigan stays relatively cold through the                                     Intricate clouds formed over the Gulf of Mexico
   summer, potentially causing lake breezes when-                                      on June 9, 2017, contrast the expansive clouds
   ever the land temperatures warm and synoptic                                        farther inland, demonstrating the different
   winds are light. On June 9, 2017, a lake breeze                                     meteorological conditions that overland and
   can be seen moving inland around nearly the                                         overwater areas experience, and the complexity
   entire lake. Ozone exceedances of the 70 ppb                                        of these influences at the coastal interface.
   were measured in the lake breezes, particularly                                     Source: True color imagery from VIIRS instrument on the
                                                                                       Suomi NPP satellite. NOAA JSTAR Mapper
   around Chicago, into northern Indiana and                                           (https://www.star.nesdis.noaa.gov/jpss/mapper).
   southern Michigan.
   Source: True color imagery from VIIRS instrument on the
   Suomi NPP satellite. NOAA JSTAR Mapper
   (https://www.star.nesdis.noaa.gov/jpss/mapper).

Point Sur. Under the conditions of their May 2019                                  Each of these multi-agency collaborative studies yielded
sampling, O3 levels were higher closer to shore, influenced                        information about micro meteorology, pollution transport,
by the New Orleans–Baton Rouge region, than over                                   and the impacts of local and distant sources on air quality
the Gulf.                                                                          above and near large bodies of water. em

    Susan S.G. Wierman, the former Executive Director for the Mid-Atlantic Regional Air Management Association, is a part-time lecturer for the
    Johns Hopkins University online Engineering for Professionals program. Leiran Biton is a physical scientist with the U.S. Environmental Protec-
    tion Agency’s New England Regional Office (Region 1) in Boston, MA, and he and Susan Wierman are members of EM’s Editorial Advisory
    Committee. Joel Dreessen is senior meteorologist in the air monitoring program at the Maryland Department of the Environment.

    Disclaimer: This article has been subject to technical review by the U.S. Environmental Protection Agency (EPA) and approved for publication.
    The views expressed by individual authors, however, are their own, and do not necessarily reflect those of the EPA. Mention of trade names,
    products, or services does not convey, and should not be interpreted as conveying, official EPA approval, endorsement, or recommendation.

References
1. Loughner, C.P.; Tzortziou, M.; Follette-Cook, M.; Pickering, K.E.; Goldberg, D.; Satam, C.; Weinheimer, A. ; Crawford, J.H.; Knapp, D.J.; Montzka, D.D.;
   Diskin, G.S.; Dickerson, R.R. Impact of Bay-Breeze Circulations on Surface Air Quality and Boundary Layer Export; J. Appl. Meteorol. Climatol. 2014, 53, doi:
   10.1175/JAMC-D-13-0323.
2. Goldberg, D.; Loughner, C.P.; Tzortziou, M.; Stehr, J.W.; Pickering, K.E.; Marufu, L.T.; Dickerson, R.R. Higher surface ozone concentrations over the
   Chesapeake Bay than over the adjacent land: Observations and models from the DISCOVER-AQ and CBODAQ campaigns; Atmos. Environ. 2014, 84,
   https://doi.org/10.1016/j.atmosenv.2013.11.008.
3. Mathur, R.; Hogrefe, C.; Hakami, A.; Zhao, S.; Szykman, J.; Hagler, G. A Call for an Aloft Air Quality Monitoring Network: Need, Feasibility, and
    Potential Value; Environ. Sci. Technol. 2018, 52, 10903-10908, doi: 10.1021/acs.est.8b02496.
4. Technical Note: Guidance for Developing Enhanced Monitoring Plans; U.S. Environmental Protection Agency, May 2017; https://www.epa.gov/amtic/
   enhanced-monitoring-plan-guidance (accessed July 14, 2020).

                                    em • The Magazine for Environmental Managers • A&WMA • October 2020
Long Island Sound Tropospheric Ozone Study (LISTOS) by Alexandra Karambelas

LISTOS activities during the 2018 ozone season.
Source: NASA.

                                       LISTOS:
                    Toward a Better Understanding of

                   New York City’s
                   Ozone Pollution Problem
                        An overview of the Long Island Sound Tropospheric Ozone Study.

                                   em • The Magazine for Environmental Managers • A&WMA • October 2020
Long Island Sound Tropospheric Ozone Study (LISTOS) by Alexandra Karambelas
Since 1990, ground-level tropospheric ozone (O3) pollu- the collected data sets. Efforts include assessing the impacts
tion has declined across the United States, largely as a re- of key reactive carbon compounds known as volatile organic
sult of clean air regulations developed under the 1990 U.S. compounds (VOCs), tracking spatial gradients of air pollu-
Clean Air Act Amendments.1 This trend, however, has flat- tants on Long Island via an on-road mobile lab, “ground
tened in recent years for the New York City (NYC) metropol- truthing” emission estimates of nitrogen oxides (NOX) based
itan area where persistently high episodic O3 continues to be on aircraft and satellite measurements, and probing the
measured downwind along coastal Long Island Sound (see vertical structure of the atmosphere for transported O3 and
Figure 1). The continued presence of high surface O3 in this aerosol layers (including long-range transport in wildfire
area affects the health of tens of millions of people living plumes from western North America).
across this densely populated region.
Other similar field campaigns such as the Ozone Water–
In recognition of this public health concern, several state Land Environmental Transition Study (OWLETS)2 1 and 2
and federal agencies, along with university research groups, over Chesapeake Bay, and the Lake Michigan Ozone Study
launched a large coordinated measurement campaign in the (LMOS)3 have examined how the land–water breezes influ-
summer of 2018 to better understand the complex chemistry ences O3 transport and concentrations. [Editor’s Note: See
and pollution transport in the region. Contributing members articles on OWLETS and LMOS published elsewhere in this
to this multifaceted campaign, known as the Long Island issue.] LISTOS researchers were able to leverage insights
Sound Tropospheric Ozone Study (LISTOS; see Table 1), from these previous campaigns to optimize their data
obtained measurements from land observation sites, research collection efforts over Long Island Sound. For example,
aircraft, marine vessels, and space-based observations. Focus guidance was sought from state air quality forecasters with
was given to Long Island Sound, where a land–sea breeze local knowledge of the region to inform the launching of
feature often leads to high O3 concentrations along the field activities on days predicted to be favorable for meeting
Connecticut shoreline. research objectives.
This article presents a high-level description of the LISTOS Understanding Ozone Formation
activities since data collection began in 2018. The peak in the Long Island Sound
Warm temperatures and direct sunlight are critical for tro-
activity was the summer of 2018, but analysis continues on
pospheric O3 formation from the
photochemistry of NOX and VOCs
in the atmosphere. For O3, problems,
the major NOX sources are from the
burning of fossil fuels by mobile
sources and at power plants on the
local and regional scale. Important
VOC sources include chemical sol-
vents in urban areas and vegetation
on a regional scale. In the LISTOS
region, air pollution that reaches
Long Island Sound can be confined
within a stable and shallow marine
layer, enhancing its chemical evolu-
tion as it travels downwind. A com-
plicating factor is that the sensitivity
of O3 formation to NOX and VOCs
is non-linear. In NOX-limited
regimes, decreasing NOX emissions
leads to a decrease in O3 formation.
In VOC-limited regimes, decreasing
NOX may actually increase O3 near
strong NOX emission sources before
Figure 1. EPA AirNow graphic of the July 10, 2018, daily O3 air O3 starts decreasing farther down-
quality index (AQI) interpolated from surface monitoring sites. wind (i.e., changing to NOX-limited
conditions).
Elevated O3 is seen downwind of New York City along the Long
Island Sound shoreline.
Source: U.S. Environmental Protection Agency (EPA) AirNow (https://www.airnow.gov/).
The photochemical O3 production
regime for dense urban core regions
em • The Magazine for Environmental Managers • A&WMA • October 2020Long Island Sound Tropospheric Ozone Study (LISTOS) by Alexandra Karambelas
Table 1. List of contributing researchers to the LISTOS campaign.
Atmospheric Sciences Research Center, University at Albany, State University of New York
James Schwab, Janie Schwab, Everette Joseph, Jie Zhang
Columbia University
Róisín Commane, Arlene Fiore
Connecticut Department of Energy and Environmental Protection
Michael Geigert, Pete Babich, Sam Sampieri
EPA Region 1
Robert Judge, Anne McWilliams
Maine Department of Environmental Protection
Danielle Twomey, Martha Webster, Tom Downs
NASA Goddard
John Sullivan, Scott Janz, Matthew Kowalewski, Peter Pantina, Sanxiong Xiong
NASA Langley Research Center
Tim Berkoff, Guillaume Gronoff, Jay Al-Saadi, Laura Judd, Amin Nehrir, Travis Knepp
National Oceanic and Atmospheric Administration, Earth System Research Laboratories (1)
and CIRES University of Colorado (2)
Brian McDonald (1,2), Georgios Gkatzelis (1,2), Jessica Gilman (1), Matt Coggon (1,2), Carsten
Warneke (1,2)
New Jersey Department of Environmental Protection
Sharon Davis, Luis Lim
New York State Department of Environmental Conservation
Dirk Felton, John Kent, Robert Gaza, Julia Stuart, Amanda Carpenter, Pete Furdyna, Jacqueline Perry,
Erica Putman
Northeast States for Coordinated Air Use Management
Paul Miller, Mahdi Ahmadi, George Allen
Stony Brook University
John Mak
The City College of New York/NOAA EPP Center for Earth System Science and
Remote Sensing Technology
Fred Moshary, Maria Tzortziou, Barry Gross, Yonghua Wu, Mark Arend
University of Maryland
Russell Dickerson, Xinrong Ren, Allison Ring, Tim Canty, Phillip Stratton, Sarah Benish
U.S. Environmental Protection Agency, Office of Research and Development
Lukas Valin, James Szykman, David Williams, Andrew Whitehill, Jonathan Pleim
Yale University
Drew Gentner, Jenna Ditto
like NYC can transition from VOC-limited to NOX-limited about the O3-forming potential of NOX and VOCs in the
with changes in emissions over time and in distance down- region.
wind from the strongest NOX emission areas.4 To mitigate
potential near-source O3 increases during a VOC-to-NOX In addition to chemistry, atmospheric physics also plays a
sensitivity transition, it is important to understand VOC spe- role in NYC’s O3 problem. A sea breeze along the Long
ciation, emissions, concentrations, and O3-forming potential Island Sound shoreline can play a major role in high coastal
to know whether additional VOC control strategies will be O3 concentrations in the late afternoon, when the air over
useful in combination with regional NOX control strategies Long Island has been fueled by the photochemistry of O3
for reducing O3 levels. LISTOS leveraged existing air quality precursors trapped in the shallow marine boundary layer
monitors at key urban sites, as well as mobile air sampling transported from NYC and areas farther upwind. When the
methods and remote sensing techniques, to learn more sea breeze begins blowing onshore, the highly polluted
em • The Magazine for Environmental Managers • A&WMA • October 2020Long Island Sound Tropospheric Ozone Study (LISTOS) by Alexandra Karambelas
marine layer is pushed into shoreline
communities.
LISTOS Measurements
Searching for Precursor
Transport and O3 Formation
in the Boundary Layer
An O3 monitor on a car ferry cap-
tured the spatial and temporal evolu-
tion of O3 during its trips between
coastal Connecticut and Long Island’s
north shore several times a day (see
Figure 2). An instrumented aircraft
made boundary layer in situ meas-
urements of O3, NOX, VOCs, black
carbon, greenhouse gases, and im-
portant meteorological parameters
used to derive boundary layer height.
A second aircraft flew transects over
Long Island Sound to capture high-
resolution three-dimensional wind
fields during O3 pollution episodes in
the region, which are important for
Figure 2. Route of the MV Park City Ferry operating between
capturing sea breeze dynamics. Bal-
Bridgeport, CT, and Port Jefferson, NY, which measured O3 during
loons carrying ozonesondes (see Fig-
its crossings of Long Island Sound during summer 2018. The graph ure 3) measured vertical O3 structure
below plots measured O3 between 3:00 pm and 4:00 pm local time and meteorological parameters over-
on July 10. The highest O3 concentrations are seen at the center of lapping temporally with the research
the Sound during this crossing, as indicated by the arrows. aircraft flights and satellite overpasses,
Sources: Base map credit: U.S. Geological Survey (USGS; http://www.usgs.gov), O3 measurements in additional to nighttime launches for
courtesy of M. Geigert, Connecticut Department of Energy and Environmental Protection.
investigating potential O3 transport in
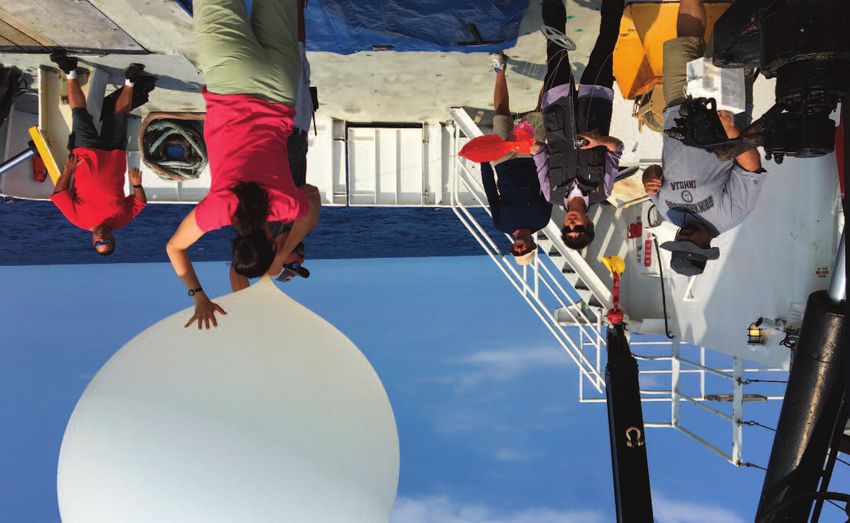
Figure 3. Photo of an ozonesonde launch (left) used to capture the vertical distribution of O3
(right) and meteorological parameters during the LISTOS campaign.
Sources: Photo courtesy of J. Schwab, University at Albany.
em • The Magazine for Environmental Managers • A&WMA • October 2020Long Island Sound Tropospheric Ozone Study (LISTOS) by Alexandra Karambelas
Figure 4. NASA aircraft measurements (GCAS) of tropospheric NO2 columns on August 28, 2018,
observed between 1:00 pm and 4:00 pm EDT. Circles indicate ground monitoring sites. Arrows
point to sources of visible pollution plumes.
Sources: Courtesy of L. Judd and J. Al-Saadi, NASA.
nocturnal low-level jets along the Eastern Sea-board. Mobile National Aeronautics and Space Administration (NASA) air-
lab observations on Long Island during high O3 days showed craft carrying either the Geostationary Trace gas and Aerosol
steep gradients in O3 concentrations over relatively short Sensor Optimization (GeoTASO)8 or GEOstationary Coastal
distances from shorelines.5 and Air Pollution Events (GEO-CAPE) Airborne Simulator
(GCAS)9 airborne spectrometers. These instruments meas-
Remote Sensing for NOX Emissions ure distributions of NO2 across a localized area from the
Inventory Evaluations ground up to the aircraft’s flight altitude of about 28,000
Emissions inventories provide air quality planners with knowl- feet at sub-kilometer resolution capable of distinguishing
edge of the current spatial and temporal variations of emis- isolated point sources (see Figure 4). Complementary to
sions contributing to local and regional air pollution episodes. the other column measurements, a network of Pandora
Inventories, however, are challenging and time-consuming to spectrometers measured vertical columns of NO2 continu-
compile, and lag current conditions by several years. During ously throughout the day from their ground-based
LISTOS, several complementary remote sensing measure- locations.10 These instruments are co-located with existing
ments were performed from multiple perspectives to observe air quality monitors that help link column measurements to
the heterogeneity in O3 precursors and help in assessing ground-based air quality.
emissions inventories. These observations helped identify rapid
temporal changes and had the resolution to capture highly Observing Wildfire Plumes Transported
localized strong NOX emission sources. Long Distances into the LISTOS Region
During the 2018 LISTOS campaign, aerosol and O3 meas-
Early afternoon overpasses by two polar-orbiting satellites urements from LIDAR remote sensing sites upwind, within,
with the Ozone Monitoring Instrument (OMI)6 and the and downwind of NYC took advantage of a real-world ex-
newer TROPOspheric Monitoring Instrument (TROPOMI)7 periment when smoke plumes entered the region after long-
measure columns of nitrogen dioxide (NO2, a component distance transport from large wildfires occurring in western
of NOX) and other trace gases, globally, at spatial resolutions Canada (see Figure 5, a and b). These LIDARs observed
as fine as 3.5 × 5.5 km. This perspective was spatially and high-altitude layers of aerosols—including fine particulate
temporally downscaled during LISTOS with the use of a matter, another criteria pollutant—along with O3 that may
em • The Magazine for Environmental Managers • A&WMA • October 2020Long Island Sound Tropospheric Ozone Study (LISTOS) by Alexandra Karambelas
Figure 5. An August 24–25, 2018, wildfire transport event during LISTOS, showing (a) NOAA
Hazard Mapping System (HMS) graphic of satellite observed smoke over the North America overlaid by
HYSPLIT back-trajectories from Westport, CT; (b) True color image of afternoon smoke on August 24
(Aqua MODIS satellite instrument); and (c) August 24–25 O3 curtain time series measured by the NASA
Langley Research Center (LaRC) LIDAR (NASA TOLNet) located at Westport, CT, showing an O3 layer
aloft at about 3 km on August 25 and another at 4–5 km spanning both days.
Sources: Courtesy of T. Berkoff, NASA.
have been associated with the smoke plumes. The NASA ing on days influenced by wildfire plumes. An example of an
High-Altitude LIDAR Observatory (HALO) co-located with O3 LIDAR during a smoke transport event from August 24–
GCAS provided an airborne perspective by profiling aerosol 25, 2018, is shown in Figure 5c, where O3 concentrations
loading, properties, and type, as well as mixed-layer depths, aloft were not observed to mix down to the surface during
and could detect regional gradients in wildfire smoke load- this observation period. In light of the increasing trends in
em • The Magazine for Environmental Managers • A&WMA • October 2020Long Island Sound Tropospheric Ozone Study (LISTOS) by Alexandra Karambelas
the size and intensity of western wildfires, improved knowl- model, and if so, how this changes model biases in model-
edge of how aloft smoke plumes may or may not affect sur- estimated pollution transport downwind of NYC.
face layer air pollution levels far downwind will be important
for air quality agencies to better understand.11 The data gathered from the LISTOS campaign are valuable
from a policy perspective for assessing contributions to ele-
Ongoing Research vated O3, whether from local chemistry or long-range trans-
With the wealth of detailed observations from LISTOS, plans port, subject to influence from land–sea circulation, or some
are in place to incorporate the measurements into air quality combination of these factors. High-density observations en-
modeling to inform future air quality strategies and state im- able visualizing the relationship between emissions and me-
plementation plans in the Northeast. Higher resolution mod- teorology during the evolution of air pollution events. Using
eling domains will help resolve coastline dynamics and begin these observations, we can capture rapid changes in local
to capture wind patterns unique to the LISTOS region. For emissions and contributions from afar, apply this information
example, a notable LISTOS observation was the presence of to higher resolution modeling, and use the results to better
a low-level jet just off the coast of Connecticut during some inform air quality planning. Ultimately, the information will
high O3 events. Using the observations to evaluate higher lead to more refined strategies that improve air quality and
resolution simulations will help modelers determine if the better protect public health by targeting the local emission
conditions for this low-level jet can be captured by the sources and upwind contributors that matter most. em
Alexandra Karambelas is an environmental analyst with Northeast States for Coordinated Air Use Management (NESCAUM), a
regional organization providing technical and policy advice to the air quality agencies of eight northeastern states. Dr. Karambelas
received her Ph.D. in Environment and Resources and a certificate in Energy Analysis and Policy at the University of Wisconsin–Madison.
Disclaimer: The views and opinions expressed in this article are those of the author and do not represent the official views of the
participating agencies.
Acknowledgment: Portions of the work described in this article were jointly supported by the state air quality agencies in Connecticut,
Maine, New Jersey, and New York, along with the New York State Energy Research and Development Authority (NYSERDA), the
National Fish & Wildlife Foundation, and the participating federal agencies. NYSERDA has not reviewed the information contained
herein, and the opinions expressed in this article do not necessarily reflect those of NYSERDA, or the other project funders. Data
collected for LISTOS can be accessed at https://www-air.larc.nasa.gov/missions/listos/index.html.
References
1. U.S. Environmental Protection Agency. Our Nation’s Air: Status and Trends Through 2019; 2020. https://gispub.epa.gov/air/trendsreport/2020/#home.
2. Sullivan, J.T.; Berkoff, T.; Gronoff, G.; Knepp, T.; Pippin, M.; Allen, D.; Twigg, D.; Swap, R.; Tzortziou,
M.; Thompson, A.M.; Stauffer, R.M.; Wolfe, G.M.; Flynn, J.; Pusede, J.F.; Judd, L.M.; Moore, W.; Baker, B.D.; Al-Saadi, J.; McGee, T.J. The Ozone Water–Land
Environmental Transition Study: An Innovative Strategy for Understanding Chesapeake Bay Pollution Events; Bull. Amer. Met. Soc. 2019, 100, 291-306,
doi:10.1175/BAMS-D-18-0025.1.
3. Abdioskouei, M.; Adelman, Z.; Al-Saadi, J.; Bertram, T.; Carmichael, G.; Christiansen, M.; Cleary, P.; Czarnetzki, A.; Dickens, A.; Fuoco, M.; Harkey, M.; Judd,
L.; Kenski, D.; Millet, D.; Pierce, B.; Stanier, C.; Stone, B.; Szykman, J.; Valin, L.; Wagner, T. 2017 Lake Michigan Ozone Study (LMOS) Preliminary Findings
Report, 2019; https://www.ladco.org/wp-content/uploads/Research/LMOS2017/LMOS_LADCO_report_revision_apr2019_final.pdf.
4. Jin, X.; Fiore, A.M.; Murray, L.T.; Valin, L.C.; Lamsal, L.N.; Duncan, B.N.; Boersma, K.F.; De Smedt, I.; Gonzalez Abad, G.; Chance, K.; Tonnesen, G.S. Evaluating
a space-based indicator of surface ozone-NOx-VOC sensitivity over mid-latitude source regions and application to decadal trends; J. Geophys. Res. 2017, 122,
10439-10461, doi:10.1002/2017JD026720.
5. Zhang, J.M.; Ninneman, M.; Joseph, E.; Schwab, M.J.; Shrestha, B.; Schwab, J.J. Mobile laboratory measurements of high surface ozone levels and spatial het-
erogeneity during LISTOS 2018: Evidence for sea-breeze influence; J. Geophys. Res. (2020; accepted), doi:10.1029/2019JD031961.
6. Levelt, P.F.; Joiner, J.; Tamminen, J.; Veefkind, J.P.; Bhartia, P.K.; Stein Zweers, D.C.; Duncan, B.N.; Streets, D.G.; Eskes, H.; van der A.R.; McLinden, C.; Fioletov,
V.; Carn, S.; de Laat, J.; DeLand, M.; Marchenko, S.; McPeters, R.; Ziemke, J.; Fu, D.; Liu, X.; Pickering, K.; Apituley, A.; González Abad, G.; Arola, A.; Boersma,
F.; Chan Miller, C.; Chance, K.; de Graaf, M.; Hakkarainen, J.; Hassinen, S.; Ialongo, I.; Kleipool, Q.; Krotkov, N.; Li, C.; Lamsal, L.; Newman, P.; Nowlan, C.;
Suleiman, R.; Tilstra, L.G.; Torres, O.; Wang, H.; Wargan, K. The Ozone Monitoring Instrument: overview of 14 years in space; Atmos. Chem. Phys. 2018, 18,
5699-5745, doi:10.5194/acp-18-5699-2018.
7. Veefkind, J.P.; Aben, I.; McMullan, K.; Förster, H.; de Vries, J.; Otter, G.; Claas, J.; Eskes, H.J.; de Haan, J.F.; Kleipool, Q.; van Weele, M.; Hasekamp, O.;
Hoogeveen, R.; Landgraf, J.; Snel, R.; Tol, P.; Ingmann, P.; Voors, R.; Kruizinga, B.; Vink, R.; Visser, H.; Levelt, P.F. TROPOMI on the ESA Sentinel-5 Precursor:
A GMES mission for global observations of the atmospheric composition for climate, air quality and ozone layer applications, Remote Sens. Environ. 2012,
120, 70-83, doi:10.1016/j.rse.2011.09.027.
8. Nowlan, C.R.; Liu, X.; Leitch, J.W.; Chance, K.; González Abad, G.; Liu, C.; Zoogman, P.; Cole, J.; Delker, T.; Good, W.; Murcray, F.; Ruppert, L.; Soo, D.;
Follette-Cook, M.B.; Janz, S.J.; Kowalewski, M.G.; Loughner, C.P.; Pickering, K.E.; Herman, J.R.; Beaver, M.R.; Long, R.W.; Szykman, J.J.; Judd, L.M.; Kelley, P.; Luke,
W.T.; Ren, X.; Al-Saadi, J.A. Nitrogen dioxide observations from the Geostationary Trace gas and Aerosol Sensor Optimization (GeoTASO) airborne instrument:
Retrieval algorithm and measurements during DISCOVER-AQ Texas 2013; Atmos. Meas. Techs. 2016, 9 (6), 2647-2668, doi:10.5194/amt-9-2647-2016.
9. Nowlan, C.R.; Liu, X.; Janz, S.J.; Kowalewski, M.G.; Chance, K.; Follette-Cook, M.B.; Fried, A.; González Abad, G.; Herman, J.R.; Judd, L.M.; Kwon, H.-A.;
Loughner, C.P.; Pickering, K.E.; Richter, D.; Spinei, E.; Walega, J.; Weibring, P.; Weinheimer, A.J. Nitrogen dioxide and formaldehyde measurements from the
GEOstationary Coastal and Air Pollution Events (GEO-CAPE) Airborne Simulator over Houston, Texas; Atmos. Meas. Techs. Dis. 2018, 1-36, doi:10.5194/
amt-2018-156.
10. Herman, J.R.; Cede, A.; Spinei, E.; Mount, G.; Tzortziou, M.; Abuhassan, N. NO2 column amounts from ground-based Pandora and MFDOAS spectrometers
using the direct-sun DOAS technique: Intercomparisons and application to OMI validation; J. Geophys. Res. 2009, 114, D13307,
doi:10.1029/2009JD011848.
11. Rogers, H.M.; Ditto, J.C.; Gentner, D.R. Evidence for impacts on surface-level air quality in the northeastern US from long-distance transport of smoke from
North American fires during the Long Island Sound Tropospheric Ozone Study (LISTOS) 2018; Atmos. Chem. Phys. 2020, 20, 671-682, doi:10.5194/
acp-20-671-2020.
em • The Magazine for Environmental Managers • A&WMA • October 2020Chesapeake Bay Ozone Study (OWLETS) by John T. Sullivan, et al.
OWLETS:
An Enhanced Monitoring Strategy
Directly within the
Chesapeake Bay
by John Sullivan, Joel Dreessen, Timothy Berkoff, Ruben Delgado,
Xinrong Ren, and Tad Aburn
An overview of NASA’s Ozone Water–Land Environmental Transition Study (OWLETS)
of the Chesapeake Bay airshed.
em • The Magazine for Environmental Managers • A&WMA • October 2020Chesapeake Bay Ozone Study (OWLETS) by John T. Sullivan, et al.
The transport of ozone (O3) and precursors from sources Baltimore is classified as “marginal non-attainment,” requir-
outside and within each state is critical to understand ing further steps for continued O3 mitigation. Furthermore,
regional O3 formation, and broadly, its mitigation. Recent on October 1, 2015, the U.S. Environmental Protection
studies have characterized atmospheric composition in Agency (EPA) substantially revised requirements at the
urban/marine environments.1-7 Resulting analyses confirm Photochemical Assessment Monitoring Stations (PAMS)
quantifications of fresh urban emissions sweeping out over Network, run by state monitoring agencies within the OTR
water, eventually recirculating inland to negatively impact to develop and implement an enhanced monitoring plan
populated areas. Although these events are episodic, many (EMP) detailing O3 monitoring activities to be performed to
areas within close proximity to land–water interfaces better understand O3 formation in a specific area.8
(particularly throughout the Northeast United States’ Ozone
Transport Region [OTR]) have been designated non-attain- As chemical transport models continue to characterize urban
ment for the 2015 8-hr ozone National Ambient Air Quality pollution events, it is increasingly necessary to obtain
Standard (NAAQS; https://www3.epa.gov/airquality/green- measurements for evaluation and interpretation of simulated
book/jbtc.html). pollution levels. This can be accomplished with an EMP,
utilizing both in situ and remotely sensed instrumentation
Within the guidelines of the 2015 8-hr ozone NAAQS, directly over water, to improve and evaluate the ozone state
Table 1. List of Contributing Researchers to the OWLETS-2 campaign.
NASA Goddard Space Flight Center
John Sullivan, Laurence Twigg, Grant Sumnicht, Thomas McGee, Natasha Dacic, Robert Swap,
Alexander Kotsakis, Ryan Stauffer, Anne Thompson, Debra Kollonige
NASA Langley Research Center
Timothy Berkoff, Guillaume Gronoff, Jay Al-Saadi, Laura Judd, Joseph Sparrow, William Carrion
University of Maryland, Baltimore County / Joint Center for Earth Systems Technology
Ruben Delgado, Vanessa Caicedo, Brian Carroll, Christopher Hennigan, Reem Hannun, Belay Demoz,
Kathrine Ball, Nicholas Balasus, Michael Battaglia, Brian Carroll
Maryland Department of the Environment (Air Monitoring Program)
George “Tad” Aburn Jr., Joel Dreessen, Michael Woodman, John “Rusty” McKay, Daniel Gardner,
Katie Green, Daniel Orozco, Jay Szymborski, Ryan Snader
Maryland Port Authority
Holly Miller
University of Maryland, College Park
Russell Dickerson, Phil Stratton
NOAA Air Resources Laboratory
Winston Luke, Paul Kelley, Barry Baker, Xinrong Ren, Mark Cohen, Christopher Loughner
Howard University
Ricardo Sakai, Adrian Flores, Vernon Morris, Siwei Li
The City College of New York
Maria Tzortziou
University of Virginia
Stephen De Wekker
Peninsula Drone Services
Sean Flynn
Virginia Commonwealth University
Will Shuart
Johns Hopkins University
Misty Zamora, Kristen Koehler, Anna Scott
Hampton University
John Anderson, William Moore, Jamie Anderson, Rose Nguyen#
Virginia Department of Environmental Quality
Daniel Salkovitz, Kristen Stumpf
em • The Magazine for Environmental Managers • A&WMA • October 2020Chesapeake Bay Ozone Study (OWLETS) by John T. Sullivan, et al.
Study (OWLETS), was strategically
performed within the lower (2017,
OWLETS-1) and upper (2018,
OWLETS-2) Chesapeake Bay airshed
to better understand the evolution of
localized pollution events. NASA
coordinated these observations with
universities, other federal labs, and
state regulatory agencies (see Table 1
for list of collaborators). NASA has
an invested interest in supporting
intensive observations to evaluate
chemical transport models for the
upcoming geo-stationary satellite
mission Tropospheric Emissions:
Monitoring of POllution (TEMPO;
http://tempo.si.edu/overview.html).
TEMPO data will be available at 2.1
km × 4.7 km native resolution to en-
able researchers to improve pollution
emission inventories, monitor popu-
lation exposure, and evaluate effec-
tive emission-control strategies. It will
also provide near-real-time air quality
products that will be made publicly
available and will help improve air
quality forecasting.
Numerous OWLETS research
team members have been
partnering with the Maryland
Department of the Environment
(MDE) to conduct policy relevant
research for many years. This
Figure 1. (top) Spatial distribution of selected field sites during research partnership has focused
OWLETS-2: Edgewood (coastal monitoring site operated by MDE); on long-distance O3 transport, but
University of Maryland, Baltimore County (UMBC, continental more recently MDE has pushed
monitor operated by NASA); Hart Miller Island (HMI, marine monitor for research on the role of the
operated by NOAA); and Down’s Park (coastal site operated by land–water interface on peak
MDE). (bottom) Analogous 1-min surface O3 analyzers (by color) O3 days. MDE’s interest in this issue
for June 29–July 1, 2018, in which several sites observed values was partially driven by what appears
greater than 100 ppbv. to be a shift in how high O3 days
in Maryland are created where
they are more random, less driven
implementation plan (SIP) modeling that is used to inform by O3 transport and more driven by day-specific local
policy decisions related to emissions reductions strategies. emissions, meteorology, and geography.
Coastal-adjacent regions are impacted by traditional point
sources (e.g., power plants) and mobile sources (e.g., auto- Questions from MDE that helped guide this research
mobiles, trucks, etc.). Although these have largely been un- include:
derstood and mitigated (e.g., in Maryland9), mobile sources
associated with ship transport or personal watercraft, require • How is high O3 over the Chesapeake Bay created?
an EMP for proper categorization. • How does high O3 over the Bay move inland?
• Are energy sources that run when it is hottest a key
OWLETS Research Study contributor to Bay enhanced O3 events?
For these reasons, the National Aeronautics and Space Asso- • What other emission sources are important on Bay
ciation (NASA) Ozone Water–Land Environmental Transition enhanced O3 events?
em • The Magazine for Environmental Managers • A&WMA • October 2020Chesapeake Bay Ozone Study (OWLETS) by John T. Sullivan, et al.
that occurred during OWLETS-2 and
describes the benefits of the EMP to
policy (especially within the vertical
profile).
Observations Over the
Bay and Land
Surface Perspective
A subset of O3 monitors operated
during OWLETS-2 indicated a land–
water gradient in O3 values, showing
a nearly 40 parts per billion by vol-
ume (ppbv) difference at Hart Miller
Island (HMI) as compared to Univer-
sity of Maryland, Baltimore County
(UMBC) (see Figure 1). A reversal is
observed at night with sustained O3
at UMBC until 04:00 am EDT,
suggesting recirculation of pollution
observed over the Bay penetrating
inland and persisting nocturnally. On
June 30, the peak O3 conditions
occurred both with higher mixing
ratios, and earlier than observed
on June 29, indicating nocturnal
carry-over of pollutants and favor-
able meteorology were present.
Enhanced Monitoring Aloft
To illustrate O3 transport (in much
finer detail than from space-borne
Figure 2. O3 lidar profiles from UMBC (top panel) and Hart Miller platforms) throughout the OWLETS-
Island (bottom panel). Four co-located ozonesondes and surface 2 domain, the continental site
observations are overlaid from each site. Figure 2 displays retrieved (UMBC) and marine site (HMI) were
outfitted with extensive vertical
O3 profiles from ~100–200 m to 6,000 m above ground level for
profiling capabilities, including lidars,
both sites, with co-located ozonesondes and surface analyzer
ceilometers, and ozonesondes (a
observations (also shown in Figure 1).
subset are shown in this work in
Figures 2 and 3). Profiles of in-situ
OWLETS served to improve the community’s ability to diag- traces gases were also provided from aircraft and unmanned
nose surface air quality from satellite column measurements aerial vehicle payloads. Additional passive columnar retrievals
and understand its diurnal evolution in high spatiotemporal of trace gases and aerosols were measured from the NASA
resolution (e.g., sub-pixel) as a framework for TEMPO evalua- Pandora and AERONet projects.
tion, while simultaneously addressing state agency questions.
Most regulatory agencies assess transport from upwind re- Two instrument platforms from the NASA Tropospheric Ozone
gions to better deduce pollution transport and issue air qual- Lidar Network (TOLNet; https://www-air.larc.nasa.gov/
ity alerts. As this methodology cannot access information missions/TOLNet/), were deployed during OWLETS-2 to
above the surface, air quality forecasters and managers are UMBC10 and HMI,11 respectively, to more fully characterize
not easily able to quantify transport on a given day. This ap- the vertical extent of the high O3 values (Figure 2). Since
proach will be fundamentally changed when NASA’s TEMPO 2011, TOLNet measurements have offered a unique view of
instrument is in orbit; states will begin to have near-real-time tropospheric ozone processes pertinent to air quality such as
maps of transported pollutants entering their region. The re- wildfire impacts, terrain effects, and deep stratospheric intru-
sources introduced during OWLETS-1/2 are a deliberate step sions.12-15 To further quantify mixing heights and complex
toward working with local forecasters and managers to begin flow patterns, a ceilometer at UMBC (Figure 3, top panel) and
understanding the wide portfolio of TEMPO products. The wind lidar (Figure 3, bottom panel) were deployed to UMBC
remainder of this article examines a multi-day O3 exeedance and HMI, respectively.
em • The Magazine for Environmental Managers • A&WMA • October 2020Chesapeake Bay Ozone Study (OWLETS) by John T. Sullivan, et al.
precursors from the Baltimore region
are transported southward and capped
in the first 200–500 m above ground
level until the mid-morning wind re-
versal. As these pollutants transport to-
ward the northern portion of the Bay,
O3 production continues to rapidly
occur. This causes O3 levels at HMI,
and other sites near the Bay coastline,
to eventually observe peak O3 levels.
Interestingly, the timing of the late-day
O3 maxima at the Bay sites in Figure
1 follows exactly this flow pattern, with
peaks at the southern site of Down’s
Park first near 3:00 pm EST, moving
northward and persisting the longest
at HMI, and finally to Edgewood 60
minutes later. This transport becomes
of noteworthy importance, as on June
29 the HMI and Down’s Park sites
were the only monitors within the
OWLETS-2 domain that exceeded the
2015 8-hr O3 NAAQS (79, 80 ppbv,
respectively). This explicitly shows Bay
breeze related events (albeit sporadic)
can ultimately cause exceedances
and potentially impact future policy
decisions.
Figures 2 and 3 both indicate the Bay
Figure 3. Aerosol lidar backscatter profiles from UMBC (top panel) dynamics on Saturday June 30 are
from the surface to 6,000 m and wind direction profiles from Hart similar to June 29. The lower level
Miller Island (bottom panel) from the surface to 2,500 m. Ceilometer flow reversal also occurs 2–3 hours
earlier on June 30, causing the recir-
is normalized range corrected signal and wind lidar profiles are
culation events to more closely coin-
composite profiles from several angles.
cide with favorable solar insolation for
photochemistry (and a “weekend”
Pollution Transport Over the Bay emission scenario). A much deeper and polluted residual layer
By Friday June 29, dramatic O3 differences between the conti- is established during the predawn hours of June 30. Nearly all
nental and marine environments existed, largely due to the monitors within the OWLETS-2 domain registered an ex-
presence of stagnant warm air. This is important, as localized ceedance day on June 30. A much more pronounced regional
circulation effects related to the Bay (Bay Breeze) are more nocturnal residual layer of O3 and aerosol is established for the
prominent in the absence of strong lower level wind flow. Sev- beginning hours of July 1. The HMI site went on to be the
eral O3 (and to a lesser extent aerosol) features are observed, only monitor on July 1 within the OWLETS-2 domain to
including persistent layers centered between 2,500–4,000 m exceed the 2015 8-hr O3 NAAQS (81 ppbv).
above ground level continuing throughout June 29 (corrobo-
rated by the 12:00 pm and 3:00 pm EDT ozonesondes). There are several factors that exacerbate O3 conditions at HMI
More pertinent to the regulatory community is the residual (and most Bay coastal sites) during this multi-day episode. First,
layer of O3 near 500–1,000 m above ground level entrained both O3 lidars indicate nocturnal transport into the domain,
at HMI (Figure 2, bottom panel) as the convective boundary however, only HMI observations indicate appreciable entrain-
layer grew in the late morning on June 29. ment of a more defined residual layer of O3 (and likely other
precursors) in the morning. Second, the lower level flow rever-
Near 11:00 am EDT, below 500 m above ground level, there sal facilitates the trapping of pollutants in the first 500 m above
is a clear wind shift at HMI (Figure 3, bottom panel) from the ground level, whereas the continental convective boundary/
synoptic northerly flow to southerly flow. Pollutants and O3 mixing layer deepens to nearly 2,000 m above ground level
em • The Magazine for Environmental Managers • A&WMA • October 2020Chesapeake Bay Ozone Study (OWLETS) by John T. Sullivan, et al.
(UMBC ceilometer, top panel of Figure 3). In summary, obser- through both federal and state actions. For example, sources
vations indicate both O3 transport to and formation in the Bay are required to comply with seasonal NOX tonnage caps
are worse than at continental sites. set by EPA and emissions limits set within and by the state.
Mobile source NOX emissions are controlled via inspection
Eyeing Forward: New Insight to Help to programs and fuel standards, with goals for fleet turnover
Better Understand the Bay toward cleaner vehicles.
A key part of the integrated OWLETS observing system
was to partner with state/local air quality organizations to The Maryland Peak Day Partnership, for example, is a volun-
better understand their needs and prepare for utilization of tary, cooperative effort between the state and businesses
TEMPO data. There are clear benefits to these collabora- that resulted from preliminary findings to drive deeper NOX
tions, specifically, a more detailed temporal and vertical reductions by asking industry and utility partners to optimize
quantification of: control technology and do everything possible to minimize
• the heights and mixing ratio of O3 (or aerosol NOX emissions on and before peak O3 days. The partner-
backscatter) transported into a state’s domain prior ship cooperates with industry and utilities to minimize
to an exceedance event; emissions from large sources, or mitigate the use of non-
• the depth and O3 evolution of the convective mixing controlled, or under-controlled facilities such as combustion
and nocturnal residual layer(s); and turbines or diesel generators.
• the dynamics of the wind and its impact on
With the revised EPA EMP mandate, states may further
pollution, specifically regarding coastal breeze
capitalize on a similar combination of O3/wind lidar to more
recirculation events.
readily understand pollution transport and provide the public
MDE has already begun to use this research to support with better information and make informed policy decisions
policy. Large point-source NOX emissions are limited based on the science. em
John T. Sullivan is a lidar physical scientist at NASA Goddard Space Flight Center, Greenbelt, MD. Joel Dreessen is a senior meteorolo-
gist at the Maryland Department of the Environment, Baltimore, MD. Timothy A. Berkoff is a physical scientist at NASA Langley Space
Flight Center, Hampton, VA. Ruben Delgado is an Assistant Research Professor with the University of Maryland, Baltimore County
(UMBC)/Joint Center for Earth Systems Technology (JCET), Baltimore, MD. Xinrong Ren is a senior research scientist in the Department
of Atmospheric and Oceanic Science with the University of Maryland, College Park. MD. George (Tad) Aburn, Jr., is the Air Director of
the Air and Radiation Administration at the Maryland Department of the Environment, Baltimore, MD. E-mail: john.t.sullivan@nasa.gov.
Acknowledgment: This work was supported by the Maryland Department of the Environment (Contract #U00P8400651), the NASA
HQ Tropospheric Composition Program, NASA TOLNet, and the 2017 NASA Science Innovation Fund. Student support (#, Table 1)
was provided by the National Oceanic and Atmospheric Administration–Cooperative Science Center for Earth System Sciences and
Remote Sensing Technologies (NOAA–CESSRST) and Center for Atmospheric Sciences and Meteorology (NOAA–NCAS-M) under the
Cooperative Agreement Grants #: NA16SEC4810008 and NA16SEC4810006, respectively, and the NASA Internship Program. The
authors graciously thank our university, federal, and local partners and collaborators that have made up the entirety of the OWLETS team.
Special thanks to the Maryland Port Authority and Maryland Environmental Services to provide access and transport of instrumentation
to/from Hart Miller Island.
References
1. Langford, A.O.; Senff, C.J.; Alvarez, R.J.; Banta, R.M.; Hardesty, R.M.; Parrish, D.D.; Ryerson, T.B. Comparison between the TOPAZ airborne ozone lidar and in
situ measurements during TexAQS 2006; J. Atmos. Oceanic Technol. 2011, 28 (10), 1243-1257.
2. Goldberg, D.L.; Loughner, C.P.; Tzortziou, M.; Stehr, J.W.; Pickering, K.E.; Marufu, L.T.; Dickerson, R.R. Higher surface ozone concentrations over the
Chesapeake Bay than over the adjacent land: Observations and models from the DISCOVER-AQ and CBODAQ campaigns; Atmos. Environ. 2014, 84, 9-19.
3. Stauffer, R.M.; Thompson, A.M.; Martins, D.K.; Clark, R.D.; Goldberg, D.L.; Loughner, C.P.; Delgado, R.; Dickerson, R.R.; Stehr, J.W.; Tzortziou, M.A. Bay
breeze influence on surface ozone at Edgewood, MD during July 2011; J. Atmos. Chem. 2015, 72 (3-4), 335-353.
4. Gronoff, G.; Robinson, J.; Berkoff, T.; Swap, R.; Farris, B.; Schroeder, J.; Halliday, H.S., et al. A method for quantifying near range point source induced O3
titration events using Co-located Lidar and Pandora measurements; Atmos. Environ. 2019, 204, 43-52.
5. Sullivan, J.T.; Berkoff, T.; Gronoff, G.; Knepp, T.; Pippin, M.; Allen, D.; Twigg, L., et al. The Ozone Water–Land Environmental Transition Study: An Innovative
Strategy for Understanding Chesapeake Bay Pollution Events; Bull. Am. Meteorol. Soc. 2019 100 (2), 291-306.
6. Vermeuel, M.P.; Novak, G.A.; Alwe, H.D.; Hughes, D.D.; Kaleel, R.; Dickens, A.F.; Kenski, D., et al. Sensitivity of Ozone Production to NOx and VOC along the
Lake Michigan Coastline; J. Geophys. Res. Atmos. 2019, 124 (20), 10989-11006; https://doi.org/10.1029/2019JD030842.
7. Dacic, N.; Sullivan, J.T.; Knowland, K.E.; Wolfe, G.M.; Oman, L.D.; Berkoff, T.A.; Gronoff, G.P. Evaluation of NASA's high-resolution global composition
simulations: Understanding a pollution event in the Chesapeake Bay during the summer 2017 OWLETS campaign; Atmos. Environ. 2019, 117133.
8. U.S. Environmental Protection Agency. Enhanced Monitoring Plan Guidance: Technical Note – Guidance for Developing Enhanced Monitoring Plans; May 2017,
www.epa.gov/amtic/enhanced-monitoring-plan-guidance.
9. Aburn, G.; Dickerson, R.R.; Hains, J.C.; King, D.; Salawitch, R.; Canty, T.; Ren, X.; Thompson, A.M.; Woodman, M. Ground-level Ozone: A path forward for
the Eastern United States; EM, May 2015, 18-24.
10. Sullivan, J.T.; McGee, T.J.; Sumnicht, G.K.; Twigg, L.W.; Hoff, R.M. A mobile differential absorption lidar to measure sub-hourly fluctuation of tropospheric
ozone profiles in the Baltimore–Washington, DC region; Atmos. Meas. Techs. 2014, 7 (10), 3529-3548.
11. Farris, B.M.; Gronoff, G.P.; Carrion, W.; Knepp, T.; Pippin, M.; Berkoff, T.A. Demonstration of an off-axis parabolic receiver for near-range retrieval of lidar
ozone profiles; Atmos. Meas. Techs. 2019, 12 (1), 363-370.
12. Dreessen, J.; Sullivan, J.; Delgado, R. Observations and impacts of transported Canadian wildfire smoke on ozone and aerosol air quality in the Maryland
region on June 9-12, 2015; J. Air Waste Manage. Assoc. 2016, 66 (9), 842-862.
13. Sullivan, J.T.; McGee, T.J.; Langford, A.O.; Alvarez, R.J.; Senff, C.J.; Reddy, P.J.; Thompson, A.M., et al. Quantifying the contribution of thermally driven
recirculation to a high-ozone event along the Colorado Front Range using lidar; J. Geophys. Res. Atmos. 2016, 121 (17), 10-377.
14. Sullivan, J.T.; McGee, T.J.; Thompson, A.M.; Pierce, R.B.; Sumnicht, G.K.; Twigg, L.W.; Eloranta, E.; Hoff, R.M. Characterizing the lifetime and occurrence of
stratospheric-tropospheric exchange events in the rocky mountain region using high-resolution ozone measurements; J. Geophys. Res. Atmos. 2015,
120 (24), 12410-12424.
15. Langford, A.O.; Senff, C.J.; Alvarez, R.J.; Brioude, J.; Cooper, O.R.; Holloway, J.S.; Lin, M.Y., et al. An overview of the 2013 Las Vegas Ozone Study (LVOS):
Impact of stratospheric intrusions and long-range transport on surface air quality; Atmos. Environ. 2015, 109, 305-322.
em • The Magazine for Environmental Managers • A&WMA • October 2020You can also read