Re-energising Australian Manufacturing - Doubling energy productivity by 2030 to improve the competitiveness of the manufacturing sector November ...
←
→
Page content transcription
If your browser does not render page correctly, please read the page content below
Re-energising Australian
Manufacturing
Doubling energy productivity by 2030
to improve the competitiveness of the
manufacturing sector

November 2014
Concepts for discussion
Draft version 1.0

CONCEPTS FOR DISCUSSION DRAFT VERSION 1.0

Thanks
The Board and Staff of the Australian Alliance to Save Energy (A2SE) gratefully acknowledge
Jonathan Jutsen, Anita Stadler and our associate Patrick Denvir as the primary researchers and
authors of this text. Contributing also: Rachael Hackney. We acknowledge the intellectual and
practical contributions of our manufacturing industry partners and, particularly, the Office of
Environment and Heritage – NSW.

We acknowledge the considerable intellectual and practical contributions of Dr Michael Smith of the
Energy Change Institute at the Australian National University in the preparation of this report.

This work has been supported by financial contributions to various components of the Australian
Energy Productivity Roadmap project made by the Commonwealth Department of Industry, the Office
of Environment and Heritage – NSW and the Clean Energy Finance Corporation. This work would not
have been possible without the generous support of the Institute for Sustainable Futures (ISF) at the
University of Technology, Sydney and Energetics Pty Ltd.

We acknowledge our project collaborators: ClimateWorks Australia, the Low Carbon Living CRC at the
University of New South Wales, the Energy Change Institute at the Australian National University,
Newcastle Institute for Energy & Resources at the University of Newcastle and the Energy Flagship
program at CSIRO.

The views expressed in this text are those of A2SE and not necessarily those of our supporters and
partners. All responsibility for the text rests with us.

© Australian Alliance to Save Energy 2014

c/- Institute for Sustainable Futures
University of Technology, Sydney
Level 11, Building 10
235 Jones Street, Ultimo, NSW 2007

email: info@a2se.org.au phone: 02 9514 4948
web: www.a2se.org.au abn: 39 137 603 993

2XEP - Manufacturing Sector Overview                                                         ii
CONCEPTS FOR DISCUSSION DRAFT VERSION 1.0
Executive summary
Like other developed economies, Australia has seen its manufacturing base erode.
Improvement will depend on cost efficiencies, particularly management quality; higher
labour mobility; and a shift to innovative manufacturing, which offers the best long-term
potential for competitiveness.
(Taylor, Bradley, Dobbs, Thompson, & Clifton, 2012)
This report was prepared to review the key issues that need to be dealt with to double energy
productivity in the manufacturing sector in Australia by 2030. The report also provides a discussion
starting point for the Manufacturing Sector 2XEP Team. This team will lead the development of the
manufacturing sector 2XEP Roadmap to focus on the opportunities, barriers, policy recommendations
and proposed implementation plan for 2XEP in the manufacturing sector.
Why focus on energy The rationale for Australia adopting an energy productivity target is strong:
productivity?
Overall productivity in many market sectors, including manufacturing, has
been flat or declining in recent years.
Australia’s energy productivity lags that of other G20 countries, and is
increasing at a lower rate.
Energy prices have risen steeply relative to other nations, eroding what
was once a competitive advantage for Australia.
Manufacturing remains a major employer and large energy user, and the
response of the sector to improving productivity, including energy
productivity, will shape its future competitiveness.
The 2XEP initiative In response to these factors:
2XEP proposes doubling energy productivity across the economy by 2030.
This approach is in line with other major economies – and needs to be
achieved to avoid entrenching the competitive disadvantage that has
emerged in recent years from rising energy prices and other factors.
The appropriate target for the manufacturing sector is to be established by
the Manufacturing Sector 2EXP Team. Doubling energy productivity in the
manufacturing sector would imply a target reduction in final energy
consumption of 280 PJ in 2030 compared with current projections for 2030
(i.e. baseline estimate). This is an industry level annual saving of
approximately $5 bn per annum by 2030.
The potential to achieve this target will be ascertained through an assessment
of key efficiency opportunity areas, including:
‘Traditional’ energy management (including energy use technology
improvements).
Systems optimisation (focusing on energy aspects of supply chain
optimisation, lean manufacturing and other capacity optimisation
strategies).
Business model transformation – the energy aspects of fundamental
longer term business change – design and manufacturing.
2XEP - Manufacturing Sector Overview iii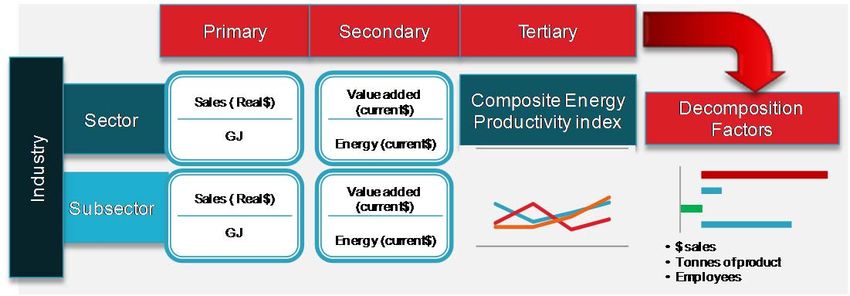
CONCEPTS FOR DISCUSSION DRAFT VERSION 1.0
Benefits from 2XEP The benefits of achieving 2XEP in the manufacturing sector will include:
for manufacturing
Energy cost savings of $5 bn per annum by 2030 for manufacturing
companies. This will significantly improve energy competitiveness.
Multiple dividends in terms of reduced maintenance and labour costs/unit
of output, with a likely multiplier of up to 2.5 times the benefits directly
attributed to energy savings.
An annual reduction in carbon emissions of approximately 48 MtCO2e by
2030.
Manufacturing A successful outcome from this roadmap process will deliver:
program objectives
An understanding of the optimal path to doubling energy productivity for
the sector.
A plan for industry to lead/drive changes in the sector and individual
businesses to achieve 2XEP.
An understanding of emerging R&D innovations that can help
manufacturing sub-sectors now achieve a step change in energy
efficiency.
Business opportunities through more energy efficient product design for
the sector to address key gaps in the global market.
The initiation/strengthening of specific programs to support businesses to
achieve 2XEP.
Recommendations adopted by State and Commonwealth governments to
enact policy changes to facilitate these activities and support 2XEP in
manufacturing.
A collaborative process between all participants in the market with
government to accelerate innovation, transformation and value adding in
the sector.
Benefits of Participation in the roadmap process offers industry associations and
participation in the businesses:
roadmap process
The ability to share and learn best-practice techniques for improving
productivity through peer-to-peer association.
Business brand recognition through association with the roadmap process
and specific programs that may emerge from the process e.g. voluntary
commitment and recognition programs.
Improved energy productivity and competitive advantage. The average
participating company will improve its energy productivity by 1.4% per year
over the next 20 years, saving 32% of energy consumption/unit of output
by 2030.
Improved access to best-practice productivity techniques and tools,
individualised for specific industries.
The ability to effectively integrated energy productivity into organisational
improvement business cases.
Potential for early participation in recognition, continuous improvement and
other programs launched from the roadmap process.
The opportunity to demonstrate leadership in Australian manufacturing.
2XEP - Manufacturing Sector Overview iv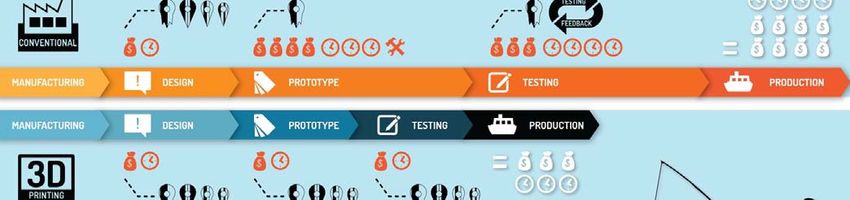
CONCEPTS FOR DISCUSSION DRAFT VERSION 1.0

Table of contents
List of figures ....................................................................................................................................... vii
   1.     The case for 2XEP in manufacturing ........................................................................................ 1
         1.1. Context ................................................................................................................................ 1
         1.2. Energy use and spend in manufacturing ............................................................................. 5
         1.3. Measuring energy productivity improvements ..................................................................... 7
   2.     The 2XEP improvement opportunity for manufacturing ...................................................... 10
         2.1. Target setting considerations ............................................................................................ 10
         2.2. What does a doubling of energy productivity mean for manufacturing energy savings? .. 12
         2.3. What is included in manufacturing sector energy productivity savings? ........................... 13
                   2.3.1.      ‘Traditional’ energy management approach......................................................... 14
                   2.3.2.      Systems optimisation – Process change ............................................................. 18
                   2.3.3.      Business model transformation ............................................................................ 22
                   2.3.4.      Additional focus on energy productivity by small-to-medium enterprises ............ 27
   3.     Barriers to energy productivity ............................................................................................... 29
         3.1. Barriers to energy efficiency .............................................................................................. 29
                   3.1.1.      Payback period and availability of internal capital ............................................... 30
                   3.1.2.      Lack of available budget/time/resources to identify/implement savings .............. 32
                   3.1.3.      Lack of information ............................................................................................... 32
                   3.1.4.      Cultural barriers .................................................................................................... 33
                   3.1.5.      Management expertise......................................................................................... 33
                   3.1.6.      Operational logistics ............................................................................................. 34
                   3.1.7.      Decision life cycle................................................................................................. 34
                   3.1.8.      Speed of price increases...................................................................................... 34
                   3.1.9.      Difficulty accessing the SME sector ..................................................................... 34
         3.2. Barriers to adoption of lean processes .............................................................................. 34
   4.     Overcoming the Barriers ......................................................................................................... 36
         4.1. Information ......................................................................................................................... 36
         4.2. Training .............................................................................................................................. 37
         4.3. Recognition and support programs ................................................................................... 38
         4.4. Incentives and financing .................................................................................................... 39
                   4.4.1.      Financing .............................................................................................................. 39
                   4.4.2.      Incentives ............................................................................................................. 39
         4.5. Specific gas productivity programs .................................................................................... 40
         4.6. Role of co-generation and renewable energy ................................................................... 40

2XEP - Manufacturing Sector Overview                                                                                                         v
CONCEPTS FOR DISCUSSION DRAFT VERSION 1.0

       4.7. Access savings from the SME sector ................................................................................ 41
       4.8. Role for regulation ............................................................................................................. 41
       4.9. Energy productivity issues that will be covered ................................................................. 42
       4.10. Address energy competitiveness issues from escalating energy prices ........................... 42
  5.   Next steps.................................................................................................................................. 43
References           ..................................................................................................................................... 44
Appendix A.         Abbreviations and acronyms ................................................................................... 51
Appendix B.         Conversions ............................................................................................................... 53
Appendix C.         A2SE 2XEP Roadmap ................................................................................................ 54

2XEP - Manufacturing Sector Overview                                                                                                          vi
CONCEPTS FOR DISCUSSION DRAFT VERSION 1.0

List of figures
Figure 1: Top 15 manufacturers by share of global nominal manufacturing gross value added (GVA) . 1
Figure 2: MFP trends for Australian manufacturing and Australia c.f. other nations............................... 2
Figure 3: Energy productivity of selected G20 countries......................................................................... 3
Figure 4: Real retail energy price ratios – an international comparison .................................................. 3
Figure 5: Energy spend in Australia by source and industry sector (2011–12) ...................................... 5
Figure 6: Energy end use by manufacturing sub-sectors........................................................................ 6
Figure 7: Value of each net $-energy dollar saved, expressed in equivalent $-sales at factory gate ..... 7
Figure 8: Conceptual overview of integrated measurement framework – applied to manufacturing ...... 9
Figure 9: Key determinants of energy productivity ................................................................................ 14
Figure 10: ClimateWorks’ analysis of recent trends in energy efficiency gains in industrial sectors .... 15
Figure 11: ClimateWorks’ extrapolation of recent trends in energy savings to 2020 ............................ 16
Figure 12: Ranking of CSIRO-survey of key technology areas timeline for sustainability roadmap
implementation (food manufacturing sector) ......................................................................................... 22
Figure 13: Top five factors impacting implementation of energy efficiency projects ............................. 29
Figure 14: The Energy Productivity Roadmap modules........................................................................ 54

o not delete this section break

2XEP - Manufacturing Sector Overview                                                                                       vii

CONSULTATION DRAFT VERSION 1.0

1.       The case for 2XEP in manufacturing
This report provides a preliminary compilation of industry thought leadership and analysis to
support the engagement of the manufacturing sector in the Alliance to Save Energy (A2SE)
Doubling Energy Productivity (2XEP) Roadmap process (Refer to Appendix C for an
overview of the different modules). It presents the rationale for action and summarises the
key issues, opportunities, barriers and potential industry led energy productivity improvement
initiatives in the manufacturing sector by 2030. Using this report as a starting point, it is
envisaged that Manufacturing Sector Working Group (also referred to as the Manufacturing
Sector 2XEP Team in this report) will be established to develop a Sector Roadmap, guiding
the in-depth analysis of opportunities and challenges pertaining to energy productivity, as
well as policy recommendations. It is envisaged that the 2XEP Manufacturing Team will
deliberate on appropriate voluntary performance metrics and energy productivity targets that
are realistic, but challenging. Coordination and support will be provided by the A2SE project
team in this regard.

1.1.     Context
Australia’s position as a global manufacturer has slipped since the 1980’s as large
developing countries increasingly dominate of global manufacturing gross value added
illustrated in Figure 1, reproduced from the 2012 McKinsey’s report, Manufacturing the future
(Manyika et al., 2012).

Figure 1: Top 15 manufacturers by share of global nominal manufacturing gross value added (GVA)

2XEP - Manufacturing Sector Overview                                                        1

CONSULTATION DRAFT VERSION 1.0

The multi-factor productivity (MFP) of Australia’s market sectors has stagnated or declined in
recent years, as reported by the Productivity Commission (PC) in its 2014 update
(Productivity Commission, 2014). Among 12 market sectors1 evaluated, the manufacturing
sector’s MFP trend has been negative since the five-year cycle ending in 2003–04, with no
single overarching reason identified for this decline. Australia’s MFP trend has also lagged
that of other countries over much of the last 20 years.

The figure below reproduces two charts from the PC’s report that illustrate both of these
trends.

Figure 2: MFP trends for Australian manufacturing and Australia c.f. other nations

Energy is a key input to manufacturing (typically accounting for 5% of variable operating
costs and up to 20%+ in energy-intensive industries) and, where the energy is relatively
cheap, can be a source of competitive advantage. This was the case in Australia until 2007.
However, as reported in the A2SE’s 2XEP Framing Paper (Australian Alliance to Save
Energy, 2014a), recent history has seen steep rises in electricity and natural gas prices,
eroding this advantage compared to other regions. In addition, Australia lags behind many
other nations in energy productivity performance, with a growth rate over the period 1995–
2012 of 1.1% per annum in energy productivity, compared with a G20 average of close to 2%
per annum over the same period. The following two figures from the 2XEP Framing Paper,
illustrate these points.

1
 This includes Divisions A: Agriculture, Forestry and Fishing, B: Mining, C: Manufacturing, D: Electricity, Gas, Water and Waste
Services, E: Construction, F: Wholesale Trade, G: Retail Trade, H: Accommodation and Food Services, I: Transport, Postal and
Warehousing, J: Information, Media and Telecommunications, K: Financial and Insurance Services, L: Rental, Hiring and Real
Estate Services, M: Professional, Scientific and Technical Services, N: Administrative and Support Services, R: Arts and
Recreation Services and S: Other Services.

2XEP - Manufacturing Sector Overview                                                                                 2

CONSULTATION DRAFT VERSION 1.0
Figure 3: Energy productivity of selected G20 countries2
14 4%
Average annual growth in energy productivity
(constant 2011 PPP $ per kg of oil equivalent)
GDP per unit of primary energy use
12
3%
$8.40
10
$7.20
2%
8
1995–2012
6 1.1% 1%
4
0%
2
0 -1%
Latest available Average annual growth rate
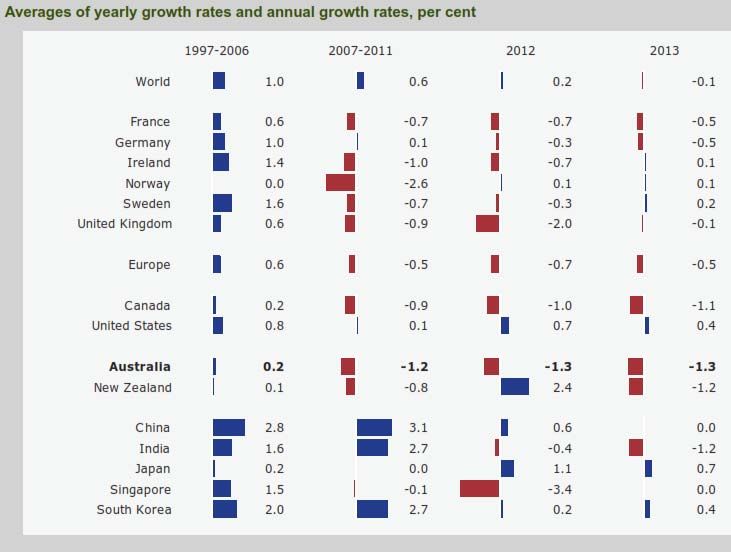
Figure 4: Real retail energy price ratios – an international comparison
177
170
(Base year 2007 Ratio of Energy Price
Real Energy Price Movement
150 150
Movements to CPI)
130
110
101
98
90
70 70
50
2007 2008 2009 2010 2011 2012 2013
Australian Electricity Prices (Retail) Australian Natural Gas Prices (Retail)
EU Natural Gas Prices (Residential) EU Electricity Prices (Residential)
USA Electricity Prices (Average Retail) USA Natural Gas Prices (Residential)
Inflation (=100)
With regard to manufacturing specifically, Australian industry faces other pressures in
addition to low productivity and high energy prices, including the high Australian dollar, high
relative labour costs, small market size and distance from key markets.
2
Latest available data for all countries was 2011 or 2012.
2XEP - Manufacturing Sector Overview 3CONSULTATION DRAFT VERSION 1.0
Energy-intensive manufacturers once relocated operations to Australia due to the
comparative advantage in energy costs, but in response to energy price increases as well as
a myriad of other competitive issues, these same industries are now relocating production
capacity out of the country. Recent examples include the closure of large industrial facilities
such as the Kurri Kurri and Point Henry aluminium smelters, Port Kembla steelworks (part),
pulp manufacturing at Millicent and Tantanoola, and oil refineries at Clyde and Kurnell.
Pending closures of Australia’s motor vehicle manufacturing capacity will see a further
decline in energy-intensive manufacturing in Australia.
The need to rapidly improve energy productivity in manufacturing operations, as well as
through the supply chain and in product design (also see shaded box below), has never been
more important to protect manufacturers help protect against higher energy costs and
position themselves for growing markets for energy efficient products.
Product design...
Advanced energy productive technologies, such as 3D printing, provide the sector with an
opportunity to renew itself. However, a national energy productivity agenda will also drive
demand for energy efficient product, adding to the growing global demand in one of the fasted
growing categories in the world.
Australia already has a number of world class manufacturing firms producing energy efficient
products competing on the world stage. A clear bipartisan approach to improving energy
productivity in Australia long term would attract more investment in such technologies (e.g.
energy efficient crushing and grinding equipment for the mining industry) and manufacturing
companies in Australia.
Given the combined factors noted above, the potential contribution that energy productivity
can make to Australia’s overall economic productivity is now at an historic high, as noted in
the 2XEP Framing Paper.
Australian manufacturers are aware of the challenges and opportunities. At the A2SE forum
for doubling energy productivity in March 2014 in Sydney, industry leaders and government
agencies discussed the issues facing Australia in regard to doubling energy productivity by
2030. Paul Orton, Director Policy and Advocacy at the NSW Business Chamber, stated the
importance of doubling energy productivity:
Manufacturing employs over a million people nationally and is NSW’s second largest
contributor to gross state product. With energy prices increasing, ‘business as usual’ just
isn’t good enough. This is not just a big business issue: energy productivity needs to be
addressed by smaller businesses as well.
Terry O’Brien, Chairman of the Australian Food and Grocery Council (AFGC) explained the
need for:
A focus on ‘energy productivity’ in the manufacturing sector, rather than ‘energy efficiency’,
as energy productivity is ‘increasing the quantity or quality of outputs from the same amount
of energy’. This is important as we need to grow the industry, and is the industry’s focus,
rather than reducing the amount of energy required to produce current outputs
(energy efficiency).
2XEP - Manufacturing Sector Overview 4CONSULTATION DRAFT VERSION 1.0
Reducing input costs (including energy – which is experiencing rapidly rising prices) was one
of the three key issues defined as being critical for the food industry, along with retail
concentration and industry regulation. The 2XEP program will focus on energy productivity to
maximise added value using energy. While not part of this scope of work, 2XEP will also
communicate the need to consider the price side of the equation to improve business energy
competitiveness.
1.2. Energy use and spend in manufacturing
The cost of energy used in the manufacturing industry was $14 bn in 2011/12. This will have
increased since then due to substantial price increases, but will have been somewhat offset
by closures of some energy-intensive businesses. This represents 13% of all expenditure on
energy in Australia, as illustrated below (ABS, 2013b).
Figure 5: Energy spend in Australia by source and industry sector (2011–12)
Spend source Spend by industry sector
Natural
Gas & Other
LPG 2% Mining Agriculture,
Construction Forestry &
12% 8%
6% Fishing
3%
Electricity
31% Residential
17%
Buildings
Transport
34% Commercial,
36%
Liquid Government,
Fuels Water & Waste
55% 17%
Manufacturing
13%
The chart below shows the proportion of energy consumed by each sub-sector (ABS,
2013b).
2XEP - Manufacturing Sector Overview 5CONSULTATION DRAFT VERSION 1.0
Figure 6: Energy end use by manufacturing sub-sectors
Iron and steel,
Non-ferrous metals,
122 PJ, 10%
419 PJ, 33%
Wood, paper and
printing, 69 PJ, 6%
Food, beverages and
textiles, 170 PJ, 13%
Other manufacturing,
133 PJ, 10%
Petroleum and
chemical, 359 PJ, 28%
Energy cost as a percentage of operating cost varies significantly across the manufacturing
sub-sectors. However, it is generally above 5% in most subsectors and significantly higher in
the metals processing sub-sector. Although this is a common metric, it does not take into
account the operating margin, which is the key factor determining the impact of energy cost
on the viability of businesses in the manufacturing sector. The thinner the operating margin
of a business, the more significant the impact of energy productivity initiative n shareholder
value created.
A2SE therefore analysed, based on available ABS data, the value of each net $-energy
dollar saved, expressed in equivalent $-sales at the factory gate as illustrated in Figure 7
below (ABS, 2013b; 2014a). This analysis suggests that a saving of $1 in energy cost (net of
project cost) is equivalent to between $13 and $18 of sales in most manufacturing sub-
sectors (higher for the metals processing industry).
2XEP - Manufacturing Sector Overview 6CONSULTATION DRAFT VERSION 1.0
Figure 7: Value of each net $-energy dollar saved, expressed in equivalent $-sales at factory gate
$35
2011/12 2012/13
Equivalent $-increase in sales for $1 net reduction in
$30 $29
$25
$23
energy spend
$20
$18 $18
$16
$15 $14 $14 $14
$13
$12
$10
$5
$-
Manufacturing Food, Wood, paper, Petroleum and Other
weighted average beverages, printing chemical products manufacturing
(inc metals) textiles
1.3. Measuring energy productivity improvements
Energy efficiency generally is seen as the ability to deliver the same level of service or output
using less energy, whereas energy productivity is a measure of the total economic value
delivered from each unit of energy utilised.
Energy efficiency is generally measured as energy consumed (typically in GJ) per unit of
output (typically tonnes), whereas energy productivity is often defined at a national level, as
presented below:
Equation 1: Basic energy productivity measure
2010 $
The A2SE’s 2XEP Framing Paper uses this equation to develop a preliminary estimate of the
scale of the task involved in doubling Australia’s energy productivity by 2030.
At the sector level, a commonly used energy productivity metric is:
Equation 2: Sector-level energy productivity measure
$
2XEP - Manufacturing Sector Overview 7CONSULTATION DRAFT VERSION 1.0
However, GVA as a productivity numerator, by its very definition,3 excludes energy and other
intermediate inputs that could contribute to productivity. This presents a particular challenge
for industries with vertically integrated supply chains, characterised by large inter-industry
transfers such as manufacturing (ABS, 2007). A recent European Commission paper also
cautioned against the use of value added as an industrial output variable as it improperly
implies that ‘efficiency-enhancing’ improvements in technology exclude intermediate inputs
such as energy and other materials (European Commission – Directorate-General for
Economic and Financial Affairs, 2014).
In order to overcome this weakness, the dollar value of sales (i.e. value at factory gate) in
real terms is proposed as the numerator of the primary manufacturing sector energy
productivity indicators (Alliance to Save Energy, 2013). Energy costs are embedded in these
‘gross sales metrics’, thus overcoming the weakness associated with ‘value added’ as a
numerator. In addition, a secondary indicator of energy price competitiveness – i.e. the value
created for each dollar spent on energy – is proposed to deal with this additional critical
aspect.
Equations 3 and 4: Preferred energy productivity measures for manufacturing
$ $
1
$
2
$e
For the purpose of tracking energy productivity over time, it will be necessary to set
cascading metrics from consolidated/total sector level down to individual plant level. These
need to be appropriate and meaningful for each sector and do not necessarily need to be
additive – as in these cases, the percentage change in the key metrics can be used to
identify improvement. Ideally, these metrics will capture the multiple dividends from energy
productivity, but in some cases – such as very energy-intensive commodity manufacturing
operations – simpler energy efficiency metrics may suffice. For example, for cement and
primary iron/steel, tonnes of product delivered/energy use (GJ) may be a practical and
sufficient operational indicator of energy productivity.
In addition, tertiary level index-based indicators can be established that are unit insensitive
(i.e. tonnes, dollars or any other output unit that is an appropriate measure of economic value
added in a subsector). These index-based indicators are proposed to be rolled up into a
composite energy productivity index for manufacturing, which, in turn, will be incorporated in
a national index. Appropriate methodologies will be developed as part of the roadmap
process. The proposed measurement framework at the sectoral level – e.g. manufacturing –
is illustrated below.
3
Industry value added is equal to the total value of gross outputs at basic prices less the total intermediate consumption at purchasers'
prices.
2XEP - Manufacturing Sector Overview 8CONSULTATION DRAFT VERSION 1.0
Figure 8: Conceptual overview of integrated measurement framework – applied to manufacturing
In summary ...
Australia’s energy productivity lags that of other G20 countries, and productivity in many
market sectors, including manufacturing, has been flat or declining in the last decade.
Energy prices have risen steeply relative to other nations, eroding what was once a
competitive advantage for Australia.
Manufacturing remains a large employer and large energy user, and how it responds to
these factors to improve productivity, including energy productivity, will shape its
competitiveness.
Energy productivity metrics are proposed to allow for energy productivity trends to be
measured over time. These need to be refined and agreed by industry so that there is a
set of cascading KPIs down to plant level.
2XEP - Manufacturing Sector Overview 9CONSULTATION DRAFT VERSION 1.0
2. The 2XEP improvement opportunity for manufacturing
2.1. Target setting considerations
The 2XEP program proposes doubling energy productivity by 2030 economy-wide, and this
provides a starting point for discussion about an appropriate target for the manufacturing
sector. Other countries and regions have energy efficiency targets and programs, and A2SE
will be conducting a review of manufacturing sector targets in the next few months. Here are
some examples of targets in other regions:
• The European Council for an Energy Efficient Economy (ECEEE) guides the European
Union (EU) on energy policy in regard to energy efficiency. The Energy Action Plan of
March 2011 is the current EU policy document specifically on energy efficiency, which
complements specific Framework Directives. Energy efficiency policy is also guided by
an indicative target of 20% energy savings by 2020. The target calls for energy
consumption for the entire EU of no more than 1474 Mtoe of primary energy and/or no
more than 1078 Mtoe of final energy in 2020. Europe is now considering extending the
program to 30% energy efficiency improvement by 2030 (ECEEE, n.d.).
• With specific reference to manufacturing, the European Commission’s research focus on
Factories of the future (EFFRA, 2013) sets out a vision and roadmap for manufacturing in
Europe to 2030 that reinforces the importance of manufacturing, identifies research and
innovation priorities and the key technologies and enablers, and focuses on funding and
governance issues. Energy efficiency and productivity needs, driven by resource
depletion and climate change, are an explicit focus and theme throughout.
• UK energy-intensive industries have agreed to commit to stretching energy efficiency
improvement targets to 2020 as part of the voluntary Climate Change Agreements (CCA)
scheme. This will deliver an overall 11% energy efficiency improvement across all
industry sectors by 2020 against agreed baselines. The new Climate Change
Agreements scheme provides an extension to the Climate Change Levy rebate for
energy-intensive industries until 2023 in return for meeting energy efficiency
improvement targets. A total of 51 industrial sectors, including steel, aerospace and
farming, have signed up across 9000 sites (Department of Energy and Climate Change,
2013).
• Another example of energy efficiency targets and measures is from Germany. The
Energy Concept, September 2010, included both energy efficiency targets and specific
policy measures for achieving these targets. These targets were confirmed by the
‘Energiewende’ decisions from 2011 and additional policy measures were announced in
order to accelerate the transformation of the energy system. Primary energy
consumption for Germany is to be reduced by 20% in 2020 and by 50% in 2050
compared to 2008. Electricity consumption is planned to be reduced by 10% in 2020 and
by 25% in 2050 (Fraunhofer Institute for Systems and Innovation Research ISI, 2012).
• The Obama administration in the USA has taken up the 2XEP target for their economy.
As part of this, a partnership between the US Department of Energy, the American
2XEP - Manufacturing Sector Overview 10CONSULTATION DRAFT VERSION 1.0
Alliance to Save Energy (ASE) and the Council on Competitiveness
(www.energy2030.org) sets out initiatives to accelerate energy productivity by 2030.
Several initiatives directly address manufacturing, including the Energy Security,
Innovation & Sustainability Initiative, the National Innovation Initiative, the US
Manufacturing Competitiveness Initiative, and the bridging of energy and manufacturing
in the American Energy and Manufacturing Competitiveness Partnership (a three-year
partnership between the Council and the Department of Energy’s Clean Energy
Manufacturing Initiative) (Department of Energy, 2013).
• The Alliance to Save Energy Commission on National Energy Efficiency Policy (ACNEE)
has developed several research papers, including one related to the future of
manufacturing in the US (Alliance to Save Energy, 2013). This research has estimated
potential improvements in energy productivity in the US of one third or more by 2035.
Also in the US, the Superior Energy Performance™ (SEP) initiative of the Office of
Energy Efficiency and Renewable Energy seeks to help industrial facilities achieve
energy management and productivity improvements at a similar scale. According to their
website, “The facilities in SEP have met the ISO 50001 standard and have improved
their energy performance up to 25% over three years or up to 40% over 10 years.”
(Office of Energy Efficiency and Renewable Energy, n.d.).
• In addition, China, although currently still lagging Australia in energy productivity metrics,
improved its energy productivity by 153% between 1990 and 2009. China is targeting a
further improvement in energy productivity of 16% between 2011 and 2015 (Institute of
Industrial Productivity, 2011; World Bank, n. d.).
On this basis, a doubling of energy productivity in Australia is not just an aspirational or
stretch target; rather it is a necessary objective for manufacturers to remain competitive in a
global market. While doubling energy productivity may sound ambitious, practical experience
of major consultants working with manufacturers (e.g. Energetics) indicates that energy
reductions of 25% or more are possible in many industries. There are a number of Australian
companies that have energy savings/unit of output targets of 2–3% annually, long term.
These do not account for multiple dividends from energy savings projects and so will
underestimate energy productivity benefits.
In Australia, if larger energy users (say the those that participated in the Energy Efficiency
Opportunity (EEO) Program) in the sector achieve (say) 1.75% annual energy savings/unit
on average, maintained to 2030, and on average 0.75%/year savings are made by small and
medium sized (SME) manufacturers (while these operations may sometimes have larger
savings potential, they are numerous and harder to reach), this should allow the sector to
meet the 2XEP target by 2030.
There is also evidence from several international companies that have achieved 50%
improvements in energy/output in a period of less than 10 years, as shown in the table
below.
2XEP - Manufacturing Sector Overview 11CONSULTATION DRAFT VERSION 1.0
Significant cost savings can be achieved by manufacturing organisations
that pursue long-term energy reduction targets ...
The table below summarises the targets of some of the world’s largest manufacturing companies. It is not
all about new technology. Up to 50% savings are possible with smarter use of existing technology.
Company Target Features
Danone (Dairy) 30% reduction targeted in five years Visionary leadership. Business brand built
after 45% reduction in energy intensity around ‘Nature’ sustainability positioning.
in previous five years.
Nissan USA 25% reduction in energy intensity by Created ‘energy culture’. Everyone
2020 after 30% reduction in previous responsible. Cross-functional teams. Zero-
five years. emissions mobility vision.
Dow Chemicals 25% reduction in energy intensity by Comprehensive continuous improvement
2015 after 38% reduction in previous program globally.
20 years.
3M 25% reduction in energy intensity by Brand built on innovation including in
2015 after 20% reduction in previous energy use.
five years.
(A2SE, 2014b; Nissan, 2012a)
2.2. What does a doubling of energy productivity mean for manufacturing
energy savings?
Doubling Australia’s energy productivity has been estimated to equate to an increase in GDP
from $219/GJ to $438/GJ of final energy demand, based on preliminary analysis published in
the A2SE Framing Paper, including forecast savings from minimum equipment performance
standards (Department of Industry, 2014b) this equates to a reduction in final energy
consumption in 2030 of 1147 PJ compared with forecast demand.
This reduction is reported to equate to a 3.5% per annum improvement in energy productivity
across the economy. About 60% of this change is expected to come from structural changes
– principally away from energy-intensive manufacturing and towards advanced
manufacturing and higher value-adding processes. The remainder will need to come from
energy productivity improvements – or a 1.4% annual improvement across the economy.
This is well above the overall long term historical trend (0.4% p.a. over the last two decades),
but broadly in line with the trend reported for the industrial sector recorded between 2008
and 2010 (ClimateWorks, 2013a) a period during which policy settings favoured investment
in energy efficiency by large energy users. (As discussed later in this paper, these policy
settings have deteriorated in their ability to stimulate energy efficiency investments). This
target appears achievable but challenging, which is the nature of a good stretch target.
2XEP - Manufacturing Sector Overview 12CONSULTATION DRAFT VERSION 1.0
Modelling at the sectoral level will seek to develop more robust estimates of the potential
contribution from manufacturing. On a simple basis that assumes sectors can achieve
savings in proportion to their contribution to energy demand, the manufacturing sector might
reasonably be expected to reduce energy use by 280 PJ4 per annum by 2030 compared with
baseline levels of consumption, at an estimated value of $5 bn per annum by 2030.
2.3. What is included in manufacturing sector energy productivity savings?
As noted above, it is expected that structural changes in the manufacturing sector may cut a
sizeable part of the energy productivity task, with the remainder to be achieved through
improvements at existing facilities and in supply chains.
Energy productivity is more than just traditional energy management. It is a measure of the
economic value created per unit of energy (which may be expressed in physical or $ units).
Energy productivity includes:
• ‘Traditional’ energy management – i.e. improving energy efficiency through better
management of energy use, using more energy-efficient equipment and processes, and
energy-use technology improvements. Energy productivity aims to capture ‘multiple
dividends’ accruing from investment in more efficient plant and equipment including
reduced maintenance costs, reduced downtime, and, in some cases, improved product
quality and fewer rejects.
• Systems optimisation – i.e. focusing on energy aspects of supply chain optimisation,
lean manufacturing, as well as other capacity optimisation and waste reduction strategies
(e.g. onsite heat recovery). Many process changes and optimisation programs may be
implemented for reasons of broader productivity improvement, but greater value can be
realised by bringing a deliberate energy competency and focus to them.
• Business model transformation – i.e. the energy aspects of fundamental longer term
business change – relating to improved product design and manufacturing processes,
including production of greater added-value products. While it is understood that 2XEP
may have a less direct influence on these programs than on energy management, again
it would nevertheless be valuable to bring a greater focus on the energy implications of
these programs.
As illustrated in Figure 9, these three strategies interact with both the quantity and quality of
output produced. A focus on the outputs is therefore an integral part of the 2XEP Roadmap.
4
Taking 22% of primary energy use as a proxy for final energy consumption, so 22% of 1272 PJ = 280 PJ
2XEP - Manufacturing Sector Overview 13CONSULTATION DRAFT VERSION 1.0
Figure 9: Key determinants of energy productivity
Factors directly impacting energy Output dimensions ($ or other
input perceived value)
Energy
Productivity
Growth
Structural shifts in the economy ...
Structural changes may account for substantial improvement in the energy productivity metric,
but are not something the 2XEP program will impact. Structural changes include a decline in
energy-intensive manufacturing in Australia and a move towards more advanced manufacturing
processes and less energy-intensive/higher value-adding manufacturing.
2.3.1. ‘Traditional’ energy management approach
A 2012 estimated that energy use in the Australian manufacturing sector could be cut by
12.8% (11.1% for the whole industrial sector5), based on the analysis of EEO company
reports, although analysis also indicates that less than half of this potential has been realised
to date (ClimateWorks, 2013a).
It is noted that a focus on EEO outputs is likely to have significantly underestimated the
manufacturing sector’s savings potential as it was a mandated reporting program that
encouraged a large proportion of companies to adopt a minimum compliance approach or
else understate savings as ‘insurance’ against a future mandated implementation regime.
This cautionary note is supported by the relatively small proportion (one third) of savings
identified from projects with more than two years’ payback, with strong indications that many
longer payback opportunities were not included (ClimateWorks, 2013a). Looking outside the
EEO program, opportunities may be widespread:
• Analysis of results from the NSW Energy Saver program suggests that there is also a
large cohort of medium-sized sites with large savings potential (Office of the Environment
and Heritage, 2013).
• Australia Industry Group surveys suggests that many SME manufacturers in Australia are
yet to implement basic energy management systems nor start investing in energy
5
This includes mining, transport, construction, as well as water and waste services.
2XEP - Manufacturing Sector Overview 14CONSULTATION DRAFT VERSION 1.0
efficiency suggesting energy efficiency opportunities may exist in the SME manufacturing
sector significantly higher than 10% (Australia Industry Group, 2012).
Energy efficiency data from a later (July 2013) ClimateWorks report was more optimistic
about savings potential based on recent trends. It revealed that the apparent rate of industrial
energy-efficiency improvement was three times the level of the last three years (and close to
the rate required to achieve 2XEP in manufacturing if maintained to 2030), as illustrated in
Figure 10 below (ClimateWorks, 2013b). It should be noted that the scope of this report is
broader than just manufacturing, including other industrial industry sectors such as mining.
Figure 10: ClimateWorks’ analysis of recent trends in energy efficiency gains in industrial sectors
1.6
1.3
1.1 1.1
0.5 x3
0.4
Pre‐2006 2006‐2007 2007‐2008 2008‐2009 2009‐2010 Recent
Average Average
Extrapolating this recent trend, ClimateWorks provided a more optimistic forecast of sector
savings of 207 PJ as illustrated in Figure 11 by 2020 out of the 1275 PJ consumed, or over
16% of 2010 energy use (ClimateWorks, 2013b). If this trend continued through to 2030,
manufacturing would save over 30% of 2010 levels by implementing energy efficiency
measures.
2XEP - Manufacturing Sector Overview 15CONSULTATION DRAFT VERSION 1.0
Figure 11: ClimateWorks’ extrapolation of recent trends in energy savings to 2020
207
180
120
PJ
60
33
23
0
2010-11
2011-12
2009-10
2012-13
2013-14
2014-15
2015-16
2016-17
2017-18
2018-19
2019-20
If recent trend is sustained From projects in the pipeline From projects implemented
A range of factors since the completion of the ClimateWorks analysis have occasioned
downward pressure on the energy efficiency drivers. These factors include:
• The removal of the carbon price, lowering pressure on electricity prices.
• The closure of the EEO program, which would have driven much of the savings trend in
recent years, as modelled by Climateworks (ClimateWorks, 2014c).
• The scheduled axing of the Victorian Energy Efficiency Target (VEET) scheme (albeit
that this has had limited impact in the manufacturing sector to date).
• The fall of the certificate price in the NSW Energy Savings (ESS) scheme to half that of
the period under review.
• The termination of the Commonwealth Clean Technology Investment Program, which
had resulted in over $285 million in government funding contributed towards over $875
million in investment by the manufacturing sector focused on energy efficiency and
productivity, fuel switching and renewable energy projects.
Nothwithstanding these downward pressures, other factors may provide balance and
encourage manufacturing businesses to invest further in energy efficiency. They include:
• The rapidly increasing gas price, which is expected to have its major impact from
2016/17. This will negatively impact the profitability of many gas-exposed manufacturing
businesses, but will stimulate accelerated actions to reduce gas consumption (though at
the risk to Australia’s emissions, as some companies may switch from gas to coal).
2XEP - Manufacturing Sector Overview 16CONSULTATION DRAFT VERSION 1.0
• The potential introduction of the Commonwealth Emission Reduction Fund (assuming
the relevant legislation passes the Senate), for which the manufacturing sector should be
prepared so as to maximise the potential gains in savings and productivity.
Still more recently, ClimateWorks Australia released a report examining the potential EBITDA
benefit of improved energy efficiency by large energy users (ClimateWorks, 2014a). In this
report, they published key findings for 50 large listed companies, as summarised below:
• For around 72% of the sample of companies, energy costs are greater than 10% of the
companies’ earnings before interest, taxes, depretiation and amortisation (EBITDA).
• Most exposed companies could increase their EBITDA by around 5% if they improved
their energy performance to best practice.
• Based on illustrative future energy price scenarios, 58% of companies in the sample are
likely to be highly impacted by future energy price rises, with increases in energy
expenditure equivalent to more than 3% of their EBITDA.
• Improving the energy performance of the highly impacted companies could help alleviate
the increase in energy costs by about half, on average.
As highlighted in the A2SE 2XEP Framing Paper, the market potential for demand-side
response (DSR) measures is largely untapped. A recent study puts the DSR potential of the
industrial sector at 3.1 GW,6 equivalent to 42% of the 7.6 GW total demand drawn by this
sector during system peak periods (ClimateWorks, 2014b). It was also estimated that
manufacturing could earn more than $1 bn per annum selling back electricity to the NEM
during peak demand periods when electricity spot prices are highest. Such demand-
response strategies would represent a more economically beneficial way to meet peak
electricity demand than continuing to build electricity supply and grid infrastructure7 to meet
peak electricity demand, which accounts for less than 1% of total annual electricity demand
(Smith, 2013).
Energy efficiency will continue to account for a large proportion of energy productivity gains
to manufacturing, and needs to be integral to a broader energy productivity assessment. The
Manufacturing Sector 2XEP Team will consolidate research and emerging techniques in this
area as part of the modelling and industry engagement works.
6
This ClimateWorks study for the Department of Industry defined DSR potential as the ability to shift or shed load for a period
of about 2–4 hours, 5–10 times a year during a network or electricity system peak if a commercial return is offered
(ClimateWorks, 2014b).
7
In the case of NSW, 25% of infrastructure is estimated to be utilised only during peak demand periods (Smith, 2013).
2XEP - Manufacturing Sector Overview 17CONSULTATION DRAFT VERSION 1.0
Measuring the multiple dividends of energy efficiency
The International Energy Agency (IEA) recently conducted a study of energy productivity
‘multiple dividend’ benefits. IEA says this study, Capturing the multiple benefits of energy
efficiency, challenges the assumption that the broader benefits of energy efficiency (which are
naturally included in energy productivity) cannot be quantified. It shows, for example, that when
the value of productivity and operational benefits to manufacturing companies were integrated
into their traditional internal rate of return calculations, the payback period for energy efficiency
measures dropped from 4.2 to 1.9 years International Energy Agency, 2014).
All previous analyses of energy savings potential in the sector have focused on energy
efficiency and direct energy cost savings associated with strategies such as demand
response, as well as other largely neglected additional dividends. As a result, these studies
significantly understate the potential benefits of energy productivity by only focusing on the
energy efficiency dividend.
An added focus of the Manufacturing Sector 2XEP Team will, therefore, be an examination
and modelling of the potential for energy productivity to yield multiple dividends.
2.3.2. Systems optimisation – Process change
The 2XEP Framing Paper notes that technologies, once implemented, tend to be locked in
for the long term, highlighting the need for life-cycle analysis and costs (of equipment
ownership, materials, waste and other inputs/outputs) to be a key factor in decision-making
processes. In the manufacturing sector, ‘locked in’ can mean 20+ years, so decisions taken
now have implications well beyond 2030.
International experience and detailed international manufacturing sub-sector benchmarking
studies suggest such a holistic approach towards energy management, incorporating
systems optimisation and process improvement could deliver 15-40% efficiency improvement
in most manufacturing sub-sectors (IPCC, 2007, 2014). There are numerous examples of
Australian manufacturers realising these levels of energy efficiency savings through taking
an holistic approach. For instance:
• Qenos Pty Ltd – Qenos invested $45 million in co-generation at its olefins site at Altona,
Melbourne. This facility will meet Qenos’s electricity demand at that plant and will be
capable of producing over a third of its steam requirements. This builds on Qenos’s
efforts since 1995, whereby Qenos has reduced greenhouse gas emissions by 40%,
partly through a focus on energy efficiency (PACIA, 2014a)
• Andpak Pty Ltd – Andpak (Aust) Pty Ltd based in Sunraysia, Victoria has reduced energy
use by 60% while increasing production by more than 40%, through investment in a wide
range energy efficiency opportunities including core process improvement and equipment
upgrades (PACIA, 2014b).
An interesting observation from an analysis of the Clean Technology Investment Program
(CTIP) grant recipients’ details is that over 62% (by $ value) of all investments made (53% of
grant monies awarded) went towards process improvement/optimisation or
2XEP - Manufacturing Sector Overview 18CONSULTATION DRAFT VERSION 1.0
replacement/consolidation initiatives (Department of Industry, n.d.). In many of these cases,
it is likely that energy savings were a consequential (but increasingly important) benefit of
initiatives that have improved capacity utilisation and improved manufacturing flexibility and
productivity as added (or core) benefits. Using narrative descriptions for a sample of CTIP
funded projects illustrates this point, as shown below.
Energy savings from major process change
Boral Cement will modify the cement-grinding process line at its cement manufacturing site
in Berrima.
The Austral Brick Co and Global Renewables will incorporate biomass material into the
brick-making process at Austral Brick’s Horsley Park manufacturing facility to reduce the
bricks’ mass and embodied energy.
Amcor Packaging (Australia) will upgrade the vacuum elevator operations to include a new
invertor, conveyor and associated variable speed drives and pressure-control systems at its
beverage-can manufacturing site in Revesby, NSW.
Wagners Queensland aims to reduce the energy intensity of cement manufactured at the
Pinkenba, Qld plant via the introduction of vertical roller mill (VRM) technology.
Monroe Australia will upgrade the current stainless-steel muffle of the sintering furnace to a
more reliable and energy-efficient ceramic muffle design. This upgrade will enable more
efficient operation of the furnace.
Nu-Pure will replace an existing bottling line at Stapylton, on the Gold Coast, Qld, with a
new energy efficient KOSME KSB 6R blow-moulding and filling line in Laverton North, Vic.
Mars will install new batching, milling, extrusion and drying/cooling/coating processing
equipment at its new dry pet-food factory in Bathurst, NSW.
Cement Australia will consolidate two facilities (Kandos, NSW and Ecocem in Port Kembla,
NSW) into one, with a new cement and ground slag grinding plant in Port Kembla.
The bias in investment in CTIP towards process plant and capacity improvement contrasts
with ClimateWorks’ evaluation of EEO-related investments, which are generally biased
towards improvements to auxiliary energy services and energy supply. The 2013 Tracking
progress towards a low carbon economy study (Climateworks, 20013b) found investments
biased towards:
• Improving cooling tower operation control.
• Upgrading boilers (including changing fuel sources).
• Waste heat and steam capture and re-use projects.
• Upgrading lighting.
• Installing co-generation plants.
• Improving crushing and grinding processes.
• Improving and upgrading compressed-air processes.
2XEP - Manufacturing Sector Overview 19You can also read