State of the Canterbury Food and Fibre Sector, 2020 - Caroline Saunders Meike Guenther Tim Driver Paul Dalziel Client Report for Canterbury Food ...
←
→
Page content transcription
If your browser does not render page correctly, please read the page content below

State of the Canterbury
Food and Fibre Sector, 2020

Caroline Saunders
Meike Guenther
Tim Driver
Paul Dalziel

Client Report for
Canterbury Food and Fibre Innovations

September 2020
Research to improve decisions and outcomes in business,
                                economic and environmental issues.

The Agribusiness and Economics Research Unit (AERU) at Lincoln University is a research centre
founded by a decision of the New Zealand Cabinet in 1962. It provides research for local, national and
international organisations.

The AERU maintains research capabilities in applied economic analysis, choice experiments,
environmental economics, international trade modelling, agri-food value chain analysis, public policy
advice and wellbeing economics.

Research clients include international agencies, private sector enterprises, industry associations, public
sector agencies (within New Zealand and overseas) and community groups.

AERU MISSION

To exercise leadership in research for sustainable well-being.

AERU VISION

The AERU is a cheerful and vibrant workplace where senior and emerging researchers are working
together to produce and deliver new knowledge that promotes sustainable well-being.

DISCLAIMER

While every effort has been made to ensure that the information in this report is accurate, neither
Lincoln University nor the AERU accepts any liability for error of fact or opinion which may be present,
nor for the consequences of any decision based on this information.

Recent AERU research reports are available at www.lincoln.ac.nz/aeru.

© Agribusiness and Economics Research Unit. Lincoln University, New Zealand, 2019

This work is licenced under the Creative Commons Attribution 3.0 New Zealand licence.

 Suggested citation for this report
 Saunders, C., M. Guenther, T. Driver and P. Dalziel (2020). State of the Canterbury Food and Fibre
     Sector, 2020. AERU Client Report prepared for Canterbury Food and Fibre Innovations.
     Lincoln University: Agribusiness and Economics Research Unit.

                                                                                                       ii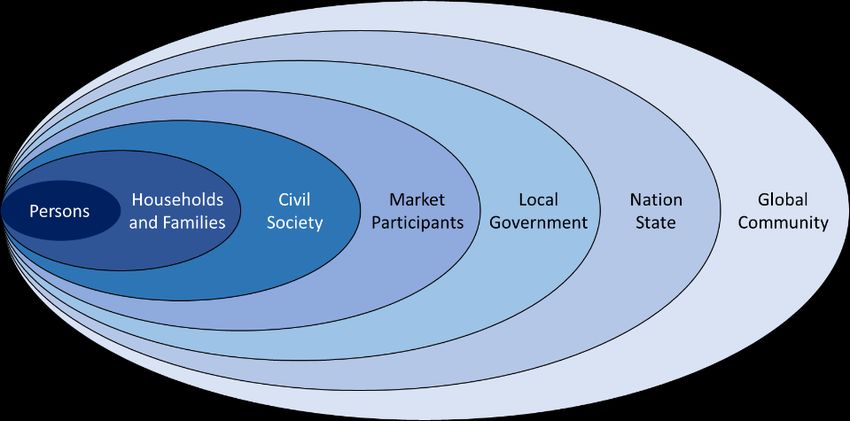
State of the Canterbury
Food and Fibre Sector, 2020

           Caroline Saunders
            Meike Guenther
              Tim Driver
              Paul Dalziel

           Client Report for
 Canterbury Food and Fibre Innovations

            September 2020

Agribusiness and Economics Research Unit
              P O Box 85084
            Lincoln University
               Lincoln 7647
               New Zealand

         Phone: +64 3 423 0372
    http://www.lincoln.ac.nz/AERU/

                                           Page | iii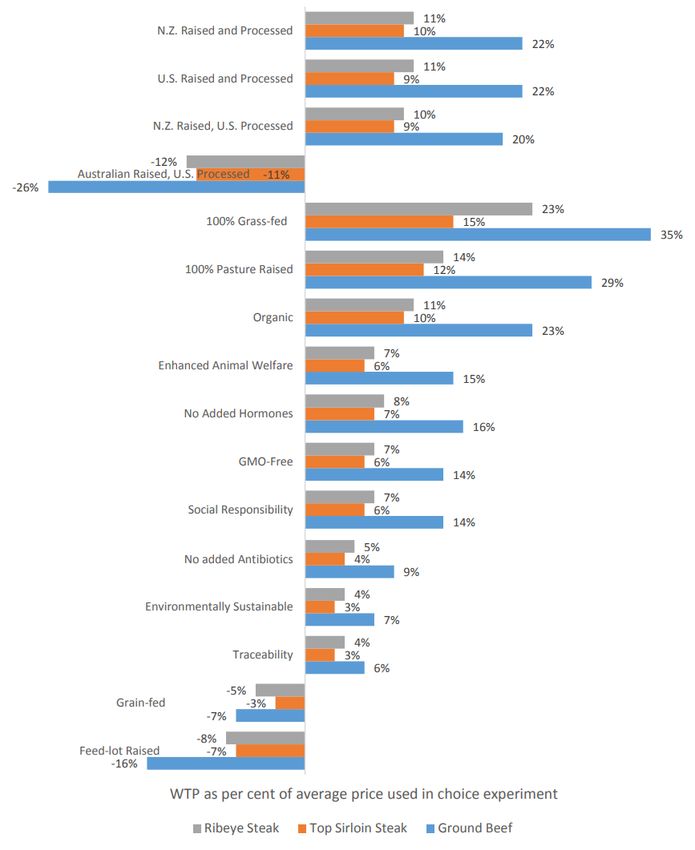
Acknowledgements

The authors gratefully acknowledge funding from the Canterbury Mayoral Forum’s Canterbury Food
and Fibre Innovations programme (facilitated by David Rendall) and from the Lincoln University Centre
of Excellence Food for Future Consumers (chaired by Associate Professor Roland Harrison). The authors
are also grateful to David Rendall for valuable discussions during the preparation of this report. We
thank those who provided very helpful comments on an early draft, including Simon Anderson, David
Bromell, Tim Davie, Elizabeth Hopkins, Maxine Bryant, Rebecca Warr, Michael Shone and Alexandra
Sturthridge. We thank the five institutions that provided employment data on researchers in the
Canterbury region, reproduced in Figure 6.8.

                                                                                       Page | iv
Contents
Acknowledgements iv
Contents v
List of Figures vii
List of Tables ix
Chapter 1 Introduction 1
1.1 Background to this Report 1
1.2 Structure of the Report 2
Chapter 2 Canterbury’s Food and Fibre Sector 3
2.1 Introduction 3
2.2 Primary Producers 3
2.3 Primary Processors 6
2.4 Exports 9
Chapter 3 Economic Indicators for the Canterbury Food and Fibre Sector 13
3.1 Introduction 13
3.2 Contribution to Gross Domestic Product 13
3.3 Related Services 16
3.4 Employment 16
3.5 Income 21
3.6 Land Use 21
Page | vChapter 4 Creating Additional Value from Food and Fibre 29
4.1 Introduction 29
4.2 Credence Attributes 29
4.3 International Consumer Willingness-to-Pay 31
4.4 The New Zealand and Canterbury Stories 41
4.5 Global Agri-food Value Chains 42
Chapter 5 Applying a Wellbeing Framework 46
5.1 Introduction 46
5.2 The AERU Wellbeing Framework 46
5.3 The Capital Stocks of the Canterbury Food and Fibre Sector 50
5.4 Conclusion 56
Chapter 6 Conclusion 57
6.1 Introduction 57
6.2 Key Messages of the Report 57
6.3 Statistical Indicators 59
References 77
Page | viList of Figures
Figure 3.1 Contribution of the Food and Fibre Sector to Canterbury GDP, 2017 15
Figure 4.1 Consumer Willingness-to-pay for Attributes of New Zealand Sauvignon Blanc
as a Percentage of Average Bottle Price, California, 2017 33
Figure 4.2 Consumer Willingness-to-pay for Attributes of New Zealand Yoghurt Products
as a Percentage of Average Product Price, Shanghai, 2017 34
Figure 4.3 Consumer Willingness-to-pay for Attributes of New Zealand Beef Products as
a Percentage of Average Product Price, California, 2017 35
Figure 4.4 Consumer Willingness-to-pay for Attributes of New Zealand Kiwifruit as a
Percentage of Average Product Price, Shanghai, 2017 36
Figure 4.5 Consumer Willingness-to-pay for Attributes of New Zealand Lamb above
Average Product Price, £/kg, United Kingdom, 2019 37
Figure 4.6 Consumer Willingness-to-pay for Attributes of New Zealand Lamb as a
Percentage of Average Product Price, United Kingdom, 2019 38
Figure 4.7 Consumer Willingness to Consider Consuming a Higher Amount of Alternative
Protein Products, Percentage Responding ‘yes’, United Kingdom, 2019 39
Figure 4.8 Importance of Selected Attributes of Alternative Protein Products when
Shopping for Food, Percentage Responding ‘Very Important’ and ‘Important’,
United Kingdom, 2019 40
Figure 4.9 Importance of Factors in Motivating Consumption of Alternative Protein
Products, Percentage Responding ‘Very Important’ and ‘Important’, United
Kingdom, 2019 40
Figure 4.10 Importance of Factors in Dissuading Consumption of Alternative Protein
Products, Percentage Responding ‘Very Important’ and ‘Important’, United
Kingdom, 2019 40
Figure 4.11 Using Collaborative and Market Oriented Value Chains to Create Value 43
Figure 5.1 The Treasury’s Living Standards Framework 47
Figure 5.2 The AERU Wellbeing Economics Framework 48
Page | viiFigure 6.1 Value of Food and Fibre Exports through Canterbury Ports, NZ$ millions at
2019 Consumer Prices, 2010–2019 60
Figure 6.2 Total Population of Countries in Free Trade Agreements with New Zealand,
Billions, June 2010–2019 62
Figure 6.3 Total Area of Farms, Canterbury, Hectares, June 2010–2019 64
Figure 6.4 Long-term Trends of Nitrate-Nitrogen in Groundwater, Statistical Analysis
over Ten Year Periods, Canterbury, Per Cent, 2010–2019 66
Figure 6.5 New Zealand Drought Index, Canterbury, Maximum Value in the Region,
2010–2019 68
Figure 6.6 Domestic Students Enrolled in Agriculture, Environmental and Related
Bachelor Degrees, Full-time Equivalent, New Zealand Tertiary Education
Institutions, 2010–2019 70
Figure 6.7 Number of Work-related ACC claims, Agriculture, Forestry and Fishing,
Canterbury, 2010–2018 72
Figure 6.8 Number of Public Researchers in the Canterbury Food, Fibre & Agritech
Sector, 2020 74
Figure 6.9 Number of Full-time Equivalent Academics at Lincoln University,
2010–2019 75
Page | viiiList of Tables
Table 2.1 Number of Businesses in the Food and Fibre Production Industry, Canterbury,
2010–2019 4
Table 2.2 Employee Count in the Food and Fibre Production Industry, Canterbury,
2010–2019 5
Table 2.3 Number of Businesses in the Food and Fibre Production Industry, Canterbury,
2010–2019 7
Table 2.4 Employee Count in the Food and Fibre Production Industry, Canterbury,
2010–2019 8
Table 2.5 Canterbury Food and Fibre Sector, 2019 9
Table 2.6 Food and Fibre Exports by Canterbury Port, 2018 (FOB NZ$000; HS Chapter
2) 11
Table 3.1 Gross Domestic Product by Industry, Canterbury, $million, Years Ending
March, 2012–2017 14
Table 3.2 Related Services to the Food and Fibre Production Industry, Canterbury, $000,
2013 17
Table 3.3 Related Services to the Food and Fibre Processing Industry, Canterbury, $000,
2013 18
Table 3.4 Employment in the Food and Fibre Sector, Canterbury, 2006 and 2013 19
Table 3.5 Main Earnings Source in Agriculture, Forestry, and Fishing, Canterbury, $ per
Year, Year Ending March, 2010–2018 21
Table 3.6 Agricultural Area by Usage (Hectares), Canterbury, Year Ending June, 2002–
2016 22
Table 3.7 Irrigated Land, Canterbury and New Zealand (Hectares), Year Ending June,
2012 and 2017 22
Table 3.8 Livestock Numbers in Canterbury and New Zealand, Year Ending June, 2008
and 2018 23
Table 3.9 Herd Size in Canterbury, South Island and New Zealand, 2017/18 23
Page | ixTable 3.10 Dairy Production in Canterbury and New Zealand, 2017/18 24
Table 3.11 Horticultural Production in Canterbury and New Zealand (Hectares), Year
Ending June, 2007 and 2017 25
Table 3.12 Arable Crops in Canterbury and New Zealand (Tonnes and Hectares), Year
Ending June, 2007 and 2017 25
Table 3.13 Area, Standing Volume and Area Weighted Average Age, Canterbury and New
Zealand, 2019 26
Table 3.14 Number of Forest Owners by National Size Class, Canterbury and New
Zealand, 2019 26
Table 3.15 Forestry Planting and Harvesting, Canterbury and New Zealand, Year Ending
March, 2012 and 2017 27
Table 3.16 Vineyard Production, Canterbury and New Zealand, 2010–2019 28
Table 4.1 Food Attribute Willingness-to-pay (WTP) as a Percentage of Product Price in
China, India and the United Kingdom – Dairy and Lamb Products, 2012 31
Table 4.2 Consumer Willingness-to-pay for Certified Improvement in Production
Standards above Minimum as a Percentage of Average Product Price, 2015 32
Page | xChapter 1
Introduction
1.1 Background to this Report
An important feature of the Canterbury economy is the world-class quality of its food and fibre
products, a large amount of which is exported. Canterbury has enjoyed a high reputation for this
quality for more than a century. As early as 1895, for example, newspapers were commenting that
‘Canterbury’ had become the standard term for the best class of meat exported from New Zealand.1
The food and fibre sector extends well beyond the land-based producers. A report commissioned from
the AERU in 2005 reported that nationally, agri-food primary industries account for about 6 per cent
of gross domestic product. Processing industries account for a further 6 per cent, and other industries
providing inputs to the producers and processors added another 7 per cent. Thus, nationally the food
and fibre sector is about 19 per cent of gross domestic product.2
The interconnections between producers and other parts of the economy mean that land-based
enterprises make important contributions to urban economies. In 2012, the AERU surveyed farms and
rural businesses in the Selwyn and Waimakariri districts of Canterbury to estimate the percentage of
expenditure on inputs to farm businesses that flowed into Christchurch City. Annually, $306 million of
farm (including their households) expenditure and $511 million of secondary farm expenditure via
rural businesses is directly spent in Christchurch – a total of $817 million. The flow-on effects of this
expenditure, including the direct, indirect and induced effects of farms, and their secondary flows via
purchases from rural businesses, were valued at $2.2 billion. This accounted for 10 per cent of
Christchurch’s total gross output and was associated with 12,564 full-time employees in the city.3
As part of the Canterbury Regional Economic Development Strategy, the Canterbury Mayoral Forum
has initiated the Canterbury Food and Fibre Innovations programme. The programme convened a
workshop with key institutions working across the Canterbury food and fibre sector, hosted by Blinc
Innovation at Lincoln University on 29 April 2019. The workshop recognised that it is currently difficult
to gain common line of sight across different data sets and existing repositories related to the sector.
Consequently, the workshop recommended work towards creating an open regional data and analytics
platform that should be openly available to all stakeholders including farmers, agribusinesses and
start-up businesses, as well as the Councils and other rural and regional groups. Painting a unified story
of sustainability for the Canterbury region (economic, environmental and social) would be a powerful
story that would help businesses and constituent stakeholders in Canterbury and New Zealand,
including those involved in exports.
1
Saunders et al. (2016a, p. 45).
2
Saunders et al. (2016a, p. 16).
3
Saunders et al. (2016a, p. 25).
Page | 1As part of that work, the Canterbury Mayoral Forum commissioned the Agribusiness and Economics
Research Unit at Lincoln University to prepare this initial report on the state of the Food and Fibre
sector in Canterbury. The Food for Future Consumers Centre of Excellence also contributed to the
funding of the report as part of its mission to improve links between provenance (such as place of
origin, authenticity, land, agro-ecosystems) and food qualities (such as production values, composition
and preference). 4
This authors were asked to describe the full sector (production, processing and associated services)
across the full range of food and fibre industries, with a focus on exported food and fibre products.
The report also presents statistical indicators associated with the sector.
1.2 Structure of the Report
After this introductory chapter, the report consists of four further chapters. Chapter 2 presents data
describing the Food and Fibre sector in Canterbury, with separate sections describing Canterbury
producers and Canterbury processors. A third section presents a stocktake of exported food and fibre
products through Lyttelton Port, Timaru Port and Christchurch International Airport.
Chapter 3 develops that analysis with further statistical indicators for the sector. It moves beyond
producers and processors to consider also the service industries to the food and fibre sector. This
chapter presents data on contributions to gross domestic product, employment, income and land use
patterns.
Chapter 4 addresses the question of how to create additional value from the Canterbury Food and
Fibre sector, recognising that significant change is already taking place, led by industry initiatives and
supported by public sector programmes. The chapter explains the movement from volume to value by
communicating a product’s credence attributes. These are product qualities that cannot be seen
immediately or experienced during consumption, but rely on consumer trust, supplier communication
or independent verification. Examples include food safety, environmental stewardship, animal
welfare, social responsibility and cultural authenticity.
Chapter 5 broadens the analysis again by applying a wellbeing economics lens to the state of the sector.
This recognises that the New Zealand government presented the world’s first Wellbeing Budget to
Parliament in 2019. This report uses an AERU version of the Treasury’s Living Standards Framework to
present material on how the Canterbury Food and Fibre sector contributes to wellbeing.
Chapter 6 is a concluding chapter summarising the key messages from the analysis. It finishes with a
set of eight proposed statistical indicators for monitoring the long-term prosperity of Canterbury’s
Food and Fibre sector.
4
See https://www.lincoln.ac.nz/research/research/lucoe/ffc/?sti=1. The authors are grateful to the chairperson
of the centre, Associate Professor Roland Harrison, for his support for this project.
Page | 2Chapter 2
Canterbury’s Food and Fibre Sector
2.1 Introduction
This section presents data describing the Food and Fibre Sector in Canterbury, drawn mostly from the
Australian and New Zealand Standard Industrial Classification (ANZSIC). The sector is defined here as
the sum of primary producers and processors in the region. Section 2.2 will present data on the
producers and Section 2.3 will present data on the processors. Section 2.3 then presents data on
exported food and fibre products through the three Canterbury ports (Lyttelton, Timaru and
Christchurch International Airport).
2.2 Primary Producers
The primary production sector in the National Accounts includes agriculture, forestry and fishing, plus
mining. Except when it is not possible to separate the subcategories, mining is excluded in this report
from the definition of the Food and Fibre primary production sector. This leaves the following seven
industries as making up the primary producers:
1. Horticulture and Fruit Growing;
2. Sheep, Beef Cattle and Grain Farming;
3. Dairy Cattle Farming;
4. Poultry, Deer & Other Livestock Farming;
5. Forestry and Logging;
6. Fishing and Aquaculture; and
7. Agriculture Support Services and Hunting.
There are a large number of businesses in Canterbury’s Food and Fibre production sector. Table 2.1
illustrates the number of businesses in the relevant industries in Canterbury for the period 2010 to
2019. In 2019, there were 9,531 businesses in agriculture, forestry and fishing. Within that group, the
largest number of businesses was recorded for the sheep and beef industry (3,984 businesses),
followed by dairy (1,764 businesses), then agriculture, forestry and fishing support services (1,083
businesses). In 2019, thirteen per cent of all Canterbury businesses were related to agriculture, forestry
and fishing.
Table 2.1 reflects the large number of conversions to dairy farming in the last decade. Between 2010
and 2019 the number of businesses in the agriculture, forestry and fishing sector dropped by 14 per
cent, with the largest decrease in sheep, beef cattle and grain businesses (a fall of 21 per cent). In
contrast, the number of businesses in dairy cattle farming grew by 28 per cent. The number of poultry
farming businesses also grew, by 20 per cent.
Page | 3Table 2.1 Number of Businesses in the Food and Fibre Production Industry, Canterbury, 2010–2019
Industry (ANZIC06) 2010 2011 2012 2013 2014 2015 2016 2017 2018 2019
Nursery and Floriculture Production 300 288 225 216 213 156 150 153 159 156
Mushroom and Vegetable Growing 264 267 249 240 246 201 195 195 180 183
Fruit and Tree Nut Growing 516 498 447 477 468 399 390 378 333 336
Sheep, Beef Cattle and Grain Farming 5,058 4,878 4,902 4,623 4,560 4,713 4,428 4,236 4,062 3,984
Other Crop Growing 561 657 651 708 699 699 819 858 690 513
Dairy Cattle Farming 1,374 1,470 1,563 1,566 1,629 1,758 1,761 1,749 1,677 1,764
Poultry Farming 75 75 81 81 78 87 87 84 84 90
Deer Farming 444 393 348 318 297 270 270 267 228 207
Other Livestock Farming 942 909 867 786 750 801 756 729 648 600
Agriculture Total 9,528 9435 9,339 9,021 8,946 9,081 8,853 8,643 8,064 7,830
Aquaculture 27 27 27 24 21 24 24 27 24 24
Forestry and Logging 519 501 492 462 450 468 477 468 435 432
Fishing, Hunting and Trapping 153 165 162 171 180 180 180 180 174 162
Agriculture, Forestry and Fishing
903 897 897 933 999 1044 1035 1044 1137 1083
Support Services
Total Agriculture, Forestry and Fishing 11,127 11,025 10,917 10,608 10,599 10,797 10,566 10,365 9,837 9,531
Total All Industry 65,163 64,749 64,290 65,535 68,373 70,485 71,376 72,219 72,144 72,714
Source: Statistics New Zealand (2020a).Table 2.2 Employee Count in the Food and Fibre Production Industry, Canterbury, 2010–2019
Industry (ANZIC06) 2010 2011 2012 2013 2014 2015 2016 2017 2018 2019
Nursery and Floriculture Production 620 580 670 550 610 580 620 640 710 690
Mushroom and Vegetable Growing 1,100 1,050 1,150 1,150 1,150 1,200 1,200 1,250 1,300 1,350
Fruit and Tree Nut Growing 610 590 560 650 600 620 620 590 430 390
Sheep, Beef Cattle and Grain Farming 3,400 3,300 3,350 3,500 3,550 3,450 3,500 3,300 3,250 3,200
Other Crop Growing 150 170 150 140 170 200 190 250 230 270
Dairy Cattle Farming 3,900 4,200 4,550 4,700 5,100 5,200 5,000 5,100 5,200 5,300
Poultry Farming 200 180 130 190 180 190 220 220 220 220
Deer Farming 290 280 240 210 200 150 140 130 180 180
Other Livestock Farming 510 470 470 460 450 340 390 410 600 550
Total Agriculture 10,800 10,800 11,300 11,600 12,000 11,900 11,900 11,900 12,100 12,100
Aquaculture 80 110 110 180 110 130 130 150 160 180
Forestry and Logging 200 220 240 230 250 260 290 260 280 290
Fishing, Hunting and Trapping 310 330 310 320 320 360 110 690 720 620
Agriculture, Forestry and Fishing Support
2,450 2,400 2,500 2,450 2,700 2,650 2,800 2,900 3,000 3,150
Services
Total Agriculture, Forestry and Fishing 13,800 13,900 14,500 14,800 15,400 15,300 15,200 15,900 16,300 16,400
Total all Industry 255,100 255,300 257,100 264,300 277,700 285,900 289,800 293,000 303,400 305,300
Source: Statistics New Zealand (2020a).Table 2.2 on the previous page presents the numbers of employees by sector in the Food and Fibre
production industry in Canterbury. In 2019, 16,400 people were employed in agriculture, forestry and
fishing. The largest number of employees was in dairy (5,300 employees), followed by sheep, beef
cattle and grain (3,200 employees), then agriculture, forestry and fishing support services (3,150
employees).
Between 2010 and 2019 the employee count in agriculture, forestry and fishing has grown by 19 per
cent. In the same period, the employee count in aquaculture and fishing, hunting and trapping has
more than doubled. The number of employees in dairy farming grew by 36 per cent while the number
of employees in sheep and beef and grain farming dropped by 6 per cent over the same period. Total
employees in Canterbury increased by 20 per cent between 2010 and 2019.
2.3 Primary Processors
Many products from primary production must be processed before they can be sold to consumers.
The processing industries are classified in the System of National Accounts as part of the manufacturing
sector, but are clearly a necessary part of the Food and Fibre sector. Hence, the Food and Fibre
processing sector is comprised of the following eight industries:
1. Meat & Meat Product Manufacturing;
2. Seafood Processing;
3. Dairy Product Manufacturing;
4. Fruit, Cereal and Other Food Product Manufacturing;
5. Beverage and Tobacco Product Manufacturing;
6. Textile, Leather, Clothing and Footwear manufacturing;
7. Wood Product Manufacturing; and
8. Pulp and Paper Product Manufacturing.
In 2019, 1,017 firms made up the Food and Fibre processing sector in Canterbury (see Table 2.3). The
largest number of businesses was recorded in food manufacturing (408 businesses), followed by wood
product manufacturing (273) then textile, leather, clothing and footwear manufacturing (225). Within
the food and fibre processing sector, food manufacturing accounted for the largest number (40 per
cent), followed by wood product manufacturing (27 per cent).
Within food manufacturing, the largest number of businesses were bakeries (138 businesses),
representing 34 per cent of total food manufacturing businesses, followed by other food product
manufacturing (120 businesses) representing 29 per cent of total food manufacturing businesses.
The number of businesses within the Food and Fibre Processing industry in Canterbury fluctuated
between 2010 and 2019, but dropped by 4.5 per cent overall.
Page | 6Table 2.3 Number of Businesses in the Food and Fibre Production Industry, Canterbury, 2010–2019 Industry (ANZIC06) 2010 2011 2012 2013 2014 2015 2016 2017 2018 2019 Meat and Meat Product Manufacturing 54 54 51 54 54 60 60 60 54 54 Seafood Processing 18 18 18 15 18 18 18 18 18 18 Dairy Product Manufacturing 24 24 21 27 24 30 24 27 24 27 Fruit and Vegetable Processing 15 15 18 15 15 18 15 15 18 21 Oil and Fat Manufacturing 6 9 9 9 9 9 12 9 6 9 Grain Mill and Cereal Product Manufacturing 12 12 9 12 9 12 12 12 12 12 Bakery Product Manufacturing 159 153 144 150 153 147 150 150 144 138 Sugar and Confectionery Manufacturing 21 21 21 18 15 15 12 12 9 9 Other Food Product Manufacturing 96 102 111 108 114 114 117 117 120 120 Food Product Manufacturing 399 405 402 405 417 420 423 420 405 408 Beverage and Tobacco Product Manufacturing 66 57 63 69 78 81 90 87 96 90 Textile, Leather, Clothing and Footwear Manufacturing 273 270 237 237 234 243 237 228 219 225 Wood Product Manufacturing 306 300 291 276 285 282 282 279 282 273 Pulp, Paper and Converted Paper Product Manufacturing 21 21 24 21 21 24 21 21 18 21 Total Food and Fibre Processing 1,065 1,053 1,017 1,008 1,035 1,050 1,053 1,035 1,020 1,017 TOTAL Industry 65,163 64,749 64,290 65,535 68,373 70,485 71,376 72,219 72,144 72,714 Source: Statistics New Zealand (2020a).
Table 2.4    Employee Count in the Food and Fibre Production Industry, Canterbury, 2010–2019

 Industry (ANZIC06)                                       2010      2011      2012      2013      2014      2015      2016      2017      2018      2019

 Meat and Meat Product Manufacturing                      5,800     5,600     5,100     5,200     5,100     4,700     5,200     5,300     5,200     5,200

 Seafood Processing                                       1,250     1,250     1,100     1,050     900       840       700       660       640       690

 Dairy Product Manufacturing                              1,050     1,150     1,300     1,300     1,650     1,950     2,150     1,950     2,350     2,550

 Fruit and Vegetable Processing                           1,050     890       1,050     1,050     1,100     960       950       1,000     1000      1,050

 Oil and Fat Manufacturing                                 18        18        21        20        30        40        45        40        35        45

 Grain Mill and Cereal Product Manufacturing              160       160       100        55       140       170       180       190       170       170

 Bakery Product Manufacturing                             2,200     2,000     2,000     2,150     2,000     2,100     2,050     2,100     2,150     2,100

 Sugar and Confectionery Manufacturing                    110       100       130       110       100        85        70        50        45        45

 Other Food Product Manufacturing                         630       670       720       690       770       740       720       700       730       690

 Food Product Manufacturing                              12,200    11,800    11,500    11,600    11,800    11,600    12,000    11,900    12,300    12,500

 Beverage and Tobacco Product Manufacturing               540       570       440       570       550       550       440       500       700       790

 Textile, Leather,      Clothing    and      Footwear
                                                          2,300     2,300     1,950     1,950     1,950     1,700     1,550     1,500     1,450     1,450
 Manufacturing

 Wood Product Manufacturing                               2,100     2,050     1,950     2,050     2,150     2,250     2,200     2,250     2,250     2,150

 Pulp, Paper and        Converted    Paper     Product
                                                          390       390       290       360       270       370       350       340       360       390
 Manufacturing

 TOTAL Food and Fibre Processing                         17,530    17,110    16,130    16,530    16,720    16,470    16,540    16,490    17,060    17,280

 Total All Canterbury                                    255,100   255,300   257,100   264,300   277,700   285,900   289,800   293,000   303,400   305,300

Source: Statistics New Zealand (2020a).
Table 2.4 on the previous page shows the number of employees by industry in the Canterbury Food
and Fibre processing sector between 2010 and 2019. In 2019, 17,280 people were employed in the
Food and Fibre processing industry. The largest number of employees were in food product
manufacturing (12,500 employees), followed by wood product manufacturing (2,150 employees).
Within the food product manufacturing sector, the largest number of employees was in meat and meat
product manufacturing (5,200 employees), followed by dairy product manufacturing (2,550
employees). Of note, the dairy product manufacturing has grown significantly between 2010 and 2019
with the employee numbers in this sector more than doubling (143 per cent) over that period.
Table 2.5 summarises the number of businesses and employees of Canterbury’s Food and Fibre sector
in 2019. This shows that 15 per cent of all Canterbury businesses are in the food and fibre sector and
11 per cent of employees.
Table 2.5 Canterbury Food and Fibre Sector, 2019
Number of Businesses Number of Employees
Food and Fibre Production 9,531 16,400
Food and Fibre Processing 1,017 17,280
Food and Fibre Industry 10,548 33,680
Total all industries 72,714 305,300
Source: Statistics New Zealand (2020a).
2.4 Exports
Exports are important for the New Zealand economy. In 2018, 95 per cent of New Zealand’s milk
production was exported, as well as over 90 per cent of sheepmeat and 80 per cent of the country’s
beef production.5 Most food and fibre products exported from Canterbury (as well as some from
elsewhere) are exported from region’s three major ports: the sea ports of Lyttelton and Timaru and
Christchurch International Airport.
Export data are available from the series published by Statistics New Zealand on Harmonised Trade –
Exports. The Harmonised System is used by more than 190 other countries as a basis for their customs
tariffs and for collecting international trade statistics. The dataset is detailed, comprising 21 sections,
98 chapters (2 digit), 1,229 headings (4 digit), and 5,394 sub-headings (6 digit). The research team
scanned the 98 HS Codes (2-digit level) to identify 36 HS chapters relevant to the Food and Fibre Sector.
5
Data from DCANZ (2020) and from MIA 2020).
Page | 9Table 2.6 reports Food and Fibre exports by HS chapter passing through each Canterbury port in 2018.
The total value of Food and Fibre exports shipped from all three Canterbury ports that year was $5.8
billion. The largest value was shipped from Lyttelton ($4.3 billion), followed by Timaru ($1.2 billion)
and then Christchurch airport ($356 million). The largest share was for dairy produce (45 per cent),
followed by meat and edible meat offal (14 per cent), then preparations of cereals, flour, starch or milk
and pastry cooks’ products (12 per cent). Exports of wood and articles of wood were 5 per cent of all
food and fibre exports leaving the Canterbury ports in 2018.
In 2018, there was $4.3 billion of food and fibre exports shipped from Lyttelton port. These exports
were mainly dairy produce (42 per cent), followed by preparations of cereals, flour, starch or milk;
pastry cooks' products (16 per cent), then meat and edible meat offal (14 per cent). Exports of wood
and articles of wood were 5 per cent of all food and fibre exports leaving the Canterbury ports in 2018.
From Timaru port a value of $1.2 billion food and fibre exports were exported in 2018. The majority of
exports from this sector were dairy produce (66 per cent), followed by meat and edible meat offal (12
per cent), then wood and articles of wood; wood charcoal (8 per cent).
From Christchurch International Airport $356 million of food and fibre exports were shipped overseas
in 2018. The largest share was fish and crustaceans, molluscs and other aquatic invertebrates (43 per
cent), then Meat and edible meat offal (17 per cent), and then Fruit and nuts, edible; peel of citrus fruit
or melons (11 per cent).
Page | 10Table 2.6 Food and Fibre Exports by Canterbury Port, 2018 (FOB NZ$000; HS Chapter 2)
Christchurch Total
Christchurch
Seaport Timaru Canterbury
Airport
(Lyttelton) Ports
Animals; live … 10,652 14,555 25,207
Meat and edible meat offal 591,595 60,119 138,924 790,638
Fish and crustaceans, molluscs and
175,406 152,946 47,873 376,225
other aquatic invertebrates
Dairy produce; birds' eggs; natural
honey; edible products of animal
1,823,228 14,738 769,195 2,607,161
origin, not elsewhere specified or
included
Animal originated products; not
72,218 2,945 8,014 83,177
elsewhere specified or included
Trees and other plants, live; bulbs,
roots and the like; cut flowers and 18,835 275 … 19,110
ornamental foliage
Vegetables and certain roots and
73,509 404 11,060 84,972
tubers; edible
Fruit and nuts, edible; peel of citrus
12,787 37,554 387 50,727
fruit or melons
Coffee, tea, mate and spices 17 83 … 100
Cereals 370 23 … 392
Products of the milling industry; malt,
11,261 186 337 11,785
starches, inulin, wheat gluten
Oil seeds and oleaginous fruits;
miscellaneous grains, seeds and fruit,
101,535 7,388 3,597 112,520
industrial or medicinal plants; straw
and fodder
Lac; gums, resins and other vegetable
78 97 … 175
saps and extracts
Vegetable plaiting materials; vegetable
products not elsewhere specified or 1 … … 1
included
Animal or vegetable fats and oils and
their cleavage products; prepared 6,372 3,376 37,630 47,378
animal fats; animal or vegetable waxes
Meat, fish or crustaceans, molluscs or
other aquatic invertebrates; 8,373 15,397 85 23,855
preparations thereof
Sugars and sugar confectionery 908 266 312 1,486
Cocoa and cocoa preparations 391 5 5 401
Preparations of cereals, flour, starch or
669,785 25,278 55 695,119
milk; pastrycooks' products
Page | 11Christchurch Total
Christchurch
Seaport Timaru Canterbury
Airport
(Lyttelton) Ports
Preparations of vegetables, fruit, nuts
88,167 447 3,549 92,163
or other parts of plants
Miscellaneous edible preparations 19,088 3,904 2,529 25,521
Beverages, spirits and vinegar 27,089 1,638 6,576 35,304
Food industries, residues and wastes
29,552 1,018 4,790 35,360
thereof; prepared animal fodder
Tobacco and manufactured tobacco
1,441 14 … 1,455
substitutes
Raw hides and skins (other than
26,780 3,646 9,734 40,160
furskins) and leather
Articles of leather; saddlery and
harness; travel goods, handbags and
687 7,489 … 8,176
similar containers; articles of animal
gut (other than silk-worm gut)
Furskins and artificial fur;
22,796 2,688 … 25,484
manufactures thereof
Wood and articles of wood; wood
218,485 167 90,339 308,992
charcoal
Cork and articles of cork … 17 … 17
Manufactures of straw, esparto or
other plaiting materials; basketware 57 182 … 239
and wickerwork
Pulp of wood or other fibrous
cellulosic material; recovered (waste 16,187 … 111 16,297
and scrap) paper or paperboard
Paper and paperboard; articles of
609 2,376 20 3,005
paper pulp, of paper or paperboard
Silk 0 11 … 11
Wool, fine or coarse animal hair;
297,709 743 18,391 316,843
horsehair yarn and woven fabric
Cotton 14 62 … 76
Vegetable textile fibres; paper yarn
0 22 … 22
and woven fabrics of paper yarn
Source: Statistics New Zealand (2020b).
Page | 12Chapter 3
Economic Indicators for the Canterbury Food and Fibre Sector
3.1 Introduction
This chapter presents a wider set of statistical indicators to describe the Food and Fibre Sector in the
Canterbury economy. This includes the contribution to Canterbury’s Gross Domestic Product (GDP),
including the contribution of inputs into the sector. The chapter also presents Census data on the
sector’s employment and income, before a final section describing land use in the region.
3.2 Contribution to Gross Domestic Product
Gross Domestic Product (GDP) is a statistical indicator of the size of a regional or national economy.
Statistics New Zealand estimates Gross Domestic Product (GDP) by region and by sector. Table 3.1 uses
those estimates to present GDP for the Canterbury region between 2012 and 2017, analysed by
industry.
In 2017, the agricultural sector contributed $2 billion to Canterbury’s regional GDP, which was 6 per
cent. Forestry, fishing and mining contributed a further $516 million (2 per cent). Primary
manufacturing contributed $2.2 billion (a further 6 per cent).
Table 3.1 also shows that between 2012 and 2017, Canterbury’s agricultural sector grew by 4 per cent.
Fishing, forestry, and mining grew by 15 per cent from a much smaller base. Primary manufacturing,
grew by 16 per cent.
To evaluate the total economic impact of the Food and Fibre sector in Canterbury, it is important to
recognise that the production and processing industries require inputs from other parts of the
economy (specialist transport such as milk tankers or livestock carriers, for example). Further, people
employed in production, processing or supporting industries use their income to purchase goods and
services more generally.
Economists therefore use multiplier analysis to calculate three types of impacts from a major sector
like Food and Fibre production and processing.
1. Direct impact – this is the economic value of the Food and Fibre production and
processing sectors.
2. Indirect impact – this is the economic value of the goods and services supplied by other
industries as inputs into the Food and Fibre sector.
3. Induced impact – this is the flow on impact of the above two contributions on further
household spending, which generates revenue as a result of increased purchases of
household goods and services.
Page | 13Table 3.1 Gross Domestic Product by Industry, Canterbury, $million, Years Ending March, 2012–
2017
Sector 2012 2013 2014 2015 2016 2017
Agriculture 1,939 1,698 2,510 1,495 1,366 2,006
Fishing, forestry, and mining 448 397 400 471 474 516
Electricity, gas, water, and waste services 704 838 976 1,013 1,047 1,031
Primary manufacturing 1,889 1,880 1,947 2,279 2,611 2,199
Other manufacturing 1,367 1,369 1,323 1,436 1,480 1,525
Construction 1,849 2,320 2,750 3,176 3,311 3,140
Wholesale trade 1,216 1,173 1,357 1,490 1,578 1,596
Retail trade 1,191 1,297 1,441 1,492 1,524 1,608
Accommodation 199 191 174 185 237 244
Food and beverage services 341 373 391 438 465 489
Transport, postal, and warehousing 1,232 1,329 1,397 1,611 1,722 1,709
Financial and insurance services 797 880 997 1,058 931 846
Rental, hiring, and real estate services 1,900 1,938 2,209 2,257 2,303 2,429
Owner-occupied property operation 1,813 2,016 2,240 2,421 2,388 2,325
Professional, scientific, and technical services 1,821 1,986 2,209 2,384 2,508 2,672
Administrative and support services 472 486 486 534 538 519
Public administration, defence, and safety 853 849 871 923 1,002 1,037
Education and training 1,166 1,173 1,219 1,277 1,311 1,396
Health care and social assistance 1,722 1,768 1,864 1,894 2,036 2,099
Information media and telecommunications
1,328 1,354 1,350 1,407 1,424 1,513
and other services
GST on production, import duties, and other
2,221 2,351 2,544 2,672 2,807 2,941
taxes
Gross Domestic Product 26,468 27,666 30,654 31,911 33,062 33,843
Notes: Figures may not sum to totals due to rounding. Canterbury includes Chatham Islands.
Source: Statistics New Zealand (2020c).
Geoff Butcher (2013) has calculated multipliers for this purpose, using data published by Statistics New
Zealand in their 2012-13 Input-Output tables. Regional GDP data does not analyse the contribution
from agriculture shown in Table 3.1 by agricultural industries. The research team therefore used
percentage shares from the national Input-Output tables and applied these to obtain regional
estimates.
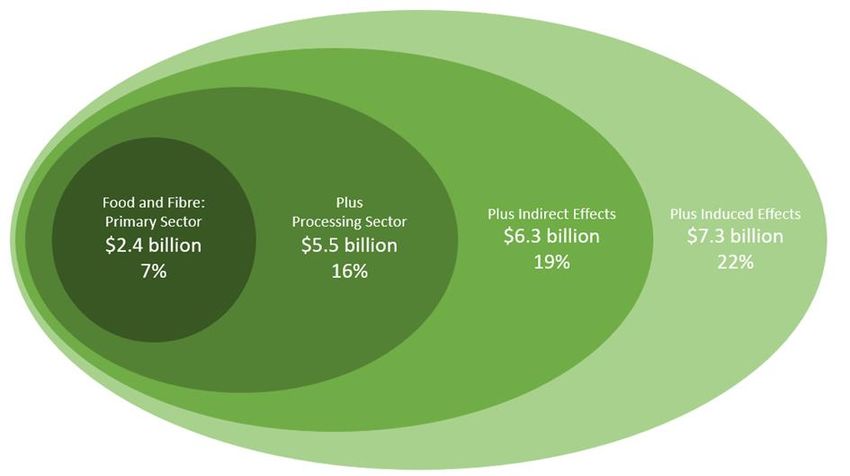
Page | 14Figure 3.1 shows the importance of the Food and Fibre sector for the regional economy including the
direct, indirect and induced effects. It begins by estimating the value added by the Food and Fibre
primary production sector, which were estimated at $2.4 billion, or 7 per cent of gross domestic
product (GDP).
It then includes the value added by the Food and Fibre processing industries, which were estimated at
a further $3.1 billion. This increases the contribution to $5.5 billion, or 16 per cent of regional GDP.
The indirect impact of the production and processing activities on the value added of other industries
was estimated to have been $860 million, which brings the total contribution to $6.3 billion, or 19 per
cent of GDP. This estimate indicates that for every $5 of value created in the Canterbury economy,
nearly $1 comes from direct and indirect impacts of the food and fibre sector.
Finally, the induced impact currently produced by the Food and Fibre sector was estimated to be a
further $981 million, so that the total impact is $7.3 billion, or 22 per cent of GDP. This last impact is
generally downplayed by economists, since the food and fibre sector disappeared, other forms of
economic activity would take its place, resulting in the same induced effects.
Figure 3.1 Contribution of the Food and Fibre Sector to Canterbury GDP, 2017
Source: AERU calculations, using multipliers provided in Butcher (2013).
Page | 153.3 Related Services
The previous section estimated the total indirect impacts of the Food and Fibre production and
processing sectors on other industries providing goods and services as inputs. This section provides
further analysis by industry, again using Geoff Butcher’s (2013) calculations. These provide for each of
the sectors the value and type of inputs and the associated number of employees.
Tables 3.2 and 3.3 present the results for the production and processing sectors respectively. The
greatest inputs into the production sector are fertiliser and pesticide manufacturing, especially for
pastoral farming. This is followed by banking and finance, then construction and then legal and
accountancy services for dairy. In the case of meat, it is road transport, banking and finances and then
basic material manufacturing.
The inputs into the other sectors are lower. For horticulture, these are polymer product and rubber
manufacturing, followed by fertiliser and pesticide manufacturing and then road transport. For
forestry, the greatest input is road transport; for fishing it is rental and hiring services and for other
livestock farming it is fertiliser and pesticide manufacturing.
The greatest inputs into the processing sector is road transport, especially for the meat and dairy
processing but also for fruit, oil cereals and other food product manufacturing and the wood
manufacturing sectors. In the meat processing sector rental and hiring services are also relatively
large. In dairy manufacturing it is polymer product and rubber product manufacturing.
3.4 Employment
This section reports on employment statistics from Census 2006 and Census 2013 which provides the
most recent population data for Canterbury to date. The release of regional data from the 2018 Census
is still in preparation.
Table 3.4 presents data for the Food and Fibre primary production and primary processing sectors,
using Statistics New Zealand data based on subdivisions in the ANZSIC06 industry classification system.
The table shows the numbers employed full-time and part-time, as self-reported in the 2006 and 2013
Censuses. Full-time employment in the sector is dominated by male employees, while there are more
female employees than male employees in part-time employment.
Employment in the primary production industries remained static between the two census dates,
changing from 18,768 in 2006 to 18,882 in 2013. There was a decline in the number of people
employed in the processing industries, from 16,332 to 13,815. Most of this decline was caused by
fewer jobs in textile, leather, clothing and footwear manufacturing.
Page | 16Table 3.2 Related Services to the Food and Fibre Production Industry, Canterbury, $000, 2013
Agriculture,
Poultry, deer,
Horticulture Sheep, beef forestry, and
Dairy cattle and other Forestry and Fishing and
Industry and fruit cattle, and fishing
farming livestock logging aquaculture
growing grain farming support
farming
services
Fertiliser and pesticide manufacturing 9,078 59,576 60,643 6,303 341 0 486
Polymer product and rubber product manufacturing 11,046 3,837 5,349 883 130 827 116
Electricity generation and on-selling 1,258 5,718 15,537 2,085 162 385 862
Construction services 2,719 15,112 31,526 2,706 1,495 2,487 3,672
Basic material wholesaling 3,601 19,355 24,690 2,910 670 1,277 953
Machinery and equipment wholesaling 2,876 7,809 17,150 2,843 1,909 2,935 4,272
Grocery, liquor, and tobacco product wholesaling 3,376 7,227 12,829 1,927 1,032 2,049 918
Other goods and commission based wholesaling 2,832 15,344 23,204 3,417 457 1,817 915
Road transport 6,309 23,871 12,554 5,403 24,763 1,744 4,393
Transport support services 1,299 2,320 2,434 534 6,817 3,957 583
Banking and financing 4,289 22,096 33,048 3,201 1,557 802 1,647
Health and general insurance 2,121 8,237 9,577 2,035 0 866 2,666
Rental and hiring services; non-financial asset leasing 3,874 18,631 7,820 1,525 1,334 12,043 7,867
Non-residential property operation 7,547 18,705 24,470 4,111 6,487 687 2,308
Scientific, architectural, and engineering services 589 4,293 18,753 2,071 485 220 1,356
Legal and accounting services 3,084 15,775 28,202 2,511 1,123 1,259 2,702
Veterinary and other professional services 650 3,099 7,838 1,070 66 209 818
Employment and other administrative services 5,847 2,250 7,588 1,554 763 404 1,244
Building cleaning, pest control, and other support services 9,394 16,487 24,251 3,164 175 185 5,698
Repair and maintenance 2,234 6,073 9,468 2,238 1,236 6,543 7,327
Source: AERU calculations, using multipliers provided in Butcher (2013).Table 3.3 Related Services to the Food and Fibre Processing Industry, Canterbury, $000, 2013
Fruit, Textile,
Meat and Beverage Pulp and
Dairy cereal, and Leather, Wood
meat and tobacco paper
Seafood product other food Clothing & product
Industry product product product
processing manu- product Footwear manu-
manu- manu- manu-
facturing manu- manu- facturing
facturing facturing facturing
facturing facturing
Fertiliser and pesticide manufacturing 1,924 227 394 1,537 478 385 379 131
Polymer product and rubber product manufacturing 12,836 1,729 37,304 9,765 8,327 2,641 4,340 1,441
Electricity generation and on-selling 9,627 1,745 9,173 5,155 646 1,238 4,567 7,392
Construction services 6,748 3,074 2,465 5,743 2,349 890 4,353 891
Basic material wholesaling 4,977 2,670 3,737 7,163 1,875 5,357 7,695 2,709
Machinery and equipment wholesaling 17,042 5,729 3,792 12,017 3,387 5,001 10,042 3,618
Grocery, liquor, and tobacco product wholesaling 10,576 3,214 9,183 10,649 2,902 3,503 4,541 2,298
Other goods and commission based wholesaling 5,128 3,420 3,411 10,944 2,173 6,712 4,132 3,744
Road transport 57,306 4,331 57,686 32,052 4,322 7,898 18,179 6,276
Transport support services 17,133 1,525 8,956 4,428 787 1,886 8,017 2,525
Banking and financing; financial asset investing 3,775 1,259 5,589 2,844 1,179 1,500 1,872 527
Health and general insurance 4,888 1,585 1,180 2,045 886 1,191 2,146 1,706
Rental and hiring services; non-financial asset leasing 51,985 10,729 12,157 6,849 3,440 1,538 2,081 473
Non-residential property operation 7,942 2,155 5,270 10,414 3,388 5,088 3,206 347
Scientific, architectural, and engineering services 7,105 230 6,669 1,561 901 736 1,413 868
Legal and accounting services 6,600 878 1,017 1,735 1,255 1,855 2,325 827
Veterinary and other professional services 673 218 632 616 197 451 243 126
Employment and other administrative services 3,584 845 9,053 2,982 2,797 2,462 3,181 673
Building cleaning, pest control, and other support services 7,909 968 5,155 1,748 1,340 509 1,295 112
Repair and maintenance 8,092 4,334 2,774 3,478 1,236 1,071 4,707 1,322
Source: AERU calculations, using multipliers provided in Butcher (2013).Table 3.4 Employment in the Food and Fibre Sector, Canterbury, 2006 and 2013
Male Female Total
FULL-TIME EMPLOYMENT 2006 2013 2006 2013 2006 2013
Agriculture 8,673 9,030 3,252 3,255 11,928 12,285
Aquaculture 75 81 18 21 96 102
Forestry and logging 279 255 48 57 324 309
Fishing, hunting and trapping 225 165 75 36 300 198
Agriculture, forestry and fishing support services 1,743 1,548 375 342 2,118 1,893
TOTAL PRIMARY PRODUCTION 10,995 11,079 3,768 3,711 14,766 14,787
Food product manufacturing 5,844 5,391 2,613 2,655 8,457 8,046
Beverage and tobacco product manufacturing 294 318 102 120 399 438
Textile, leather, clothing and footwear manufacturing 1,518 723 1,710 840 3,225 1,560
Wood product manufacturing 1,656 1,536 240 228 1,896 1,761
Pulp, paper and converted paper product manufacturing 309 285 60 63 369 351
TOTAL PRIMARY PROCESSING 9,621 8,253 4,725 3,906 14,346 12,156
TOTALS 20,616 19,332 8,493 7,617 29,112 26,943
PART-TIME EMPLOYMENT
Agriculture 1,215 1,335 2,214 2,253 3,429 3,588
Aquaculture 18 12 9 6 27 15
Forestry and logging 36 27 33 27 66 54
Fishing, hunting and trapping 30 24 27 18 57 42
Agriculture, forestry and fishing support services 168 168 264 234 435 399
TOTAL PRIMARY PRODUCTION 1,467 1,566 2,547 2,538 4,014 4,098
Food product manufacturing 369 357 723 672 1,092 1,032
Beverage and tobacco product manufacturing 27 39 60 63 90 99
Textile, leather, clothing and footwear manufacturing 93 48 429 270 522 315
Wood product manufacturing 105 78 144 105 249 180
Pulp, paper and converted paper product manufacturing 12 9 30 15 42 24
TOTAL PRIMARY PROCESSING 606 531 1,386 1,125 1,995 1,650
TOTALS 2,073 2,097 3,933 3,663 6,009 5,748Table 3.4 (Continued) Employment in the Food and Fibre Sector, Canterbury, 2006 and 2013
Male Female Total
TOTAL EMPLOYMENT 2006 2013 2006 2013 2006 2013
Agriculture 9,891 10,365 5,463 5,508 15,354 15,870
Aquaculture 96 90 27 27 120 117
Forestry and logging 312 279 78 84 390 363
Fishing, hunting and trapping 258 186 99 54 354 240
Agriculture, forestry and fishing support services 1,911 1,713 639 579 2,550 2,292
TOTAL PRIMARY PRODUCTION 12,468 12,633 6,306 6,252 18,768 18,882
Food product manufacturing 6,213 5,748 3,336 3,330 9,549 9,078
Beverage and tobacco product manufacturing 327 357 165 186 489 540
Textile, leather, clothing and footwear manufacturing 1,608 768 2,136 1,107 3,744 1,878
Wood product manufacturing 1,758 1,614 384 330 2,142 1,944
Pulp, paper and converted paper product manufacturing 321 294 90 81 408 375
TOTAL PRIMARY PROCESSING 10,227 8,781 6,111 5,034 16,332 13,815
TOTALS 22,695 21,414 12,417 11,286 35,100 32,697
Source: Statistics New Zealand Census Data.3.5 Income
In 2018, 22,287 people were receiving either wages/salaries or earnings from self-employment in the
agriculture, forestry, and fishing sector with a median earning of $36,960 (see Table 3.5). This was
16,053 earning wages/salaries and 6,234 self-employed in the agriculture, forestry, and fishing sector
in 2018.
The median earnings for wages/salaries in 2018 was $36,960 while the median earnings through self-
employment was $48,000. Comparing earnings from 2010 to those in 2018, the total median earning
increased by 47 per cent in the agriculture, forestry, and fishing sector. In more detail, the median
wages/ salaries increased by 36 per cent and the median earning through self-employment increased
by 72 per cent over that period.
Table 3.5 Main Earnings Source in Agriculture, Forestry, and Fishing, Canterbury, $ per Year,
Year Ending March, 2010–2018
Total earnings Wages and salaries Self-employment
Year Count of Median Count of Median Count of Median
People Earnings People Earnings People Earnings
2018 22,287 36,960 16,053 32,400 6,234 48,000
2017 21,810 34,750 15,270 31,950 6,540 41,660
2016 21,378 33,430 14,781 32,250 6,594 36,660
2015 21,834 34,180 14,730 31,270 7,104 41,440
2014 21,852 34,450 14,262 29,480 7,590 46,260
2013 21,315 32,340 13,809 28,840 7,506 41,800
2012 21,237 32,130 13,386 27,430 7,851 43,470
2011 21,108 28,470 13,380 25,130 7,728 35,960
2010 20,913 25,150 13,248 23,890 7,662 27,870
Source: Statistics New Zealand (2019a).
3.6 Land Use
This section outlines agriculture and land use statistics in Canterbury. Where appropriate, it compares
regional data with New Zealand data, drawing on the Agricultural Production Census in 2012 and 2017.
It is noted that this census data excludes New Zealand’s conservation estate. The following subsections
focus on agriculture, forestry and viticulture.
Page | 213.6.1 Agriculture
Table 3.6 shows that in 2016, the total agricultural area in Canterbury was 2,595,880 hectares, which
is a decline of 18 per cent between 2010 and 2016. In 2016, 66 per cent of agricultural land use was
sheep and beef and 16 per cent for dairy farming. Between 2010 and 2016 the area used for dairy
farming more than doubled (+155 per cent), while the area used for sheep and beef dropped by almost
a third. Grain growing also increased by 57 per cent over the period with other land uses falling.
Table 3.6 Agricultural Area by Usage (Hectares), Canterbury, Year Ending June, 2002–2016
% Change
2002 2007 2012 2016
2010 - 2016
Dairy 164,570 226,825 347,164 419,078 155%
Sheep and Beef 2,551,503 2,349,426 1,946,946 1,723,270 -32%
Other Livestock 134,148 135,390 104,730 111,710 -17%
Forestry 115,556 134,039 129,815 94,453 -18%
Fruit and berry 7,418 8,606 8,686 5,380 -27%
Vegetable growing 35,280 26,963 25,562 24,596 -30%
Grain growing 137,723 194,363 228,887 216,344 57%
Other 4,693 4,649 0 1,049 -78%
Total 3,150,891 3,080,261 2,791,790 2,595,880 -18%
Source: Statistics New Zealand (2019b).
Table 3.7 Irrigated Land, Canterbury and New Zealand (Hectares), Year Ending June, 2012 and
2017
Canterbury New Zealand
2012 444,800 721,700
Total 2017 478,100 746,700
% change 7.5 3.5
2012 47,900 94,500
Flood systems 2017 14,900 39,300
% change -69.0 -58.4
2012 392,100 579,500
Spray systems 2017 453,100 643,700
% change 15.5 11.1
2012 5,000 45,900
Micro systems 2017 8,300 57,100
% change 66.3 24.4
Source: Statistics New Zealand (2018).
Page | 22Table 3.7 shows a summary of irrigated land in Canterbury and New Zealand. This shows that
Canterbury accounts for a large percentage of irrigated are in New Zealand. The highest proportion of
land is irrigated by spray systems, accounting 95 per cent, followed by 3 per cent irrigated by flood
systems. Table 3.7 also shows the increase in spray irrigation as in 2012, it was 88 per cent irrigated by
spray systems and 11 per cent irrigated by flood systems.
Livestock numbers by type in Canterbury and New Zealand are given in Table 3.8. In 2018, sheep, dairy
cattle and beef cattle were the main livestock in Canterbury. This also shows that Canterbury accounts
for 21 per cent of New Zealand’s dairy cattle, 16 per cent of sheep and 14 per cent of beef cattle in
New Zealand. Between 2008 and 2018 most livestock numbers in Canterbury dropped, especially
sheep and lambs dropping by 27 and 38 per cent. In contrast, the number of dairy cattle increased by
60 per cent.
Table 3.8 Livestock Numbers in Canterbury and New Zealand, Year Ending June, 2008 and 2018
Canterbury New Zealand
2008 2018 % change 2008 2018 % change
Beef cattle 533,665 512,260 -4.0% 4,136,872 3,721,262 -10.0%
Dairy cattle 831,666 1,326,513 59.5% 5,578,440 6,385,541 14.5%
Sheep 6,063,300 4,423,195 -27.0% 34,087,864 27,295,749 -19.9%
Lambs 5,256,713 3,280,699 -37.6% 31,020,153 24,707,163 -20.4%
Deer 340,882 253,162 -25.7% 1,223,324 851,424 -30.4%
Pigs 177,306 185,924 4.9% 324,594 287,051 -11.6%
Horses 11,755 6,704 -43.0% 62,511 40,525 -35.2%
Source: Statistics New Zealand (2019d).
Tables 3.9 and 3.10 give an analysis of the dairy cattle herds and their production in Canterbury and
New Zealand for 2017/18. Table 3.9 shows that 37 per cent of the dairy herds in the South Island were
in Canterbury. The average herd size in Canterbury was 797 cows which was significantly higher than
the national average of 431 cows. In 2017/18 the average farm size was 232 effective hectares in
Canterbury. This was higher than the average farm size of 214 effective hectares in the South Island
and the average farm size of 151 effective hectares for all of New Zealand.
Table 3.9 Herd Size in Canterbury, South Island and New Zealand, 2017/18
North South Total
South Island New Zealand
Canterbury Canterbury Canterbury
No of herds 874 317 1191 3213 11590
Total cows 701,464 250,899 952,363 2,040,692 4,992,914
Total effective hectares 204,227 72,931 277,158 688,610 1,755,148
Average herd size 803 791 797 635 431
Average effective hectare 234 230 232 214 151
Average cows per hectare 3.43 3.44 3.435 2.96 2.84
Source: LIC and DairyNZ (2018).
Page | 23Table 3.10 analyses dairy production in Canterbury and New Zealand in 2017/18. On almost all
measures, dairy productivity in Canterbury was higher than in the South Island and in New Zealand. In
2017/18 in Canterbury 388 million kilo milksolids were produced which is 17 per cent of total kg
milksolids produced nationally. In the same year, the average kg milksolids per cow was 403kg in
Canterbury and the average milksolids production per hectare was 1,385 kg.
Table 3.10 Dairy Production in Canterbury and New Zealand, 2017/18
North South Total
South Island New Zealand
Canterbury Canterbury Canterbury
Total kg milksolids
289,940,204 98,477,041 388,417,245 809,884,624 1,839,714,208
Average litres per
herd 3,754,732 3,485,163 3,619,948 2,825,382 1,788,051
Average kg milkfat
per herd 184,746 173,059 178,903 140,739 89,320
Average kg protein
per herd 146,993 137,594 142,294 111,326 69,413
Average kg milksolids
per herd 331,739 310,653 321,196 252,065 158,733
Average kg milkfat
per effective ha 791 752 771.5 657 590
Average kg protein
per effective ha 629 598 613.5 519 458
Average kg milksolids
per effective ha 1,420 1,350 1,385 1,176 1,048
Average kg milkfat
per cow 230 219 224.5 222 207
Average kg protein
per cow 183 174 178.5 175 161
Average kg milksolids
per cow 413 392 402.5 397 368
Source: LIC and DairyNZ (2018).
Table 3.11 shows the production of selected fruit and vegetables in Canterbury and New Zealand in
2007 and 2017. The table shows that in 2017, the largest area was potatoes (4,332 hectares), followed
by wine grapes (1,769 hectares). For most categories the production area in Canterbury increased
whereas it decreased in New Zealand showing the growing importance of Canterbury to the
horticultural sector with exception of the area under grapes and olives.
Page | 24Table 3.11 Horticultural Production in Canterbury and New Zealand (Hectares), Year Ending June,
2007 and 2017
Canterbury New Zealand
% %
2007 2017 change 2007 2017 change
Apples 249 312 25% 9,247 8,615 -7%
Wine grapes 1,683 1,769 5% 29,616 33,981 15%
Olives 437 133 -70% 2,173 921 -58%
Onions 686 1,001 46% 4,594 6,009 31%
Potatoes 4,273 4,332 1% 10,050 9,450 -6%
Squash .. 87 7774 5,794 -25%
Source: Statistics New Zealand (2018).
There are a range of arable crops produced in the Canterbury region as shown in Table 3.12.
Canterbury is by far the most important region in New Zealand for arable crops accounting for in 2017
87 per cent of wheat production and 66 per cent of barley production.
Table 3.12 Arable Crops in Canterbury and New Zealand (Tonnes and Hectares), Year Ending June,
2007 and 2017
Canterbury New Zealand
2007 302,129 344,434
Tonnes 2017 347,300 405,200
% change 15% 18%
Wheat
2007 35,301 40,538
Hectares 2017 34,900 41,100
% change -1.1% 1.4%
2007 248,587 335,627
Tonnes 2017 196,300 297,600
% change -21.0% -11.3%
Barley
2007 36,869 51,481
Hectares 2017 26,600 42,000
% change -27.9% -18.4%
2007 5,410 185,627
Tonnes 2017 4,500 175,600
% change -0.2 -0.1
Maize grain
2007 432 17,030
Hectares 2017 400 17,500
% change -0.1 0.0
Source: Statistics New Zealand (2018).
Page | 25You can also read