TOWARD UNIVERSAL BROADBAND ACCESS IN NEW ZEALAND - CASE STUDY - Sean Mosby & Jerome Purre - ITU
←
→
Page content transcription
If your browser does not render page correctly, please read the page content below
CASE STUDY

     TOWARD UNIVERSAL BROADBAND
        ACCESS IN NEW ZEALAND

Sean Mosby & Jerome Purre
Mikan Consulting Limited
November 2010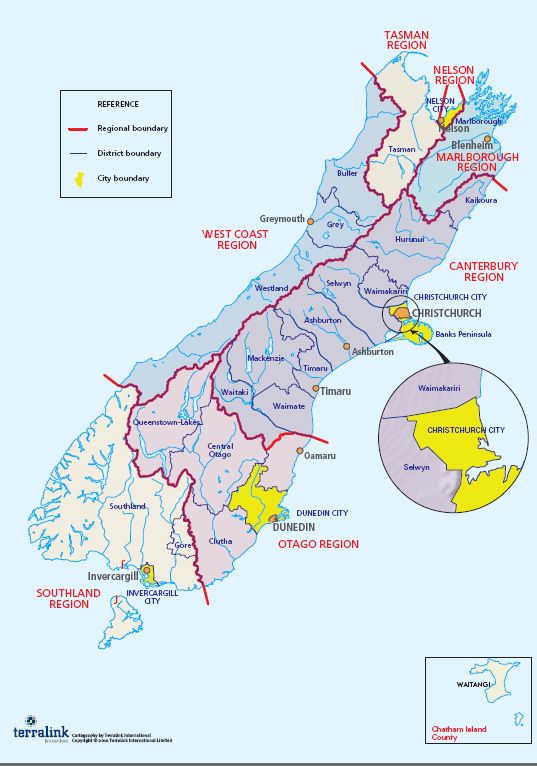
2

Acknowledgements
The authors would like to thank the staff and management at the New Zealand Ministry of
Economic Development for their assistance in preparing this report, and Osmond Borthwick
for assistance and advice drawn from his exhaustive knowledge of New Zealand
telecommunications regulation.

We would especially like to thank the ITU Regional Office for Asia and the Pacific in Bangkok
for their sponsorship of this report and their assistance and insightful comments through the
drafting process.

Finally, we would like to note the authoritative work of the New Zealand Commerce
Commission in producing industry statistics and analyses, which have greatly assisted the
development of this report.

3

Contents
1     FOREWORD............................................................................................................................ 7
2     EXECUTIVE SUMMARY ......................................................................................................... 9
    2.1       Developments in New Zealand’s Telecommunications Policy ...................................... 9
    2.2       The Ultra-fast Broadband Initiative ...............................................................................10
    2.3       The Rural Broadband Initiative......................................................................................10
    2.4       Complementary Measures and Demand Side Initiatives ..............................................10
3     INTRODUCTION ....................................................................................................................11
4     THE HISTORY OF NEW ZEALAND TELECOMMUNICATIONS POLICY .........................14
    4.1       Overview .........................................................................................................................14
    4.2       Building the National Network ......................................................................................14
    4.3       The Era of Deregulation .................................................................................................14
      4.3.1      Corporatisation and privatisation .............................................................................. 15
      4.3.2          Deregulation and competition ............................................................................... 15
      4.3.3          The Commerce Act 1986 ......................................................................................... 15
    4.4       Telecommunications Reform in New Zealand ..............................................................16
      4.4.1      The Fletcher Inquiry ...................................................................................................16
      4.4.2          As much market as possible, as much Government as necessary.........................16
    4.5       The Path to Further Telecommunications Reform ....................................................... 17
      4.5.1      Unbundling the local loop ..........................................................................................18
      4.5.2          The new telecommunications regulatory regime ..................................................18
    4.6       Fibre and the 2008 General Elections ............................................................................19
5     NEW ZEALAND’S TELECOMMUNICATIONS INDUSTRY IN 2010................................... 20
    5.1       Key Industry Facts & Figures ......................................................................................... 20
      5.1.1      Technical statistics ..................................................................................................... 20
      5.1.2      Telecommunications industry revenues .................................................................... 21
    5.2       New Zealand’s Key Telecommunications Networks .................................................... 22
    5.3       Key market trends.......................................................................................................... 24
6     MOTIVATIONS FOR CHANGE............................................................................................ 25
7     THE NEW ZEALAND REGULATORY REGIME................................................................... 26
    7.1       The Regulatory Regime.................................................................................................. 26
      7.1.1      Access regulation ....................................................................................................... 26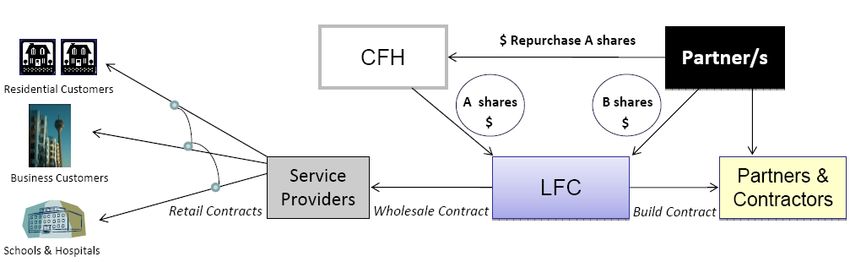
4

       7.1.2       Operational separation .............................................................................................. 28
       7.1.3       PSTN migration and FTTN investment .................................................................... 30
       7.1.4       The success of the 2006 reforms................................................................................. 31
     7.2        The Shortfalls of the Regulatory Approach ...................................................................33
       7.2.1       Increasing public aspirations......................................................................................33
       7.2.2           Difficulties in implementing operational separation............................................ 34
       7.2.3           The “Digital Divide” ............................................................................................... 35
8      UNIVERSAL SERVICE OBLIGATIONS AND RURAL BROADBAND POLICY................... 36
     8.1        Introduction ................................................................................................................... 36
     8.2        Origins – the Kiwishare and Privatisation of TelecomNZ............................................ 36
       8.2.1       Standard Residential Telephone Service Obligations .............................................. 36
     8.3        Establishment of the Local Service Telecommunications Service Obligation ............ 37
       8.3.1       The Fletcher Inquiry .................................................................................................. 37
       8.3.2           Establishment of the Local Service TSO Deed...................................................... 38
       8.3.3           A statutory framework for the Telecommunications Service Obligations .......... 38
     8.4        A Decade of Contention ................................................................................................ 39
       8.4.1       Calculating the cost of universal service ................................................................... 39
       8.4.2           Legal challenges...................................................................................................... 40
     8.5        The Rise of Rural Broadband......................................................................................... 40
       8.5.1       Project PROBE............................................................................................................ 40
       8.5.2           The Digital Strategy.................................................................................................41
     8.6        Contestability and a Broadband TSO?...........................................................................41
     8.7        Broadband Ascendency Affirmed.................................................................................. 42
9      INTRODUCTION TO THE UFB, RBI AND COMPLEMENTARY MEASURES................... 44
     9.1        The Foundations of a National Ultra-fast Broadband Policy....................................... 44
       9.1.1       The New Zealand Institute Report ............................................................................ 44
     9.2        The Broadband Investment Fund ................................................................................. 45
     9.3        Urban and Rural Broadband Initiatives & Complementary Measures ........................ 45
       9.3.1       The Ultra-Fast Broadband Initiative ......................................................................... 45
       9.3.2           Reducing fibre deployment costs .......................................................................... 46
       9.3.3           The Rural Broadband Initiative ............................................................................. 46
10     THE ULTRA-FAST BROADBAND INITIATIVE ................................................................... 47
     10.1       The Origins of the UFB.................................................................................................. 47
       10.1.1          The reasons for ultra-fast broadband .................................................................... 48
5
10.2 UFB Cost Studies............................................................................................................ 49
10.3 The Castalia Report........................................................................................................ 50
10.4 The UFB Policy................................................................................................................ 51
10.4.1 Objectives and principles........................................................................................ 51
10.4.2 Defining the UFB.................................................................................................... 52
10.4.3 Crown Fibre Holdings ............................................................................................ 52
10.4.4 Competitive tender process ................................................................................... 53
10.5 The Initial Preferred UFB Model................................................................................... 54
10.5.1 Introduction ........................................................................................................... 54
10.5.2 ITP assessment criteria .......................................................................................... 54
10.5.3 UFB service level specifications ............................................................................. 55
10.5.4 Open access ............................................................................................................ 55
10.5.5 An innovative commercial model.......................................................................... 56
10.5.6 Restrictions on LFC involvement in retail services............................................... 58
10.5.7 The UFB regulatory framework ............................................................................. 58
10.6 Significant Proposals Emerge ........................................................................................ 58
10.7 Refinements to the UFB Concept.................................................................................. 59
10.7.1 Amendments to the UFB business model ............................................................. 59
10.7.2 Amendments to the UFB regulatory framework .................................................. 60
10.8 Structural Separation? ....................................................................................................61
10.9 Implementation ............................................................................................................. 62
11 THE RURAL BROADBAND INITIATIVE ............................................................................. 63
11.1 Introduction ................................................................................................................... 63
11.2 The Reasons for Rural Broadband Intervention ........................................................... 63
11.2.1 Economic importance of rural New Zealand ........................................................ 63
11.2.2 Current state of telecommunications in rural New Zealand................................ 64
11.3 A Dynamic Policy on Rural Broadband Emerges ......................................................... 65
11.3.1 Increased Government funding for rural broadband ........................................... 65
11.3.2 The Rural Broadband Initiative announced.......................................................... 65
11.4 The Rural Broadband Initiative Concept ...................................................................... 66
11.4.1 RBI objectives and priorities .................................................................................. 67
11.4.2 Scope of the RBI ..................................................................................................... 67
11.4.3 Open access requirements ..................................................................................... 67
11.4.4 Service standards and specifications ..................................................................... 686
11.4.5 Evaluation criteria .................................................................................................. 69
11.4.6 Funding................................................................................................................... 70
11.5 RBI Progress ................................................................................................................... 70
11.5.1 The response of industry........................................................................................ 70
11.5.2 The potential for mobile solutions highlighted by respondents.......................... 70
11.5.3 Implementation of the RBI ..................................................................................... 71
12 COMPLEMENTARY MEASURES.......................................................................................... 72
12.1 Introduction ................................................................................................................... 72
12.1.1 Promoting services over fibre networks ................................................................ 73
12.1.2 Greenfields developments...................................................................................... 75
12.1.3 In-house wiring ...................................................................................................... 75
12.1.4 Infrastructure deployment standards.................................................................... 75
12.1.5 Infrastructure sharing and access.......................................................................... 76
13 CONCLUDING COMMENTS................................................................................................ 78
14 GLOSSARY OF TERMS ......................................................................................................... 80
15 BIBLIOGRAPHY .................................................................................................................... 82
ANNEX 1: UFB CANDIDATE AREAS ........................................................................................... 84
ANNEX 2: STATISTICS – AVERAGE REVENUE PER USER TRENDS ........................................ 857 1 FOREWORD Over the past twenty five years, the policy environment for telecommunications in New Zealand has been characterised by innovative approaches to solving traditional policy problems. In broad terms, the New Zealand experience is comparable to a wide range of countries which have moved from traditional government owned monopolies to a more diverse competitive environment. However, there are also a number of distinct features. New Zealand liberalised its market at an early stage. It persisted with regulation by generic competition law for a long period during the 1990s, supported by a highly targeted price control regime on local access prices. When the pendulum swung back to greater regulation, New Zealand adopted a model of operational separation that was relatively untested internationally at that time. As with other jurisdictions, New Zealand’s policy has been driven by successive governments’ concern with supporting investment to drive efficiency and innovation in the telecommunications industry, flowing through to the broader economy. Increasingly, this has been seen as beneficial not only to direct consumers, and particularly to businesses, but also in fields such as health and education. Broadband is seen as an enabling tool for greater productivity, and for the delivery of innovative services not merely to consumers, but also to pupils, patients and citizens, among others. Competition policy has been at the centre of the telecommunications reforms over the past decade. New entrants have been able to secure significant market share from the incumbent, Telecom New Zealand (TelecomNZ). Extensive competing infrastructure has been rolled out through backhaul, mobile and, in some cities, cable networks. Generally competition has been seen as a successful driver of broadband growth, which has been among the highest in the OECD in recent years. New Zealand has also sought to spread the benefits of innovation and productivity beyond the major urban centres that have been the early beneficiaries of competition. There has been a series of government funding initiatives which have supported greater availability of broadband services for rural and regional customers. The New Zealand Government’s Ultra Fast Broadband (UFB) initiative and other linked initiatives follow the recent trend of direct government intervention in the telecommunications industry to secure investment that is perceived to be critical to national objectives. The previous Labour government had secured TelecomNZ’s commitment to build a fibre-to-the-node network, which is expected to be completed in 2011. The UFB initiative is designed to fund, in cooperation with private investors, a fibre-to-the- home network to 75% of New Zealand’s population1. 1 The goal for ultra-fast broadband investment is to accelerate the roll-out of ultra-fast broadband to 75 percent of New Zealanders, concentrating in the first six years on priority broadband users such as
8

The initiative contains a number of innovative elements that will be relevant to other
jurisdictions looking for opportunities to stimulate additional investment in
telecommunications infrastructure:

   •   it is a public-private partnership. At a time of budgetary restraint, it is not purely
       reliant on government funding;

   •   it allows for a staggered network build, initially focusing on business customers, and
       schools and hospitals, and then moving onto connecting residential customers;

   •   it is supported by complementary initiatives which address supply of improved
       broadband services to underserved regions;

   •   the financial structure of the Government funding means that the Government
       assumes a significant proportion of the demand risk;

   •   the financial structure also allows funds to be recycled as the private investors build up
       their investment in the network; and

   •   finally, the investment is structured to avoid the traditional incentive problems in
       telecommunications, as the recipients of the funding for network build are barred from
       involvement in retail services.

The UFB initiative is at an early stage, but it provides a model of private public partnership
that may be attractive to both funding governments and private investors.

The Case Study that follows outlines the development of the New Zealand
telecommunications environment from market liberalisation to the present day, highlighting
the major controversies and initiatives that have shaped current policy. It then focuses on
current New Zealand government initiatives, with a particular emphasis on the UFB and
related initiatives. The lessons that are drawn from the experience by the authors will allow
policy makers to test the New Zealand model for alignment with their own policy processes
and objectives.

                                                                          Osmond Borthwick
                                                      Formerly: Director, Telecommunications
                                                                                 (2007 to 2009)
                                                      New Zealand Commerce Commission

businesses, schools and health services, plus green field developments and certain tranches of
residential areas.
9
2 EXECUTIVE SUMMARY
New Zealand is currently embarking on a series of major telecommunications policy
initiatives, aimed at accelerating the rollout of ultra-fast broadband to its businesses, citizens
and social services institutions:
• the Ultra-fast Broadband (UFB) Initiative: a NZ$1.5 billion government investment
programme to establish public-private-partnerships for the construction of Fibre-to-
the-Premises (FTTP) access networks connecting 75% of New Zealanders;
• the Rural Broadband Initiative (RBI): a NZ$300 million government funding
programme to improve the availability of fibre backhaul links in less-urbanised parts of
New Zealand, and to provide the country’s schools with reliable, ultra-fast
connectivity; and
• the Complementary Measures Work Programme: a series of measures to streamline and
coordinate telecommunications infrastructure deployments and associated processes,
and to aggregate demand for enhanced broadband networks.
This case study traces the development of New Zealand’s telecommunications policy and
regulatory environment, explaining the key motivations behind the current policy direction,
and examines New Zealand’s approach to implementing these landmark initiatives.
2.1 Developments in New Zealand’s Telecommunications Policy
New Zealand was an early adopter in the 1980s and 90s of market liberalisation polices in the
telecommunications industry. The incumbent, Telecom New Zealand Limited (TelecomNZ),
was privatised in 1990 under a deregulatory policy framework.
Following a decade of reliance on general competition law to provide regulatory constraint,
the Labour Party Governments of the 2000s moved progressively to introduce a sector-specific
regulatory framework, with the establishment of an independent telecommunications
regulator in 2001 and the imposition of broader reforms, such as local loop unbundling and
operational separation, in 2006.
In parallel to the development of a regulatory framework aligned with international best
practice, governments over this period increasingly looked to intervene directly in
telecommunications sector development, through fiscal initiatives and infrastructure
development programmes.
Both the trend toward deeper regulatory intervention and the increased emphasis on fiscal
intervention to promote infrastructure deployment have been driven by—
• public and political dissatisfaction with the level of telecommunications industry
investment and, commensurately, the pace of sector development and innovation; and
• the increasing “digital divide” between the advanced services available in urban areas
and the generally lower quality services provided to rural New Zealand.10
These motivations can also be seen as underpinning the telecommunications policy direction
of the current Government in New Zealand.
2.2 The Ultra-fast Broadband Initiative
The Government’s overall objective for the UFB Initiative is:
“To accelerate the roll-out of ultra-fast broadband to 75 percent of New Zealanders2 over
ten years, concentrating in the first six years on priority broadband users such as businesses,
schools and health services, plus greenfield developments and certain tranches of residential
areas (UFB Objective).”
The UFB objective is supported by Government investment of up to NZ$1.5 billion, which is
expected to be directed toward public-private-partnerships that will construct FTTP access
networks and operate them according to a wholesale-only, open access model.
The initiative is currently under implementation, with a competitive commercial tender
programme being administered by a crown company, Crown Fibre Holdings (CFH). The initial
tender received a high degree of interest, with 18 respondents including two national
proposals from TelecomNZ and Axia Netmedia, and a co-ordinated response from a
consortium of regional electricity lines companies and smaller regional telecommunications
providers.
Notably, TelecomNZ has proposed an ownership separation of its network and retail
businesses as part of its response to the CFH tender.
2.3 The Rural Broadband Initiative
Complementing the UFB, which focuses on urbanised regions of New Zealand, the
Government has announced a NZ$300 million grant funding initiative to support the
deployment of fibre backhaul capacity in rural areas and subsidise the connection of rural
schools to ultra-fast broadband networks. Like the UFB, the RBI is being implemented
through a competitive commercial tender process and has received a substantial degree of
interest from the industry with 39 expressions of interest submitted, including proposals from
TelecomNZ, Axia Netmedia and Vodafone NZ.
2.4 Complementary Measures and Demand Side Initiatives
In support of the Government’s network deployment initiatives, a work programme has been
developed to:
• facilitate and streamline the processes for deployment of telecommunications
infrastructure and facilities;
• aggregate key centres of demand for ultra-fast broadband services; and
• develop a National Education Network to encourage and support the use of the UFB
and RBI networks across New Zealand schools.11 3 INTRODUCTION Even a casual glance at the world map shows that few countries on Earth have as great a tyranny of distance to overcome as New Zealand. New Zealand is a small country of little more than four million people at the bottom of the South Pacific. Most of New Zealand’s major markets – Europe, North America, East and South Asia – and the sources of its customers, migrants and investors, are ringed around the other edge of the world map. As a result, New Zealand has more to gain than most from telecommunications – through weightless exports and the rise of E-commerce; through working from home. So perhaps it should not be a surprise that New Zealand has often been an outlier in telecommunications policy. New Zealand was one of the world’s first countries to deregulate its telecommunications sector and privatise the Government-owned telecommunications network – deregulating as other countries developed industry-specific regulatory regimes. In 2006, it was nearly the last country in the OECD to unbundle the local loop. In the following year, it was amongst the leading countries in imposing an operational separation on its incumbent telecommunications operator. Now New Zealand is again leading the world with an ambitious Government funded national broadband network roll-out, and is contemplating the structural separation of the incumbent telecommunications operator. This paper examines these new developments: it looks at why the New Zealand Government has decided to drive the deployment of ultra-fast broadband and how it is going about it.
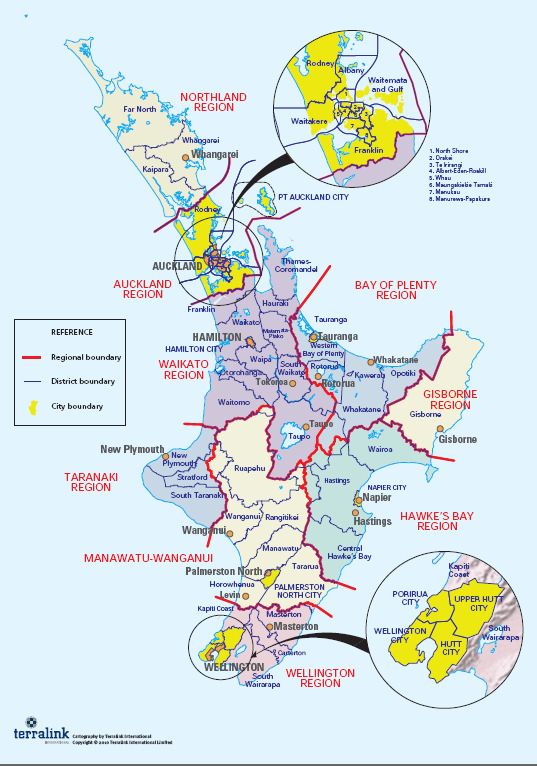
12

Figure 1: Regional Map of New Zealand2

2
  Sourced from Local Government New Zealand: Available at www.lgnz.co.nzco.nz An interactive map
identifying current infrastructure deployments and demand centres is also available at:
http://broadbandmap.govt.nz/map/
13
14

4 THE HISTORY OF NEW ZEALAND
  TELECOMMUNICATIONS POLICY
4.1 Overview
Over the last two decades, many of the major changes in New Zealand’s telecommunications
regulatory environment have been driven by changes in Government policy, rather than
intervention by the competition regulator. This has resulted in occasional periods of intense
reform in contrast to the evolutionary reform generally seen in regulator-driven environments.

The key policy interventions over the last two decades have been:

   •   the privatisation of the incumbent operator without the implementation of industry
       specific regulation;

   •   the introduction of limited industry-specific legislation in 2001;

   •   the introduction of broader industry-specific legislation to implement local loop
       unbundling and operational separation in 2006; and

   •   the introduction of the current Government programmes to accelerate the roll-out of
       fibre networks, including possible legislation to enable the structural separation of the
       incumbent telecommunications operator.

4.2 Building the National Network
As in most developed countries, New Zealand’s telecommunications network was built as a
state monopoly. From its origins in the late 1870s, the telephone network spread across the
country, built and operated by a Government department – the New Zealand Post Office.

By 1930, the country had 125,000 telephone subscribers, with all the main centres connected to
the national telephone network and, by 1965, the world’s third highest telephone density of 35
percent.

In 1984, a new Labour Party Government was elected with a mandate to adopt de-regulatory
reforms across the economy, including deregulation of the telecommunications sector and
priming the national telecommunications network for sale.

4.3 The Era of Deregulation
During the second half of the 1980s and into the 1990s, New Zealand implemented sweeping
reforms that transformed the economy into one of the world’s most open markets. Laissez
faire economics underpinned the economic approach of both major political parties and
15 dominated political debate. Privatisation and reliance on generic competition law was adopted across economic sectors, including the telecommunications industry. 4.3.1 Corporatisation and privatisation On 31 March 1987, Telecom New Zealand (TelecomNZ) was established as a Government- owned enterprise, purchasing telecommunications assets from the New Zealand Post Office for NZ$3.2 billion. After being operated for three years as a Government-owned enterprise, TelecomNZ was sold to US-based operators Bell Atlantic and Ameritech for NZ$4.25 billion. Consistent with the wider de-regulatory reforms occurring at the time, New Zealand did not adopt a licensing regime for telecommunications operators. This remains the case, with any person able to provide telecommunications services in New Zealand, subject to a few targeted restrictions, such as the requirement to provide lawful interception. 4.3.2 Deregulation and competition As noted above, Government telecommunications policy in the 1990s emphasised deregulation and a reliance on the generic competition legislation. Competition arose, with early entry into the tolls and business markets by the British Telecom-owned Clear Communications and the Australian telecommunications incumbent Telstra. Limited competition also eventuated in the residential market, with the locally-funded Saturn Communications rolling out a limited cable footprint in Wellington, and later Christchurch. 4.3.3 The Commerce Act 1986 Without telecommunications industry-specific legislation, new market entrants were forced to rely on provisions of the generic competition legislation – the Commerce Act 1986 – to obtain fair access to TelecomNZ’s network. However, this was widely regarded as ineffective. One long-running court case on PSTN interconnection between Clear Communications and TelecomNZ, for example, went as far as the Privy Council in London (then New Zealand’s highest Court) which approved the continued use of the Baumol-Willig rule for pricing interconnection in New Zealand.3 Some years later, the use of the Baumol-Willig pricing rule for interconnection was explicitly prohibited in the Telecommunications Act 2001 (see below), which instead introduced TSLRIC pricing. 3 Telecom Corporation of New Zealand v. Clear Communications [1995] 1 NZLR 385, 406. The Baumol- Willig rule, also known as the Efficient Components Pricing Rule, is a method for setting the charge for competitors to use the incumbent operator’s bottleneck facilities. In contrast to most approaches to pricing interconnection (which base the charge on direct costs), the Baumol-Willig rule starts from the revenue consequences for the incumbent of allowing competitors to use its facilities, setting the charge for interconnection on the basis of the resulting revenue loss. A good assessment of the Baumol-Willig rule can be found in Henry Ergas & George Ralph, Pricing Network Interconnection: is the Baumol-Willig Rule the Answer, 1996.
16

Reliance on generic competition law proved time-consuming, costly, and unsatisfactory for
promoting competition and driving network investment.4 By the end of the 1990s, New
Zealand’s trend of deregulation since 1987 was waning.

4.4 Telecommunications Reform in New Zealand
4.4.1 The Fletcher Inquiry
A new Labour Party5 Government was formed on 5 December 1999. The new Government
immediately indicated its interest in telecommunications industry reform by announcing a
Ministerial Inquiry into the telecommunications sector by Hugh Fletcher, a prominent New
Zealand businessman. The Fletcher Inquiry published its final report6 less than a year later on
27 September 2000, recommending major regulatory reform.

4.4.2 As much market as possible, as much Government as necessary
In May 2001, Communications Minister Paul Swain introduced the 2001 Telecommunications
Bill, the Government’s response to the Fletcher Inquiry.

While the Bill signalled the end to the era of self-regulation and reliance on generic
competition law, the new regulatory regime was still light-handed by international standards.
As Paul Swain put it in addressing Parliament, the Bill sought to provide “as much market as
possible and as much Government as necessary”.

The Bill introduced a new industry specific telecommunications regime with:

    •   the creation of a new position of Telecommunications Commissioner within the New
        Zealand Commerce Commission (the competition regulator) to administer the
        implementation of the Act;

    •   a set of designated (price and non-price term regulated) and specified (non-price term
        regulated) telecommunications services including:

            -   PSTN interconnection and number portability; and

            -   resale of the retail services TelecomNZ offered using its fixed
                telecommunications network.

4
  See, for example, the critique by Christopher Nicoll of New Zealand’s experiment with light-handed
regulation of telecommunications in the 1990s: Nicoll, Light-handed Regulation of Telecommunications-
-The Unfortunate Experiment, Information & Communications Technology Law, Volume 11, Issue 2, May
2002, pages 109-120.
5
  New Zealand politics has traditionally be dominated by the centre-left Labour party and the centre-
right National Party. The introduction of a proportional voting system (Mixed Member Proportional or
MMP) in 1996, to replace the First-Past-the-Post system strengthened the role of smaller parties.
However, the coalition Governments, since 1996, have continued to be led by either Labour or National.
6
  Ministerial Inquiry into Telecommunications – Final Report, 27 September 2000. The full proceedings
of the Inquiry, including its Final Report, are available at:
http://www.med.govt.nz/templates/StandardSummary____16318.aspx.
17
• a process to enable the Telecommunications Commissioner, acting in concert with two
other Commissioners, to make recommendations to the Minister for Communications
regarding the regulation of further telecommunications services, including (if
designated) the pricing principles that should be imposed;
• a process to allow the Telecommunications Commissioner, if requested, to resolve
disputes between parties relating to the supply of designated or specified services; and
• a framework (referred to as Telecommunications Service Obligations or TSOs) for
funding telecommunications services that were considered a social good by the
Government.
The purpose of the new Act was “to promote competition in telecommunications services
markets for the long-term benefit of end-users of telecommunications services in New
Zealand”7. The Government’s stated objective of “as much market as possible” was clearly
emphasised in the detail of the Bill, notably in the following features:
• unbundled copper local loop (UCLL) and unbundled bitstream services (UBS) were
not regulated. Instead, the Commission was required to investigate whether or not to
recommend regulation of these services to the Minister for Communications;
• the dispute resolution process administered by the Telecommunications
Commissioner was limited to bilateral resolution of disputed terms and was at the cost
of the parties to the dispute; and
• TelecomNZ received compensation from the industry for continuing to deliver
universal basic telephone service.
4.5 The Path to Further Telecommunications Reform
Contrary to general expectations, at the end of 2004, the Commission recommended against
the unbundling of TelecomNZ’s copper local loop network, recommending instead the
designation of a Layer 2 unbundled bitstream service (wholesaling of TelecomNZ’s ADSL) that
had been proposed by TelecomNZ during the Commission’s investigation.
The Commission’s recommendation surprised some observers, many of whom were expecting
New Zealand to follow international precedent. The Minister for Communications, Paul
Swain, and the Ministry for Economic Development (MED) advised that the Government ask
the Commission to reconsider its recommendation. Following representations from
TelecomNZ, however, the Government decided to accept the Commissioner’s
recommendation.
These representations were made in correspondence8 between TelecomNZ CEO, Theresa
Gattung, and the Government, which understood that, in return for a decision to not
unbundle the local loop, TelecomNZ would ensure that one third of all DSL connections
would be sold by other providers through wholesaling and resale.
7
Telecommunications Act 2001, section 18.
8
Letter from Theresa Gattung to Paul Swain, May 2004.18
As time passed, however, the Government concluded that TelecomNZ was not delivering on
these commitments. This was compounded by disagreement between the Government and
TelecomNZ over the exact commitments into which TelecomNZ had entered; for example,
TelecomNZ stated that they considered that their promise was for one third of new, rather
than all, DSL connections to be sold by other providers.
By 2005 the Government considered, in particular, that wholesale broadband subscriptions
were well below the number the Government considered Ms. Gattung had committed to in
2004. In late 2005, the Government commenced a “stocktake” of the telecommunications
industry.
In February 2006, Prime Minister Helen Clark told Parliament that New Zealand’s uptake of
broadband was unsatisfactory and that improving it was a top three priority for the
Government. The Government began to prepare significant reforms to the regulatory regime,
including local loop unbundling, to support the Government’s goal of lifting the country into
the top quarter of OECD broadband statistics.
The Government’s plans were to come sensationally to light little more than a month later on
3 May 2006.
4.5.1 Unbundling the local loop
On May 3rd, as the Government was considering the recommendations of the Minister for
Communications to unbundle the local loop along with a series of other regulatory reforms, a
Parliamentary messenger leaked a copy of the key Government paper to a TelecomNZ
employee. Due to the market-sensitivity of the policies, the Government was forced to
hurriedly announce the reforms that evening, abandoning its plan to the make them a
centrepiece of the 16 May Budget.
The extraordinary manner of the announcement, as much as its substance, generated
enormous public interest. Within weeks, “unbundling of the local loop” was common
currency and public support swelled behind the reforms. By the end of May, the Chairman of
TelecomNZ, Dr. Roderick Dean, had announced his resignation, followed just a few weeks
later by CEO Theresa Gattung.
4.5.2 The new telecommunications regulatory regime
On 22 December 2006, barely five years after the 2001 reforms, the Telecommunications
Amendment Bill 2006 was passed by Parliament. The Bill introduced an extended
telecommunications regulatory regime including:
• a raft of new regulated wholesale services aimed at implementing a “ladder of
investment” access regime;
• a new Standard Terms Determination process that empowered the Commission to set
industry wide ‘Standard Terms’ for regulated services;
• the operational and accounting separation of TelecomNZ into at least three separate
business units:19
- the access network business (later christened “Chorus”)9;
- TelecomNZ wholesale; and
- other business units (retail, mobile, etc);
• greatly expanded monitoring, enforcement and information disclosure powers.
Riding a wave of popular support, the Bill was enacted with the support of all bar two of the
Members of Parliament. Almost overnight, TelecomNZ went from being one of the developed
world’s most lightly regulated incumbents, to one of the most constrained.
4.6 Fibre and the 2008 General Elections
While the 2006 regulatory reforms appeared to deliver on many of the aspirations upon which
they were founded, by 2008 it was evident that the political debate had moved on.
When New Zealand voters went to the polls at the end of 2008, they faced two very different
visions of the future of broadband:
• the Labour Party offering a new Broadband Investment Fund, comprising grants of up
to NZ$325 million operating and NZ$15 million capital funding over five years focusing
on business and health users and under-served rural areas; and
• the National Party offering a $1.5 billion investment to roll-out fibre-to-the-premises
(FTTP) to 75% of New Zealand’s population within 10 years focusing in the first 6 years
on schools, hospitals and businesses.
The National Party victory led to a concentrated focus on a national ultra-fast broadband
network for New Zealand.
9
Chorus is similar to BT’s Openreach.20
5 NEW ZEALAND’S TELECOMMUNICATIONS
INDUSTRY IN 2010
The following section sets out a snapshot of the key aspects of New Zealand’s
telecommunications industry in 2010. It largely draws on information published under the
New Zealand regulator’s telecommunications industry monitoring regime that was
implemented as part of the 2006 reforms. There is, unfortunately, limited reliable industry
information available for years prior to 2006/07, as the regulator had limited information
disclosure powers.
5.1 Key Industry Facts & Figures
5.1.1 Technical statistics
Figure 2: Telecommunications Key Statistics 2005/06 to 2008/0910
Telecommunications Key Statistics 1 2005/06 2006/07 2007/08 2008/09
2
Fixed telephone voice services revenue ($bn) 2.09 2.03 1.98 1.91
Total mobile services revenue ($bn) 1.93 1.97 1.98 1.92
Business fixed line data services revenue ($bn) 0.47 0.48 0.46 0.43
Fixed network internet access revenue ($bn) 0.43 0.42 0.45 0.48
3
Total retail telecommunications revenue ($bn) 4.92 4.90 4.88 4.74
4
Total wholesale revenue ($bn) - - - 1.3
Non-chargeable fixed voice call minutes (bn) - - 5.31 4.67
Chargeable local call minutes (bn) 2.56 2.31 2.04 1.85
National call minutes (bn) 3.09 2.89 2.83 2.94
Fixed-to-mobile call minutes (bn) 0.94 1.00 0.99 0.95
International call minutes (bn) 0.81 0.81 0.84 0.92
5
Total fixed line chargeable minutes (bn) 7.41 7.00 6.71 6.67
Mobile voice call minutes (bn) 2.76 3.17 3.66 4.24
1. Retail statistics from aggregated survey responses unless otherwise specified. 2008/09 numbers are those collected from the same parties
as earlier years, as shown in from column H of relevant sheet.
2. 'Other fixed line revenue' has been removed from 2008/09 because all 'other' telecommunications revenue was aggregated and shown
separately in earlier years.
3. Excludes 'other' telecommunications revenue as some wholesale revenue may have mistakenly been included in this category in earlier
years.
4. Collection of wholesale revenue only started in 2008/09. Wholesale services are an input used by retailers to generate retail sales so retail
and wholesale revenue should not be aggregated.
Only the aggregate of mobile and fixed line revenue is disclosed to protect the confidentiality of mobile wholesale revenue.
5. All TelstraClear chargeable minutes have been estimated for for first two years of series.
10
Commerce Commission, Annual Telecommunications Monitoring Report, 2009.21 5.1.2 Telecommunications industry revenues Telecommunications industry revenues in New Zealand have generally followed international trends, with declining overall revenues driven predominantly by decreasing fixed telephone voice revenues. A gradual increase in fixed line internet access and data services has been insufficient to offset the decline in fixed voice revenues. Figure 3: Total Retail Telecommunications Revenues by Service 2006 to 200911 Fixed wholesale service revenues have increased rapidly with the implementation of the 2006 reforms and now, as shown in the figure below, make up a substantial portion of total telecommunications revenues. Internet and data remain smaller contributors to industry revenue, despite the increased focus on broadband by the industry and policy-makers. 11 Commerce Commission, Annual Telecommunications Monitoring Report, 2009. Please note Annex 2 contains illustrations of ARPU trends in data and mobile services for comparison.
22

Figure 4: Total Telecommunications Revenues (retail and wholesale) by Service 2008/0912

5.2 New Zealand’s Key Telecommunications Networks
The New Zealand broadband map is a useful resource for understanding the extent and types
of New Zealand’s telecommunications networks.13 The following table summarises the key
telecommunications networks currently deployed in New Zealand.

Figure 5: New Zealand’s Key Telecommunications Networks

TYPE                       DETAILS

Fixed Networks
                           TelecomNZ’s ubiquitous copper network. FTTN to 84% of the
                           population.

                           TelstraClear’s DOCSIS hybrid fibre coaxial cable network in
                           Wellington, Kapiti and Christchurch (approximately 14% of the
                           national population footprint). TelstraClear also has a limited
                           copper FTTN network in Wellington and Christchurch.

                           Wireless network operators, such as Woosh Wireless, primarily in
                           main centres.

12
     Commerce Commission, Annual Telecommunications Monitoring Report, 2009.

13
  The National Broadband Map exists to complement demand aggregation strategies of central and
local government and provide a comprehensive view of New Zealand’s Broadband landscape and is
available at: http://www.broadbandmap.govt.nz/map/. In 2009, the New Zealand Broadband Map won
a World Summit Award for creativity and innovation in ICT.
23
Small regional fixed network operators in some cities.
Competing fibre access networks in most Central Business Districts.
TelecomNZ and WorldxChange trialling 7000 FTTH connections.
Competing national backhaul (mainly TelecomNZ, TelstraClear and
FX Networks) serving most main centres.
Mobile Networks
Two competing GSM networks (Vodafone to 97% of the population,
and 2degrees in Auckland, Wellington, Christchurch and
Queenstown) and TelecomNZ’s CDMA network to 97% of the
population.
Three competing WCDMA networks (TelecomNZ and Vodafone to
97% of the population, and 2degrees in Auckland, Wellington,
Christchurch and Queenstown).
Since 1995, mobile connections have increased rapidly to eclipse fixed connections, which are
largely provided over TelecomNZ’s copper network. Mobile penetration has continued to
increase after passing the 100% mark.
Figure 6: Mobile Connections versus Fixed Line Connections 1995 to 200914
14
Commerce Commission, Annual Telecommunications Monitoring Report, 2009.24 Figure 7: Retail Internet Subscriber Connections15 5.3 Key market trends The key market trends identified by the New Zealand telecommunications regulator since the 2006 reforms, are set out below. Figure 8: Key Telecommunications Market Trends16 15 Commerce Commission, Annual Telecommunications Monitoring Report, 2009. Please note, Cable and Wireless category includes cellular connections. 16 Commerce Commission, Annual Telecommunications Monitoring Report, 2009.
25

6 MOTIVATIONS FOR CHANGE
Despite relying on deregulatory policies for longer than most comparable jurisdictions, the
2006 regulatory reforms appeared to set New Zealand on a positive trajectory. Competition
and service uptake increased in key service markets, and prices and service quality
improvements were evident. Correspondingly investment by both competing service providers
and TelecomNZ increased significantly.

While the industry was focusing on implementation of the reforms, however, the political
debate moved on to strategies to achieve a more dramatic step change in New Zealand’s
broadband policy outcomes.

Although the current Government’s actual ultra-fast broadband and rural broadband policies
were developed in the political discourse surrounding the 2008 general elections, arguably
these policies evolved in response to two key underlying themes of ongoing public concern:

   •   the perceived failure of regulatory interventions to drive the level of investment in
       broadband infrastructure required to keep pace with public expectations and
       international trends; and

   •   the growing “digital divide” between New Zealand’s urban and rural regions and the
       resultant impacts on key productive sectors of the economy.

The next two chapters examine the origins and increasing influence of these factors on New
Zealand’s broadband policy.
26
7 THE NEW ZEALAND REGULATORY REGIME
7.1 The Regulatory Regime
The 2006 reforms to the Telecommunications Act brought an end to well over a decade of
light-handed regulation. Aimed at driving a step change in New Zealand’s telecommunications
sector the reforms introduced a new approach to wholesale access regulation, greatly
strengthened the telecommunications sector regulator’s powers and introduced the
operational separation of the incumbent TelecomNZ.
7.1.1 Access regulation
The 2001 reforms had introduced a limited regulatory regime focused on interconnection,
number portability and resale services.
The more intrusive 2006 reforms were driven by:
• the desire of the Government for greater infrastructure competition;
• the continuing weakness of wholesale competition over TelecomNZ’s network; and
• the perception that TelecomNZ was continuing to under-invest in both the access and
core network.
The key elements of the 2006 reforms of copper access services are addressed below.
A Ladder of Investment Access Regime
A central facet of the 2006 reforms was the introduction of a suite of new regulated wholesale
access services, targeted toward implementing a “ladder of investment” (LOI) access strategy.
Drawing on new regulatory theories evolving in Europe17 to explain the development of
wholesale competition on incumbent networks, the approach entailed regulating a “ladder” of
wholesale access products, from resale to unbundled network elements, and crafting
incentives for access seekers to climb the ladder by progressively investing in replicable
network elements.
Under this theory, the price of each service reduces as the access seeker moves up the LOI.
This is a consequence of the pricing principle applicable at each rung and recognises the
increasing additional value that the access seeker is required to add. In the diagram
reproduced below, MED set out the key elements of the ladder of investment theory it
relied on in considering reforms in 2006.18
17
See, for example, Cave, Making the ladder of investment operational, November 2004.
18
MED, Promoting competition in broadband markets, June 2010.27 Figure 9: Ladder of Investment Access Regime The New Zealand approach to the ladder of investment services included legislating the regulation of unbundled copper local loops (UCLL), unbundled sub-loops, and unbundled bitstream services including “naked DSL”19. The UCLL family of access products were price regulated using a forward-looking cost-based pricing methodology, while bitstream and resale services were priced at retail-minus to preserve the incentives of competing service providers to move up the ‘ladder’ to UCLL and TelecomNZ’s incentives to invest in FTTN. 19 Regulated bitstream services include both clothed (a bitstream service tied to a POTS voice service) and naked (a standalone bitstream service) bitstream services.
28

REGULATED              EXAMPLE OF             METHOD OF              ADDITIONAL VALUE
SERVICE FAMILY         REGULATED              REGULATED              ADDED BY ACCESS
                       PRODUCT                PRICING                SEEKERS

UCLL                   e.g. UCLL              Forward Looking        DSLAMs, backhaul links,
                                              Cost-based             PSTN emulation
                                              (TSLRIC)

Bitstream/UBA          e.g. EUBA + POTS       Retail minus           National and International
                                              imputed costs          connectivity, Layer 3+

Resale                 e.g. resold            Retail – x%            Retailing
                       broadband

Enhanced Regulatory Processes and Powers

The new access regime was supported by amendments to the regulator’s powers and process,
most notably the introduction of a new Standard Terms Determination process, which
empowered the Commission to set industry wide ‘Standard Terms’ for all regulated services.
Rather than waiting for parties to bring their disputes, the Commission could initiate and
make standard terms determinations for all regulated services. The Commission responded
rapidly to the task of implementing the new regime, with standard terms determinations for
nine new regulated copper access services determined over the following two years.20

7.1.2 Operational separation
In addition to bringing the New Zealand access regime into closer alignment with comparable
jurisdictions, the 2006 reforms also imposed the operational separation21 of TelecomNZ.
Drawing heavily on the recent operational separation of BT in the UK22, the Minister for
Communications issued a statutory determination requiring TelecomNZ to operationally
separate its business into at least three separate business units.23

After intense and protracted negotiations, TelecomNZ submitted its final “Separation
Undertakings” on 25 March 200824. The Minister accepted them on 30 March, just before the
statutory deadline for ‘separation day’ of 31 March 2008.

20
    These Standard Terms Determinations are available on the Commerce Commission website at
http://www.comcom.govt.nz/standard-terms-determinations/.
21
   The term Operational Separation is equivalent to the term Functional Separation that is used in some
other jurisdictions.
22
   The BT Undertakings are available at: http://stakeholders.ofcom.org.uk/telecoms/policy/bt-
undertakings/.
23
   Telecommunications (Operational Separation) Determination, 26 September 2007. The
Determination is available at http://www.med.govt.nz/upload/51886/sig.pdf.
24
   Telecom Separation Undertakings, 25 March 2008. The Undertakings are available at
http://www.med.govt.nz/upload/56465/separation-undertakings.pdf.
29
The regime required Telecom to operationally separate into at least three business units:
• Chorus, TelecomNZ’s access network business, including the copper access network,
regional fibre backhaul and most exchange buildings – Chorus’ key product is UCLL;
• TelecomNZ Wholesale, the provider of all other regulated and commercial wholesale
services (such as bitstream and resale services); and
• TelecomNZ Retail, which includes the retail and mobile parts of the company.
New Zealand’s operational separation regime additionally:
• applied an Equivalence of Inputs (EOI) standard25 to all regulated fixed access services;
• set out timelines for the migration of legacy services to EOI; and
• required that TelecomNZ not discriminate in providing non-regulated fixed
telecommunications services to competing service providers.
To support these measures, the operational separation undertakings specified a series of
behavioural restrictions on Telecom. In particular, Chorus was established at as a standalone
business unit with a separate CEO and “arms-length” interactions with the rest of TelecomNZ.
A less stringent set of restrictions was imposed on TelecomNZ Wholesale.
In designing this approach, New Zealand policy-makers drew heavily on the UK model of
operational separation applied to BT; notably in respect of the separation between Layer 1
UCLL and Layer 2 bitstream services. Alternative models without this layer of separation were
considered in New Zealand, but were rejected in favour of an operational separation focused
on the equivalent provision of Layer 1 UCLL services by a separate access network unit
business. This was primarily to ensure that the model supported the ladder of investment
regulatory model that incentivised access seekers moving to UCLL by investing in DSLAMs.
The implementation of TelecomNZ’s operational separation has been largely successful,
although, as in the UK, TelecomNZ has asked for a number of variations to its Separation
Undertakings. These variations may be an indication that the cost and complexity of
complying with the Separation Undertakings proved to be more significant than TelecomNZ
expected.26
DESCRIPTION OF VARIATION
Variation 1 Approval of the first variation to the Undertakings on 17 June 2009 allowed Telecom to
build EOI operational support system capability as a whole as opposed to building it in
stages. This significantly reduced system build costs and project implementation risk,
but delayed consumption of some key regulated services by Telecom Wholesale on an
EOI compliant basis by six to twelve months. The rescheduling enabled Telecom to
deliver improved fault management and service restoration three months earlier.
25
EOI essentially requires TelecomNZ to “self-consume” the same upstream products that access
seekers purchase using the same business systems and on the same terms.
26
Details of the four variations requested by TelecomNZ are available at:
http://www.med.govt.nz/templates/ContentTopicSummary____42270.aspx.You can also read