Child Unintentional Deaths and Injuries in New Zealand, and Prevention Strategies - This report outlines New Zealand child injury data and ...
←
→
Page content transcription
If your browser does not render page correctly, please read the page content below
Child Unintentional Deaths and
Injuries in New Zealand, and
Prevention Strategies
This report outlines New Zealand child injury data and
effective or promising injury prevention strategies
Executive Summary
             1. Introduction
                                                 3 Land transport injuries          4 Choking, Suffocation and Strangulation
    2 Child unintentional injuries in
New Zealand: A snapshot of recent trends

                5 Falls                                6 Drowning                         7 Inanimate mechanical forces

     8 Animate mechanical forces                       9 Poisoning                             10 Burns and scalds

           Use this colour guide to find the injury topic immediately from the fore edge of this book.
Child Unintentional Deaths and Injuries in
      New Zealand, and Prevention Strategies
                                                   Safekids Aotearoa

Suggested citation:
Safekids Aotearoa. (2015). Child Unintentional Deaths and Injuries in New Zealand, and Prevention Strategies. Auckland, NZ: Safekids
Aotearoa. You are welcome to use information from this publication as long as you acknowledge Safekids Aotearoa as the source.
Safekids Aotearoa
5th Floor, Cornwall Complex,
40 Claude Road, Epsom, Auckland 1023
PO Box 26488, Epsom, Auckland 1344
New Zealand
P. +64 9 9955 F. +64 9 630 9961
ISBN: 978-0-9941125-7-6 (Print)
ISBN: 978-0-9941125-8-3 (Online)
Published December 2015
Disclaimer
Safekids Aotearoa has endeavoured to ensure material in this document is technically accurate and reflects legal requirements. However,
the document does not override legislation. Safekids Aotearoa does not accept liability for any consequences arising from the use of this
document. If the user of this document is unsure whether the material is correct, they should make direct reference to the relevant legislation
and contact Safekids Aotearoa. This publication updates information contained in Analysis of unintentional child injury data in New Zealand:
Mortality (2001-2005) and Morbidity (2003-2007). Auckland: Safekids Aotearoa.
Acknowledgements:
Safekids Aotearoa wishes to acknowledge the contribution of a range of people and organisations, in particular, we wish to thank: The
Ministry of Health - for providing Safekids New Zealand with the necessary funds required to undertake this project; Dr Liz Craig – Former
Director, NZ Child and Youth Epidemiology Service (University of Otago); Dr Jean Simpson – Director, New Zealand Child & Youth Epidemiology
Service; Dr Sara Bennett – Independent Consultant; Brandon DeGraff – University of Otago, Injury Prevention Research Unit; Alex Woodley –
Director, Point Research; Ally Palmer – Point Research; Moses Alatini – Policy Analyst, Safekids Aotearoa; Team at Safekids Aotearoa.
Note:
While the University of Otago’s Injury Prevention Research Unit provided a number of data tables for this report, all interpretation of the data
has been undertaken by Safekids Aotearoa and Point Research.
The views expressed in this report are thus those of Safekids Aotearoa rather than those of the University of Otago’s Injury Prevention
Research Unit.

                                               Child Unintentional Deaths and Injuries in New Zealand, and Prevention Strategies                   1
2 Child Unintentional Deaths and Injuries in New Zealand, and Prevention Strategies
Child Unintentional Deaths and Injuries in New Zealand, and Prevention Strategies 3
Table of Contents
Executive Summary.......................................................... 7         6 Drowning.................................................................. 49
                                                                                               The big picture.....................................................50
1   Introduction...............................................................8               Changes over time...............................................50
    1.1 Report purpose......................................................8                  Distribution by age, gender, and ethnicity............. 51
    1.2 Data sources and methods.....................................9                         Relevant legislation and standards....................... 52
                                                                                             		 The Fencing of Swimming Pool Act................... 52
2 Child unintentional injuries in New Zealand:
                                                                                             		 Life jacket standard......................................... 52
  A snapshot of recent trends.......................................11                         Prevention........................................................... 52
    2.1 Deaths from unintentional injury......................... 12
        The big picture..................................................... 12       7   Inanimate mechanical forces (crushing, cutting,
        Leading causes.................................................... 13             piercing, jamming injuries from objects)................... 55
        Changes over time............................................... 14                      The big picture.....................................................56
        Distribution by age, gender, and ethnicity............. 14                               Changes over time...............................................56
    2.2 Hospitalisations from unintentional injury........... 16                                 Leading cause by age group................................. 57
        Leading causes.................................................... 16                    Distribution by gender and ethnicity..................... 57
        Changes over time............................................... 17                      Design and standards..........................................58
        Distribution by age, gender, and ethnicity............. 18                               Prevention...........................................................59
    2.3 International comparisons.................................. 20
    2.4 Prevention Approach........................................... 21             8 Animate mechanical forces (bites, stings, injuries from
        Good practice...................................................... 21          humans, animals, insects etc.).................................. 61
        Limitations.......................................................... 21                 The big picture.....................................................62
                                                                                                 Changes over time...............................................62
3 Land transport injuries............................................. 23                        Leading cause by age group.................................62
    3.1 Motor vehicle traffic crashes (MVTCs).................. 24                               Distribution by gender and ethnicity.....................63
        The Big Picture.....................................................24                   Relevant legislation and standards.......................65
        Changes over time...............................................24                       Prevention...........................................................65
        Distribution by age, gender and ethnicity.............. 25
        Distribution by region..........................................26            9 Poisoning................................................................. 67
        Internationally..................................................... 27                  The big picture.....................................................68
        Prevention........................................................... 27                 Changes over time...............................................68
        Further information and resources........................28                              Leading cause by age group.................................69
    3.2 Non-Motor Vehicle Traffic (NMVT) Injuries............ 29                                 Distribution by gender and ethnicity.....................70
        The big picture.....................................................29                   Relevant legislation and standards.......................70
        Changes over time...............................................29                       Prevention...........................................................70
        Leading causes by age group................................30                            Further information and resources........................ 71
        Distribution by gender, ethnicity, and region......... 31
        Prevention...........................................................32       10 Burns....................................................................... 73
        Further information and resources........................ 33                             The big picture..................................................... 74
        Cyclist safety .......................................................34                 Changes over time............................................... 74
          Relevant legislation and standards...................34                                Leading cause by age group................................. 74
          Bicycle standard...............................................34                      Distribution by gender and ethnicity..................... 75
        Further information and resources........................ 35                             Relevant legislation and standards....................... 75
                                                                                                 Prevention........................................................... 75
4 Choking, Suffocation and Strangulation.................... 37
            The big picture.....................................................38    Prevention References....................................................80
            Changes over time...............................................38
                                                                                      Appendix A: Further information on data and methods.... 81
            Leading causes of suffocation, strangulation
                                                                                          Injury codes................................................................. 81
            and choking.........................................................39
            Distribution by gender and ethnicity.....................40               Appendix B: Additional tables........................................82
            Relevant legislation and standards.......................40
                                                                                      Glossary........................................................................86
            Prevention...........................................................40
            Further information and resources........................40               Section References........................................................ 87
                                                                                          Motor vehicle..............................................................87
5 Falls ........................................................................ 43       Non Motor Vehicle References......................................88
            The big picture.....................................................44        Choking/Strangulation Prevention References..............90
            Leading causes by age group................................44                 Falls Prevention References..........................................90
            Distribution by gender and ethnicity..................... 45                  Water Safety References............................................... 91
            Design and standards..........................................46              Animate and inanimate mechanical injuries.................92
            Prevention...........................................................46       Poisoning Prevention References.................................92
                                                                                          Burns and Scalds Prevention References......................93

4    Child Unintentional Deaths and Injuries in New Zealand, and Prevention Strategies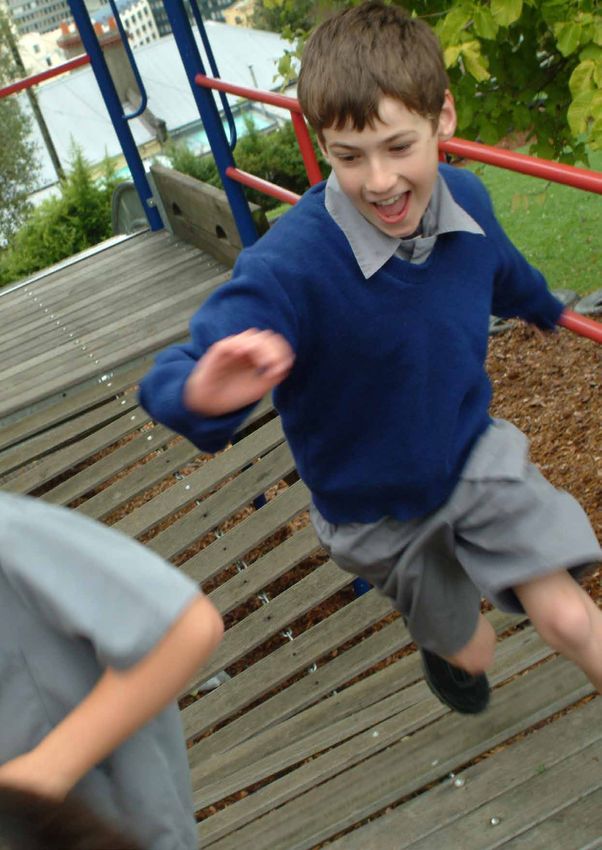
Child Unintentional Deaths and Injuries in New Zealand, and Prevention Strategies 5
Executive Summary

                                                                                                                                                            EXECUTIVE SUMMARY
In New Zealand, unintentional injuries are the                                  Focussing on non-fatal injuries, 852 in every
third-leading cause of death in children under 14.1                             100,000 New Zealand children are hospitalised due
These injuries not only have a high personal cost for                           to unintentional injuries. The leading causes for
children and families, but they have wider societal                             hospitalisation differed from from fatalities, with
and economic impacts.2 While children can never be                              falls, injuries from inanimate mechanical forces,
entirely protected from injury, a significant proportion                        non-motor vehicle traffic crashes and injuries from
of the unintentional injuries that lead to death or                             animate mechanical forces were identified as the
hospitalisation are preventable.                                                main causes. Unlike fatal injuries, non-fatal injuries
                                                                                are evenly distributed across age groups. Apart from
The report aims to reduce the incidence and severity
                                                                                suffocation, young children were more likely to be
of unintentional injury in children. Its purpose is
                                                                                injured by inanimate mechanical forces, 5-9 year olds
to examine the current data around deaths and
                                                                                were the most likely to experience falls and 10-14
hospitalisations from unintentional injury, identify
                                                                                year olds were the most likely to experience non-
high-risk populations and causes of injury, provide
                                                                                motor vehicle crashes. Identical to fatality rates, male
guidance and evidence for advocates and programme
                                                                                children were 1.5 times more likely to be hospitalised
planners and raise public awareness.
                                                                                from unintentional injuries than female children. Māori
Relevant child mortality and hospitalisation data for                           children have non-fatal injury rates twice the rate of
this report was sourced from the Injury Prevention                              Asian children and 1.5 times the rate of European
Research Unit (IPRU) at the University of Otago, via the                        children or other ethnicities. Pacific Island non-fatal
National Mortality Collection and National Minimum                              injury rates are also relatively high6.
Data Set. Effective interventions and evidence of good
                                                                                New Zealand’s rate of child injuries is poor when
practice were sourced from national and international
                                                                                compared to its international peers. New Zealand
injury prevention reports and scientific literature.
                                                                                was ranked the lowest of 24 OECD nations in child
Analysis shows nine in every 100,000 children living in                         and adolescent deaths by accidents in a 2007 UNICEF
New Zealand will suffer a fatal unintentional injury and                        report and in 2009 scored just 33 out 60 in terms of
the risk of injury increases as they age3. The leading                          child injury prevention7. A need for greater funding for
causes of fatal unintentional injuries among children                           injury prevention in New Zealand has been recognised.
are suffocation, motor vehicle crashes, drowning and
                                                                                Broad categories of proven or promising strategies
non-motor vehicle traffic crashes4. Overall fatalities
                                                                                for child injury prevention include environmental
from unintentional injuries are reducing however,
                                                                                modification, product modification, legislation,
not all injury sub-categories follow the same pattern
                                                                                promoting safety devices, educational home visits,
of decline. The majority of deaths from unintentional
                                                                                community based interventions or education and skills
injury are children under four and the leading causes
                                                                                development8.
for this age group are suffocation and drowning.
Male children are 1.5 times more likely to die from                             The report contains an in-depth analysis of the nine
an unintentional injury than female children. Māori                             major causes of unintentional injuries in New Zealand
children are significantly more at risk of a fatal                              children. It evaluates them statistically by age group,
unintentional injury than other ethnicities5.                                   gender, ethnicity and against international peers.
                                                                                It also references proven good-practice prevention
                                                                                strategies for each cause and there is a summary of
                                                                                what works at the beginning of each chapter. These
                                                                                leading causes are land transport injuries (motor
                                                                                vehicle traffic crashes and non-motor vehicle traffic
                                                                                crashes), suffocation, falls, drowning, inanimate
                                                                                mechanical forces, animate mechanical forces,
                                                                                poisoning and burns.

1
 Injury Prevention Research Unit. National Injury Query System (NIQS). Dunedin: Injury Prevention Research Unit, University of Otago. Available online
at: http://ipru3.otago.ac.nz/niqs/
2
    O’Dea D and Wren J. New Zealand Estimates of the Total Social and Economic Cost of Injuries. Wellington: Report to NZIPS Secretariat; 2012
3
 Injury Prevention Research Unit. National Injury Query System (NIQS). Dunedin: Injury Prevention Research Unit, University of Otago. Available online
at: http://ipru3.otago.ac.nz/niqs/
4
  NZ Mortality Review Data Group. NZ Child and Youth Mortality Review Committee: 9th Data Report, 2008–2012. Dunedin: NZ Mortality Review Data
Group, University of Otago; 2013. Available online at: http://www.hqsc.govt.nz/publications-and-resources/publication/1311/
5
    The National Injury Query System (NIQS): Injury Prevention Unit, University of Otago, http://ipru3.otago.ac.nz/niqs/.
6
    The National Injury Query System (NIQS): Injury Prevention Unit, University of Otago, http://ipru3.otago.ac.nz/niqs/.
7
 United Nations International Children’s Emergency Fund (UNICEF). Child Poverty in Perspective: An Overview of Child Well-being in Rich Countries.
Innocenti Report Card 7. Florence (ITA): UNICEF Innocenti Research Centre; 2007
8 European Child Safety Alliance’s guidelines “Child safety good practice guide: Good investments in unintentional child injury prevention and safety
promotion http://www.childsafetyeurope.org/publications/

                                                   Child Unintentional Deaths and Injuries in New Zealand, and Prevention Strategies                    7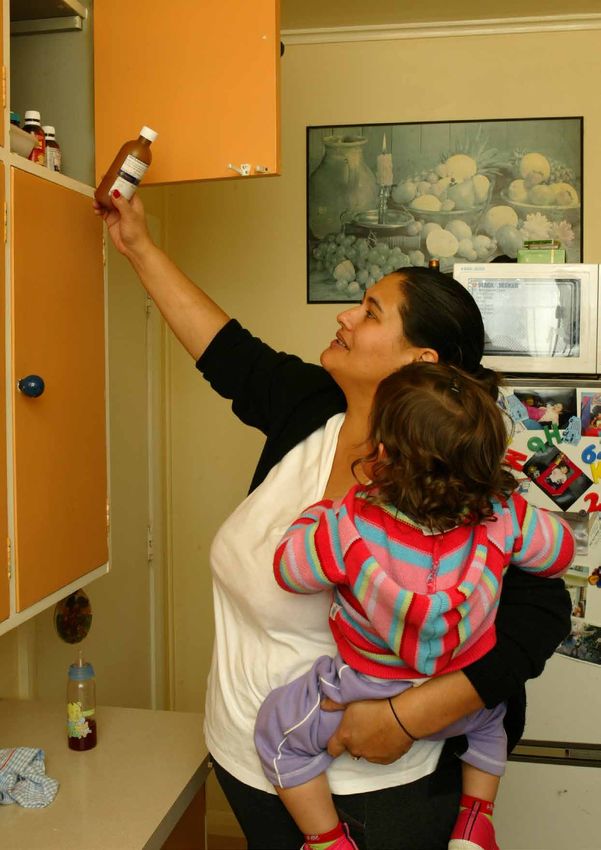
1 Introduction
1.1 Report purpose
Unintentional injury is the third-leading cause of death                        The purpose of this document is to provide guidance
for children aged 0 to 14 years in New Zealand.9 Every                          on practical, effective injury prevention strategies and
year between 2006 and 2010, around 84 children                                  interventions that can be used to reduce unintentional
on average died as a result of unintentional injury,                            child injuries. It is designed so that policy makers,
and a further 7,713 were hospitalised between 2008                              injury prevention practitioners, community groups,
and 2012.10 Children affected by unintentional injury                           whanau and family can implement and advocate for
are disproportionately more likely to come from                                 good practice. The majority of these strategies have a
socioeconomically disadvantaged households.11                                   strong evidence base and it is likely that child injuries
                                                                                could be significantly reduced if these strategies were
Along with the high personal cost for New Zealand
                                                                                adopted.
families, the social and economic cost of unintentional
child injury is huge. The social and economic cost                              The structure of the report is based on a World Health
per child fatality was estimated as $8.05 million in                            Organisation classification system (ICD-10) which uses
2008, which is significantly higher than the cost per                           national death and hospitalisation data. The indicators
fatality for the rest of the population ($5.74 million per                      derived from this classification system enables
fatality). This is attributed to the greater number of life-                    trends to be tracked over time nationally, and permits
years lost when a child dies.12 In total, child fatalities                      comparisons to be made with other countries.
were estimated to cost New Zealand $778.8 million in
                                                                                We begin by examining overall patterns of death
2008.13
                                                                                and hospitalisation from unintentional injury among
Although minor child injuries happen on a regular basis                         children in New Zealand, and compare our injury
and are often accepted as just a part of everyday life,                         rates with those of other developed countries. We
many injuries that can have significant consequences                            briefly describe the kinds of prevention activities
are preventable.                                                                that are currently taking place in New Zealand, and
                                                                                describe key recommendations from national and
The mission of Safekids Aotearoa is to reduce the
                                                                                international research on what could be done to reduce
incidence and severity of unintentional injury in
                                                                                the burden of child injury. We then focus on recent
children by raising public awareness about injury
                                                                                trends in some of the leading causes of injury among
issues and providing evidence-based information to
                                                                                children: land transport injuries, suffocation, falls,
planners and decision-makers to improve child safety.
                                                                                drowning, and injuries from inanimate mechanical
In this report, we specifically aim to:                                         forces (jammed or crushing injuries from objects) and
                                                                                animate mechanical forces (bites, stings and injuries
      • Describe relevant and recent data on child
                                                                                from humans, animals and insects), poisoning, and
        unintentional injury (deaths from 2006–2010
                                                                                burns. For each leading cause of child injury, we make
        and non-fatal injuries from 2008–2012) in an
                                                                                suggestions for targeted prevention activities.
        accessible format;
      • Identify high-priority populations and causes of
        child unintentional injury;
      • Provide those working in injury prevention with
        information to help them advocate for child injury
        prevention and plan programmes; and
      • Raise public awareness about how child
        unintentional injuries happen, and how they can
        be prevented.

9
 Injury Prevention Research Unit. National Injury Query System (NIQS). Dunedin: Injury Prevention Research Unit, University of Otago. Available online
at: http://ipru3.otago.ac.nz/niqs/
10
   NZ Mortality Review Data Group. NZ Child and Youth Mortality Review Committee: 9th Data Report, 2008–2012. Dunedin: NZ Mortality Review Data
Group, University of Otago; 2013. Available online at: http://www.hqsc.govt.nz/publications-and-resources/publication/1311/
 D’Souza A J, Blakely T A and Woodward A. The effect of eradicating poverty on childhood unintentional injury mortality in New Zealand: a cohort study
11

with counterfactual modelling. Journal of Epidemiology & Community Health. 2008; 682: 899-904.
12
     O’Dea D and Wren J. New Zealand Estimates of the Total Social and Economic Cost of Injuries. Wellington: Report to NZIPS Secretariat; 2012.
13
     Proffitt C and Beacham M, The New Zealand Injury Prevention Outcomes Report – June 2012. Wellington: Accident Compensation Corporation; 2012.

8      Child Unintentional Deaths and Injuries in New Zealand, and Prevention Strategies
INTRODUCTION
1.2 Data sources and methods
Data on child injuries were provided by the Injury We estimated populations using population estimates
Prevention Research Unit (IPRU) at the University and projections from Statistics New Zealand. For the
of Otago. Much of the information that we report is general population of children aged 0 to 14, and for
available online via the IPRU’s National Injury Query age groups and genders, we have used population
System (NIQS).14 Data that are not available on the estimates at 30 June each year.15 Comparable
NIQS were requested directly from the IPRU. Mortality population estimates are not available for ethnic
data was obtained from the National Mortality groups, so for ethnic groups we have instead used
Collection, while data on non-fatal hospitalisations population projections which use 2006 Census data as
are from the National Minimum Dataset (NMD). The a baseline.16 For long-term injury trends (e.g., overall
categories used in these datasets are described in non-fatal injury in children between 2001 and 2012) we
Appendix A, as are notes on the interpretation of have used the rates reported by the IPRU on the NIQS.
these data. We have focussed on the five-year period
Effective intervention and promising practices were
between 2008 and 2012 for non-fatal injuries, and
identified from scientific literature and both national
on 2006 to 2010 for fatalities. However, for looking
and international injury prevention reports based on
at long-term injury trends we have used 2001 as a
the literature. These were considered and prioritised
baseline to ensure that we have captured at least
in light of the experiences of New Zealand, and
ten years of injury data (10 years for fatalities, and
opportunities for effective intervention.
12 years for non-fatal injuries). We have also looked
at ten-year blocks for transport related injuries by
District Health Board (DHB) (see Section 3), since the
numbers included in this analysis are small. Where
appropriate, we have reported confidence intervals
(CI) and correlation coefficients (r) in order to assess
whether trends and differences between groups are of
statistical and practical significance.
We have focussed throughout this report on children
aged 0 to 14, and where appropriate have examined
injury trends by five-year age group (0-4, 5-9, and 10-14
years), gender (male and female), and broad ethnic
group (European/Other, Asian, Pacific Island, and
Māori). We have focussed on reporting injury rates (per
100,000 children) rather than raw numbers because
the populations that we focus on (e.g., age and ethnic
groups) differ in size.
14
Injury Prevention Research Unit. National Injury Query System (NIQS). Dunedin: Injury Prevention Research Unit, University of Otago. Available online
at: http://ipru3.otago.ac.nz/niqs/
15
Available online at: http://nzdotstat.stats.govt.nz/wbos/Index.aspx?DataSetCode=TABLECODE7502
16
Available online at: http://nzdotstat.stats.govt.nz/wbos/Index.aspx?DataSetCode=TABLECODE7502
Child Unintentional Deaths and Injuries in New Zealand, and Prevention Strategies 9Unintentional Other injuries 10 Child Unintentional Deaths and Injuries in New Zealand, and Prevention Strategies
2 Child unintentional injuries in
2 CHILD UNINTENTIONAL INJURIES IN NEW ZEALAND: A SNAPSHOT OF RECENT TRENDS
New Zealand: A snapshot of recent
trends
Summary
• Between 2006 and 2010, around 84 children aged 0 to 14 died each year of
unintentional injuries. On average 7,713 children in this age group were hospitalised
each year from non-fatal unintentional injuries between 2008 and 2012. This means
that 7,797 die or are hospitalised from unintentional injuries each year, which is 861
in every 100,000 children.
• Male children had a higher rate of both death and hospitalisation from
unintentional injuries than female children, and Māori and Pacific Island children
showed disproportionately high rates of injury compared with other ethnic groups.
• Leading causes of injury deaths were suffocation (particularly among very young
children), motor vehicle traffic crashes (especially as vehicle occupants), drowning
(especially among young children), and non-motor vehicle traffic accidents
(especially as cyclists).
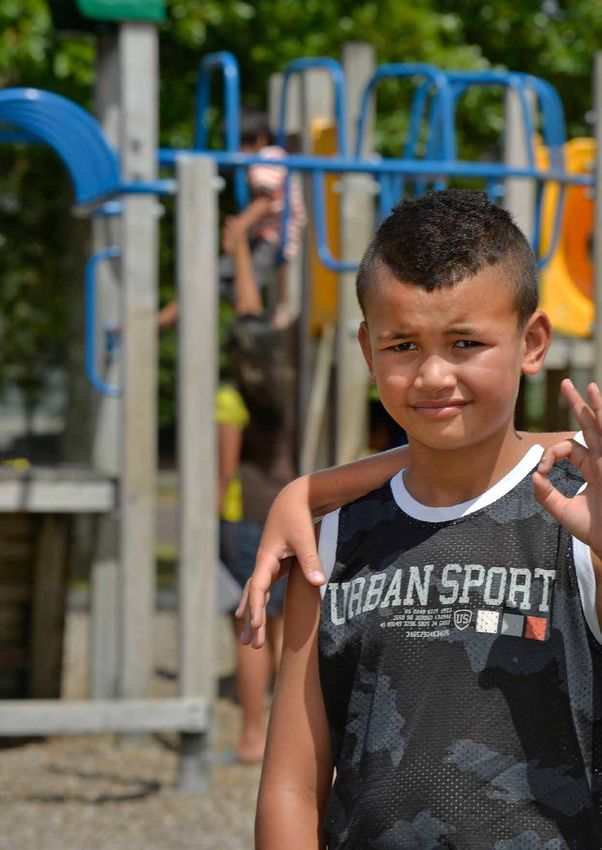
• In contrast, leading causes of non-fatal hospitalisations were falls (especially from
playground equipment and among children aged 5-9), injuries from inanimate
mechanical forces (especially among young children aged 0 to 4), and non-motor
vehicle traffic accidents (especially as cyclists and among older children).
• New Zealand compares relatively poorly to other wealthy nations on rates of
childhood injury and on safety measures.
Child Unintentional Deaths and Injuries in New Zealand, and Prevention Strategies 112.1 Deaths from unintentional injury
The big picture
An average of one hundred children aged 0 to 14 died
of injuries each year between 2006 and 2010. Around
eight out of every ten of these deaths was determined
to be unintentional (84 per year).
Unintentional injury was the third-leading cause of
death among children, accounting for 18 per cent of
child deaths (Table 1). This means that each year, nine
in every 100,000 children living in New Zealand will
suffer a fatal unintentional injury.17
The risk of fatal injuries increases as children grow
older. For children less than a year old, unintentional
injury accounts for only 3 per cent of deaths. However,
among children aged one to 14 years, unintentional
injury accounts for nearly one-third of all deaths.
TABLE 1: MORTALITY (NUMBER OF DEATHS) IN CHILDREN AGED 28 DAYS TO 14 YEARS BY CAUSE OF
DEATH AND AGE GROUP, 2008–2012.18
Category2 CHILD UNINTENTIONAL INJURIES IN NEW ZEALAND: A SNAPSHOT OF RECENT TRENDS
Leading causes
The leading causes of unintentional injury death
among children aged 0 to 14 (see Table 2) are different
to the leading causes of hospitalisations in this
age group. The most common causes of death from
unintentional injury between 2006 and 2010 were:
• Suffocation (39% of all unintentional injury
deaths among children);
• Motor vehicle traffic crashes (27%, especially as
vehicle occupants);
• Drowning (10%); and
• Non-motor vehicle traffic crash injuries, such as
pedestrians and among older children (9%).
TABLE 2: NUMBERS, RATES (PER 100,000), AND PERCENTAGES OF DEATHS FROM UNINTENTIONAL
INJURY AMONG CHILDREN AGED 0–14 YEARS BY MAIN EXTERNAL CAUSE, 2006–2010.
Main external cause of injury No. Rate %
Suffocation* 164 3.7 39.1%
Total 112 2.5 26.7%
Occupant 79 1.8 18.8%
Pedestrian 22 0.5 5.2%
Motor vehicle traffic crash
Cyclist 6 0.1 1.4%
Motorbike 3 0.1 0.7%
Other & unspecified 2 0.0 0.5%
Drowning 42 0.9 10.0%
Total 37 0.8 8.8%
Cyclist 6 0.1 1.4%
Non-motor vehicle traffic
crash
Pedestrian 20 0.4 4.8%
Other land transport 11 0.2 2.6%
Fire/flame 16 0.4 3.8%
Fall 10 0.2 2.4%
Poisoning 10 0.2 2.4%
Other specified and unspecified 24 0.5 5.7%
Total 420 9.4 100%
* Care must be taken when interpreting these figures as there may be some cross-over between suffocation and SUDI/ SUD, with
the majority of deaths in this category occuring in infantsChanges over time
There was an overall decline in deaths from unintentional injury in children
aged 0 to 14 between 2001 and 2010, however it is not steady (Figure 1).19
Since 2007, suffocation has overtaken motor vehicle traffic crashes as the
leading cause of unintentional injury death among children. This may be
related to an increasing tendency for coroners and pathologists to recognise
suffocation as a contributing factor in many cases of Sudden Infant Death in
Infancy (SUDI) among children less than 12 months old.20 For those aged 1
year or over the leading cause of fatalities is motor vehicle crashes.
FIGURE 1: DEATH FROM UNINTENTIONAL INJURY IN CHILDREN AGED 0–14 YEARS OVER TIME, 2001–2010.
12
10 10.5
Death rate (per 100,000)
All unintentional 8.5
8
injury death
Suffocation
6
Traffic crashes
4 3.9
3.3
2 1.7
1.9
0
2001 2002 2003 2004 2005 2006 2007 2008 2009 2010
Year
Source: The National Injury Query System (NIQS): Injury Prevention Unit, University of Otago, http://ipru3.otago.ac.nz/niqs/.
Distribution by age, gender, and ethnicity
As illustrated in Figure 2, the majority of deaths from unintentional injury
is among children aged four and under. Suffocation and drowning are
particular concerns among these very young children, with suffocation
in particular primarily affecting children under 12 months.21 In contrast,
deaths from motor vehicle traffic crashes represent a similar threat to
children in all age groups.
FIGURE 2: FATAL INJURY IN CHILDREN AGED 0–14 BY MAIN EXTERNAL CAUSE AND AGE GROUP, 2006-2010.
20 18.1 All unintentional injury death
18 Suffocation
Death rate (per 100,000)
16 Motor vehicle traffic crashes
14 Drowning
12 10.4
10
8
5.6
6 4.4
4 2.7 2.1 2.1 2.7
2 0.0 0.3 0.5 0.3
0
0-4 5-9 10-14
Age group (years)
Source: The National Injury Query System (NIQS): Injury Prevention Unit, University of Otago, http://ipru3.otago.ac.nz/niqs/.
19
r=-0.22 (a weak linear relationship). The correlation coefficient r measures the strength of a linear relationship between two variables, in this case,
the decrease in unintentional deaths, over time.
20,21 Craig E, Reddington A, Wicken A, Oben G, and Simpson J. Child Poverty Monitor 2013 Technical Report (Updated 2014). Dunedin: NZ Child &
Youth Epidemiology Service, University of Otago; 2013.
14 Child Unintentional Deaths and Injuries in New Zealand, and Prevention StrategiesMale children face a disproportionate rate of unintentional injury death.
2 CHILD UNINTENTIONAL INJURIES IN NEW ZEALAND: A SNAPSHOT OF RECENT TRENDS
Between 2006 and 2010 the unintentional injury death rate for male
children aged 0 to 14 was over 1.5 times that of females, with 12 in every
100,000 male children dying from an unintentional injury compared with 7
in every 100,000 female children (Figure 3).22
FIGURE 3: FATAL INJURIES IN CHILDREN AGED 0 TO 14 BY GENDER AND MAIN EXTERNAL CAUSE,
2006 TO 2010.
14 All unintentional injury death
Suffocation
12 11.7
Motor vehicle traffic crashes
Drowning
10
Death rate (per 100,000)
8
7
6
4.4
4
2.9 2.9
2.1
2 1.2
0.6
0
Male Female
Gender
Source: The National Injury Query System (NIQS): Injury Prevention Unit, University of Otago, http://ipru3.otago.ac.nz/niqs/.
Māori children aged 0-14 are significantly over-represented in unintentional injury fatalities.
FIGURE 4: DEATH FROM UNINTENTIONAL INJURY AMONG CHILDREN AGED 0 TO 14 BY ETHNIC GROUP,
2006–2010.
European Māori Pacific Asian Other Total
Number 146 221 38 12 3 420
Percent 34.8 52.6 9.0 2.9 0.7 100%
Rate per 100,000 5.6 20.0 6.5 2.7
Source: The National Injury Query System (NIQS): Injury Prevention Unit, University of Otago, http://ipru3.otago.ac.nz/niqs/.
22
95% Confidence Intervals (CI): males 10.6–12.6; females 6.0–8.0 per 100,000.
Child Unintentional Deaths and Injuries in New Zealand, and Prevention Strategies 152.2 Hospitalisations from unintentional injury
Around 7,713 children aged 0 to 14 were hospitalised from non-fatal, unintentional injuries each year between
2008 and 2012. This is around 852 in every 100,000 children (Table 3).
Leading causes
Leading causes of non-fatal TABLE 3: NUMBERS, RATES (PER 100,000), AND PERCENTAGES OF
hospitalisations from unintentional HOSPITALISATIONS FROM NON-FATAL UNINTENTIONAL INJURY
injury among children between AMONG CHILDREN AGED 0–14 YEARS BY MAIN EXTERNAL CAUSE,
2008 and 2012 were different to the 2008–2012.
main causes of unintentional child
injury deaths. While suffocation, Main external cause of injury No. Rate %
motor vehicle traffic crashes, and Total 18636 411.8 48.3%
drowning were leading causes of
Fall involving playground
death between 2006 and 2010, the equipment
6186 136.7 16.0%
main causes of non-fatal injuries
Fall Fall on same level from slipping,
resulting in hospitalisation among 1968 43.5 5.1%
children were: tripping, and stumbling
• Falls (48%, especially Fall involving ice-skates, skis,
1705 37.7 4.4%
roller-skates or skateboards
among children aged 5 to
9 and involving playground Total 7467 165.0 19.4%
equipment);
Inanimate Struck by thrown, projected, or
3337 73.7 8.7%
• Injuries from inanimate mechanical falling object
mechanical forces (objects); forces
Striking against or struck by sports
(19%, especially among young 2387 52.7 6.2%
equipment
children aged four and under
and from being caught or Total 3658 80.8 9.5%
jammed between objects); Non-motor Cyclist 1877 41.5 4.9%
vehicle traffic
• Non-motor vehicle traffic crash crash Other land transport 1517 33.5 3.9%
injuries (9%, especially among
Pedestrian 264 5.8 0.7%
older children and as cyclists);
and Total 2064 45.6 5.4%
• Injuries from animate Hit, struck, kicked, twisted, bitten,
693 15.3 1.8%
mechanical forces (5%, Animate or scratched by another person
mechanical
especially among older forces Bitten or struck by dog 582 12.9 1.5%
children and from being
(bitten, stung and injured by Bitten or stung by nonvenomous
286 6.3 0.7%
insect/arthropod
humans, animals or insects)
(Table 3). Poisoning 1541 34.1 4.0%
Total 1469 32.5 3.8%
Occupant 720 15.9 1.9%
Motor Pedestrian 436 9.6 1.1%
vehicle traffic
crash Motorcyclist 176 3.9 0.5%
Cyclist 124 2.7 0.3%
Other & unspecified 13 0.3 0.0%
Burns from hot object/substances* 1215 26.8 3.2%
Suffocation 298 6.6 0.8%
Drowning 141 3.1 5.2%
Other specified and unspecified 1999 44.2 5.2%
TOTAL 38563 852.2 100%
Source: The National Injury Query System (NIQS): Injury Prevention Unit, University of Otago,
http://ipru3.otago.ac.nz/niqs/.
* This does not include burn injuries caused by exposure to fire and flames.
16 Child Unintentional Deaths and Injuries in New Zealand, and Prevention StrategiesChanges over time
2 CHILD UNINTENTIONAL INJURIES IN NEW ZEALAND: A SNAPSHOT OF RECENT TRENDS
There has been an overall decline in the rate of
unintentional injury in children aged 0 to 14 since
2001, with 1,101 out of every 100,000 children
experiencing injury-related hospitalisation in 2001
and 826 in 2012 (Figure 5). This decline may be slightly
underestimated, since DHBs have only been required
to report short-stay emergency department events
since mid-2009 (see Appendix A for more information).
FIGURE 5: NON-FATAL UNINTENTIONAL INJURY IN CHILDREN AGED 0-14 YEARS OVER TIME, 2001-2012.
1200
Total
Falls
Inanimate mechanical forces
1000 1101.1
Non-traffic transport accidents
Hospitalisation rate (per 100,000)
800 826.3
600
552.4
400
404.8
220.4
200 162.5
105.4
70.2
0
2001 2002 2003 2004 2005 2006 2007 2008 2009 2010 2011 2012
Year
Source: The National Injury Query System (NIQS): Injury Prevention Unit, University of Otago, http://ipru3.otago.ac.nz/niqs/.
Child Unintentional Deaths and Injuries in New Zealand, and Prevention Strategies 17Distribution by age, FIGURE 6: NON-FATAL UNINTENTIONAL INJURY IN CHILDREN BY AGE
GROUP, 2008–2012.
gender, and ethnicity
Total
Whereas very young children (aged
Falls
0 to 4) had the highest rates of
unintentional injury death (Figure Inanimate mechanical forces
2), non-fatal injuries were more Non-traffic transport accident
1000
evenly distributed across children 865.3 884.6
900
Hospitalisation rate (per 100,000)
of all ages (Figure 6).23 Falls were 807.4
slightly more common among 800
5–9-year-olds, with half of falls 700
in this age category being from 600 535.1
playground equipment (51%).
Non-motor vehicle traffic crash 500
343.6 363.1
injuries (e.g. injuries from cycling 400
which were not from crashes with 300 214.5
motor vehicles) were most common 149.7
among 10–14-year-olds, while 200 128.8 141.0
77.8
injuries from inanimate mechanical 100 30.0
forces were most common among 0
very young children (aged 0–4), 0-4 5-9 10-14
with nearly half of injuries of this Age group (years)
kind resulting from young children
aged 0 to 4 being caught, crushed, Source: The National Injury Query System (NIQS): Injury Prevention Unit, University of Otago,
http://ipru3.otago.ac.nz/niqs/.
or jammed between objects.
Between 2008 and 2012, male FIGURE 7: NON-FATAL UNINTENTIONAL INJURY IN CHILDREN BY
children aged 0 to 14 were GENDER, 2008-2012.
hospitalised with non-fatal injuries
at 1.5 times the rate of female 1200
children (Figure 7). One in every 1,015.2
100 male children was hospitalised
Hospitalisation rate (per 100,000)
1000 Males
during this time period, compared
with 0.7 in every 100 female Females
children.24 There were especially 800
688.0
large differences between genders
with regard to injuries from non-
600
motor vehicle traffic crashes, where 482.1
males had over twice the rates of
hospitalisation of females, and 400 341.4
around three times the rate of
195.6
cycling injuries from non-motor
200 134.3 108.7
vehicle traffic crashes. Boys were
around 1.5 times as likely than 52.2
girls to be injured from inanimate 0
mechanical forces (objects) (such All unintentional Fall Inanimate Non-motor vehicle
as being caught between objects, injury hospitalisations mechanical forces traffic accident
struck by or against something, Injury cause
or coming into contact with sharp
glass). Source: The National Injury Query System (NIQS): Injury Prevention Unit, University of Otago,
http://ipru3.otago.ac.nz/niqs/.
23
While 95% confidence intervals for deaths among children aged 0-4 did not overlap with CIs for older age groups (lower bound for children aged 0-4
was 15.1, while the upper bound for older children was 6.3 deaths per 100,000), all morbidity 95% CIs overlapped, meaning that non-fatal injury rates
were not significantly different at a 0.05 level between age groups.
24
1014.2 out of every 100,000 male children, and 688.0 out of every 100,000 females. 95% CIs did not overlap (upper bound for females was 706.4
hospitalisations per 100,000; lower bound for males was 963.5).
18 Child Unintentional Deaths and Injuries in New Zealand, and Prevention StrategiesMāori and Pacific Island children aged 0 to 14 had
2 CHILD UNINTENTIONAL INJURIES IN NEW ZEALAND: A SNAPSHOT OF RECENT TRENDS
higher rates of hospitalisation from unintentional
injury than other ethnic groups between 2008 and
2012 (Figure 8). Nearly one in every hundred Māori
children suffered a non-fatal injury during this time
period (946 in every 100,000 children), which is over
twice as high as the rate among Asian children (416
per 100,000 children), and nearly 1.5 times the rate
for European and other ethnicities (654 per 100,000
children). Pacific Island children also had a relatively
high rate of hospitalisation, with 792 in every 100,000
Pacific Island children suffering a non-fatal injury.
FIGURE 8: NON-FATAL UNINTENTIONAL INJURY IN CHILDREN AGED 0-14 YEARS BY ETHNICITY, 2008-2012.
1000 Total 945.8
Falls
900
Inanimate mechanical forces
Non-traffic transport accident 792.2
800
Hospitalisation rate (per 100,000)
700 654.2
600
500
427.3
415.9
400 357.4
329.6
300
214.6 209.1 189.3
200
113.1
85.0 76.5 76.5
100
23.6 36.6
0
Asian European/Other Pacific Island
Ethnic group
Source: The National Injury Query System (NIQS): Injury Prevention Unit, University of Otago, http://ipru3.otago.ac.nz/niqs/.
Child Unintentional Deaths and Injuries in New Zealand, and Prevention Strategies 192.3 International comparisons
In 2001, UNICEF released a report which indicated that, including passenger and driver safety, pedestrian
between 1991 and 1995, New Zealand ranked 22nd of safety, water safety, falls, poisoning, burns and scalds,
the 26 OECD nations on child death from injuries.25 and choking and strangulation. The authors of the
New Zealand’s rate of child injury death was 1.5 times report concluded that as well as taking further steps to
that of Australia, and nearly three times that of Sweden target child and adolescent safety in these areas, New
during this period. This means that if New Zealand had Zealand might also benefit from increasing funding for
achieved the same rate of child death as Sweden for home visiting programmes.
the five-year period between 1991 and 1995, more than A 2012 outcomes report on the New Zealand Injury
300 children could still be alive today. Prevention Strategy30 (NZIPS) similarly indicated a need
New Zealand’s rate of child injury death has declined for further funding for injury prevention, noting that the
since this period, from 13.7 out of every 100,000 level of government investment in injury prevention
children between 1991 and 1995 to 11.2 between 2006 is low relative to its social and economic cost. The
and 2010.26 However, this still compares poorly to report also noted a need for greater collaboration and
other OECD nations, whose collective average rate of centralisation of prevention activities, and sustained
injury death was 10.2 out of every 100,000 children prevention efforts over the long term.
between 1991 and 1995. More recent estimates
indicate that New Zealand still compares poorly to
other wealthy nations on rates of childhood and
adolescent injury. For example, a 2007 UNICEF report
indicated that New Zealand ranks lowest of the 24
OECD countries for which data are available on deaths
from accidents among children and adolescents under
the age of 19.27
On this basis, a 2009 assessment of our child and
adolescent injury prevention position gave New
Zealand an overall score of just 33 out of 60.28 This
is considerably poorer than the highest-ranking
European nations – which included Iceland at 44.5,
and the Czech Republic, Netherlands, and Poland,
which all received scores of 43.5 in 2012 – and falls
slightly below the European-wide 2012 average score
of 35.29 The researchers concluded that if New Zealand
were to be placed alongside European countries for
which data are available in 2009, we would rank
15th out of 25 on injury prevention for children and
adolescents. New Zealand’s poor rating was based
on deficiencies across many injury prevention topics,
25
United Nations International Children’s Emergency Fund (UNICEF). A League Table of Child Deaths by Injury in Rich Nations. Innocenti Report Card 2.
Florence (ITA): UNICEF Innocenti Research Centre; 2001.
26
The National Injury Query System (NIQS): Injury Prevention Unit, University of Otago, http://ipru3.otago.ac.nz/niqs/
27
United Nations International Children’s Emergency Fund (UNICEF). Child Poverty in Perspective: An Overview of Child Well-being in Rich Countries.
Innocenti Report Card 7. Florence (ITA): UNICEF Innocenti Research Centre; 2007.
28
Bland V, Shepherd M, and Ameratunga S, et al. Child and adolescent injury report card: New Zealand 2009. Journal of Paediatrics and Child Health.
2011; 47(11): 783-7.
29
MacKay M and Vincenten J. Child Safety Report Card 2012: Europe Summary for 31 Countries. Birmingham: European Child Safety Alliance, Eurosafe;
2012.
30
The nation-wide injury prevention plan that operated between 2003 and 2013, which was replaced in 2014 by a Cross-government Injury Prevention
Work Plan.
20 Child Unintentional Deaths and Injuries in New Zealand, and Prevention Strategies2.4 Prevention approach
2 CHILD UNINTENTIONAL INJURIES IN NEW ZEALAND: A SNAPSHOT OF RECENT TRENDS
It is increasingly recognised that improving child Good practice
safety is a more complex problem than previously
Under each section, this guide outlines strategies
recognised. Rather than an over-reliance on ‘tame’
that can be used to reduce child injuries ‘at a glance’.
or ‘simple’ solutions effective child injury prevention
It is noted that many of the evidence informed
requires dynamic solutions that address the complex
interventions have been drawn from the European
contexts in which children are injured.31 As such,
Child Safety Alliance’s publications33 and the “Child
multifaceted interventions are effective in reducing
safety good practice guide: Good investments in
injury or showing promise.
unintentional child injury prevention and safety
Our aim is to identify and focus on evidence-informed promotion.”34 For the purposes of this document, good
good practice and strategies most likely to reduce practice is defined as:
childhood injuries. In general, there are seven
• A prevention strategy that has been evaluated
approaches that offer proven or promising strategies to
and found to be effective either through a robust
reduce unintentional child injuries. These are:
evaluation or systematic review, or
1. Environmental modification – to make the world
• Expert opinion supports the practice and data
more child or family friendly. This could include
suggests it is an effective strategy (e.g. life jackets
reducing the height of playground equipment, or
and drowning prevention), or
introducing traffic calming measures;
• Expert opinion supports the practice and there
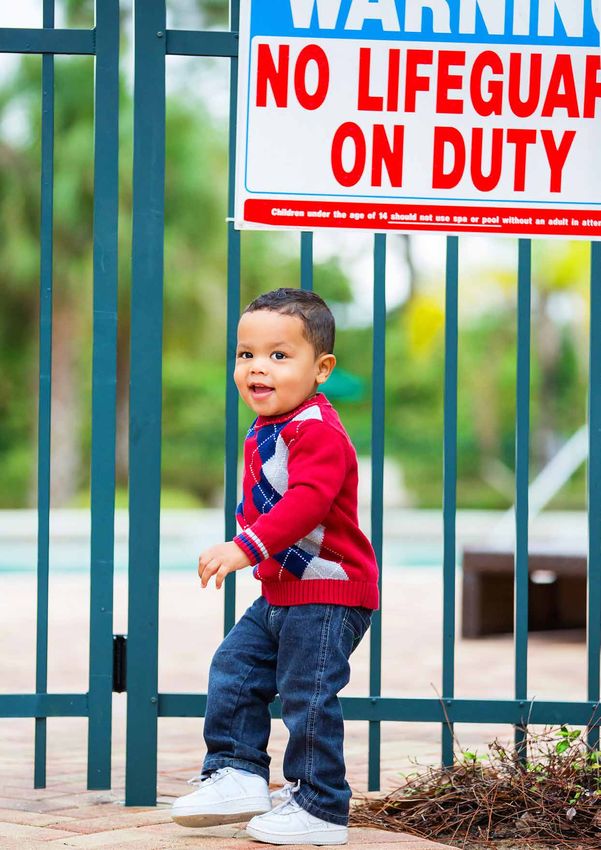
2. Product modification – for example child resistant
is a clear link between the strategy and the
caps for medication or poisonous substances;
reduction of risk (e.g. child-resistant packaging
3. Legislation, regulation and enforcement. This and medication to reduce unintentional child
is considered highly effective, particularly when poisoning), and
enforced and used in combination with other
• The strategy has been implemented and the
strategies. This includes laws that require the
practicalities of implementing it has been
mandatory use of child restraints;
examined.
4. Promoting the use of safety devices, such as bike
helmets or child passenger restraints; Limitations
5. Home visits to families of young children, where It is noted that there are limitations in this approach,
the information provided is age appropriate and namely:
combined with strategies, such as the provision • The prevention of child injury is complex. Injury
of free safety equipment; rates disproportionately affect different ages,
6. Community based interventions – which focus communities and population groups. What works
on changing community values and behaviours, in one setting or with one cultural, population or
along with the environment. An example of this is age group may not work as well with another.
community based bicycle helmet campaigns; • Much of this evidence is international and has not
7. Education and skills development. The evidence been evaluated in a New Zealand context, and
for this approach tends to be poor, however if • Injury prevention can benefit from an innovative,
well designed and if it has a strong audience multi-pronged approach, particularly where
focus, it may be more effective particularly if used strategies have not been effectively evaluated or
in combination with other strategies.32 do not yet exist.
32
European Child Safety Alliance’s guidelines “Child safety good practice guide: Good investments in unintentional child injury prevention and safety
promotion.”
33
http://www.childsafetyeurope.org/publications/
34
European Child Safety Alliance’s guidelines “Child safety good practice guide: Good investments in unintentional child injury prevention and safety
promotion.”
Child Unintentional Deaths and Injuries in New Zealand, and Prevention Strategies 2122 Child Unintentional Deaths and Injuries in New Zealand, and Prevention Strategies
3 Land Transport Injuries

                                                                                                                   3 LAND TRANSPORT INJURIES
 Summary
  • Land transport crashes are a major                We could reduce the burden of child injury
    cause of both fatal and non-fatal                   from motor vehicle crashes through:
    injuries among children. Motor                    • The correct use of child restraints
    vehicle traffic crashes (MVTCs) were
                                                      • Alcohol limits for drivers
    the second-leading cause of fatal
    injuries between 2006 and 2010 after              • Traffic calming techniques
    suffocation, and non-motor vehicle                • Area wide traffic calming techniques.
    traffic (NMVT) crashes were the third-            • Legislation for the mandatory use of
    leading cause of non-fatal injuries                 child restraints until a child reaches
    between 2008 and 2012. There has                    148cm in height.
    been a decline in non-fatal child injury
    rates from land transport crashes since           We could improve pedestrian safety
    2001.                                               through:
                                                      • The reduction of speed limits in
  • Over two-thirds (71%) of child deaths in            residential areas and school zones, and
    MVTCs occur when children are vehicle               its enforcement
    occupants, followed by pedestrians
                                                      • Vehicle modifications such as reversing
    (20%).
                                                        mirrors and cameras
  • Deaths from MVTCs affect all ages                 • Separating driveways from gardens and
    equally, but older children (aged 10-               play areas, and separate pedestrian
    14) are more likely to sustain non-                 access from the property to footpath
    fatal injuries. Māori children were                 (path separate to the driveway)
    also disproportionately likely to be              • Training children to be safe on the
    injured in MVTCs, especially as vehicle             roads, although the evidence is mixed
    occupants.                                        • Community awareness initiatives.
  • Children are most likely to suffer a              We could improve cycle safety through:
    non-fatal injury in NMVT crash as pedal
                                                      • The correct use of cycle helmets
    cyclists (51%), but are most likely to
    die in NMVT crashes where they are                • Increased visibility through visibility
    pedestrians (54%). Very young children              aids such as bio-motion detectors
    (aged 0 to 4) have a particularly                 • Cycle ways and pathways
    high rate of death in NMVT crashes,               • Area wide traffic calming
    especially as pedestrians. However,
    older children (aged 10 to 14) have
    the highest rate of non-fatal injuries
    in NMVT crashes, particularly when
    cycling and using other land transport.

  • DHBs with the highest rates of injury
    from land transport crashes were
    Tairawhiti, Northland, Bay of Plenty,
    and Whanganui.

                          Child Unintentional Deaths and Injuries in New Zealand, and Prevention Strategies   23
We have analysed land transport crashes by motor vehicle traffic crashes (MVTCs, e.g. pedal cyclist
colliding with a motor vehicle on the road) versus non-motor vehicle traffic (NMVT) crashes (e.g. coming off
a pedal bike at home). These two kinds of incidents show slightly different patterns of injury. Section 3.1
examines injuries from motor vehicle traffic crashes, while section 3.2 focusses on non-motor vehicle traffic
crashes.
Injuries from all land transport crashes account for over one-third of child deaths from unintentional injury.
However, fatalities from MVTCs are more than three times as common as fatalities from NMVT crashes
(Table 2).
The reverse is true of non-fatal injuries: whereas land transport crashes account for 13 per cent of all non-
fatal injuries in children aged 0 to 14, injuries from NMVT crashes are over twice as common as those from
MVTCs (Table 3). This suggests that while MVTCs tend to happen at higher speeds and cause more severe
injuries, children are more frequently involved in NMVT crashes, especially as cyclists.
3.1 Motor vehicle traffic crashes (MVTCs)
The big picture 2008 and 2012, with 294 children suffering non-fatal
Traffic crashes involving motor vehicles were, until injuries from MVTCs each year (Table 3).
recently, the overall leading cause of death from Taken together, this means that each year around
unintentional injury among children aged 0 to 14 316 children either die or are hospitalised from traffic
(Figure 1). More recently, suffocation has become the crashes involving motor vehicles. This is about 35 out
leading cause of death from unintentional injury in of every 100,000 children.
children, though this primarily reflects an increase
in the number of deaths attributed to suffocation in Changes over time
cases of Sudden Infant Death in infancy rather than a
Deaths from MVTCs declined between 2001 and 2010,
substantial decrease in fatalities from MVTCs.35
from 3.3 deaths per 100,000 children to 1.7 in 2010
Between 2006 and 2010, MVTCs were the main cause (Figure 9).36 Non-fatal injuries from MVTCs have also
of over one-quarter (27%) of all child deaths from declined, with half as many non-fatal injuries from
unintentional injuries (Table 2), and caused the death MVTCs in 2012 as in 2001 (50.4 per 100,000 children in
of around 22 children each year. MVTCs accounted for 2001 compared with 25.2 in 2012).37
4 per cent of all non-fatal injuries in children between
FIGURE 9: FATAL AND NON-FATAL INJURIES FROM MOTOR VEHICLE TRAFFIC CRASHES IN CHILDREN
AGED 0–14 OVER TIME, 2001 TO 2012.
60
Fatal
50 50.4 Non-fatal
Rate (per 100,000)
40
30 25.2
20
10
3.3 1.7
0
2001 2002 2003 2004 2005 2006 2007 2008 2009 2010 2011 2012
Year
Source: The National Injury Query System (NIQS): Injury Prevention Unit, University of Otago, http://ipru3.otago.ac.nz/niqs/.
35
Craig E, Reddington A, Wicken A, Oben G, & Simpson J. Child Poverty Monitor 2013 Technical Report (Updated 2014). Dunedin: NZ Child & Youth
Epidemiology Service, University of Otago; 2013.
36
r=-0.62 (a moderately strong linear relationship).
37
r=-0.93 (a strong linear relationship).
24 Child Unintentional Deaths and Injuries in New Zealand, and Prevention StrategiesDistribution by age, gender, and ethnicity
3 LAND TRANSPORT INJURIES
Around half of all non-fatal MVTC FIGURE 10: NON-FATAL INJURIES FROM MOTOR VEHICLE TRAFFIC
injuries among children aged 0 CRASHES IN CHILDREN AGED 0 TO 14 BY AGE GROUP AND CRASH
to 14 between 2008 and 2012 TYPE, 2008 TO 2012.
occurred when children were
19.5 Occupant
vehicle occupants (49%) and over 20
one-quarter when children were Pedestrian
Hospitalisation rate (per 100,000)
18
pedestrians (30%). This pattern Cyclist
16
is even more pronounced for fatal 13.7
14.5 Motorcyclist
injuries, with over three-quarters of 14
Other
child deaths from MVTCs between 12 11.5 11.4
2006 and 2010 occurring when 10
8.5
children were vehicle occupants
8
(71%). 6.2 5.5
6
Although fatal injuries from MVTCs
4 2.4 2.6
affect all age groups equally (Figure
2), the risk of sustaining a non-fatal 2
0.4 0.6 0.2 0.5
0.2
injury from a MVTC increases with 0
age (Figure 10).38 0-4 5-9 10-14
Age group (years)
Source: The National Injury Query System (NIQS): Injury Prevention Unit, University of Otago,
http://ipru3.otago.ac.nz/niqs/.
Male children had over 1.5 times FIGURE 11: NON-FATAL INJURIES FROM MOTOR VEHICLE TRAFFIC
the rate of hospitalisation from CRASHES IN CHILDREN AGED 0 TO 14 BY ETHNIC GROUP AND CRASH
MVTC injury as females between TYPE, 2008 TO 2012.
2008 and 2012.39
30.0 Occupant
Māori children also showed a
Pedestrian
disproportionately high rate of
Hospitalisation rate (per 100,000)
25.0 Cyclist 24.0
injury from MVTCs, being more
than twice as likely for Asian or Motorcyclist
European/other children to suffer 20.0 Other
a non-fatal injury from a MVTC
16.1
between 2008 and 2012 (Figure
11). Pacific Island children had the 15.0 13.6
12.9
highest rates of non-fatal injury
10.2
as pedestrians in MVTCs, but 10.0 8.9
only around half the rate of injury
6.4
as vehicle occupants that Māori 4.8 3.9 4.0
children had. 5.0 2.1 3.9
1.4 1.0
0.4 0.0 0.1 0.3 0.5 0.5
0.0
Asian European/Other Pacific Island
Ethnic group
Source: The National Injury Query System (NIQS): Injury Prevention Unit, University of Otago,
http://ipru3.otago.ac.nz/niqs/.
38
While the differences in non-fatal MVTC injury rates were not significant at a 0.05 level between the 0-4 and 5-9 age groups, or between the 5-9 and
10-14 age groups, they were significantly different between those aged 0-4 and 10-14 (95% CI upper bound for those aged 0-4 was 24.8 per 100,000,
while the lower bound for those aged 10-14 was 37.9).
39
95% confidence intervals did not overlap, meaning that rates of non-fatal injury were significantly different at a 0.05 level (upper bound for females
was 27.8 hospitalisations per 100,000, while the lower bound for males was 33.1). There was not a statistically significant difference in fatality rates
between genders at a 0.05 level.
Child Unintentional Deaths and Injuries in New Zealand, and Prevention Strategies 25You can also read