THE ROAD AHEAD - ECONOMIC DEVELOPMENT STUDY ON STATE HIGHWAY 3 NORTH FULL REPORT VENTURE - VENTURE TARANAKI
←
→
Page content transcription
If your browser does not render page correctly, please read the page content below

THE ROAD AHEAD

Economic Development Study on State Highway 3 North
                     FULL REPORT

                           Venture
                   TARANAKI
                   Te Puna Umanga
                                            THE ROAD AHEAD   A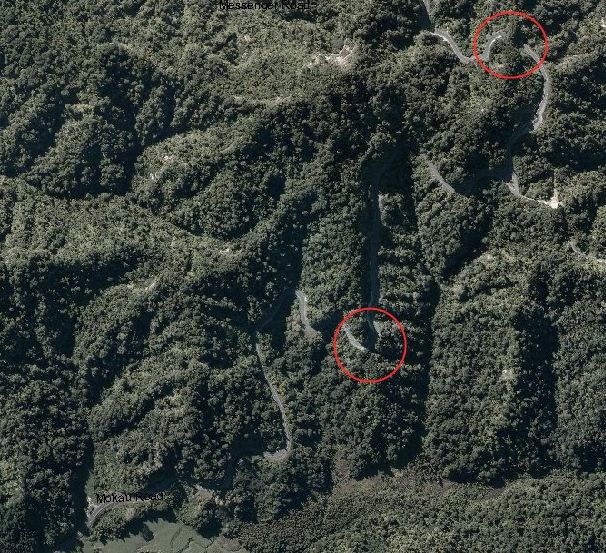
“This report is as much about
           changing attitudes to our
infrastructural funding as it is about
 driving economic transformation.”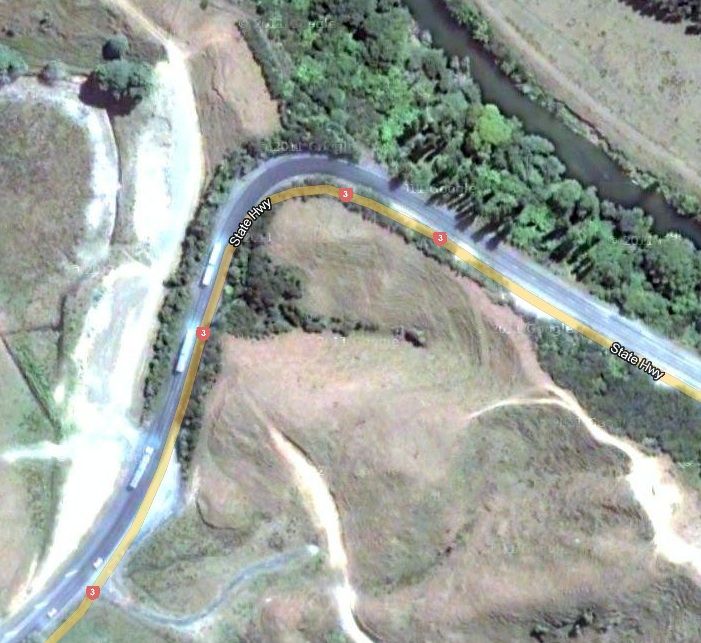
THE ROAD AHEAD i

Executive Summary

ii   THE ROAD AHEAD
THE ROAD AHEAD iii
iv THE ROAD AHEAD
THE ROAD AHEAD v

vi THE ROAD AHEAD

THE ROAD AHEAD vii
viii THE ROAD AHEAD
THE ROAD AHEAD ix
x THE ROAD AHEAD
Table 1 Summary of Report Recommendations
                                                                                                                                                                                         Timetable

                 Remedies                   Description                                    Actions                                                     Costs           2012-2013   2014-2015   2016-2025   2026-2055
                 Fix Vickers bottleneck     Enhance eastern access to New Plymouth          • Design and construction can be achieved in 3-5 years     $8-$14m
                                            (includes Waiwakaiho bridge)                      with government support.
                                                                                            • Hold Government accountable.
                 Route maintenance          Ensuring SH3 is maintained/enhanced             • Investigate past and current maintenance investment
                                            to an acceptable standard and that there        • Understand and influence future levels of service
                                            is confidence in the road maintenance           • Account for damage to vehicles/trucks – discuss
                                            system.                                           reinstatement of this evaluation criteria
                                            i.e. that SH3 pavement quality, bridge
                                            abutments etc achieve to a minimum
                                            standard.
                 Make the route safer       More passing opportunities and other            • Review, discuss, progress passing lane study sites and   $3.4m+
                                            route improvements such as road shoulders         route areas requiring attention.
                                            Enhanced route maintenance.                     • Investigate funding options e.g. block project funding
                                                                                              possibilities for the construction of passing lanes.
                                                                                            • Ensure maintenance and safety service levels and
                                                                                              strategies encompass Taranaki’s unique economic
                                                                                              factors and and route utilisation considerations e.g.
                                                                                              O&G industry, heavy engineering.

                 Relieve specific           Widen existing tunnels, open tight corners      • Review and progress Beca report on widening SH3          $5m
                 constraints                                                                  Awakino and Mount Messenger tunnels
                 The next constraint        Identify and quantify the next constraint       • Opportunity to be established.                           To be demon-
                                            with SH3                                                                                                   strated
                 Review of Funding          Seek a mechanism to ensure that there           Discussion and decision with Government on the             To be deter-
                 Scheme for regional        is ongoing incremental improvement in           future funding scheme for regional roads. An ‘R Fund       mined
                 roads (R-Funding)          the transport networks of regions such as       equivalent’ type source will be essential.
                                            Taranaki’s beyond 2015.
                 Long term strategic and    Economic transformation of Taranaki region      Strategic conversation with Government on:                 To be deter-
                 policy changes fostering   and nation, utilising road/infrastructure as    • Infrastructure as driver of economic development         mined
                 inter-generational         driver.                                         • R-funding
                 economic development                                                       • Policy and funding formula for infrastructure
                 transformation                                                             • Taranaki’s position in national economy
                                                                                            • Transformational strategies for regional and national
                                                                                              economic development

                 TOTAL*                                                                                                                                $16.4 -$22.4m
                 * Estimate of quantified
                   projects only

THE ROAD AHEAD
                      These recommendations relate only to SH3 (North). They exclude the projects relating to SH3 (South) such as the Normanby bridge and the HVMP route
                                   improvements, which are also considered critical for the region but are not included in this report, for the above reason.

xi
FORWARD
Detailed
Independent Analysis
in association with NZIER and Beca
xii THE ROAD AHEADContents
Detailed Independent Analysis 3.2.3 Safer Journeys — New Zealand’s road
Key Findings 3 safety strategy 2010–2020 30
1. Background 9 3.2.4 The NZ Transport Agency’s funding
allocation framework 30
1.1 Overview 9
3.2.5 State highway classification project 31
1.2 Context 9
3.2.6 Maintenance of SH3 31
1.3 Study approach and aims 9
4. The relationship between SH3 and
2. The SH3 corridor 10
Taranaki development 33
2.1 Description of the corridor 10
4.1 The Taranaki economy 33
2.2 The region’s views about the corridor 11
4.2 Oil and gas sector and energy
2.2.1 Venture Taranaki’s 2011 perceptions study 11 network resilience 34
2.2.2 Initial stakeholder survey undertaken 4.3 The heavy engineering sector,
for this study 11 and oversized loads 36
2.2.3 Survey of effects following 1997 Awakino 4.4 Dairy 38
Gorge slip 12
4.5 Forestry 38
2.3 Is there a current SH3 corridor investment
5. A framework for economic
strategy? 12
development 39
2.3.1 State Highway Classification 12
5.1 Introduction 39
2.3.2 Passing lanes 14
5.2 Role of project appraisal 39
2.3.3 2002 Mount Messenger study 16
5.3 Prevailing economic appraisal methods 39
2.3.4 The ‘Blue Highway’ strategy 16
5.3.1 Measuring ‘user benefits’ 39
2.3.5 The ‘East-West’ corridor concept 17
5.3.2 Prevailing appraisal methods
2.3.6 The Waikato Inter-Regional Transportation alleged ‘good enough’ 40
Study (IRTS) 17
5.3.3 The case for ‘wider economic benefits’
2.3.7 The SH3 Vickers Road to New Plymouth (WEBs) 40
City project 17
5.3.4 The NZTA’s ‘National Strategic Factors’ 42
2.4 Transport use 18
5.4 Additional factors to consider in a
2.4.1 Introduction and summary 18 general SH3 appraisal 43
2.4.2 General use of SH3 compared 5.4.1 Growing the economy by making
to similar routes elsewhere 18 a step-change improvement to SH3 43
2.4.3 Daily traffic analysis 21 5.4.2 Supporting exporters 47
2.4.4 Closures on SH3 23 5.4.3 Addressing the circularity of transport
and economic development 47
2.4.5 Other highways closures
as a cause for volume spikes 24 6. In summary 49
2.5 Safety performance 25 7. References 51
2.5.1 Safety rating 25 Appendix A
2.5.2 Risk 26 Initial stakeholder survey responses 53
3. Policies relating to the SH3 corridor 28 Appendix B
3.1 Economic development strategy 28 Box and whisker data 60
3.2 Transport strategies and funding policies 28 Appendix C
3.2.1 GPS on Land Transport Funding 28 Comparison of closures on other state highways 61
3.2.2 Connecting New Zealand 29 Appendix D
Indicative cost estimates to widen
SH3 for oversized loads 62
THE ROAD AHEAD 1Figures
Figure 1 SH3 corridor New Plymouth to Waikato 10
Figure 2 Three stage process for the SH Classification system 13
Figure 3 NZTA’s State Highway Classification (North Island) 13
Figure 4 Mokau to SH3A passing lane study sites 15
Figure 5 Corridors considered in 2002 for alternative Mt Messenger route 16
Figure 6 Waikato SH3 road use 19
Figure 7 Taranaki SH3 road use 19
Figure 8 Annual average daily traffic – vehicle flows 20
Figure 9 Daily SH3 traffic counts 2007-2011 21
Figure 10 Box and whisker chart for all traffic 21
Figure 11 Daily SH3 heavy traffic counts 2007-2011 22
Figure 12 Box and whisker chart for heavy traffic 22
Figure 13 Traffic growth indexes 23
Figure 14 SH3 closure causes 2008-2011 (Taranaki & Waikato) 23
Figure 15 Waikato only section of SH3 closure causes 2001-2011 24
Figure 16 Waikato SH3 safety ratings 25
Figure 17 Taranaki SH3 safety ratings 26
Figure 18 National strategic criteria 31
Figure 19 Regional strategic criteria 31
Figure 20 State highway road condition index 2012/13 32
Figure 21 Taranaki Performance 2000-2010 33
Figure 22 National gas pipeline network 35
Figure 23 Benefit from a travel cost reduction 39
Figure 24 Awakino Tunnel and easing of corners north and south 44
Figure 25 Mt Messenger tunnel daylighting and easing of corner south 44
Figure 26 Standard benefits + economic growth benefits 45
Figure 27 Undiscounted benefits over 30+30 years 46
Figure 28 Discounted benefits over 30+30 years at 4% 47
Figure 29 Potential circularity of transport investment 48
Figure 30 Average responses to importance of enhancement 53
Figure 31 The region will be better linked to the rest of New Zealand 54
Figure 32 It will be easier for visitors to travel between regions 54
Figure 33 Average responses to impacted industries 55
Figure 34 Average responses to impacted industries 55
Figure 35 Average responses to importance of improvement options 56
Figure 36 SH3 as a barrier to economic development 56
Figure 37 SH3 as a barrier to future economic development 57
Figure 38 Time to feel benefits of upgrade 57
Figure 39 Impact of SH3 on recreation 58
2 THE ROAD AHEADDetailed Independent
Analysis –
Key Findings
Venture Taranaki Trust commissioned NZIER (with support by Beca Infrastructure) to
review the case of investing in State Highway 3 (SH3) to improve long-term benefits to
New Zealand as a whole. This report describes the evidence and analysis from
their independent economic review. This section sets out their key findings and assessment
from the body of the main report, allowing readers access to the core elements of their
review and the remedies that they propose.
Overview in the first place. There is an issue of circularity that needs to
be addressed. A better route north may attract more activity
State Highway 3 between New Plymouth and the upper to the region by making more productive opportunities
North Island is the only direct major road link between viable for businesses and households. These wider benefits
Taranaki and the north. The route has stretches where there would come hand-in-hand with increased use of the route.
are no passing lanes, where the road surface is uneven to
be unsafe, where it is so narrow larger loads cannot pass It is possible that increased demand may be sufficient to
through and sections that are accident prone. This results in elevate SH3 in the national funding tournament. If a way
several problems, a poor safety performance, restrictions on can be found to test the notion that roading investment can
large trucks, a lack of safe passing opportunities, and poor influence future demand, then it is a reasonable move to
network resilience to closures. undertake carefully planned investment.
SH3 struggles to make a case for significant new investment One way to do this is to deal with a limited number of the
under the government’s current transport funding factors that most restrict development. SH3 is uniquely
framework. The current investment framework targets positioned to be made more supportive of economic
unmet high levels of real traffic demand. Our review of development without high upfront costs. The factors that
previous studies and the data available has not revealed most constrain development are few. Widening/‘daylighting’
enough concrete evidence to justify a case for significant the two narrow tunnels, straightening tight corners, and
investment in SH3 under this framework. This is because the providing safe passing opportunities would cost less than
use of SH3 is materially lower than similar routes. $10 million. In an upside scenario these improvements
would encourage traffic growth sufficient to return costs
Decisions on transport funding are made using a periodic several times over. Even in a downside scenario the longer
national tournament of roading projects. Funding is not term benefits are expected to fully cover the costs.
determined on how good a project is in isolation, but on
whether it is better, relative to other projects competing for Other possible improvements to SH3 would complement
the same limited pool of funds. From a national perspective, this. These include ensuring SH3 in and out of New
there are currently enough capacity bottlenecks (particularly Plymouth is not a bottleneck and that the road surface is
in the major cities), and mandated priority spend (such as appropriate for heavy trucks.
the Roads of National Significance, or RoNS), to mean SH3
In summary, a package of incremental improvements to SH3
will likely not qualify for significant new spending without a
may induce additional traffic by opening up new productive
‘transformation’ of Taranaki to generate additional traffic.
opportunities to businesses and households. The upshot has
We understand this situation but suspect that the current a reasonable chance of being more in the national interest
state of SH3 is inhibiting possible development of economic than competing projects.
activities in Taranaki that might support the improvements
THE ROAD AHEAD 3Taranaki and SH3 A strategy for investment
A recent Venture Taranaki survey revealed that road transport Transport investments generally target where the need is most
connectivity to the upper North Island and to the east of
real and evident – typically where there is congestion. This
New Plymouth is Taranaki residents’ number one issue —
of all issues. The region is perceived as being particularly leads to roading investments being relatively safe bets, as it
isolated from the ‘golden triangle’ of Auckland, Hamilton fixes the problems.
and Tauranga. In the same manner as for Northland, Taranaki
neighbours these GDP growth engines but also like Northland However, these choices are not necessarily the best
it has a poor standard of road connectivity to them. However, investments that could be made. Other projects may ‘release
unlike Northland, Taranaki does not have an inter-regional a brake’ on a region’s development by opening up new areas
Road of National Significance in the pipeline. and providing new productive opportunities. If such a project
is successful in causing these kinds of ‘transformations’ the
While the New Plymouth area has shown strong growth benefits can in principle be of a larger order than for more
compared to national performance, the population growth of routine roading projects.
the Taranaki region has not kept up with major centres. The
growth in road-based freight between Taranaki and the upper The trade-offs with these more speculative projects are
North Island has been relatively low as well. The region does increased uncertainty and typically higher cost. They are riskier
have a high dependence on land transport - roads, energy because it is less clear what the long-term effects will be and
(gas) pipelines, and rail, to link products including dairy, with whether the uptake anticipated will occur. They are typically
markets. costly because multiple improvements to a network are often
needed to make the step-change improvements required.
Despite this regional setting, New Plymouth district has seen
strong, sustained growth in a number of economic indicators, In the case of SH3, however, an incremental approach
while overall regional growth has picked up recently with looks possible. We have identified a limited set of inter-
significant exploration going on in the oil and gas (O&G) related improvements that will likely cause a step-change
business. Dairy production is strong on the back of world improvement in accessibility. What is notable for SH3 is that
demand, and the heavy engineering sector in Taranaki despite these improvements being not unduly costly they
continues to compete nationally and internationally. would seem to have a chance of opening up the broader
development outcomes desired. Staging investment in SH3
Indications are that Taranaki will remain ‘home base’ for O&G in this way is a ‘learn by doing’ approach that can be used
exploration activities throughout New Zealand.1 to test support for the notion that a better SH3 route would
help grow the national economy via growth in Taranaki. This
We have identified supply side constraints with SH3 associated would buy the future option (i.e. flexibility) of additional
with trucking supplies from points north for the O&G sector investment to further grow and accommodate new activities
in Taranaki that will likely worsen with new discoveries related to the region.
requiring increasing levels of product handling and inputs. We
have also identified that O&G discoveries on the East Coast of
the North Island, now being further explored, will compound
this supply side constraint on SH3. TAG Oil are about to start
drilling on the East Coast and, while it is early days, they have
expressed concerns about the ability of SH3 to be an effective
and efficient route to link their exploration activities. TAG Oil
expect to be more definitive about their requirements by
mid-2013.
1
For instance, Shell’s new exploration campaign in the Great Southern Basin will continue to base its exploration, technical and support teams in New
Plymouth. ‘Taranaki base for southern search’ Taranaki Daily News, Friday, May 4, 2012, page 5.
4 THE ROAD AHEADThe incremental approach can be 2. SH3 north is difficult for freight, and particularly
developed along the following lines: restrictive for Taranaki’s world-class heavy
engineering industry: Various stakeholders, including
1. Identify real constraints on SH3 that limit the heavy vehicle operators have concerns about the standard of
growth in demand for the corridor. the road surface of SH3 route. Trucks are more susceptible
than cars to uneven surface conditions. Truck operators
2. Consider if there is a subset of those constraints
are concerned about rough bridge abutments, the uneven
that are (or potentially are) particularly binding,
pavement surface, the lack of road shoulders with the damage
and that can be relieved with modest cost to cause
done to the freight itself, the driver fatigue caused, and the
a real and perceived step-change improvement in
premature deterioration caused to the truck bodies. Trucking
accessibility to the entire route. The key element of this
industry costs are up to 30% higher on SH3 north (for normal
analysis will be to consider what an upside scenario
travel) compared to other routes.
from the improvements would look like, and the scale
of benefits that might result from the step-change. The limitations are more severe for oversized trucks: the two
tunnels and some isolated tight corners prevent oversized
3. Undertake projects identified that most bind
trucks from using the route. This more than doubles the cost
the long-term growth in demand in a single broad
of moving oversized freight, which particulalry affects the
programme of work. (Essentially this would be an
O&G and heavy engineering sectors in particular.
all-or-nothing strategy as the gains are only unlocked
when all the constraints are relaxed.) 3. New Plymouth’s issues with its eastern arterial
corridor are similar in kind to the major urban
4. Monitor and review progress to confirm that
centres. Per dollar spent it is no different in kind
demand for SH3 is in fact growing.
from the urban RoNS: The ‘Vickers to City’ SH3 project
This ‘learn by doing’ approach would complement covers a bottleneck between the city centre and the eastern
other features of the transport system that includes suburbs where most of the industrial and residential growth
balanced transport priority settings and maintaining the is expected to occur.3 The preliminary findings of scheme
existing SH3 route to a reasonable minimum standard. investigations4 are that the project is economically viable and
is significantly effective at providing: (i) enduring congestion
relief in a main urban area, (ii) reliability improvements, and
Analysis of the most binding (iii) making freight supply chains more efficient. This project
differs from the RoNS only in terms of scale. Undertaking this
constraints scheme would avoid suppressing the speed of economic
NZIER has identified a small number of issues associated with development in the region to the extent this is a consequence
SH3 that have, or are perceived to have, a high impact on the of this particular bottleneck.
region. These issues have been investigated and we believe
− Historically the route has been prone to closures from slips,
that remedies, that is smaller step improvements to the route,
particularly in the Awakino Gorge. In more recent times
could be completed quickly and be justified on the basis that:
it has been the high crash rate that has caused the most
1. SH3 north is relatively unsafe: serious issues, particularly fatal incidents (section 2.4.3c)).
Addressing the severe safety shortcomings would improve
− SH3 north does not rate well in the ‘KiwiRap’ national real and perceived route security issues.
safety analysis. Much of the route between New Plymouth
and Hamilton is below average rating at 2 stars and no part − Statistical analysis undertaken in this study (section 2.4)
of it was rated higher than 3 [out of 5 stars]. finds that SH3 plays an important role to the north/south
lifeline for freight when the central North Island is closed by
− There is an extended stretch (79 km northbound and some snow and ice. Heavy truck usage spikes by the addition of
65 km southbound) with no passing lanes between Mt the equivalent of 50% of one day’s normal usage (which is
Messenger and Awakino Gorge and only limited lengths of spread over three days). Were SH3 to be closed at the same
safe passing distance.2 time then the national economic detriment could be serious.
− The road is subject to an increasing level of use by trucking − The October 2011 Maui pipeline outage5 curtailed supply
companies to move O&G products which exposes SH3 users of gas to large parts of the North Island for five days, which
to an additional level of hazard. For example, we were was a nationally significant event. The possibility of SH3
advised that trucks that transport LPG ideally need smoother being out at the same time as a Maui pipeline outage is a
pavement surfaces than currently exist on SH3. nationally significant risk. Stakeholders have advised us that
since the outage many firms have re-plumbed their sites to
be able to use bottled LPG in a similar event. Not only would
a coinciding SH3 outage make it much harder to resolve a
pipeline fault, it would severely curtail the emergency supply
of LPG bottles to the upper North Island.
2
The NZTA’s ‘Mokau to SH3A Passing Lanes Study’ 2012.
3
SH3 Vickers to City Investigation and Reporting Scoping Report, para 10.
4
Ibid. Para 18.
THE ROAD AHEAD 5The SH3 route north places other constraints on Taranaki’s 2. Widen the narrowest links:
economic development through features of its existing
configuration. These include the hill climb over Mt Messenger, − Widen/daylight the tunnels and address the remaining
and the continual threat of slips through Awakino Gorge. To constraints (such as tight corners and weak bridges) that
fully relax these constraints would require substantial capital prevent the majority of the oversized loads from using the
expenditure. routes.
Grouping of constraints and − Beca Infrastructure have estimated a total cost of just under
$5 million for tunnel widening/day-lighting and some corner
value for money – the remedies straightening along the route that are workable and probably
able to be consented. (Appendix D).
The groups of improvements that would make significant
improvements to the most binding constraints listed above are − Industry stakeholders told us that the cost to transport
described below, together with broad estimates of their value oversized loads to/from the upper North Island will reduce
for money: from about $9,000 to $4,000 for some 75 trips currently
occurring annually.6 Initial indications are that the standard
1. General safety improvements:
BCR would be between 1–1.7 for a 30-year appraisal
− multiple passing opportunities (lanes and slow vehicle depending on the ‘discount rate’ used (a parameter that
bays) on the long stretches of highway that currently represents how much the future matters).
have none:
If a long-term view is taken, and if the improvement causes the
• The NZTA’s ‘Mokau to SH3A Passing Lanes Study’
heavy engineering industry’s oversized output to increase by an
(January 2012) finds that these passing lanes have
additional 2% per year, then the BCR could be up to 5 or 6 —
healthy BCRs between about 2 to 3.8.
which is high. (Section 5.4.)
• Given the route has a relatively high proportion of
trucks that use it, more passing opportunities would − Improving the tightest of corners may also reduce the
help address the concerns of light vehicle drivers general risk of heavy truck crashes and incidents that
regarding the conflicts between trucks and cars. threaten route security, providing additional benefits. An
example here is a ‘medium-level’ accident when a heavy
− At a minimum the route should be specifically evaluated to
crane partially slipped off the road near the summit of Mt
determine what broad safety upgrades are required to keep
Messenger during the Maui gas pipeline outage.
the hazard potential from increased levels of freighting O&G
products at an acceptable level. 3. Addressing the SH3 bottleneck to the east of New
Plymouth:
− General safety improvements would also reduce the
incidence of route closures (refer to section 2.3.2): − Initial NZTA estimates are that the Vickers to City SH3
• This would give tangible transport benefits. Such improvements project:
benefits are of particular importance to SH3 but are not • will cost between $8.2–$14.5 million
included in the BCRs of the passing lanes because the • has a BCR between 2–4; and
social cost of crashes used by the NZTA excludes the cost • aligns with government policy (to the extent that a
of road disruption. capacity enhancing regional project could do so).
• Reduced closures would also affect perceptions of the
vulnerability of Taranaki’s lifeline north, which could affect − The project would (in part) address the number one issue
firms’ and households’ longer-term location decisions. raised in Venture Taranaki’s 2011 perceptions survey.
5
Further details can be found in the 2011 Maui Pipeline Failure Investigation Report at mauipipeline.co.nz.
6
This includes RUC (road user costs), on the assumption that it approximates the marginal damage done to the roads.
6 THE ROAD AHEADJointly undertake improvements, Complement the broader
wait and monitor, and then funding allocation framework
continue investing if long-term and asset maintenance
uptake occurs strategies
By making step-change improvements to SH3 (namely R funds: At present the ‘R funds’ facility guarantees a
to address safety, the perceived conflicts between cars minimum level of new investment in each region. R funds
and trucks, the transport constraints on Taranaki’s heavy are due to expire from 2015 and it is unclear whether
engineering industry, and the urban bottlenecks to the east this funding source will be extended or will cease at that
of New Plymouth), the region will likely grow faster and point. Maintaining minimum regional spending levels
contribute more to New Zealand’s wellbeing as a whole. is a way of continuing to support those projects that are
nationally beneficial because they address constraints that
However, uncertainty exists with any investment. The use suppress the attraction of activities to a region. As discussed
of SH3 by various kinds of travellers should be specifically above, projects such as SH3 are not well catered for in the
monitored and steps taken to attribute, to the best extent prevailing decision making frameworks, even though they
possible, any increased use of the route to the suite of may be particularly important for regional growth.
improvements.
If the investments are a success they will lead to more
people living, working and playing in Taranaki. Such
changes are structural in nature, and would compound
over many years. Any increased use of SH3 attributable
to the improvements would constitute as a ‘good news’
event (Grimes 2011). This would make further step-change
improvements in future more compelling for decision
makers. In this case the next set of constraints on the
route can be identified and new investment opportunities
learned.
Remedies in summary
We summarise our remedies as follows:
Table 1 Summary of SH3 Remedies
SH 3 Remedies Description Timeline Estimate Value for $
Route maintenance Ensure pavement quality, Ongoing More info Set standard to obtain
bridge abutments etc. to a needed VfM. Account for damage
minimum standard to trucks
Make the route safer Passing opportunities and Short – $3.4m+ BCRs ≈ 2–4. Conservative
other route improvements medium as they omit benefits from
such as road shoulders term less route closures
Relieve specific constraints Widen existing tunnels, open Medium ≈$5m BCR ≈ 1; up to 5–6
tight corners term
Fix Vickers bottleneck Eastern access to New Short term ≈$8 - $14m BCR ≈ 2–4 and
Plymouth complements other
remedies
The next constraint Identify and quantify the next Long term Opportunity To be demonstrated
constraint with SH3 to be
established
There is a reasonable case to investigate whether economic growth can be improved by making modest sized investments in
SH3. Specific constraints on the route can be resolved in a manageable, prudent, and incremental manner.
Step-change improvements in accessibility between New Plymouth and the upper North Island has the potential to attract
activities to the region. This relocation of activities is of national net-benefit when households and firms are given a wider range
of viable and attractive possibilities on where they can choose to live, work and play.
THE ROAD AHEAD 7Analysis Sections 8 THE ROAD AHEAD
1. Background
1.1 Overview                                                      1.3 Study approach and aims
State Highway 3 (SH3) plays a role in supporting both             This study is written in two parts.
Taranki region’s and the nation’s economic development.
Venture Taranaki Trust (Venture Taranaki) — the Regional          1. An initial evaluation of the issues, considering the existing
Development Agency — commissioned NZIER to undertake a            SH3 corridor strategy, initial stakeholder engagement, the
broad economic review of SH3.                                     transport investment policy framework, and the relative
                                                                  performance of the route — in a sense, this is a ‘situation
The ultimate and longer-term aim of Venture Taranaki is to        analysis’.
develop a robust business case of the strategic and wider
benefits of State Highway 3, that would provide justification     2. An analysis of the various factors that could strengthen
for increased investment in the highway.                          the economic case for investment, building on a critique
                                                                  of what current economic appraisal methods do and don’t
                                                                  capture. This would consider factors such as wider economic
1.2 Context                                                       benefits and broader economic development.

State Highway 3 is of strategic importance to Taranaki            NZIER’s focus in this report is on long-term economic
linking the region with main population centres, markets          development, rather than short-term. The troublesome
and import/export facilities to the north and south. It is the    present world economic climate and the 3-year transport
only inter-regional highway that directly connects Taranaki       programme currently under development are not of
to the regions’ north. The route helps ensure agricultural, oil   principle concern.
and gas and other products important to the regional and
                                                                  This study is intended to outline an ‘Indicative Business
national economy, get to processing and manufacturing sites
                                                                  Case’ akin to an ‘investment prospectus’ for more detailed
and from there to national and international markets.
                                                                  discussion with central government to think ‘differently’
The route is a key component in future growth plans to            and more receptively towards the importance of SH3 in the
grow the amount of freight through Port Taranaki (PTL)            national transport network.
and beyond to markets in Australia and Asia (the PTL’s
‘Blue Highway’ proposal, and Venture Taranaki’s ‘East-West
corridor’ concept). Success in these endeavours could
contribute significantly to New Zealand’s economic growth
and productivity.

Despite its importance SH3 is perceived by some people in
the region as a relatively low quality route that is subject to
closures, which suppresses its use. The Taranaki region has
been unable to gain funding that would make a significant
difference to the overall quality of SH3. This is a result of
limited funding availability, low traffic volumes on the route
relative to other inter-regional state highways, and the
difficult terrain and thus high development costs.

The belief is that there is more to the relationship between
SH3 and the Taranaki economy than is revealed through
traffic volumes and safety performance.

                                                                                                              THE ROAD AHEAD         9
2. The SH3 corridor
2.1 Description of the corridor SH3 [north] follows the coast from New Plymouth north to
Mokau where it crosses the river and winds inland eventually
The corridor of primary interest in this study is SH3 north meeting SH4 and SH 30 near Te Kuiti. While the whole route
which is the direct northern link between New Plymouth and is windy, narrow and is widely regarded as inadequate, there
the Waikato, as outlined in Figure 1. There are other indirect are two major constraints for SH3 users at Mt Messenger and
routes north to Auckland and Hamilton, and north-east also in the Awakino Gorge. We describe these constraints
to Tauranga using roads that are either narrower, and not and possible remedies in more detail in this report.
suitable for a range of users, or involve longer distances. The
southern aspect of SH3 relates not just to New Plymouth’s
connectivity to Waikato, but also further south and south
east in Taranaki.
Figure 1 SH3 corridor New Plymouth to Waikato
Awakino Gorge
Mt Messenger
10 THE ROAD AHEADSH3 has the following characteristics: 2.2 The region’s views about the
• it is the only arterial inter-regional route that directly corridor
connects Taranaki to the north
The standard of SH3 north is seen by residents as one of the
• a high proportion of vehicles that use the route are heavy biggest problems Taranaki faces.
commercial vehicles (HCVs) relative to other inter-regional
routes (up to 20% on some sections) 2.2.1 Venture Taranaki’s 2011 perceptions
study
• although the route is scenic, it passes through high risk
terrain, with slips common in the Awakino Gorge
In 2011 Venture Taranaki undertook a survey to gather the
• there is a conflict between cars and HCVs, with minimal perceptions of 400 Taranaki people and 200 non-residents
opportunities for safe overtaking, particularly between Mt concerning the region. The survey considered all aspects
Messenger and the north of Awakino Gorge of regional amenity. When prompted for ‘one wish for
• trucking company stakeholders and other industry Taranaki’ the main response was for better roading and travel
representatives that deal with large industrial equipment infrastructure — “sort out the roads”, especially SH3 North
inform us that the route is difficult for HCVs: and the Waiwhakaiho bridge bottleneck.
− significant sections of the route are steep and/ 2.2.2 Initial stakeholder survey undertaken
or windy (particularly Mt Messenger and Awakino
for this study
Gorge)
− the two narrow tunnels on the route prevent A further survey of businesses and households in Taranaki and
moderately oversized loads from using the route, neighbouring regions was undertaken to establish:
which substantially hinders the ability to supply inputs
• how SH3 affects Taranaki’s overall attractiveness
to the heavy-industry firms in Taranaki and for them
to compete with other firms in the upper North Island • the industries thought to be most affected by SH3
and in Australia as well
• how firms think SH3 matters to them
− there are issues with the quality of the road
pavement, including claims that the surfaces are wavy • what improvements people want to SH3
and inconsistent; there are long stretches without
shoulders, which reduces any room for error; and the • whether SH3 is limiting Taranaki’s growth now and in the
run-ups to some bridges (‘bridge abutments’) are future
bone-jarring for drivers, their trucks and their cargo. • how quickly the region would benefit from a marked
• there is less network resilience to an event (such as a slip or improvement to SH3
crash) for several reasons, including: • whether the quality of SH3 affects recreational/leisure travel.
− there are few or no convenient alternative routes to There were 321 responses and detailed results can be found in
deviate around an incident for much of the distance Appendix A. The key findings are that respondents believe that:
− the distance to emergency services is significant • SH3 affects Taranaki’s overall attractiveness. A substantial
causing slow response times (the closest are based in improvement to SH3 would, it is believed, better link Taranaki
Urenui, about 25km north of New Plymouth) to the rest of the New Zealand. It is also thought it would
− cellphone and radio coverage is limited on those make it easier for visitors to travel between regions
sections of the route most prone to events, hampering • the transport and tourism industries will experience the
emergency services’ effectiveness. most significant gains
In recent years a suite of improvements has been made to • businesses, on average, would experience a low to medium
SH3 on the Waikato side, including corner straightening, impact on growth of their operations from a marked
passing lanes added, the Awakino tunnel widened, and improvement to SH3. Such benefits may come about via
better signage. The view of Taranaki people is that this was improved access to upstream markets (suppliers/inwards
beneficial, but that more is needed, particularly on the goods) and to new and existing markets for the goods and
Taranaki side of the regional border. services they produce
THE ROAD AHEAD 11• the improvements that would achieve the most were: The NZTA’s current State Highway Classification process will,
reducing the risk of closure due to slips, better maintenance of in time, outline expectations for the level of service for this
the road surface, and increasing the number of passing lanes route. We understand that when that process is complete
the NZTA is planning to undertake a study of the entire SH3
• the current state of SH3 holds back the region’s current (Hamilton – New Plymouth – Woodville (in the Wairarapa))
and future economic development, and that Taranaki would to determine what upgrades are possible.
immediately benefit from a marked improvement to SH3
There are a range of studies and projects that relate to the
• SH3 suppresses recreational/ leisure travel north. These SH3 corridor, including: possible improvements to stretches
respondents are more inclined to visit areas south instead of of the route (such passing lanes, and realignments over Mt
to the north due to the condition of the road and the slower Messenger); new uses of the corridor (the Blue Highway,
average speeds. and more indirectly, the ‘East-West’ corridor concept); and
the 2009 Waikato Inter-Regional Transportation Study. This
2.2.3 Survey of effects following 1997 Awakino section summarises each of those studies.
Gorge slip
2.3.1 State Highway Classification
On March 12–19 1997 a slip just north of Awakino township
closed the SH3 route. Taranaki Regional Council (TRC) a) What the classification system is and what it does
estimated some of the economic costs of the slip at more than In May 2011 the NZTA released its State Highway
$235,000 per day (in 2010 dollars) , plus intangible costs.7 Classifications to prioritise the national state highway network
based on their function. The categories are national strategic
TRC (1997, p16) said that many comments were made that (with a high volume subset), regional strategic, regional
the slip would have negative effects by strengthening the connector and regional distributor.
perception that Taranaki is isolated and inaccessible:
NZTA intend to use the classifications to guide investment
It was noted that Taranaki is already seen as being a difficult decisions. The NZTA’s challenge is to achieve the
place to get to and that that perception is reinforced by events government’s aim for land transport to boost New Zealand’s
such as the slip… Others noted that the disruption caused by economy by moving people and freight more safely and
road closures weakens business confidence and undermines efficiently within existing budgets.
the efforts of those seeking to attract businesses and enterprise
to Taranaki. The classification system is a programme of work intended to
result in prescribed levels of service or road user experience
The section that was affected by the slip in 1997 has since been that each class of highway should offer (in Figure 2 below,
realigned to a higher speed section away from the threatening stage 2 is currently underway). In turn these [target] service
hill. levels will inform the design, maintenance and operations
needed (stage 3 in Figure 2 below).
2.3 Is there a current SH3 corridor
investment strategy? b) SH3’s classification
State Highway 3 has been designated as a ‘regionally strategic’
NZIER sought to establish whether a SH3 corridor
highway (which is third tier if the ‘high volume’ National
improvement strategy existed, and if so, what its key features
Strategic class is counted as a separate category).
were.
In 2000 Transit NZ undertook a corridor strategy study for
the Mokau to New Plymouth section of SH3. The study
preceded the 2002 Mt Messenger study summarised in
section 2.3.3 below. The need for passing lanes was noted,
as well as a bypass of Bell Block that has since occurred. A
range of route alignment options was identified, and remain
as options.
7
TRC (2011) and TRC (1997).
12 THE ROAD AHEADFigure 2 Three stage process for the SH Classification system
2. Road user
1. Function experience 3. Design
or level of service
Source: NZTA, www.nzta.govt.nz/planning/process/state-highway.html#planning
State Highway 3 has been designated as a ‘regionally strategic’ highway (which is third tier if the ‘high volume’ National Strategic
class is counted as a separate category).
Figure 3 NZTA’s State Highway Classification (North Island)
Source: NZTA
THE ROAD AHEAD 13What this means in terms of the expected quality of the We note that these BCRs are likely to be conservative
road is yet to be determined. How the trade-offs between because they omit the benefits of reducing accident-induced
the service standards for ‘regional strategic’ roads traffic delays. The value of a crash saved included relates
nationally and the need for value for money from each only to the people who would have been involved, property
investment will be judged is unclear. damage and the cost to emergency and health services.
It does not include the cost of congestion and delays to
2.3.2 Passing lanes other travellers. This is a particularly important issue in
the context of SH3 because, as shown in section c) below,
The NZTA have studied the possibility of passing lanes for
crashes are the leading cause of SH3 closures. These route
SH3 between Mokau and south of Mt Messenger (Mokau to
closures disrupt existing traffic, and undermine the people’s
SH3A Passing Lanes Study, January 2012). This underpinned
perceptions about transport security to Taranaki as a whole.
a funding request in the current Regional Land Transport
Programme (RLTP) funding round. Accident-induced traffic delays are excluded from the cost
of crashes, not because in principle they should be, but
There is an extended stretch (79 km northbound and
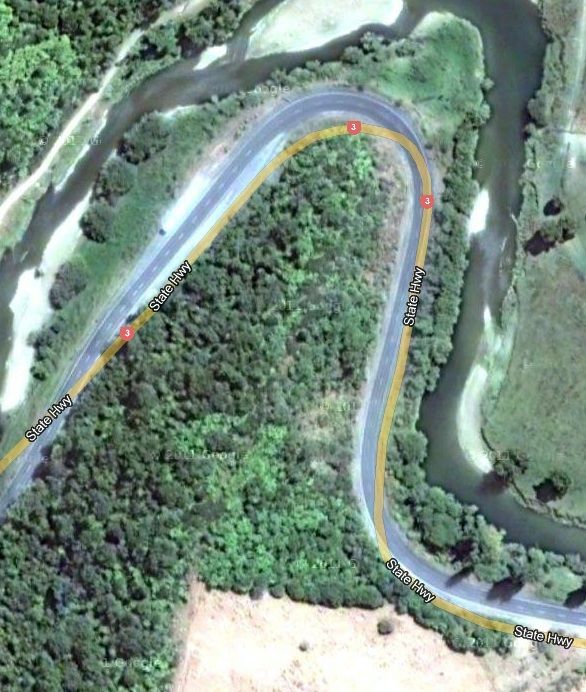
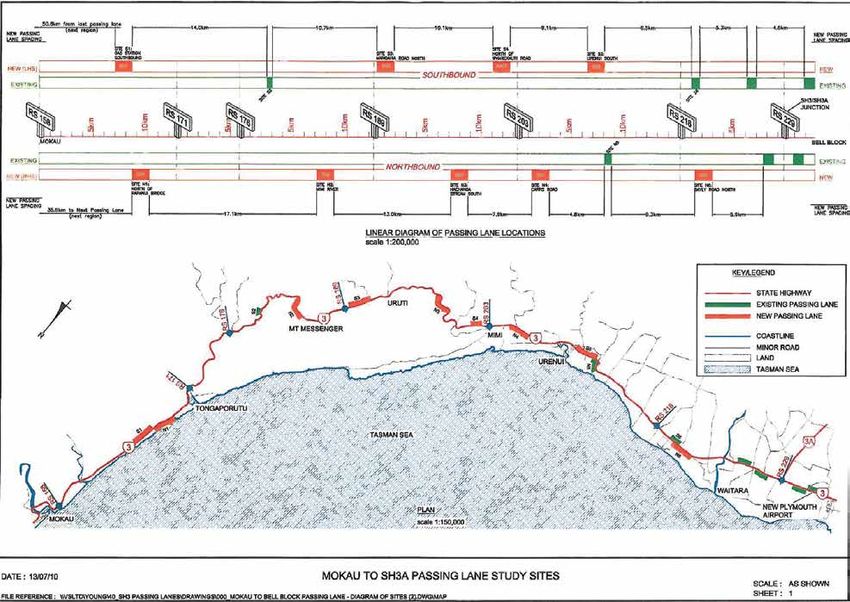
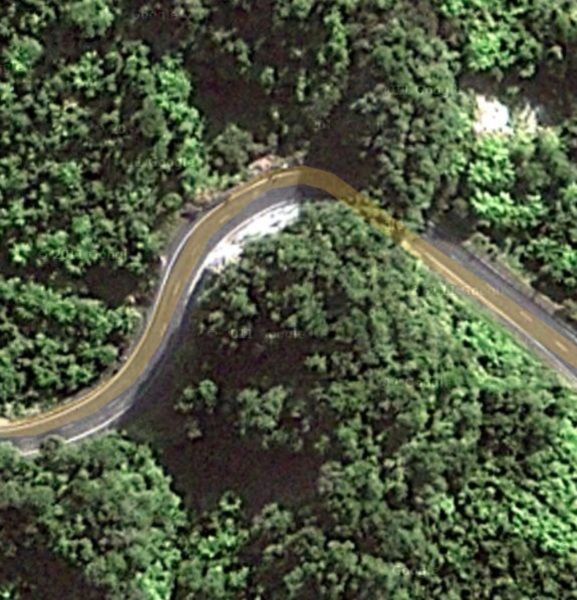
because of the lack of a workable standardised methodology
some 65 km southbound) with no passing lanes between
to do so. NZIER (1999) found that there is a lack of
Mt Messenger and Awakino Gorge (Figure 4 below) and
comprehensive estimates for the average delay per incident,
only limited lengths of safe passing distance. The passing
by road and by time of day.
lanes study found that the various alternatives, which are
illustrated in Figure 4 below, have healthy BCRs of between Although it is difficult to standardise a nation-wide
about 2 to 3.8. methodology for including the cost of route closures from
crashes, this does not rule out considering the effect on
specific routes like SH3 where it is a particularly important
issue.
14 THE ROAD AHEADFigure 4 Mokau to SH3A passing lane study sites
THE ROAD AHEAD 15Figure 5 Corridors considered in 2002
for alternative Mt Messenger route
Source: Beca (2002)
2.3.3 2002 Mount Messenger study 2.3.4 The ‘Blue Highway’ strategy
In 2002 Beca undertook a preliminary investigation to Port Taranaki Ltd are in the latter stages of planning and
identify a route corridor that may be worthy of detailed appraising their ‘Blue Highway’ strategy. The proposition is to
investigation to provide a ‘safe, efficient and secure provide a regular shipping service between Nelson and New
alternative to the present route of Mt Messenger’. Plymouth to cater primarily for long distance north-south
freight journeys (e.g. between Auckland/Waikato/Bay of Plenty
Three alternative alignments were considered relative to and Christchurch).
the current route. The ‘Western Route’ was considered
the best of the alternatives — an alignment that simply The Blue Highway concept does not hinge on whether
goes right up the middle of Mt Messenger. It had the least public investment is forthcoming to upgrade any related
environmental detriment and the most route security, infrastructure links8. PTL are currently working to secure a
and it had the highest benefit-cost ratio, of 0.8. However partnership with a shipping operator (possibly an existing
benefits were less than costs. This is because of the high New Zealand-based firm) and with existing trucking operators.
capital costs relative to the volume of vehicles using the
route. Beca advise that an updated BCR would likely be If this idea proceeded and performed as planned, it would
lower, given that the cost to construct will have increased likely increase the average trucks daily on SH3 from 50 to 80.
since 2002 more than the benefits would have grown There is a possibility of the ‘empty container industry’9 using
(because of the low rate of traffic growth). the route, which could triple these figures in the high-season.
PTL are not banking on this latter possibility, however, because
As a consequence of this study no major capital works the relevant industry will not commit in advance.
improvements have been, or are proposed for Mt Messenger.
The capacity of SH3 is not viewed as a constraint on the
viability of the Blue Highway proposal. However, any strategy
to improve freight accessibility on SH3 north will complement
the proposal, improving its prospects.
8
A previous study (WWC 2010) indicated that $15 million of national funding was required to upgrade a state highway link beside the
port, but PTL inform us this is not strictly necessary for the proposal to be commercially viable.
9
This is an industry that relocates empty containers to where they are next needed.
16 THE ROAD AHEAD2.3.5 The ‘East-West’ corridor concept 2.3.7 The SH3 Vickers Road to New Plymouth
City project
Venture Taranaki commissioned BERL to consider the
indicative economic viability of an ‘East-West corridor’ to The ‘Vickers to City’ project is outlined on page 28 of the
connect freight from Hawke’s Bay/Manawatu/Taranaki to draft Regional Land Transport Programme (draft RLTP). The
Melbourne/Sydney via a frequent, quality shipping service to/ ‘Vickers to City’ SH3 project is a package of initiatives to
from New Plymouth. address bottlenecks between the city centre and the eastern
suburbs where most of the industrial and residential growth
BERL (2009) found that such a service would provide is expected to occur11. An additional lane to the Waiwhakaiho
substantial economic benefits from reduced freight costs and bridge to make it four lanes is a key aspect of the project,
new trade opportunities. The proposition is premised on given the result of Venture Taranaki’s 2011 Perceptions Study
reasonably high-capacity state highways running east to west about that specific bottleneck (section 2.2.1 above).
across the middle North Island, and a frequent and reliable
shipping service. The preliminary findings of scheme investigations12 are
that the project is economically viable and is significantly
Any improved SH3 links to the upper North Island may relate effective at providing enduring: (a) congestion relief in
to the East-West corridor concept indirectly in two ways: a main urban area, (b) reliability improvements, and (c)
making freight supply chains more efficient. Aside from its
• the direct effect of SH3 upgrades may be to increase the
smaller scale (both in terms of the effects and its costs), this
attractiveness of trans-Tasman freight movements via Port
project has many similarities with the urban RoNS, such as
of Taranaki to the upper North Island, contributing to the
‘Wellington to Levin’. Given the forecast growth in the area,
viability of the East-West concept
undertaking the scheme would likely avoid suppressing the
• improvements to SH3 will complement the Blue- speed of economic development in the region to the extent
Highway, which if undertaken would increase service that is of consequence.
standards at the Port. There would be investment in
Work is underway to plan and appraise the project.
infrastructure (e.g. ‘Roll on roll off’ (RORO) facilities
Indicative estimations of cost lies between $8.2–$14.5
and possibly empty container storage), and possibly an
million. Given it is scored ‘medium’ for both strategic fit and
increase in attractiveness to international services.
for ‘efficiency’13 it means the project aligns with government
2.3.6 The Waikato Inter-Regional policy and that its BCR is expected to be between 2–4.
Transportation Study (IRTS)
We would make the following observations about this
Hyder Consulting (2009) undertook the Waikato IRTS project as it relates to the broad connection to the upper
for Environment Waikato. This was an extensive study North Island:
that developed a plan for inter-regional transportation
• improving Taranaki’s road transport link to the upper
network into and through the Waikato region. It proposed
North Island depends not only on the inter-regional
an evaluation framework that could be used to prioritise
parts of SH3 but on the ability of the route to penetrate
development of the inter-regional corridors including
the region’s major city. Thus any strategy to improve
SH3. The Waikato IRTS scored various corridors against
SH3 overall is complementary to the Vickers to City
the evaluation criteria in each of the 2008 and 200910
project, in that doing any one aspect of a package of
Government Policy Statements (for the medium term) and
works increases the need for the others to be done.
the New Zealand Transport Strategy (for the longer term) to
establish a priority schedule of routes. • it is important that urban arterial improvements
are not done on a piece-meal basis. The land use
The SH3 corridor connecting Taranaki to Waikato and
changes induced can cause more traffic, and if the rest
beyond scored a little below average in that evaluation.
of the neighbouring transport network is not up to
This finding related to the low traffic volumes on SH3
scratch this can worsen congestion14. This longer-term
relative to the major routes connecting Hamilton to
impact on congestion can make the partial initiatives
Auckland (the Waikato Expressway) and connecting these
implemented net-detrimental. That is, it is possible that
two cities to Tauranga. The study recommended that the
it would be better to not do anything at all than to do
focus for SH3 be on safety improvements and passing lanes.
such a corridor upgrade half-heartedly.
10
Issued under Labour-led and National-led governments respectively.
11
SH3 Vickers to City Investigation and Reporting Scoping Report, para 10.
12
Ibid. Para 18
13
Section 3.2.4 explains these terms.
THE ROAD AHEAD 172.4 Transport use 2.4.2 General use of SH3 compared to similar
routes elsewhere
2.4.1 Introduction and summary
Figure 6 and Figure 7 illustrate the use of sections of the
Is the use of SH3 particularly volatile? Does SH3 serve SH3 route between New Plymouth and Hamilton. Traffic
as a default north-south route when the central plateau between Urenui and Piopio is most likely to be longer
routes (SH1 and SH4) are closed? Are there quite different distance inter-regional travel. The data shows that the
patterns between cars and trucks using the road? annual average daily traffic (AADT) for this section of SH3
Answering these questions can help understand how SH3 has relatively low traffic volumes, with between 15%
is used and if there are any unique issues that possibly and 20% of the traffic being heavy, and has not grown
need addressing. significantly over the last five years.
NZTA provided daily traffic counts from the Tongaporutu A share of up to 20% for HCVs is high relative to the bulk of
telemetry site located on SH3 north of Mt Messenger to the state highway network. Data is available on the NZTA
help us consider the questions above. These are split by website16. This shows that 20% HCV share is near the upper
cars and heavy vehicles for the five calendar years 2007 to limit of what the network normally experiences. In the
2011. (Data going back further than this is unavailable.) central North Island the share of HCVs gets up to 22.3% on
NZTA also provided us data on closures on routes in the the Desert Road, but on the majority of sites on the state
region, their causes and durations. highway network is less than 15%.
In summary this data shows that: The sections of the road that are closer to Hamilton or
New Plymouth exhibit higher daily traffic volumes, and
• growth in the use of SH3 for inter-regional travel has
increased levels of heavy traffic (although the HCV share of
stagnated over the past five years for cars15 and for
traffic is lower).
trucks
• SH3 is used as an alternative north-south arterial for
trucks when State Highways 1 and 4 in the central
North Island are at risk of closure from snow and ice
• the use of SH3 is volatile, particularly for cars, and a
leading cause seems to be nationally-significant tourism
events in Taranaki
• truck use had a slight dip at about the time of
economic downturns but has since recovered
• since 2008 SH3 closures have largely related to
crashes.
14
This dynamic is not well understood in the transport planning literature. Induced land use changes currently have a very limited role in transport
modelling, and essentially no role in the formal economic appraisals of transport schemes.
15
Or more generally all non-truck traffic.
16
Statistics on this can be found here: www.nzta.govt.nz/resources/state-highway-traffic-volumes
18 THE ROAD AHEADFigure 6 Waikato SH3 road use
AADT 2006 -‐ 2010
2006
2007
2008
2009
2010
%
Heavy
2,874
3,107
3,025
3,160
3,240
16.6
AADT 2006 -‐ 2010
2006
2007
2008
2009
2010
%
Heavy
2,127
2,182
2,106
2,162
2,139
20.6
AADT 2006 -‐ 2010
2006
2007
2008
2009
2010
%
Heavy
6,904
6,843
6,764
6,865
6,846
15.3
Figure 7 Taranaki SH3 road use
AADT 2006 -‐ 2010
2006
2007
2008
2009
2010
%
Heavy
2,095
2,093
2,047
2,207
2,077
17.3
AADT 2006 -‐ 2010
2006
2007
2008
2009
2010
%
Heavy
2,930
3,101
3,100
3,113
3,192
13.5
AADT 2006 -‐ 2010
2006
2007
2008
2009
2010
%
Heavy
12,067
12,868
13,168
13,584
13,482
7.2
Source: NZTA
THE ROAD AHEAD 19Figure 8 below shows that SH3’s traffic volumes are low relative to other ‘regional strategic’ roads (Figure 3 on page 12). The
5-year average annual daily travel (AADT) on the mid-section of SH3 between Taranaki and Waikato is about 2,150 vehicles,
whereas most other routes of the same class have 3,000–10,000 AADT. 2.4.3 Daily traffic analysis
Figure 8 Annual average daily traffic – vehicle flows
Source: NZTA, www.nzta.govt.nz/consultation/classification-system
20 THE ROAD AHEADYou can also read