An overview of electricity consumption and pricing in South Africa An analysis of the historical trends and policies, key issues and outlook in 2017
←
→
Page content transcription
If your browser does not render page correctly, please read the page content below

An overview of electricity consumption
and pricing in South Africa
An analysis of the historical trends and
policies, key issues and outlook in 2017
Report prepared for Eskom Holdings SOC Ltd
Date: 24 February 2017
Disclaimer
This Report is prepared by Deloitte Consulting Pty (Ltd). ‘Deloitte’ who was engaged by Eskom Holdings SOC Ltd.
‘Eskom’. Deloitte does not accept any duty of care, to any other person or entity other than Eskom. The Report has been
prepared for the purpose set out in the Engagement Letter between Deloitte and Eskom.

Deloitte understands that Eskom will potentially provide a copy of this Report to the National Energy Regulator of South
Africa (NERSA) in support of their upcoming tariff application. We agree that a copy of our Report can be provided to
NERSA and also released publicly on the basis that it is published for general information only and that we do not accept
any duty, liability, or responsibility to any person (other than Eskom) in relation to this Report.

Recipients of this Report should seek independent expert advice as this report was not prepared for them or for any other
purpose than that detailed in the engagement terms with Eskom and cannot be relied upon other than for this.

This report is based largely on publically available information. We have not audited the information, nor do we provide
any assurance on the underlying information or the analysis thereof.

Information contained in the Report is current as at the date of the Report, and may not reflect any event or circumstances
which occur after the date of the Report.

1
An overview of electricity consumption and pricing in South Africa | Contents

Contents

Contents ..................................................................................................................................... 2
List of Tables .............................................................................................................................. 3
List of Figures ............................................................................................................................. 4
Executive Summary .................................................................................................................... 5
Introduction ............................................................................................................................. 15
1. Electricity consumption in South Africa – composition, key drivers, and the outlook ......... 18
     1.1     Introduction ................................................................................................................................................. 18
     1.2     Analysis of the structure of the SA economy................................................................................... 18
     1.3     National electricity consumption by sector ...................................................................................... 19
     1.4     Key drivers of electricity demand ........................................................................................................ 22
     1.5     Drivers of electricity demand in South Africa.................................................................................. 25
     1.6     Review of Eskom sales forecast variance for MYPD3 period ..................................................... 31
     1.7     Outlook for electricity consumption .................................................................................................... 33
     1.8     Conclusions ................................................................................................................................................... 36

2.     Trends in electricity prices – a critical review of historical pricing policy and decisions .... 38
     2.1     Introduction ................................................................................................................................................. 38
     2.2     Historical trend in electricity prices .................................................................................................... 38
     2.3     History of electricity pricing in South Africa .................................................................................... 41
     2.4     Critical review of government’s policy of subsidising electricity ............................................ 46
     2.5     Key considerations not adequately addressed in recent regulatory decisions on
              electricity tariffs ....................................................................................................................................... 50
     2.6     Key findings and conclusion ................................................................................................................... 52

3.     International competitiveness of South African electricity tariffs ...................................... 55
     3.1     Introduction ................................................................................................................................................. 55
     3.2     The structure of the electricity supply industry and implications for tariff-setting and
              benchmarking ............................................................................................................................................ 55
     3.3     International comparison of electricity prices ................................................................................ 59
     3.4     Conclusion ..................................................................................................................................................... 63

4.     Requirements of an efficient electricity pricing regime ...................................................... 65
     4.1     Introduction ................................................................................................................................................. 65
     4.2     Requirements of an effective electricity pricing regime ............................................................. 65
     4.3     Additional requirements for a monopoly utility that is consistent with efficient delivery
              of electricity services. ............................................................................................................................ 70
     4.4     Support for the transition to cost-reflective electricity prices in South Africa .................. 72
     4.5     What is the gap between actual and cost-reflective electricity tariffs in South Africa? . 73
     4.6     Support for the transition to cost-reflective electricity prices in the SADC region .......... 74
     4.7     Barriers to the removal of electricity subsidies and strategies for reform .......................... 75
     4.8     Some specific guidelines for the successful removal of electricity price subsidies in
              South Africa to support a transition to cost-reflective prices................................................. 77
     4.9     Conclusion ..................................................................................................................................................... 79

Reference List........................................................................................................................... 81

2
An overview of electricity consumption and pricing in South Africa | List of Tables List of Tables Table 1: Price elasticities of electricity demand, 2002-2007 vs. 2008 to 2012 ...................................... 28 Table 2: Electricity intensity - South Africa and Rest of World (GWh/PPP adj. $ million) 1971-2010 ........ 30 Table 3: Eskom customer segmentation and tariff plans .................................................................... 57 Table 4: NERSA guidelines on determination of Tariff increases 2015-2016.......................................... 58 Table 5: South Africa’s performance in the NUS ranking of countries electricity prices, 2011 to 2015 ...... 61 3
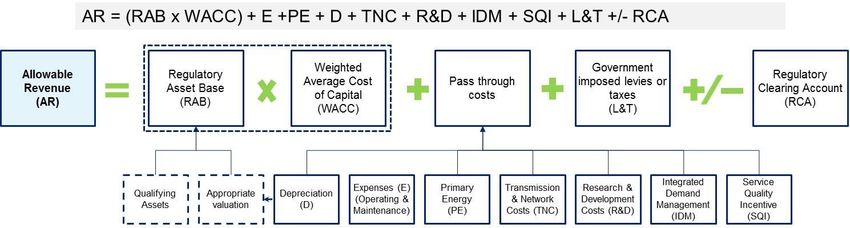
An overview of electricity consumption and pricing in South Africa | List of Figures

List of Figures

Figure 1: Evolution of the South African economy, 1975 - 2015 ......................................................... 19
Figure 2: Electricity consumption by sector, 2012 ............................................................................. 20
Figure 3: Trend in electricity consumption by customer category, 1993-2013....................................... 21
Figure 4: Estimates of the electricity intensity of selected sectors, 2012 .............................................. 22
Figure 5: Historical trend in electricity sales in South Africa, GWh, 1996 to 2016 .................................. 25
Figure 6: Relationships between growth in real GDP and electricity consumption (GWh), 1997 to 2016 ... 26
Figure 7: Price and income elasticity of electricity demand in South Africa, 1986 to 2005 ...................... 27
Figure 8: Trend in the electricity intensity of the SA economy vs. real electricity prices, 1980 to 2016 .... 29
Figure 9: Contribution of output, structural changes, and efficiency to total electricity consumption (1993
to 2006) ...................................................................................................................................... 31
Figure 10: Eskom MYPD3 sales volume variance - forecast vs. actual .................................................. 32
Figure 11: GDP and Eskom sales growth variance - forecast vs. actual ................................................ 33
Figure 12: Real GDP and Eskom’s SA electricity sales – historical and 5-year forecasts.......................... 34
Figure 13: Electricity intensity of the SA economy, historical and forecast ............................................ 35
Figure 14: Trend in Average Electricity Prices realised by Eskom per kWh (1973 to 2015/16) ................ 40
Figure 15: Composition of Eskom sales by customer category, 2014/15 .............................................. 56
Figure 16: Variation in the standard residential active charge tariff (R/kWh)1 levied by selected
municipalities and Eskom, 2015/16 ................................................................................................. 59
Figure 17: International comparison of the price of electricity delivered in June 2015, NUS Survey ......... 60
Figure 18: International comparison of electricity tariffs for industrial consumers ($US/kWh) ................. 62
Figure 19: International comparison of electricity tariffs for residential consumers ($US/kWh) ............... 63
Figure 20: Effect of ‘lumpy’ investments on prices set at short-run marginal cost ................................. 67
Figure 21: Tariff formula – Eskom’s allowable revenue ...................................................................... 68
Figure 22: Iterative feedback loop for price setting ........................................................................... 71
Figure 23: Size of the gap between actual and cost-reflective tariff in 2014/15 .................................... 73

4
An overview of electricity consumption and pricing in South Africa | Executive Summary
Executive Summary
I. Purpose of the study
This report was commissioned by Eskom as part of its preparation for its fourth Multi-Year Price
Determination (MYPD4) tariff application. The overall objectives of this report are:
To provide stakeholders with a broad historical context of electricity prices and consumption
ahead of the forthcoming tariff application.
To highlight some of the main criticisms of electricity pricing policy in South Africa and the key
issues Eskom and the regulator face.
To discuss the requirements of an efficient electricity pricing regime and the economic principles
that underpin the setting of equitable and efficient tariffs under a regulated and vertically-
integrated monopoly provider.
To examine the international competitiveness of electricity prices in South Africa.
To provide both general and specific guidelines and strategies for the successful removal of
electricity price subsidies in South Africa, in support of a gradual transition to cost-reflective
prices.
The report updates and expands on analysis that was commissioned by Eskom ahead of its MYPD3
application in 2012, titled “The economic impact of electricity price increases of various sectors of the
South African economy” (Deloitte, 2012).
II. Key findings and recommendations
The report is structured around four chapters and the key findings of the report have been summarised, by
chapter, below.
i. Chapter One: Electricity consumption in South Africa – composition, key
drivers, and the outlook
The purpose of this chapter is to provide an overview of the historical trends in electricity consumption in
South Africa, the changing composition of electricity sales by sector, key determinants of demand,
methods of decomposing demand, and a brief analysis of the medium-term energy demand outlook.
The relatively energy-intensive mining and manufacturing industries are the dominant
consumers of electricity in South Africa – they account for roughly 60% of national
consumption but only 22% of GDP.
5An overview of electricity consumption and pricing in South Africa | Executive Summary Despite the steady decline in the combined contribution of manufacturing and mining sector to GDP (from 31% of GDP in 1995 to 22% in 2015), these sectors are still responsible roughly 60% of total national electricity consumption. As such, growth in the relatively energy-intensive mining and manufacturing industries remains an important determinant of overall national demand. The contribution of the residential sector to total national electricity consumption has increased steadily over the past two decades (from 16% in 1993 to 23% in 2013). The results of several local and international studies on the key determinants of electricity consumption suggest that income or GDP is the dominant driver of demand. A review of the international literature suggested that there are two common approaches to decomposing the trend in national electricity consumption – the first is to estimate the price and income elasticity of demand (isolating the impact of each key driver) and the second is an approach used by the IEA which decomposes electricity demand into an activity, structural and efficiency effect. that the international literature suggests that electricity demand is generally more responsive to income than to price and that income over time is typically the dominant demand driver. A review of two studies that followed the alternative IEA approach also found that activity/income is the dominant driver of electricity demand in the long-term, while the share of electricity in total energy demand and efficiency effects also play a secondary but still significant role. The changing structure of the economy was found to have the least impact. The sensitivity of consumers to changes in electricity prices appears to vary significantly over time and depends on the direction and magnitude of price increases and the prevailing price level. It also appears from the literature that while the income elasticity of electricity demand is positive and relatively stable over time there are likely to be large variations in the sensitivity of consumers to price. Blignaut, lnglesi-Lotz and Weideman (2015) based on a survey of over 20 studies, that the sensitivity of consumers to tariff changes is dynamic, that it changes over time based on the prevailing conditions in a country’s electricity market and that it also differs from region to region. There is evidence of strong correlation between GDP growth and electricity sales in South Africa - previous studies found that the income elasticity of demand in South Africa between 1990 and 2005 was almost unit elastic meaning that a 1% increase in GDP was associated with close to a 1% rise in electricity demand (all else assumed equal). Our analysis of South African GDP and electricity sales growth data in the 20 years to 2016 provides evidence of a very strong positive correlation between GDP and electricity consumption in South Africa - the correlation coefficient between the two series over this period is 0.93. In a study on the determinants of electricity demand in South Africa from 1986 to 2005, Inglesi-Lotz (2011) found that income was the dominant driver of demand over the period and that the income elasticity of demand was close to 1 (unit elastic) for most of the period beyond 1990– meaning that a 1% increase in GDP was associated with a 1% increase in electricity demand. 6
An overview of electricity consumption and pricing in South Africa | Executive Summary

In recent years and particularly since FY2012, growth in Eskom’s local electricity sales has been much
lower than growth in GDP. While GDP expanded at an average rate of 1.9% y/y between FY2012 and
FY2016 Eskom’s local electricity sales were falling, averaging -0.9% y/y. In FY2013 electricity sales fell by
~4.2% y/y as a sharp fall in the global demand for commodities hit production in South Africa’s relatively
electricity-intensive mining and manufacturing industries. Supply constraints also put a brake on demand
as Eskom re-introduced rotational loadshedding in early 2014, and there was regular loadshedding
between November 2014 and September 2015.

The price elasticity of electricity demand in South Africa for industrial consumers is estimated
at between -0.5 and -0.2 for the 5-year period post 2007 when real prices were rising sharply.

The results of a study by Blignaut, Inglesi-Lotz & Weideman (2015) suggest that while the price elasticity
of electricity demand in South Africa is relatively inelastic, industrial sectors became more responsive to
changes in the price of electricity in the 5-year period where prices increased sharply in real terms. The
authors noted that electricity prices had little to no impact on demand over the period 2002 to 2007 (when
there was very little increase in real tariffs). By contrast, for the 5-year period post-2007, when real
electricity prices were rising sharply, the price elasticity of demand was significant and negative for 9 of
the 11 industrial sectors considered and ranges from roughly -0.5 to -0.2. This means that a 1% increases
in prices is expected to result in a 0.2% to 0.5% decrease in demand. The implication for Eskom sales
forecasters and policymakers when real electricity price increase is that large consumers are likely to
respond to price by reducing consumption.

Other factors that have been identified in the international literature as having a significant influence on
aggregate demand for electricity are the energy intensity of economic growth and the impact of
technological change (IEA, 2013). The electricity intensity of the South African economy has declined
steadily since 1998 but the trend accelerated as real electricity prices began to rise in 2008.

An analysis of the 36-year trend in electricity intensity of the South African economy (1980 to 2016)
shows that there was a strong negative correlation between the electricity intensity of economic activity
and the real (inflation-adjusted) electricity price. The correlation coefficient between the two series over
the period is -0.66, meaning that 66% of the change in electricity intensity could be explained by changes
in the electricity price. Because the electricity intensity of production varies considerably from one sector
to the next, changes in the structure of an economy can have a significant bearing on the longer-term
trend in electricity demand. The electricity intensity of the SA economy has declined steadily since 1998,
as the South African economy continued to transition away from its historical reliance on the relatively
energy-intensive mining and manufacturing sectors. The declining trend in the electricity intensity also
accelerated as electricity prices which had stabilised at low levels in 2001, rose sharply in real terms from
2008.

Electricity sales fell at an average rate of -0.3% y/y over the first three years of the 5-year
MYPD3 period (from 2013/14 to 2017/18) - much lower than the annual growth of 1.8% than
Eskom anticipated when it submitted its tariff application in 2011. Much of the sales variance
can be attributed to slower-than-anticipated GDP growth, with a drop in the global demand for
commodities and re-emergence of supply constraints also playing a role.

7
An overview of electricity consumption and pricing in South Africa | Executive Summary

Actual growth in electricity sales for the 5-year MYPD3 period which runs from 2013/14 to 2017/18 has
been significantly lower than what Eskom forecast in 2011 (as input to its application). Eskom forecast
that sales would grow at an annual average rate of 1.8% while actual sales for the first three years of
MYPD3 fell at an annual average rate of -0.3% with the variance between forecast and actual sales
consequently widening every year. Much of the sales variance can be attributed to much slower than
anticipated growth in economic activity, Eskom assumed that real annual GDP growth would average 4.5%
but GDP growth averaged just 1.5% in the first three years of MYPD3. Slower-than-anticipated sales in
first three years of MYPD3 were however also a result of unforeseen fall in global demand for commodities
and the re-emergence of local supply constraints.

With annual GDP growth forecast to average 1.8% for the 5-year period to 2021 (IMF & EIU
forecasts), growth in electricity sales is unlikely to average more than 1% per annum.

Growth in electricity sales are likely to continue to disappoint relative to MYPD3 forecasts which means
that Eskom will face a widening revenue shortfall in the outer years of the MYPD3 period.

    ii.   Chapter two - Trends in electricity prices – a critical review of historical pricing
          policy and decisions

Since the establishment of Eskom’s earliest predecessor, the ESC in 1923, the electricity supply
industry has always been dominated by a single state-owned and vertically-integrated
monopoly.

As a result, the electricity price has always been heavily influenced by the changing priorities of
government and this is part of the reason why it has arguably never reflected the true economic cost of
supply.

For much of the past four decades real (inflation-adjusted) electricity prices in South Africa
were declining but there were also periods of sharply rising real electricity tariffs - the first in
the early 1980s and the second in 2008/9 - both met with significant public resistance.

After a substantial over-investment in electricity generation capacity in the late 1970s and early 1980s
government allowed electricity prices to steadily fall. Between 1978 and 2004 the real average price of
electricity1 fell by more than 40% and by 2004/5 average electricity prices in South Africa were among the
lowest in the world. From 2008, the trend in prices took a dramatic turn when the power supply crisis that
had been threatening for several years, reached a critical point and Eskom introduced loadshedding.
Eskom was finally given the green light to embark on a massive build programme - the first major
increase in power generation capacity the utility had undertaken in almost 30 years. But at this point
electricity tariffs were at long-term-lows and Eskom had neither the cash reserves nor the future revenue
streams to cover the cost of the new build.

Between 2008 and 2013 NERSA approved several sharp increases in annual tariffs and electricity
prices more than doubled in real terms (inflation-adjusted) rising by a cumulative 114%.

1
  Average prices are calculated as the total electricity revenue realised by Eskom divided by the total kWh produced in a given period,
these are then adjusted for inflation to calculate real prices and expressed in 2016 rands.

8
An overview of electricity consumption and pricing in South Africa | Executive Summary
As was the case in the early 1980s, the sharp increases in real electricity prices over the 5-year period
were met with increasing public resistance. NERSA subsequently awarded Eskom increases of roughly CPI
plus 2% for the 5-year MYPD3 period which was well-below Eskom’s requested increases of roughly CPI
plus 10%.
The tariff increases awarded by NERSA over the MYPD3 period have proven inadequate and Eskom’s
revenue shortfall has begun to mount. In November 2016, S&P announced a further downgrade of
Eskom’s credit rating – Eskom’s deteriorating financial position also puts South Africa’s
sovereign credit rating at risk.
While Eskom was able to recover some of the revenue shortfall for the 2013/14 via a regulatory clearing
account application, a group of industrial users successfully challenged NERSA’s decision to award the
additional increase in court. While NERSA is appealing the decision, in November 2016, S&P announced a
downgrade of Eskom’s long-term corporate credit rating citing concern about increased financial pressure
facing Eskom due to uncertainty about the regulatory framework and the future tariff path. The
deteriorating financial position of Eskom, also reflects negatively on South Africa’s sovereign rating (as its
debt is both explicitly and implicitly guaranteed by the Government) and may increase the likelihood of a
downgrade to sub-investment grade on its foreign currency debt.
One of the most sustained criticisms of electricity pricing policy over the past 45 years is that Eskom
has not been allowed to set tariffs at a level that reflects the full cost of supplying power.
This has contributed to a series of poor investment decisions, hampered both public and private
investment in the sector and helped to precipitate the electricity supply crisis of 2008/9.
By maintaining artificially low tariffs, the South African government has effectively continued to
subsidise the cost of electricity.
“Subsidising energy use involves providing it at a price below opportunity cost. This includes non‐collection
or non‐payment, selling electricity at a cost that does not reflect the long‐run marginal cost of supply
including capital maintenance” World Bank (2010:22).
While electricity subsidies in South Africa have largely been implicit or off-budget they are
subsidies nonetheless, and the fiscal consequences do eventually become evident.
Whilst there may be no immediate transfer from the government to Eskom to cover the annual shortfall in
revenue caused by the presence of the subsidy the fiscal consequences have already started becoming
evident. Eskom initially received support from government in the form of a R60bn shareholder loan which
was converted into equity in 2015 and in the form of a further R23bn equity injection completed in March
20162. Government also approved R350bn worth of guarantees on Eskom’s debt of which Eskom had
drawn on R218bn worth by 2017/18 (the agreement is to be extended to 31 March 2023).
In addition, the economic harm and distortions that are caused by the presence of energy price
subsidies is wide-ranging.
2
Moody’s Investor Service (2017) Moody's places Eskom's Ba1/A2.za ratings on review for downgrade
9An overview of electricity consumption and pricing in South Africa | Executive Summary
Some of the consequences of electricity subsidies as summarised in the international literature, and with
specific reference to South African examples, include:
Energy subsidies can crowd-out growth-enhancing or pro-poor public spending. Energy
subsidies, while often intended to protect consumers crowd-out other priority spending (such as
on social welfare, health, and education) and place an unnecessary burden on public finances.
Energy subsidies (unless specifically targeted) are a poor instrument for distributing wealth
relative to other types of public spending.
Energy subsidies discourage investment in the energy sector and can precipitate
supply-crises. It is argued that artificially low electricity tariffs discouraged investment in South
Africa’s electricity supply industry, frustrated attempts by the government to attract private
investment and helped to precipitate the supply crisis of 2008
Energy subsidies often promote investment in capital-intensive and energy-intensive
industries at the expense of more labour-absorbing and employment generating
sectors. South Africa’s artificially-low electricity tariffs have historically channelled investment
spending towards the more capital intensive, energy-intensive industries. Inglesi-Lotz and
Blignaut (2011) found that overall electricity intensity in South Africa was more than double that
of the OECD average.
Energy subsidies stimulate demand, encourage the inefficient use of energy and
unnecessary pollution. The subsidised electricity price in South Africa has encouraged the
inefficient use of energy and arguably led to South Africa becoming one of the largest contributors
to global GHG emissions. Artificially low prices have also reduced the incentive for firms and
households to invest in energy efficiency technologies and more sustainable forms of embedded
generation such as rooftop solar PV.
Energy subsidies have distributional impacts. Since mining and manufacturing industries
consume almost two-thirds of South Africa’s electricity, firms in these sectors have arguably been
among the greatest beneficiaries of subsidised power in South Africa. Higher-income households
who consume far more power on average than poor households have also benefitted
disproportionately.
We noted that in assessing the impact of rising electricity prices on the economy NERSA failed
to consider the corresponding economic impacts of the implicit electricity subsidy when Eskom
is awarded a much lower-than-required tariff increase.
It is critical that the costs and consequences of implicit electricity subsidies associated with lower-than-
required tariff increases are acknowledged, modelled and communicated to public stakeholders. Failing
this, electricity subsidies will persist and Eskom’s financial position is likely to continue to deteriorate which
will have an adverse impact on the fiscus. There is a risk that this will trigger a sub-investment downgrade
of South Africa’s sovereign credit rating on foreign currency denominated debt.
10An overview of electricity consumption and pricing in South Africa | Executive Summary There is a lack of transparency in regulatory decisions about the extent to which revenue is disallowed based on concerns about the corresponding economic impacts of sharp tariff increases rather than because costs were ‘imprudently incurred’. Branco Terzic, a former commission at the US federal energy regulatory commission (FERC), recommends that during South Africa’s transition to cost-reflective tariffs, all implicit subsidies should be exposed (Terzic B. , 2015). This might require that the regulator identify the portion of disallowed revenue that will need to be recovered via an implicit subsidy rather than the tariff and to inform the public about the level of the subsidy via the billing system. In its response to the MYPD Methodology Consultation Paper, Eskom (2016) proposed that firstly the % ROA be used as the phasing mechanism and secondly that the transition path to full cost-reflectivity be defined in terms of duration, slope, measurement. iii. Chapter three - International competitiveness of South African electricity tariffs Despite the sharp 147% increase in real inflation-adjusted) electricity prices between 2007 and FY2015/16, a survey of the delivered price of electricity (12-month 1000KW contract) by NUS Consulting in June 2015, showed that South Africa’s tariff at 0.085 $US/kWh is still below the mean for the group of 18 mostly high-income countries. Furthermore, while South Africa has the 9th lowest tariff of the 18 countries, there was less than 0.5 US cents per kilowatt hour separating 4th placed Czech Republic and South Africa in 9th place. A comparison of industrial electricity tariffs by the IEA shows that in 2014, Eskom’s industrial electricity tariffs were still the lowest (or at least among the lowest if a more conservative benchmark tariff was chosen) among the 30 countries surveyed. The International Energy Agency also provide a comparison of industrial and residential electricity tariffs across a broader group of 30 to 33 advanced and emerging economies that are members of the OECD. Benchmarking of South Africa to this group suggests that industrial electricity tariffs in South Africa remain price-competitive by international standards. The inclusion of South Africa in the IEA’s ranking of countries’ residential tariffs in 2014, suggests that Eskom’s residential tariffs were the 3rd most competitive of the 30 countries surveyed. But only a small proportion of residential consumers in South Africa are benefiting from Eskom’s competitively priced residential tariffs as the majority purchase their electricity from the ~187 municipal distributors. A comparison of the standard residential electricity tariffs charged by 7 of the 187 municipalities was sufficient to show there are large discrepancies in the tariff charged by municipalities. Ekurhuleni placed 17th in the IEA’s residential tariff ranking which puts the municipality among the 50% of countries with the most expensive residential tariffs in the OECD group. While City Power (Johannesburg) tariffs were similar to the Eskom tariff, Ekurhuleni tariffs are 85% higher. The large discrepancies in municipal electricity tariffs in South Africa are cause for concern and also 11
An overview of electricity consumption and pricing in South Africa | Executive Summary

complicate any analysis of the impact of rising tariffs on the end-consumer (there may be additional
effects where for example electricity-intensive firms may relocate within South Africa to municipalities with
lower tariffs or may close in those with higher tariffs if relocation is not possible). With Eskom tariffs set to
continue to rise, it is questionable whether further increases in the already relatively high tariffs charged
by some municipalities can be justified.

NERSA should review its approach to the regulation of municipal electricity tariffs as its current
approach of providing guideline tariffs in terms of standard percentage price increases across all
municipalities will only serve to amplify historical differences.

NERSA should revise its approach to ensure that historical discrepancies are addressed (the regulator
could start by providing guidelines as c/kWh increases instead of percentage increases) so that tariffs
levied by all distributors eventually converge towards cost-reflective levels.

 iv.     Chapter four - Requirements of an efficient electricity pricing regime

Electricity pricing regimes often try to satisfy a range of social, economic, and political
objectives, but we argue that the primary objective must be to ensure that resources are
allocated efficiently.

“[So that] national economic resources [are] … allocated efficiently, not only among different sectors of
the economy, but within the electric power sector. This implies that cost-reflecting prices must be used to
indicate to the electricity consumers the true economic costs of supplying their specific needs, so that
supply and demand can be matched efficiently” (Munasinghe, 1981, p. 323).

In terms of economic theory, a ‘cost-reflective’ tariff is defined as a tariff equal to the long-run
marginal cost (LRMC) of supply.

This concept is consistent with the efficient allocation of economic resources and a relatively stable or
smooth tariff path. “One of the best-known results in economics is that resources are most efficiently
[allocated] when prices are set according to marginal costs” (London Economics, 1997).

While theoretically robust, LRMC is difficult to accurately estimate and operationalise, it is
argued that the RoR methodology currently employed by NERSA usually gives rise to tariffs that
are equivalent to LRAC.

In non-competitive electricity markets like South Africa, where a single regulated public utility is a
monopoly provider of electricity, the traditional approach to tariff-setting is the rate of return (RoR)
methodology. The RoR methodology which is currently employed by NERSA, is based on accounting
definitions that tend to guarantee that the utility can recover its cost of service provision (Gunatilake,
Perera, & Carangal-San Jose, 2008). The RoR methodology, if it were systematically applied by NERSA,
would give rise to tariffs that allow Eskom to fully recover its costs, but it is argued in the literature that
the RoR methodology does not necessarily give rise to tariffs that closely approximate LRMC. Critics of the
methodology argue that it gives rise to prices that are equivalent to long-run average cost (LRAC) which is
not as efficient.

12
An overview of electricity consumption and pricing in South Africa | Executive Summary
The extent to which tariffs under the ROR methodology approximates LRMC appears to depend
on the basis for asset valuation and/or the rules for depreciating the asset base.
Some have argued that tariffs better approximate LRMC when the utilities asset base is valued based on
depreciated replacement cost rather than historic cost. But more recently Rogerson (2011) and Nezlobin,
Rajan, & Reichelstein (2011) have argued that it is not the asset valuation method but the method for the
depreciation of the regulatory asset base (or capital stock) that determines whether the regulated prices
are in line with LRMC. They argue that tariffs can approximate LRMC even where assets are valued at
historic cost provided the correct type of depreciation rules are used.
The most sustained criticism of the RoR methodology is that it does not provide a utility with
sufficient incentive to minimise costs and improve productivity.
To address the limitations to the traditional RoR approach, certain modifications have been introduced
which are collectively referred to either as incentive based regulation or performance based regulation
(PBR). “For the remaining, shrinking monopoly services, incentive-rate making is inevitable and a
necessary evolutionary step in traditional utility regulation…Incentive ratemaking complements the review
and ratemaking established by a regulatory body with a periodic monitoring and review of performance”
(Terzic,1994: p.57).
While an efficient pricing regime is necessary to ensure the efficient delivery of electricity
services by a monopoly utility it is not sufficient – internationally accepted governance
practices must be adhered to ensure that sound and least-cost investment decisions are made.
Vedavelli (1989) notes that in addition to ensuring that tariffs reflect the LRMC of supplying power, it is
also important that sound investment decisions are made to ensure that demand is met at least cost so
that the cost of labour, fuel and capital inputs to production are minimised. Terzic (2015) notes that even
the most competent state-owned enterprise management executives can be faced with government-
imposed practices such as patronage in hiring, or pressure to invest in excess generation capacity, which
result in higher-than-necessary expenses. Terzic (2015) maintains that utilities must be governed by
independent boards, that while appointed by government must be politically independent and insulated
from elected officials.
Eskom estimates that the approved tariff of 67.7c/kWh in 2014/15 would need to have risen by
23% in order to reach the fully cost-reflective tariff of 83.9c/kWh.
We note however that the gap between actual and cost-reflective tariffs is not static, particularly during a
period of capacity expansion when new assets are being added to the regulatory asset base.
Some of the common barriers to the removal of energy subsidies (or transition to cost-
reflective tariffs) based on a series of international case studies but also relevant to South
Africa are summarised below:
A lack of information regarding the magnitude and shortcomings of subsidies;
A lack of government credibility and administrative capacity;
Concerns regarding the adverse impact on the poor;
13An overview of electricity consumption and pricing in South Africa | Executive Summary
Concerns regarding the adverse impact on inflation and international competitiveness;
Volatility of domestic energy prices;
Opposition from specific interest groups benefiting from the status quo;
and weak macroeconomic conditions.
We recommend some specific strategies for the transition to cost-reflective electricity tariffs in
South Africa, these are summarised below:
Expose implicit electricity price subsidies and provide the public with information on the
magnitude of the subsidy and their shortcomings with a clear communication strategy.
The regulator must review its approach to the regulation of municipal tariffs to address large
discrepancies in tariffs levied by municipal distributors as this is an obstacle to the transition to
cost-reflective tariffs.
Government should develop a clear plan for the transition to cost-reflective tariffs, with
appropriate phasing and provision of targeted subsidies and other mitigating measures for
vulnerable groups.
14An overview of electricity consumption and pricing in South Africa | Introduction
Introduction
In early 2008, South Africa experienced the first of a series of highly disruptive outages and load-shedding
episodes that came at an enormous cost to the economy. The electricity supply crisis, prompted decision-
makers to respond with greater urgency to the capacity shortage that had been threatening to emerge for
some time, and Eskom was given the go-ahead to embark on a massive investment programme. However,
in the 20 years since Eskom had last invested in base load capacity, real electricity tariffs had declined to
such an extent that it became apparent that Eskom would not be able to finance the new build programme
on the basis of its existing low tariffs and inadequate revenue. In the 5 years between 2008 and 2013,
electricity prices more than doubled in real terms, rising by a cumulative 114%, as the national energy
regulator (NERSA) granted Eskom tariff increases to help it raise debt for the new build. However, the
sharp increases in real electricity tariffs over this period prompted a public outcry, and NERSA took a
decision to limit the increase in real electricity tariff to ~2% per year for the 5-year period from 2013 to
2018.
This report was commissioned by Eskom, as part of its preparation for its fourth Multi-Year Price
Determination (MYPD 4) application (applicable to the post 2018 period). The overall objectives of this
report are:
To provide stakeholders with a broad historical context of electricity prices and consumption
ahead of the forthcoming tariff application.
To highlight some of the main criticisms of electricity pricing policy in South Africa and the key
issues Eskom and the regulator face.
To discuss the requirements of an efficient electricity pricing regime and the economic principles
that underpin the setting of equitable and efficient tariffs under a regulated and vertically-
integrated monopoly provider.
To examine the international competitiveness of electricity prices in South Africa and change in
international rankings.
To provide both general and specific guidelines and strategies for the successful removal of
electricity price subsidies in South Africa, in support of a gradual transition to cost-reflective
prices.
The report updates and expands on analysis conducted as part of a report that Eskom commissioned
ahead of its MYPD3 application in 2012, titled “The economic impact of electricity price increases of various
sectors of the South African economy” (Deloitte, 2012).
15An overview of electricity consumption and pricing in South Africa | Introduction I. Structure of the report The report is structured around five chapters. In Chapter one, we examine the factors that influence electricity consumption in South Africa, these include - the nature and pace of economic growth, the trend in real electricity prices, the evolution and adoption of more energy-efficient process and technologies and supply-side surpluses or constraints. The chapter provides an overview of the historical trend in electricity consumption in South Africa, the changing composition of electricity sales by sector, key determinants of demand, methods of decomposing demand, and a brief analysis of the medium-term energy demand outlook. The chapter includes an analysis of the impact of rising real electricity prices on electricity consumption and explores the implications of slower-than-expected economic growth and rising real electricity prices on future consumption and Eskom’s revenues over the 5-year MYPD3 period. Chapter two begins with an overview of the events and policies that have influenced electricity pricing in South Africa over the past 45 years. We also discuss how government’s policy of implicitly subsidising electricity (since the 1980s) contributed to a series of poor investment decisions, hampered both public and private investment in the sector and helped to precipitate the electricity supply crisis of 2008/9. In the second part of the chapter we provide a critical view of the government’s electricity pricing policy and particularly the policy of subsidising electricity prices. We explore the definition of cost-reflective tariffs and energy subsidies and the relationship between them. In the section that follows we summarise key findings from the international literature on the economic harm and distortions that are typically caused by electricity (and other energy) subsidies. We go on to provide examples of the economic consequences of electricity subsidies in South Africa. We conclude the chapter with a critical review of recent tariff decisions by the regulator. In Chapter three we explore the extent to which the sharp rise in real average electricity tariffs have affected the international competitiveness of South Africa’s electricity tariffs for different customer groups. The chapter begins with an overview of the electricity supply industry and the implications for tariff setting and benchmarking. This includes a brief overview of how both Eskom and municipalities approach the design of tariffs for different customer segments and a discussion on the implications of the large variance in tariffs across municipalities. We then go on to provide a comparison of electricity tariffs in South Africa with a broad selection of advanced and emerging economies based on two well-established surveys by NUS consulting and the International Energy Agency (IEA). Finally, in Chapter four we consider the requirements for an efficient electricity pricing regime based on international experience, economic theory, and good practice. We begin the chapter by reviewing the internationally accepted pricing principles that should result in the efficient delivery of electricity services under a regulated monopoly provider, such as Eskom. We go on to define a ‘cost-reflective’ tariff in terms of economic pricing theory and then explore how a tariff equivalent to long-run marginal cost (LRMC) is best approximated under the rate-of-return (RoR) methodology that is typically employed for tariff setting for a regulated monopoly utility. We then discuss some of the limitations of the RoR methodology and the shift internationally to ‘incentive-based’ regulation. We go on to acknowledge that while an efficient pricing regime based on a truly cost-reflective tariff is necessary to ensure the efficient delivery of electricity services by a monopoly utility, it is not sufficient. We discuss some of the well-established energy governance and practices that must also be in place to ensure the efficient delivery of electricity services 16
An overview of electricity consumption and pricing in South Africa | Introduction

by a monopoly provider. In the second half of the chapter, we discuss current support for the transition to
cost-reflective electricity prices in South Africa and the SADC region more broadly and examine the current
gap between actual and cost-reflective tariffs in South Africa. We end the chapter by summarising some of
the common barriers to the removal of energy subsidies based on a series of international case studies
and look at strategies for reform more broadly and in South Africa specifically.

17
An overview of electricity consumption and pricing in South Africa | Electricity consumption in South Africa – composition, key drivers,
and the outlook

1.1 Introduction
Over the past 30 years the South African economy has gradually transitioned away from its historical
dependence on relatively energy-intensive mining and manufacturing sectors towards a more diverse, and
increasingly services-related range of activities. In this chapter, we examine the factors that influence
electricity consumption in South Africa. These include - the nature and pace of economic growth, the trend
in real electricity prices, the evolution and adoption of more energy-efficient process and technologies and
supply-side surpluses or constraints. The chapter provides an overview of the historical trend in electricity
consumption in South Africa, the changing composition of electricity sales by sector, key determinants of
demand, methods of decomposing demand, and a brief analysis of the medium-term energy demand
outlook.

1.2 Analysis of the structure of the SA economy
The South African economy has a large and well-developed services sector which accounted for just over
two thirds (67%) of GDP in 2015, while mining, manufacturing and construction contribute the bulk of the
remaining third. While South Africa is classified by the World Bank as an upper middle-income country, its
economic structure mirrors that of a high-income country which typically has a dominant services sector
that accounts for more than 66% of national output (World Bank, 1995).

Over the past 30 years, the South African economy has continued to transition away from its historical
reliance on the relatively energy-intensive mining and manufacturing sectors towards a more diverse
range of services-oriented activity. In 1975, the primary and secondary sectors (mainly mining,
manufacturing and construction) accounted for almost half of GDP (45%), while today they contribute just
under a third of GDP (30%) (Figure 1).

Financial and business services activity expanded from 13% of GDP in 1975 to 22% of GDP in 2015 – the
sector is now the single largest contributor to national output. The contribution of transport services also
increased notably from 5% of GDP in 1975 to 9% in 2015. By contrast, mining sector’s share of GDP
declined from 20% in 1975 to just 8% in 2015, the manufacturing sector fell from 16% to 14% of GDP
over the same period.

18
An overview of electricity consumption and pricing in South Africa | Electricity consumption in South Africa – composition, key drivers,
and the outlook

Figure 1: Evolution of the South African economy, 1975 - 2015

                      16%         18%                                      15%                  17%
                                                       19%

                      5%                                                    6%
                                   5%                                                           6%
                                                       6%
                      13%                                                                                         General Government Services
                                  14%                                      19%
                                                       15%                                                        Personal Services
                                                                                                22%
                      5%                                                                                          Financial and Business Services
     % OF TOTAL GDP

                                   6%
                                                       7%                                                         Transport
                                                                            9%
                      15%
                                  14%                                                           9%                Wholesale and Retail Trade

                                                       14%                                                        Construction
                      5%                                                   15%
                                   3%                                                                             Electricity and Water
                      2%           3%                  3%                                       15%
                                                       3%                   3%                                    Manufacturing
                      16%                                                   3%
                                  16%                                                           4%                Mining and Quarrying
                                                       16%                                      2%
                                                                                                                  Agriculture, Forestry and Fishing
                                                                           15%
                                                                                                14%
                      20%         18%
                                                       15%
                                                                           11%
                                                                                                8%
                      3%           3%                  2%                   3%                  2%
                      1975        1985                1995                 2005                2015

Source: South African Reserve Bank

1.3 National electricity consumption by sector

1.3.1 Total electricity consumption by sector
Data compiled by the Department of Energy (DoE) on South Africa’s national energy balances shows that
mining and manufacturing are responsible for just under two-thirds of South Africa’s total electricity
consumption (62% in 2012). The iron and steel industry alone, is responsible for 10% of total
consumption; non-ferrous metals industry (aluminium) consumes a further 9%; and chemical industries a
further 6%. Households in South Africa are responsible for 20% of total electricity consumption while
commercial and government services in aggregate are responsible for a further 15%. The trend in
electricity consumption by a relatively small group of energy-intensive manufacturing and mining
industries therefore has a large bearing on the overall trend in electricity demand in South Africa.

19
An overview of electricity consumption and pricing in South Africa | Electricity consumption in South Africa – composition, key drivers,
and the outlook
Figure 2: Electricity consumption by sector, 2012
Residential Wood and Wood
Mining and Quarrying
20% Products
16% Machinery
0%
0%
Textile and Leather
0%
Transport Equipment
0%
Food and Tobacco
Other (Industry) 0%
15% Paper Pulp and Print
1%
Non-Metallic Minerals
1%
Transport Sector
2%
Agriculture
3%
Commerce and Public Chemical and
Services Petrochemical
15% Non-Ferrous Metals 6%
9%
Iron and Steel
11%
Source: Department of Energy, Aggregate Energy Balances, 2012
1.3.2 Historical trend in electricity consumption by customer category
A 20-year series of electricity consumption shows that industry (manufacturing and mining) has
historically been the dominant consumer of power with its share of total national consumption varying
between 52% and 63% over the period (Figure 3). The contribution of the residential or household sector
to total consumption rose consistently from 16% in 1993 to 20% in 2013. The growth in household
consumption is partly attributable to the DoE/Eskom household electrification programme which saw an
additional 5.7 million households connected to the grid between 1994 and 2013/143. Rising average
household incomes are also likely to have contributed to the consistent increase in demand from
households relative to other sectors.
3
DoE (2013) Overview of Universal Energy Access Strategy. Available at: http://www.energy.gov.za/files/IEP/Mmabatho/Overview-of-
Universal-Energy-Access-Strategy.pdf
20An overview of electricity consumption and pricing in South Africa | Electricity consumption in South Africa – composition, key drivers,
and the outlook
Figure 3: Trend in electricity consumption by customer category, 1993-2013
250 70 Other
59
63
60 Agriculture and
200 Forestry
52
% of total consumption
50 Commercial and
Public Services
150
40 Residential
TWH
30 Transport
100
20 Industry
50
10 Industry as % of
total (RHS)
0 0
1993
1994
1995
1996
1997
1998
1999
2000
2001
2002
2003
2004
2005
2006
2007
2008
2009
2010
2011
2012
2013
Source: Stats SA
1.3.3 Electricity intensity by sector
The electricity intensity of a sector can be defined as the amount of electricity consumed (e.g. in kWh) to
produce a given unit of output (e.g. GDP in R). The electricity intensity of different sectors is not readily
available because while the DoE reports electricity consumption by sector, these do not align with sector
GDP numbers reported in the relatively aggregated national accounts.
We derived estimates of the electricity intensity of each sector by matching consumption data from DoE
for 2012 to more disaggregated estimates of sector GVA (gross value added)4 reported in Quantec’s 2012
social accounting matrix. The results, presented in Figure 4, suggest that the non-ferrous metals industry
is by far the most electricity intensive in the South African economy - consuming 4kWh of electricity for
every unit of GVA generated in 20125. Other sectors/industries that emerge as relatively electricity-
intensive include ‘other industry (other types of manufacturing activity)’, iron and steel, chemicals and
mining (Figure 4).
4
GVA plus taxes less subsidies = GDP
5
Estimates of the electricity intensity of manufacturing and mining sectors will fluctuate with commodity prices – the international price of
non-ferrous metals such as aluminium has softened since 2012 and as profits fall the sector will appear more intensive.
21An overview of electricity consumption and pricing in South Africa | Electricity consumption in South Africa – composition, key drivers,
and the outlook
Figure 4: Estimates of the electricity intensity of selected sectors, 2012
Share of Value Add (2012 SAM)
70 4.5
Share of Electricity Use (DOE
4.19 2012)
59 Electricity Intensity (R/kWh) 4
60
3.5
50
3
kWh/R GDP (2012)
40 2.5
% total
30 2
1.5
19
20 16
15 15
13 1
0.88 11
9
10 6 5 0.5
2 3 0.34 2 0.33 3 3 3 2 3 3
0 0.27 1 1 0 0 0 0
0.11 0.08
0 0.03 0.02 0 0 0 0 0
Basic non- Other Iron and steel Chemical and Mining and Paper Pulp Agriculture Transport Commerce and Textiles and Food and Transport Construction
ferrous metals (industry) Petrochemical Quarrying and Print Sector Public Services Leather Tabacco Equipment
Source: Deloitte analysis based on data from DoE aggregate energy balances and Quantec 2012 national SAM
1.4 Key drivers of electricity demand
1.4.1 Introduction
There are several factors that influence the demand for electricity these include: the price of electricity;
growth in the level of economic production or output; population growth; weather patterns; and
technological change (Platchkov and Pollitt, 2011).
As is the case for most commodities, two of the fundamental drivers of the demand for electricity at a
macroeconomic level are income and price. Rising levels of economic activity or national income are
usually associated with increased demand for electricity (and energy more generally), while rising
electricity prices tend to reduce consumption (by incentivising firms and households to use it more
sparingly and/or more efficiently and/or to substitute electricity for cheaper alternative energy sources).
Other factors that have been identified in the international literature as having a significant influence on
aggregate demand for electricity are the energy intensity of economic growth and the impact of
technological change (IEA, 2013). Because the electricity intensity of production varies considerably from
one sector to the next (discussed in Section 1.3.3), changes in the structure of an economy can have a
significant bearing on the longer-term trend in electricity demand. The energy intensity and more
specifically electricity intensity of an economy typically increases as a country industrialises and the
contribution of relatively electricity-intensive manufacturing activities grows. Conversely, electricity
intensity declines in the post-industrial phase where economic growth is increasingly based on demand for
services such as banking, education, health (Inglesi-Lotz & Blignaut, 2011b).
Changes in technology have also been found to have an important influence on electricity demand, but
there is some tension between technological factors that increase versus those that decrease demand
22You can also read