Open Letter to LBMA Board of Directors - Price gold bullion, not gold credit By Paul Mylchreest, Hardman &Co Analyst - Hardman & Co
←
→
Page content transcription
If your browser does not render page correctly, please read the page content below
Open Letter to LBMA Board of Directors
             Pr i c e g o ld b u llion , n o t g o ld c r edit
                   By Paul Mylchreest, Hardman &Co Analyst
January 2020

               Table of contents
               Price gold bullion, not gold credit ......................................................................................3
               Gold and debt cycles ............................................................................................................8
               Beyond the point of no return ........................................................................................ 14
               Introducing London’s OTC gold market ........................................................................ 19
               Why reform London’s gold market? .............................................................................. 27
               Case study: False gold bear market of October 2012-December 2015 ................ 43
               Disclaimer ............................................................................................................................ 59

               Front page image source: Bank of England, 2011. Cropped from:
               https://www.flickr.com/photos/bankofengland/5762003476/in/album-72157626837048847/
               (https://creativecommons.org/licenses/by-nd/2.0/)

                                                                                                                                                      2
Price gold bullion, not gold credit

                                  Price gold bullion, not gold credit
                                  Open letter to:

                                  The Board of Directors, London Bullion Market Association

                                  Dear Sir/Madam,

                                  This is gold’s chance to shine, if you’ll pardon the pun, more than seven years after the
                                  price reached its all-time high, before plunging into the prolonged bear market.

                                  Numerous factors are converging to cement gold’s investment case at this time.

                                  Catalysts for the explosive gold bull market of 1968-80 were a loss of US monetary
                                  and fiscal policy discipline, tensions between major economic powers and a wave of
                                  gold buying, led by central banks. We are seeing a repetition of similar events, with:

                                  ►   the capitulation in hawkish Fed rate policy and resumption of QE/unconventional
                                      monetary policy;

                                  ►   trillion-dollar US budget deficits in prospect for at least the next decade, if not
                                      indefinitely;

                                  ►   periodic US/China trade tensions and a schism in economic thinking (Trump-style
                                      nationalism vs. globalism); and

                                  ►   central banks purchased the most gold in 2018 since 1967, with another strong
                                      year expected for 2019, when the final data are released.

                                  There are other, equally important, factors in today’s global macro and geo-political
                                  picture ‒ aside from the recent US/Iran flare-up ‒ which are very gold-positive:

                                  ►   gold has always outperformed in the late stages of previous debt cycles – all
                                      of the way back to the late 18th century and the Industrial Revolution;

                                  ►   the current debt bubble is unprecedented, with global debt surpassing $250tr
                                      and more than 320% of global GDP; and

                                  ►   when we look at financial markets, we see QE/ZIRP-driven asset bubbles in
                                      bonds, stocks and real estate, and the US economic expansion is now the longest
                                      in the post-war period.

                                  Historical drivers for the gold price dovetail with today’s risks, since gold is the only
                                  financial asset that:

                                  ►   has no counterparty risk; and

                                  ►   outperforms in both deflation and inflation ‒ resolution of this global debt cycle
                                      will require an intensification of one, or perhaps both (sequentially).

                                  Gold should function as a signalling device, acting as a warning sign and stabilising
                                  influence for a global financial system that has overstretched itself. This one has,
                                  with the need for unconventional monetary policy passing the point of no return.

                                  The gold price is being held back ‒ potentially increasing moral hazard across the
                                  entire global financial system ‒ which is where reforms by the London Bullion
                                  Market Association (LBMA) can play a role.

January 2020                                                                                                             3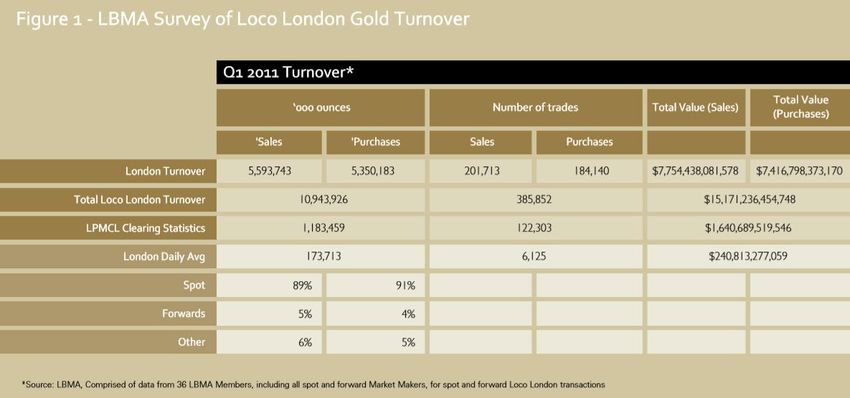
Price gold bullion, not gold credit

                                  As we show you in the report attached to this letter, the structure in London’s OTC
                                  gold market – the hub of the global market ‒ is frustrating the ability of the gold price
                                  to function as it should. We demonstrate how this has been the case for many years.

                                  Longstanding structural issues in regulation, transparency and, most importantly,
                                  trading practice, are acting against the interests of key stakeholders, e.g. gold mining
                                  companies, investors and, directly or indirectly, all participants in financial markets.

                                  We believe that gold should, and could, play an enhanced role in the global financial
                                  system, if a small number of issues were addressed.

                                  In the report, we show how the link has been broken between market fundamentals
                                  for gold bullion and the gold price for long periods.

                                  Gold bear market of October 2012 to December 2015 (price $/oz)

                                                                                                            Source: UK ONS

                                  Our detailed case study of the period October 2012-December 2015 (the False gold
                                  bear market) shows that the 41% crash in the gold price (above chart) was in precisely the
                                  opposite direction to identifiable fundamentals for gold bullion:

                                  ►   a run on London’s gold inventory of more than 2,000 tonnes of gold bullion, which
                                      was exported, mainly to Asia (see chart below) ‒ this volume was equivalent to
                                      more than two thirds of the inventory;

                                  ►   flat/down gold supply in terms of new gold mine production and gold recycling;

                                  ►   a market-based indicator (GOFO rate – explained in the report), which was clearly
                                      signalling a lack of available gold bullion before the LBMA ceased reporting it,
                                      under pressure from the banks in January 2015; and

                                  ►   reports from gold refineries, which hadn’t reported such strong demand in more
                                      than four decades.

January 2020                                                                                                                 4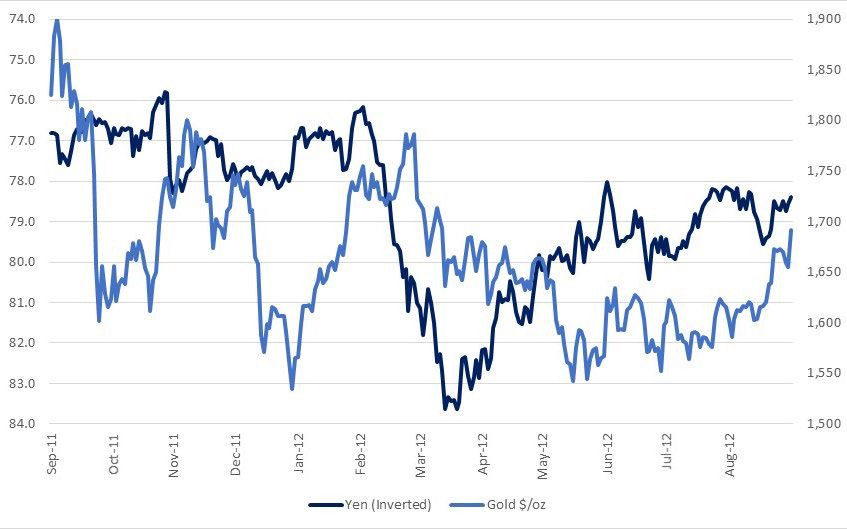
Price gold bullion, not gold credit
Cumulative net gold exports from UK, October 2012 to December 2015
(tonnes)
Source: UK ONS
Inexplicably, the biggest quarterly decline in the gold price – 25.4% in 2Q 2013 –
coincided with the biggest quarterly supply shortfall reported by the World Gold
Council for any quarter since reporting began in 2010.
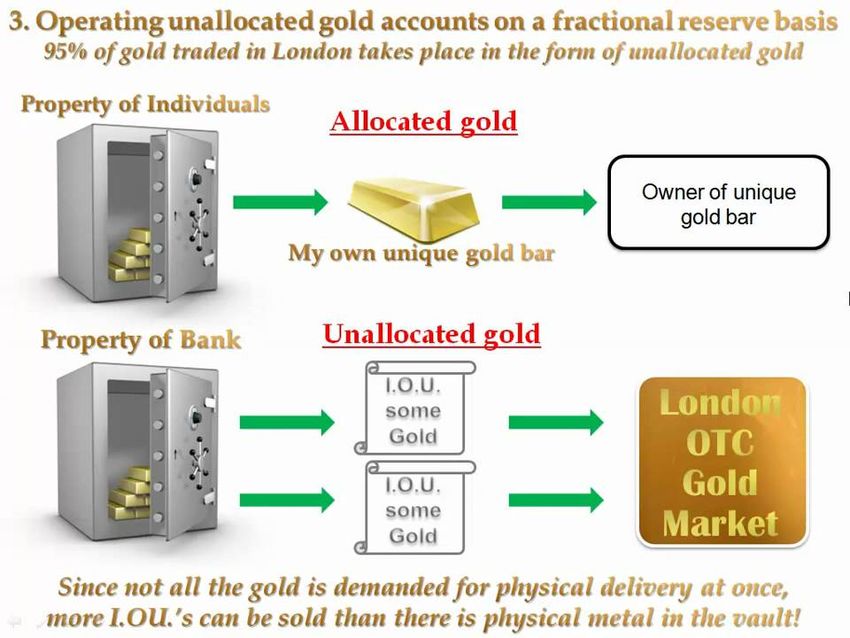
We believe that the reason the price of gold can defy fundamentals is due to structural
trading practices in London. The LBMA estimates that 95% of trades are in
unallocated gold contracts, which are “gold credit”, not gold bullion, meaning that the
London OTC market has been almost entirely derivative-ised. This has virtually
eliminated the need to deliver gold bullion.
With only 5% of gold trades requiring metal delivery, demand for actual gold bullion is
diluted by a factor of ca.20. On the supply side, therefore, the number of short
contracts can theoretically be expanded in an almost elastic fashion without
commensurate bullion delivery risk.
It’s logical that diluting bullion demand by substituting it with gold credit, in
combination with an elastic supply of this gold credit, will lead to a “gold price”
disconnected from bullion fundamentals.
Consequently, the source of gold mining company revenue and value of investors’
assets has been crowded out of price setting by the sheer volume of gold credit.
Some will see this derivative-isation as creating an uneven “playing field”, since it
dramatically increases the capacity to sell/short unallocated gold. Commentators
might conclude that the main beneficiaries are major banks/short sellers.
We estimate that the aggregate loss in cashflow to gold mining companies worldwide
from the fall in the gold price during October 2012-December 2015 was more than
$157.5bn. Many mining executives and investors remain unaware of their plight.
We acknowledge that the LBMA has played a crucial role in the gold market for over
30 years, ensuring certain minimum standards and creating codes to be observed. For
example, as recently as 6 February 2019, the Bank of England confirmed its
endorsement of the LBMA’s “Global Precious Metals Code” with a “Statement of
Commitment”. Indeed, the Bank of England is itself a market participant.
January 2020 5
Price gold bullion, not gold credit

                                  However, while the LBMA’s purpose may have been to underpin trust, one can argue
                                  that market practices and regulation are constantly evolving and there is opportunity
                                  to go further. The market might improve its attractiveness to a wider range of
                                  investors if it were to adopt a governance regime that seemed commonplace in other
                                  established capital markets. For example, many would find a market where there are
                                  twice-daily price “fixes” in a matter of minutes a little “quaint”. They would most likely
                                  question whether the LBMA could qualify for “Recognised Investment Exchange”
                                  status (recognised by the Financial Conduct Authority, that is), which would tick a lot
                                  of governance boxes.

                                  On transparency, the LBMA has made progress in line with the Bank of England’s Fair
                                  and Efficient Markets Review in 2015. The LBMA now publishes the physical holdings of
                                  precious metals held in London vaults. However, there is a lag with data published
                                  three months in arrears, which limits its usefulness.

                                  The LBMA’s adoption of “trade reporting” falls well short of what this means in other
                                  markets in two respects. Firstly, there is no reporting of volume and price of individual
                                  trades after execution. Secondly, and more importantly, we believe that the LBMA’s
                                  data on total trading volumes might understate the actual figure substantially.

                                  Current LBMA data on “total” trade volumes exclude trades by non-LBMA members.
                                  When the LBMA previously published gold trading volumes for 1Q 2011, the data
                                  included these trades. The daily average trading volume in 2011 is 5x higher (about
                                  4,000 tonnes/day or $150bn) than the daily average since the LBMA restarted
                                  reporting in November 2018 – even though the current data include Zurich trades
                                  and gold leases/loans/deposits, which were not included in 2011.

                                  Difference in daily average trading volume, 2011 vs. 2018
                                                                           2011                2018             Difference
                                  Volume (tonnes)                         5,403                 939                  4,464
                                  Volume (million oz)                     173.7                 30.2                 143.5
                                                                                                               Source: LBMA

                                  If the difference between LBMA member volume and total gold trading volume is
                                  several thousand tonnes and well over $100bn daily, that would be remarkable. An
                                  LBMA director said, in a telephone conversation, that the LBMA would respond to our
                                  concerns on this matter if we submitted them in writing, which we duly did. However,
                                  we are still waiting for the response.

                                  Besides the 12 market makers, the LBMA’s 146 members include banks, securities
                                  traders, commodity traders, exchanges, bullion dealers, mining companies, mints,
                                  refineries and vault companies. The LBMA membership list is, to say the least, fairly
                                  exhaustive. Nevertheless, a large group of players in the gold market is missing –
                                  central banks. Despite not being members, they are LBMA clients, as you have
                                  acknowledged: “The LBMA has a global client base. This includes the majority of the
                                  gold-holding Central Banks.”

                                  After analysing trading volumes, we conclude, at this time, that, for much of the
                                  typical trading day, central banks might be heavily influencing London gold trading.
                                  This has been widely speculated in the past, but perhaps not the scale.

                                  While some commentators have argued that market practice causes gold to be
                                  structurally under-priced, we would highlight an inherent potential for price
                                  asymmetry, e.g. if there were another strong wave of bullion demand like in 2013-15.

                                  If, for example, gold bullion settlement becomes problematic in London, due to a
                                  shortage of available gold bars meeting LBMA “good delivery” standard, the gold price
                                  could be re-based to a much higher level.

January 2020                                                                                                              6
Price gold bullion, not gold credit

                                  On the subject of gold bullion settlement…

                                  …it’s not the amount of gold in London’s vaults that is key, but the “float” of gold, i.e.
                                  unencumbered bullion excluding, for example, “official” (central bank) and ETF gold.

                                  Our calculation below suggests that the float of gold in London’s vaults is around
                                  1,000 tonnes, i.e. similar to what it was in the “supply crunch” of late 2015.

                                  Current estimate for gold “float” in London (tonnes)
                                  Total gold in London vaults                                                        8,228.4
                                  Less:
                                  Official gold (95% x gold in BoE)                                                  -4,894.2
                                  Less:
                                  ETF gold held in London                                                            -2,041.6
                                  Less:
                                  Est. held by institutions (incl. SWFs) and HNWs                                      -300.0
                                  Equals
                                  Gold float supporting London OTC trading                                              992.6
                                                                                         Source: LBMA, BoE, World Gold Council

                                  This level is only a FRACTION, about 20%, of the actual DAILY average London OTC
                                  trade in unallocated and allocated gold, as we speculated above. Absent the
                                  convention of trading gold credit/derivatives, London could run out of bullion in a
                                  matter of hours.

                                  It leaves London’s vaults ill-prepared to withstand another wave of bullion buying,
                                  even one that is less than half the strength of 2012-15, when about 2,000 tonnes left
                                  London vaults.

                                  No doubt some parties believe that current arrangements in London work well, and
                                  should be left as they are. Nevertheless, we hope that you will agree that there is a
                                  strong case for reform of the London OTC gold market.

                                  We would welcome being part of this debate and, in short, our recommendations for
                                  reform would include, but are not limited to, the following, with the goal of
                                  transitioning to accurate price discovery for gold bullion:

                                  ►   the LBMA should be reformed from a trade body into an exchange;

                                  ►   regulation should cover the entire London trading day and have statutory
                                      backing;

                                  ►   level the playing field by removing the advantages to banks/short sellers by
                                      eliminating the convention of trading gold credit/derivatives in the form of
                                      unallocated gold;

                                  ►   volume and price of all trades should be reported shortly after execution; and

                                  ►   vault data should be provided not later than one month in arrears.

                                  Regards

                                  Paul Mylchreest

January 2020                                                                                                                 7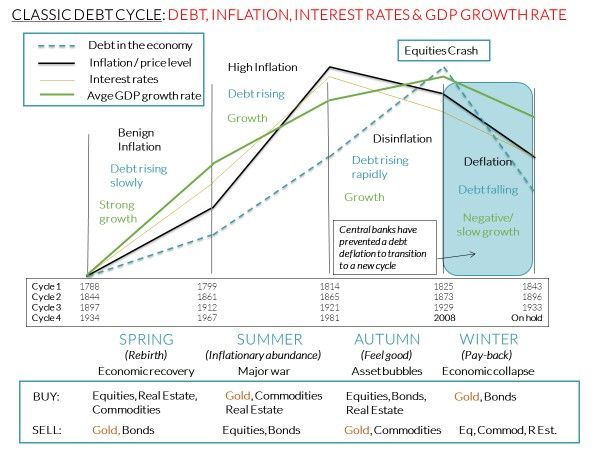
Price gold bullion, not gold credit

                                                    Gold and debt cycles
Gold’s risk/reward is improving                     The trade-off in the risk/reward for the gold price and gold mining equities is
                                                    improving, as central banks push the current iteration of the post-world War II
                                                    Bretton Woods financial order towards its limits.

                                                    Bretton Woods 1.0 began as a gold exchange standard, which pegged the US dollar to
                                                    gold until 1971. The framework had to be modified after monetary discipline was
                                                    jettisoned by the US, policy coordination between the US and other nations broke
                                                    down and the cap on the gold price became unsustainable.

The underpinnings of the status quo                 The subsequent modification to the financial order, sometimes termed the
                                                    “Petrodollar” or “Bretton Woods 2.0”, is a free-floating system supported by the US
                                                    dollar’s dominance in global trade and reserve balances. It necessitates a framework
                                                    in which coordinated policies are implemented by the global banking establishment, as
                                                    well as there being no serious financial and/or geopolitical threat to US dominance.

                                                    Looking at today’s “big picture”, the current economic expansion is the longest in post-
                                                    World War II history. Meanwhile, even the Federal Reserve has scrapped its attempts
                                                    to “normalise” monetary policy, with the reversion to rate cuts and QE (sorry
                                                    Chairman Powell, but it is QE). Trade tensions between the US and China continue and
                                                    the debt burden, which is a good place to begin, is unprecedented.

                                                    Gold and the unfolding of a classic debt cycle
The global debt cycle is key for gold               Our position in the current global debt cycle is important because:

                                                    ►   gold performed strongly vs. other asset classes in the final (“Winter”) stages of the
                                                        three previous debt cycles since the Industrial Revolution (see table below);

                                                    ►   gold has no counterparty risk, which increases in loans/credit instruments as the
                                                        debt carried by the financial system increases; and

                                                    ►   debt has a time function – bringing forward consumption from the future into the
                                                        present ‒ in a sense “buying time”. Rising debt ultimately acts as a tax on growth.

                                                    The table below shows the relatively strong performance of gold and bonds vis-à-vis
                                                    other assets in the final (“Winter”) stages of the past three debt cycles. Whether this
                                                    cycle is resolved by deflation, inflation, or deflation followed sequentially by inflation,
                                                    remains to be seen. The three previous cycles ended with debt deflations of varying
                                                    lengths and intensities. Consequently, we have also noted the “real” (adjusted for
                                                    inflation) change in the gold price. Obviously, central bank policies in previous debt
                                                    cycles were far more constrained, especially in terms of credit creation.

 Gold vs. other asset classes in final phase of debt cycles
 Debt cycle                  Final “Winter” stage           Gold act./real                Stocks                Bonds*              Commodities
 1788-1843                              1825-1843               0%/+26%                     -78%         3.54% to 3.17%                       -27%
 1844-1896                              1873-1896             -10%/+20%                     -22%         5.49% to 3.61%                       -44%
 1897-1933                              1929-1933            +69%/+122%                     -89%         4.73% to 4.49%                       -46%
                                                                                                                 * Change in long-term interest rate
                                                                                                                   Source: Hardman & Co Research

Identifying key characteristics of                  A detailed examination of previous debt cycles ‒ reflecting years of research, which
a debt cycle                                        has included reviewing several centuries of data and numerous academic studies – is
                                                    beyond the scope of this report. However, we have concentrated some of that
                                                    research into idealised representations of a “classic debt cycle”, which include:

January 2020                                                                                                                                       8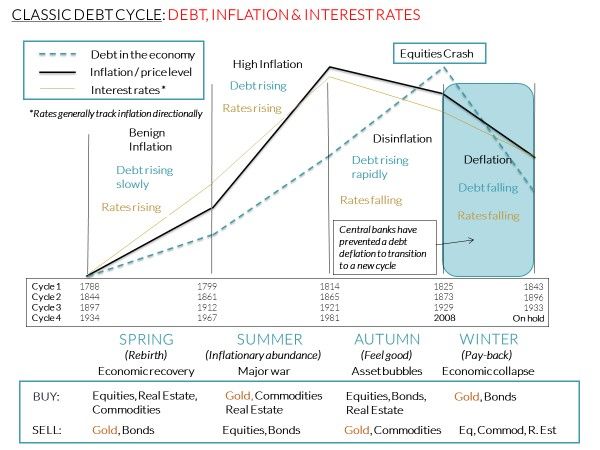
Price gold bullion, not gold credit

                                           ►   typical progression of a long rise followed by more rapid fall in debt;

                                           ►   the general trend in other key economic variables, i.e. inflation/price level,
                                               interest rates and the rate of GDP growth, during a typical cycle;

                                           ►   the four phases (“seasons”) in a typical cycle and brief characteristics;

                                           ►   the approximate timing of each phase during every debt cycle since 1788; and

                                           ►   which of five asset classes – equities, government bonds, real estate, commodities
                                               and gold – have outperformed or underperformed in each phase (note: back-
                                               testing we found that expected outperformance/underperformance for each
                                               asset class in each phase of every cycle worked an estimated 90.1% of the time).

Central banks extended the current cycle   The timeline of the current cycle was extended by unprecedented central bank
                                           interventions, which rescued the global banking system from insolvency after the
                                           2008 crisis. Lehman’s collapse put the system at the mercy of simultaneous crises in
                                           Eurodollar funding and subprime assets, along with the disintegration of the repo
                                           market. Absent this intervention, the crash would have been a prelude to a prolonged
                                           debt deflation. Instead, central banks put the resolution/end to this cycle on hold.

Trend in debt                              The chart below shows the progression of the rise and fall in debt across a typical cycle.
                                           There is no scale to the charts, and they are primarily indicative of the general
                                           direction over a period of years.

                                           Classic debt cycle – showing the idealised trend in debt

                                                                                                        Source: Hardman & Co. Research

The Kondratieff Cycle of the rate of       The typical progression of the rate of inflation/price level across a debt cycle is shown
inflation/price level
                                           below. This is known to economists as the “Kondratieff cycle”. While it unfolds across
                                           the duration of a debt cycle, the peak is generally midway through the latter.

January 2020                                                                                                                         9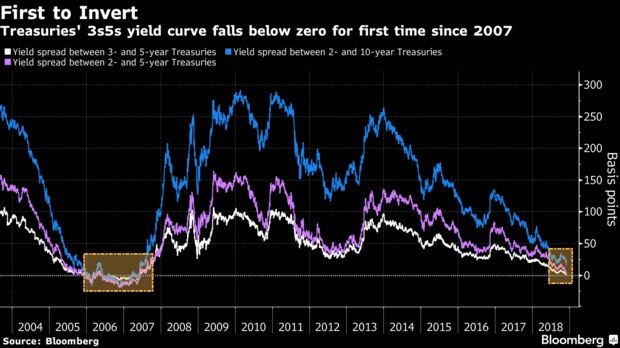
Price gold bullion, not gold credit

                                            Classic debt cycle – adding the idealised trend in inflation/price level

                                                                                                          Source: Hardman & Co. Research

Rates broadly track the Kondratieff Cycle   The trend in interest rates tends to track the direction of inflation.

                                            Classic debt cycle – adding the idealised trend in interest rates

                                                                                                          Source: Hardman & Co. Research

GDP growths tends to slow as the cycle      The average rate of GDP growth tends to be relatively higher in the earlier phases of
progresses
                                            a cycle with the accumulation of debt eventually acting like a tax on economic growth.

January 2020                                                                                                                         10
Price gold bullion, not gold credit
Classic debt cycle – adding the idealised trend in GDP growth
Source: Hardman & Co. Research
Current global debt cycle ‒ bubble territory
Global debt was $84tr when the “tech bubble” burst in 2000. Without Greenspan’s
Global debt has risen from $84tr to
aggressive rate cutting, the cycle might have come to an abrupt end… but not in the
ca.$250tr since 2000 era of hyper-interventionism on the part of central banks.
By the 2008 crisis, global debt had risen by a further $89tr to $173tr and central
banks circumvented the typical cyclical progression again.
Is it sensible to argue that debt no longer matters?
We think that that it would be a naïve view to have.
The excesses carried by the system have
While zero interest rates and QE saved the system a decade ago, excesses in the
system – specifically debt – are substantially greater. For 1Q 2019, Washington-
exploded based International Institute of Finance estimated that global debt rose to $246.5tr,
or nearly 320% of global GDP. In comparison, the peak in the debt/GDP ratio in the
US during the Great Depression was 275%.
January 2020 11Price gold bullion, not gold credit
Global debt bubble
Source: IIF
Central bank interventions have been Central bank policies that fermented the latest surge in the current debt cycle are
based on distorting financial markets
founded on distortions to financial markets on a scale never previously attempted.
These distortions have focused primarily on manipulating interest rates so that they
are lower in money and sovereign credit markets, although the knock-on effects have
been felt strongly elsewhere, especially in the equity and corporate debt markets.
In Fix What Broke, Building An Orderly And Ethical International Monetary System (Cato
Journal, 2015), gold advocate, economic advisor to President Trump and nominee for
the Federal Reserve board of governors, Judy Shelton, argued:
“In truth, the experiment with floating rates since the end of Bretton Woods has
brought about (Milton) Friedman’s worst nightmare: It has empowered central banks
- particularly the Fed - and strengthened government control over the private sector.”
Speaking to the Financial Times in 2019, she noted:
“How can a dozen, slightly less than a dozen, people meeting eight times a year, decide
what the cost of capital should be versus some kind of organically, market supply
determined rate? The Fed is not omniscient. They don’t know what the right rate
should be. How could anyone?” Ms Shelton said. “If the success of capitalism depends
on someone being smart enough to know what the rate should be on
everything…we’re doomed. We might as well resurrect Gosplan,” she said, referring
to the state committee that ran the Soviet Union’s planned economy.”
Can this heavy-handed central planning Using the financial crisis as cover, the world financial order was introduced to a far
have an enduring benefit?
more heavy-handed version of central planning. Two questions for investors are:
► will the impact of this intervention, beneficial as it has been so far, be enduring?
► is this time different and have policy makers successfully eliminated the “bad
stuff” associated with previous debt cycles?
January 2020 12Price gold bullion, not gold credit
The alternative view is that central banks are obscuring profound structural
weaknesses, and, in hindsight, might be seen as overreaching themselves? Instead,
their interventions are enabling a higher level of debt to be carried for a longer period
of time.
If the latter scenario is correct, the corresponding remedy for the monetary system
will, by necessity, need to be larger and perhaps beyond the capability of individual
central banks as it was in 2008.
The unprecedented central bank stimulus has led to all-time highs in most financial
assets. In stark contrast, the gold price plunged into a prolonged bear market and
remains significantly below its all-time of $1,920/oz. This reinforces gold’s position as
the “anti-central bank” asset par excellence.
Gold’s stronger performance since early 2019, in conjunction with a renewed wave of
central bank easing in response to the global slowdown ‒ especially by the Federal
Reserve ‒ suggests markets might once again be nervous about their stewardship of
the global economy.
From our perspective, a threshold has been crossed. Central banks are locked into
policies that have a permanent bias towards monetary easing with gold reverting to a
bull market.
January 2020 13Price gold bullion, not gold credit
Beyond the point of no return
Bretton Woods 1.0 fell after a two-stage Prologue to a gold bull market…here we go again
loss in US monetary discipline The investment case for gold is reinforced by parallels between the factors that led to
the initial failure of Bretton Woods 1.0 in 1968-71 ‒ and catalysed a 12-year bull
market in gold ‒ and those emerging to challenge the financial system again. Bretton
Woods 1.0 did not die overnight, but failed as a result of a two-stage loss in monetary
discipline by the US over a period spanning roughly a decade.
US started running deficits in the late- The first stage began when the US moved from close to a balanced budget into
1950s
significant deficits in 1959 and 1961. Gold reserves fell 22% during these years, as the
US was forced to sell gold to maintain the dollar peg at $35/oz, which was the bedrock
of the exchange system. All currencies were pegged to the dollar, which was pegged to
gold.
US gold reserves collapsed in the 1960s
About to become the longest economic
expansion since World War II
Source: World Gold Council
Concerns about the dollar had mounted in the run-up to the 1960 US election. The
gold price rose to over $40/oz, and the Bank of England (BoE) and Fed were forced to
sell gold again to maintain the peg. In early 1961, a formal agreement was reached
Major nations cooperated to cap the gold between the US and eight European nations (including the UK, Germany and France)
price to create the “London Gold Pool” to maintain the $35/oz price. Thanks to gold selling
by these nations, the gold price was successfully capped for seven more years.
In the second stage, deficits surged due to The second stage saw a renewed surge in budget deficits, which was triggered by the
the Vietnam War
escalation of US spending to finance the Vietnam War in the mid-/late-1960s. This led
to another rush to convert US dollars into gold and, this time, included nation states.
By 1968, gold buying was beginning to overwhelm the London Gold Pool. France,
under the direction of President de Gaulle, withdrew from the Gold Pool and was the
most aggressive among the nations converting their dollar reserves into gold bullion.
The Gold Pool was disbanded on 15 March 1968, after the US Government requested
the closure of London’s gold market to combat the heavy demand for gold.
Immediately prior to this, the Chairman of the Federal Reserve stated that he would
defend the US dollar "down to the last ingot". The gold price was freed and US gold
reserves had fallen 52% from their 1957 level when capitulation came.
January 2020 14Price gold bullion, not gold credit
Another two-stage loss of US monetary Fast-forward to the current era, and a case can be made that a two-stage loss of
discipline?
US monetary discipline is in progress:
► the first stage was 2008-15 with the imposition of ZIRP (zero interest rate policy),
QE1, QE2, QE3 and the Fed’s balance sheet expanding to $4.5tr; and
► we moved into the second stage in late-2018 as the Fed abandoned measures to
“normalise” monetary policy, joining the majority of central banks in
accommodation mode.
Fed capitulates as fiscal discipline evaporates
From gold’s perspective, the challenge facing central banks in sustaining the debt
bubble is becoming more difficult. A key issue is the convergence of an over-extended
debt cycle with an over-extended economic expansion since the Great Financial Crisis.
While the debt bubble is decades in the making, the current economic expansion is
slightly over a decade long, having begun in the US in June 2009 (National Bureau of
Economic Research). It is now the longest in post-World War II history.
Longest US economic expansions since WWII
Period Duration (months) Average annual GDP growth
Jun 2009 – 127 +2.3%
Mar 1991 – Mar 2001 120 +3.6%
Feb 1961 – Dec 1969 106 +4.9%
Dec 1982 – Jul 1990 92 +4.3%
Nov 2001 – Dec 2007 73 +2.8%
Mar 1975 – Jan 1980 58 +4.3%
Source: Hardman & Co Research
The table above also shows how average annual GDP growth in the current economic
expansion is lower than all of the others – with the greater debt load increasingly
acting like a “tax” on growth. The next lowest average GDP growth rate being the cycle
before the current one (brought to an end by the bursting of the Technology bubble).
Yield curve inversion signals deteriorating In the current expansion, inversions in the yield curve have flashed warnings about the
economic outlook
deteriorating economic outlook. On 3 December 2018, Bloomberg highlighted the
first inversion in a portion of the US yield curve – the three-year/five-year spread.
Yield curve inversion in December 2018
Source: Bloomberg
January 2020 15Price gold bullion, not gold credit
A recession within two years has followed an inversion in the US yield curve in every
case, except one, since 1995. The closely followed 2s10s (two-year/10-year) yield
curve followed the 3s5s into inversion nine months later on 14 August 2019, although
it is currently 22bps away from inversion.
The notion that central banks can resist the ever-growing pressures of the global
debt cycle and “normalise” monetary policy has begun to evaporate. While the
ECB, for example, has been in easing mode since November 2011, a key turning
point was December 2018, with the capitulation in the Fed’s policy of raising rates.
This has obviously been followed by rate cuts and the recent re-launch of QE.
In the run-up to the FOMC’s December 2018 meeting, the market was expecting two
things. Firstly, to raise the target Fed Funds rate from 2.00%-2.25% to 2.25%-2.50%,
which it did. Secondly, it expected Fed officials to signal three more rate increases in
2019 via the so-called “Dot plot”. Instead, the number of expected increases in 2019,
based on the median projection, was cut back to two, neither of which happened.
“Dot plot” ‒ Fed reversed hawkish policy at December 2018 meeting
Source: Bloomberg
The likelihood that the tightening cycle had ended was signalled in the FOMC’s
January 2019 statement. The previous outlook of “some further gradual increases”
was altered to being “patient” regarding increases. Furthermore, the FOMC indicated
that it might adjust the plan to normalise the size of its balance sheet, potentially
opening the door to a new phase of quantitative easing (QE):
“…the Committee would be prepared to use its full range of tools, including altering
the size and composition of its balance sheet, if future economic conditions were to
warrant a more accommodative monetary policy than can be achieved solely by
reducing the federal funds rate.”
At the time, the FOMC’s more dovish tone was at odds with its comments that
economic activity was rising at a solid rate, the jobs market was strong and inflation
remained near target. To what extent the U-turn in policy was driven by concerns
about future economic slowdown, the sharp sell-off in the Dow Jones in December
2018 or criticism of rate hikes by President Trump was unclear.
January 2020 16Price gold bullion, not gold credit
The capitulation of the Fed’s “hawkish” policy was completed with the first in a
renewed series of cuts in the Fed Funds rate, from 2.25%-2.50% to 2.00%-2.25%,
on 1 August 2019. Since then, there have been two further cuts, taking the rate
down to 1.50-1.75%. On 8 October 2019, Fed Chair Powell announced the
resumption of QE, although he chooses not to term it “QE”, for obvious reasons.
The renewed fall in US rates is another driver of the gold price since the relative
attraction of “risk free” US Treasury debt declines. A key argument for not owning
gold, i.e. its lack of yield, is diminished. The 10-year US Treasury yield is the benchmark
yield at the long end of the yield curve. The chart below shows its trend over the last
nearly six decades. We expect the 10-year yield to fall to 1.0%, or possibly less, with
real yields simultaneously tracking lower and supporting the price of gold.
10-year US Treasury yield close to all-time low
Source: St Louis Fed
The reversal in rate policy is only one part of a renewed loss of US monetary discipline
Trillion-dollar US budget deficits will
‒ the other part being fiscal. The Congressional Budget Office (CBO) forecasts for
become the “norm” 2018-29 project trillion-dollar budget deficits in every year from 2022-29.
Perpetual trillion-dollar deficits coming?
Source: Congressional Budget Office
January 2020 17Price gold bullion, not gold credit
Since fiscal 2018, US national debt has (already) been increasing by more than $1.0tr
p.a., but accounting adjustments reduce the “official” deficit numbers reported by the
US Administration. Furthermore, these budget projections assume a steady rate of
economic growth. The likelihood that the forecast period will be blighted by one, or
possibly more, recessions has the potential to make even these projections wildly
optimistic.
While the global economic outlook is becoming more problematic, risk is compounded
by a schism in economic policy thinking. This threatens future cooperation between
major economic powers (another throwback to the breakdown of Bretton Woods in
the 1960s) and the longstanding march towards globalism.
A split in the prescribed economic model The current political and financial order changed markedly in November 2016 with
the election of President Trump. For decades, the choice in a US election was
essentially between two candidates with slightly different ideas about the same
economic model. Now we have polar opposite models in conflict:
► on one side is “Trump-style” nationalism; and
► on the other is globalism and the entrenched liberal global banking establishment.
The global banking establishment
There are signs of growing influence of the former in the likes of the UK, Italy, Brazil
is rattled and elsewhere. The trend is also alarming the global banking establishment. The latter,
represented in this case by the IMF, issued a warning at this year’s Davos meeting.
According to The Telegraph on 24 January 2019:
“The International Monetary Fund has warned that the system of global cooperation
that saved world finance in the 2008 crisis may break down if there is another major
shock or a deep recession. David Lipton, the IMF’s second-highest official, said it is
unclear whether the US Fed would again be able to extend $1 trillion of dollar “swap
lines” to fellow central banks - the critical measure that halted a dangerous chain-
reaction after the collapse of Lehman Brothers and AIG.”
Reading between the lines, the IMF was questioning whether the Fed’s loyalty still lies
with the central banking network under the IMF and Bank for International
Settlements, or whether the Trump White House is taking away control. The rapid
reversal in the Fed’s hawkish policy following repeated criticism from President
Trump, along with the ongoing trade tensions between the Trump Administration and
China, makes this issue more poignant. Indeed, besides the loss of US monetary
discipline, the other factor behind the failure of Bretton Woods 1.0 was the
breakdown in cooperation between major economic powers of the day, notably the US
and France at the time.
January 2020 18Price gold bullion, not gold credit
Introducing London’s OTC gold market
It’s not just about gold’s investment case
Gold’s investment case dovetails with In investment terms, gold has unique properties, which dovetail with risks associated
current financial risks…
with the current stage of the extended economic, debt and asset price cycles. For
example, gold is:
► positively correlated with declining real interest rates;
► the only financial asset that outperforms in either inflation or deflation (cf. Roy
Jastram’s detailed study covering a timeline of several centuries in his famous
1977 book, The Golden Constant);
► the only financial asset that has no counterparty risk, since it is the only one that
is not the liability of a third party; and
► insurance against waning confidence in policy makers, sharp declines in the prices
of other major asset classes and disruption to the status quo in the world’s
financial order.
The fundamentals for gold are arguably better now than they have been for more than
a decade, if not several decades, dating back to the period before the collapse of the
London Gold Pool in 1968.
But it’s not that simple.
It’s not just about gold’s investment case… The dynamics affecting the “gold price”, however, are considerably more complex than
the investment case for gold.
…but the mechanics of the London gold They are also dependent on the mechanics of the gold market and trading practices of
major players participating in it.
market
Specifically, the strength and duration of the next gold bull market will be heavily
dependent on events in London’s OTC gold market, which remains the hub of
global gold trading.
The key is how long the float of unencumbered gold in London vaults can sustain
the outsized volume of gold trading in London’s OTC gold market – especially if
there is another run on the vaults as we saw during 2012-15.
From the London OTC gold market perspective, the extended debt cycle, extended
economic expansion and the timing of the renewed loss of monetary discipline in the
US is significant:
► when the Federal Reserve launched QE3 in September 2012, conditions in
London’s gold market were different – namely there was a significantly higher
level of inventory in the gold vaults than currently; and
► the subsequent run on London’s gold vaults – between September 2012 and
December 2015 – was accommodated but only by a narrow margin given the
volume of trading in London’s OTC gold market (see Case study: False gold bear
market below).
Next time, this may not be the case.
However, we should emphasise that it’s not the total amount of gold in London vaults
that is critical to the functioning of the London’s OTC gold market, but the gold “float”.
January 2020 19Price gold bullion, not gold credit
This is the volume of unencumbered gold that can accommodate the small minority of
The gold float in London is critical…
gold buyers who, in the vast melee of daily London gold trading, currently opt to take
gold bullion delivery.
Because the London gold market is almost entirely
“derivative-ised”
London’s gold market has long been “derivative-ised” and, for the most part, facilitates
the exchange of gold credit notes, which purport to represent gold bullion, back and
forth.
As we explain, this massively dilutes the buying pressure on London’s inventory of
bullion, while simultaneously eliminating most of the risk to sellers of sourcing bullion
to satisfy delivery.
It follows that:
► much of the time, the gold price is set by supply and demand of what are
effectively gold “credit notes”, instead of gold bullion;
► the gold price can move in the opposite direction to supply and demand
fundamentals for gold bullion over relatively long periods (as our analysis will
suggest);
► one can argue that the gold market is an uneven playing field and sellers,
especially short sellers, are granted an advantageous position;
► there might be a structural downside bias to the gold price unless and until the
“float” of vault gold becomes worryingly low; and
► in that case, the gold price could possess asymmetrical upside potential ‒ not
dissimilar to what happened when the London Gold Pool collapsed in 1968.
…otherwise the “derivative-ised” market
When there is an “adequate” float of gold in London vaults the status quo can be
comfortably sustained. If not, the “derivative-isation” of the market might become
will be exposed
obvious in fairly short order.
We estimate, for example, that at the end of December 2015, which marked the end a
prolonged bear market in the gold price, the float in London’s vaults had declined to
about 1,000 tonnes. This, we believe, was a mere fraction – less than 20% ‒ of
gold’s daily average trading volume in the London OTC market.
We need to emphasise that detailed analysis later in the report shows how the LBMA’s
current trade reporting only includes trades by LBMA members and, we believe,
probably understates the actual trading volume by a wide margin.
In London, there are the two main vaults that service the gold market aside from the
one located beneath the BoE. These belong to JPMorgan Chase and HSBC. The
former is located on John Carpenter Street, close to Embankment and we believe that
HSBC’s gold vault is located in Queen Street Place in the City of London.
January 2020 20Price gold bullion, not gold credit
London gold vault at JPMorgan Chase on left side of road
Source: Hardman & Co.
Estimating the current gold float in London vaults
The key question is where do we stand now with respect to London’s vaults and the
float of gold?
Our calculation of the float in London is as follows:
Total held in London vaults
Less:
Central bank gold held for the UK and other nations at the Bank of England
Less:
Physically-backed ETF gold held in London
Less:
A small amount of gold held in London vaults on behalf of sovereign wealth funds
(“SWFs”) and high net worth investors (“HNWs”)
Equals:
Gold float in London vaults
The sources for this data include:
► the LBMA, which publishes the total volume of gold in London’s vaults (including
gold held by the Bank of England) on a monthly basis three months in arrears;
► the BoE, which publishes the gold held in its vaults on a monthly basis; and
► the World Gold Council, which publishes the gold held by all of the physically-
backed ETFs worldwide on a monthly basis.
January 2020 21Current situation in London’s vaults?
Price gold bullion, not gold credit
The vast majority of gold held at the BoE is official gold, held on behalf of the central
banks of other nations. When last reported, the BoE stated that it acts as gold
custodian for 72 other central banks. Our estimate is that 95% of reported gold at the
BoE is official. Using the latest estimate for gold held in its vaults (September 2019),
the volume of official gold is:
95% x 5,151.8 tonnes = 4,894.2 tonnes
With regard to the more than one hundred gold ETFs, we have sought to identify the
location of the custodian for each ETF, which holds more than one tonne of gold. The
table below shows that slightly over 70% of this gold is held in London:
2,041.6 / 2,896.8 tonnes = 70.5%
ETFs with gold stored in London (October 2019)
ETF Ticker Tonnes
North America:
SPDR Gold Shares GLD 915.3
iShares Gold Trust IAU 356.9
SPDR Gold Minishares Trust GLDM 22.9
Graniteshares Gold Trust BAR 12.3
ETFS Physical Precious Metal Basket GLTR 5.4
VanEck Merck Gold Shares OUNZ 3.6
Europe:
ETFS Physical Gold PHAU 163.3
Invesco Physical Gold ETC SGLD 152.8
iShares Physical Gold ETC SGLN 142.2
Gold Bullion Securities Ltd GBS 80.9
Xtrackers Physical Gold ETC Eur XAD5 67.3
Xtrackers Physical Gold Euro Hedged ETC XAD1 50.2
Xtrackers Physical Gold ETC XGLD 23.3
Amundi Physical Gold ETC GOLD 13.7
ETFS GBP Daily Hedged Physical Gold GBSP 8.9
Xtrackers Physical Gold GBP Hedged ETC XGLS 3.8
ETFS Physical PM Basket PHPM 1.3
Rest of World:
New Gold Issuer Ltd GLD 17.6
Total ETF gold in London 2,041.6
Total gold in ETFs worldwide 2,896.8
Ratio 70.5%
Source: World Gold Council, Hardman & Co Research
We can only estimate the current amount of gold held in London vaults by SWFs and
HNWs and we assume a nominal figure of 300 tonnes.
January 2020 22Price gold bullion, not gold credit
On the basis of our analysis, we estimate that the current gold float amounts to
ca.1,000 tonnes.
Current estimate for gold “float” in London (tonnes)
Total gold in London vaults (Sep’19) 8,228.4
Less:
Official gold (95% x gold in BoE) -4,894.2
Less:
ETF gold held in London (Oct’19) -2,041.6
Less:
Held by institutions (incl. SWFs) and HNWs -300.0
Add:
UK net imports (Jun’18)
Equals
Gold float supporting London OTC trading 992.6
Source: Hardman & Co Research
As we show later in this report ‒ see False gold bear market: October 2012-December
2015 ‒ there was a run on London’s gold vaults during this period, which saw more
than 2,000 tonnes of gold leave London vaults for overseas buyers, mainly for Asia.
As things stand, London’s gold vaults are ill-prepared to withstand another wave
of bullion buying, even one that is only half of the strength of that seen in the
2012-15 period referred to above.
Obviously, the official sector might be prepared to lend gold to the market initially –
but for how long if it became clear that there was little chance of getting it back?
The situation would be even more challenging if western investors were encouraged
to participate this time by a bull market. This would see them add significantly to ETF
and physical gold holdings in contrast to 2012-15 when they were significant net
sellers.
In the meantime, it’s ironic that central banks have become major gold buyers
themselves, as we saw in the run-up to the gold bull market of 1968-80.
We’re watching… New wave of gold buying led by central banks
It seems that the renewed loss of monetary discipline by the US, or a general
nervousness regarding the economic outlook, has not been lost on other sovereign
nations. Amongst others, this applies to geo-political challengers to the US, major
holders of dollar reserves and those having heavily overleveraged financial systems.
China, for example, ticks all three boxes.
…December 2018 saw the first increase in The way forward for the world financial order is hardly clear; nevertheless, China’s
China’s gold reserves for more than two
central bank has been building up the nation’s gold reserves for more than a decade
and a half.
years
We believe it is very significant that, after a hiatus lasting from October 2016 to
November 2018, China announced its first increase in gold reserves in December
2018 – precisely corresponding with the Federal Reserve signalling its policy reversal.
China’s purchase of about 10 tonnes of gold was followed by almost identical
purchases in January and February 2019. The buying continued for 10 months before
pausing again in October 2019. The nation’s gold reserves now stand at 62.64m oz, as
shown in the next chart, which is equivalent to ca.1,948 tonnes. This puts China in sixth
place behind the US, Germany, Italy, France and Russia.
January 2020 23Price gold bullion, not gold credit
China gold reserves since 1980
Source: Bloomberg
Last year, central banks bought the most China’s recent gold buying, while significant, is swamped by the recent buying by other
gold since 1967
central banks in aggregate. In all, they bought 651.5 tonnes of gold in 2018, 74% more
than in 2017, and the highest level for more than half a century. This echoed the
collapse of Bretton Woods 1.0, since the last time this level of annual buying was
exceeded was the year prior to the former’s failure – a total of 1,404 tonnes in 1967.
Central bank net gold purchases 1971-2018
Source: World Gold Council
While Poland and Hungary unexpectedly added to their gold reserves in 2018,
countries like Russia, Turkey and Kazakhstan continued to accumulate heavily. Russia
purchased 274.3 tonnes, according to the World Gold Council, a fourth successive
year of more than 200 tonnes. Hungary increased its holdings tenfold to 31.5 tonnes,
and the MNB’s (Hungarian central bank) press release noted (with our emphasis):
“Gold is not only for extreme market environments, structural changes in the
international financial system, and deeper geopolitical crises. Gold also has a
confidence-building effect in normal times, that is, gold can play a role in stabilizing and
defending.”
January 2020 24Price gold bullion, not gold credit
The aggregate value of global financial assets is more than $500tr, while gold assets
(bullion and associated equities) account for less than 2% of this figure, with much of
it held by central banks and Asian citizens, in India for example.
Western capital is not participating in the In stark contrast, the vast pools of western capital, both institutional and retail, are still
reluctant to participate in gold investing. Indeed, the investment case for gold and gold
gold market in a meaningful way…
equities is not something on which the vast majority of investment managers in
western nations spend much time (if any).
The efforts to reduce gold’s profile in the investment landscape (cf. Bernanke’s
comments that US holdings of 8,000 tonnes of gold reserves were based on
“tradition”) were a necessary part of the transition to Bretton Woods 2.0 and the
subsequent – now more than four-decades-long ‒ “financialization” of the global
economy.
…and has been wrong-footed by gold We should note that western capital has been wrong-footed by gold bull markets
before.
before. This comment, sourced from LBMA literature, relates to the 1970s’/early
1980s’ bull market:
“…the bullion market was characterised by rising gold prices, with a then record gold
price of $850 an ounce, the explosion of western investor demand, the dramatic
dishoarding from Asia and the birth of bullion banking.”
Currently, the GDXJ index of small cap. gold mining stocks – the most geared to a gold
bull market ‒ remain depressed, as the chart shows. There is very limited interest from
the investment community and few signs of that foundational principle of investing,
going against the herd.
GDXJ Index ‒ VanEck Junior Gold Miners ETF (since 2010)
200
180
160
140
120
100
80
60
40
20
0
2010
2011
2012
2013
2014
2015
2016
2017
2018
2019
2020
Source: NASDAQ
The prolonged period of low gold prices in recent years meant that less capital was
allocated to exploring for new gold deposits and developing new gold mines. This will
lead to a hiatus in gold minoutput and the prospect of a decline in the early years of
this decade.
January 2020 25Price gold bullion, not gold credit
Gold production set to decline in the next decade
Source: Barrick Gold
Asian investors continue to accumulate Furthermore, we suspect it’s unlikely that the next bull market in gold will be
gold characterised by Asian dishoarding. Indeed, central banks aside, Asia has been in long-
term accumulation mode where gold is concerned. We expect to see the continuation,
maybe even acceleration, in the trend shown in the chart below.
Cumulative gold demand: China, Russia, India and Turkey (since 2005)
Source: goldchartsrus.com
January 2020 26Price gold bullion, not gold credit
Why reform London’s gold market?
Getting further behind on regulation?
When people think of the gold market, they generally think of London, which remains
the hub of global gold trading. The following quote is from A Guide to the London
Precious Metals Markets, published by the LBMA:
London is the hub of the gold market “…the loco London price has become the common denominator amongst dealers
around the world…nearly all global OTC gold and silver trading is cleared through the
London bullion market clearing system.”
Note: “loco London” refers to settlement in gold that is stored in London bank vaults.
What is the LBMA and what is it not? The LBMA is a trade body that sets standards and provides services for the OTC gold
market. However, we believe that regulation, transparency and market integrity
would benefit from the market being as an exchange. As a trade body, some
commentators believe that major banks that trade gold and the other precious metals
can exert excessive influence (and we note some evidence of this below).
The LBMA has catching up to do on
The market remains off limits to retail investors, whose gold trades are referenced to
the LBMA price. Onboarding retail investors (e.g. albeit say trading in kilo bars as a
regulation and transparency minimum) would also be a step forward in the democratisation of gold price discovery.
Scandal after scandal has made greater regulatory oversight and transparency a
necessity in this era. Gold trading in London has lagged progress in this field. The
following quote about the market is from a 1996 Gold Survey, by consultants, GFMS:
“…confidentiality and lack of transparency; business can be conducted privately,
sheltered from the attention of other market participants, competitors, regulators and,
of course, analysts.”
In the intervening period, a case can be made that change has been less substantive
than is being portrayed. Some commentators view it as a self-regulating “club”, which
is opaque and too heavily influenced by banks.
London’s gold market has a reputation of being “clubby”
Source: LBMA
January 2020 27Price gold bullion, not gold credit
The first code had little in the way of Under-regulation of London’s OTC gold market dates back decades. Prior to the
“teeth”
publication of the LBMA’s “Global Precious Metals Code” in 2017, London’s OTC gold
market was covered by the Bank of England’s “Non-Investment Products Code”
(NIPs), which applied to gold and other, now infamous for rigging, wholesale financial
markets, LIBOR and forex.
The BoE acknowledged the minimal regulation in a speech dating back to 2003, The
Role of the Bank of England in the Gold Market, by the then senior manager of the BoE’s
Foreign Exchange Division, Graham Young.
“I would like to say a word about the Bank’s role in the regulation of the gold market in
the UK. This is, in fact, a very limited one…The wholesale bullion market is considered to
be an inter-professional market…This means that, in general, the principle of caveat
emptor applies and the market is expected to be self-regulating.”
Caveat emptor is inadequate, and a cursory reading of the NIPs raised red flags:
“Its provisions are intended only as guidance on what is currently believed to
constitute good practice in these markets. The Code has no statutory underpinning.”
Consequently, it had little in the way of “teeth”.
The second also lacks statutory backing We learned to our cost from scandals in LIBOR, forex and gold that its naïve to rely on
markets being left to regulate themselves.
In gold, Barclays was fined $43.8m on 23 May 2014 for market rigging of the London
gold “fixes”, a day after it had been fined for rigging LIBOR along with other banks. The
gold fixes were twice-a-day (10.30am and 3pm) price settings, which served as
benchmarks during normal London trading. The FCA stated that there had been
failings by Barclays for about a decade during 2004-13.
The scandal prompted a response by regulators. Since 2015, the renamed “LBMA
Gold Prices” are set by auctions supervised by the FCA and administered by
Intercontinental Exchange. That said, these auctions are really a quaint anachronism.
They only cover a matter of minutes during 24/7 trading in London and elsewhere,
from the Asian market open on Monday to the New York close on Friday evening.
In 2016, Deutsche Bank agreed to pay $60m to settle a lawsuit filed in the US District
Court in Manhattan for manipulating prices of gold, gold futures, options and the gold
fixes.
As a reaction to the scandals in LIBOR, forex and gold, UK regulators, the FCA, UK
Treasury and the BoE published the Fair & Effective Markets Review (FEMR) in 2014. In
response to the FEMR, the LBMA published its Global Precious Metals Code (the Code)
on 25 May 2017, albeit three years later.
The Code set out a “common set of principles to promote the integrity and effective
functioning of the global market”. According to the LBMA’s Chairman, the Code would
contribute to maintaining “an effective, fair and transparent market”.
However, it merely laid out what the LBMA deemed best practice and, once again, was
lacking in “teeth” from a legal, or even regulatory standpoint – as it even
acknowledges:
“(It is) not intended to be a comprehensive guide to doing business in the Precious
Metals market…This Code does not impose legal or regulatory obligations on Market
Participants.”
January 2020 28You can also read