ENTERING THE VIETNAMESE TEXTILE AND APPAREL CONSUMER MARKET - Case: Marimekko - Theseus
←
→
Page content transcription
If your browser does not render page correctly, please read the page content below
ENTERING THE VIETNAMESE TEXTILE AND
APPAREL CONSUMER MARKET

Case: Marimekko

                  LAB UNIVERSITY OF APPLIED
                  SCIENCES LTD
                  Bachelor of Business Administration
                  Degree Programme in International
                  Business
                  Spring 2020
                  Tran Hanh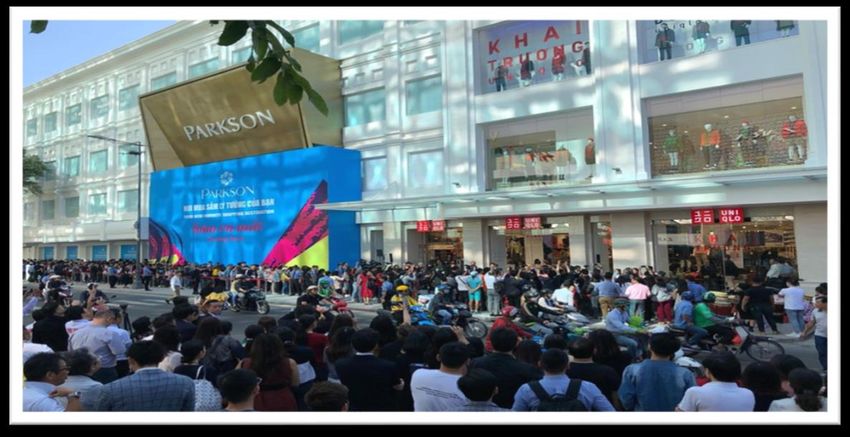
Abstract

Author(s)                             Type of publication     Published
Tran, Hanh                            Bachelor’s thesis       Spring 2020
                                      Number of pages
                                      73 pages, 6 pages of
                                      appendices
Title of publication
Entering the Vietnamese Textile and Apparel Consumer Market
Case: Marimekko
Name of Degree
Bachelor of Business Administration
Abstract
The research aims to develop a market study regarding the Vietnamese apparel and
textile industry to find out whether Vietnam is a potential market for Marimekko to
enter. A market study aids the company in understanding the target market in order to
form the right decisions and suitable strategies for entry.
Both quantitative and qualitative methods were employed in the research and both
secondary and primary data were collected to support the study. Books, journals,
articles, and reports are sources of secondary data, while direct interviews and
questionnaires are sources of primary data for the thesis.
The study was created by analyzing the macro-environment, the current situation of
the industry and the important elements of the target market including competitors
and consumers. PESTLE and Porter’s Five Forces were used as the research models
to find the answers.
The study results show that Vietnam is a potential market to Marimekko despite a
significant degree of rivalry as well as a low level of brand perception. However, a
more in-depth study of the market and more researches on product development for
the target market should be conducted before entry to ensure a successful outcome.

Keywords
Marimekko, Vietnam, consumer market, textiles, apparel
CONTENTS

1     INTRODUCTION ............................................................................................................ 1
    1.1       Thesis Background ................................................................................................ 1
    1.2       Research Objectives, Research Questions, and Limitations ............................... 2
    1.3       Research Methodology and Data Collection ........................................................ 3
    1.4       Thesis Structure..................................................................................................... 5
2     RESEARCH THEORETICAL FRAMEWORK................................................................ 7
    2.1       Market Analysis Definition ..................................................................................... 7
    2.2       PESTLE Analysis .................................................................................................. 7
    2.3       Porter’s Five Forces ............................................................................................ 10
3     VIETNAMESE APPAREL AND TEXTILE MARKET STUDY ...................................... 12
    3.1       Vietnam Overview ............................................................................................... 12
    3.2       PESTLE Analysis of the Business Environment in Vietnam .............................. 13
    3.3       Porter’s Five Forces Analysis .............................................................................. 23
    3.4       Vietnamese Textile and Apparel Market ............................................................. 26
    3.5       Consumer Analysis.............................................................................................. 30
    3.6       Competitor Analysis............................................................................................. 34
      3.6.1      Big Brands ....................................................................................................... 34
      3.6.2      Local Businesses ............................................................................................. 36
4     EMPIRICAL RESEARCH AND DATA ANALYSIS ...................................................... 40
    4.1       Marimekko Introduction ....................................................................................... 40
    4.2       Data Collection .................................................................................................... 40
    4.3       Data Analyses...................................................................................................... 42
5     CONCLUSION ............................................................................................................. 52
    5.1       Answers to Research Questions ......................................................................... 52
    5.2       Final Remarks...................................................................................................... 54
    5.3       Reliability and Validity.......................................................................................... 57
    5.4       Suggestions for Further Research ...................................................................... 58
6     SUMMARY ................................................................................................................... 60
LIST OF REFERENCES ..................................................................................................... 62
APPENDICES...................................................................................................................... 74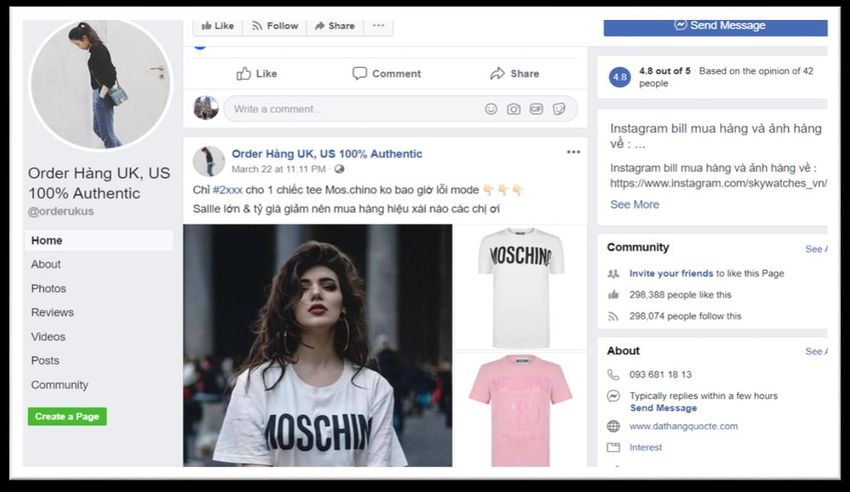
1

1     INTRODUCTION

1.1   Thesis Background

The author had the opportunity to come to Finland for the first time in 2016 to pursue further
education. Living and studying in the country, the author gradually fell for its rich culture, its
unique language, and its spectacular landscapes of the aurora. But more than anything, it
was impressive to the author how this little nation in the Nordic, with the population of just
over five million, could bring its brands beyond its borders and succeeded in international
markets. Marimekko is one prominent example.

The author started to notice the presence of Marimekko everywhere in Finland during her
very first months of living in the country. The brand’s unique style of brick and mortar stores
are on every major city. It seems that every Finn owns at least one Marimekko product. It
may be a dress, a bag, or a purse with the familiar and easy-to-recognize patterns of this
brand. When traveling overseas, the author noticed the global collaborations Marimekko
had with many big popular brands such as Banana Republic, Target, Clinique, H&M and
Uniqlo. It is undeniable that within only the recent decade, Marimekko has increased its
global visibility immensely and successfully.

The presence of Marimekko is everywhere from Europe to Asia and America. In Asia,
Marimekko has many stores in Japan, Singapore, South Korea, Taiwan, Thailand, and
China. However, Marimekko has yet to have its first store in Vietnam even though its
partner, Uniqlo, has been active in this market since December 2019 (Vietnam Insider
2019). Therefore, the author was motivated to start this research to find out whether the
Vietnamese textile and apparel market is promising to Marimekko.

It takes a lot of time and effort for an organization to research and make a decision to enter
a new market. Then, that organization must make a plan on how it will enter the new market.
In addition, it will need to consider most importantly a strategy that will help it first survive
and then thrive sustainably in that market among other big and small, local and international
competitors. Otherwise, it will cause the company to waste not only its time and efforts, but
also the monetary investments it makes to enter and exit from the market. Thus, performing
a market study is a crucial step for any organization to take when making an informed
decision on entering any new international market. The research will provide Marimekko
with a clear panoramic view of the Vietnamese market, which may help them somehow on
their way of global market expansion.
2

1.2       Research Objectives, Research Questions, and Limitations

Research Objectives and Research Questions

No businesses want to fail. Therefore, to avoid unwanted consequences, Marimekko needs
to carry out a market research before stepping into the Vietnam market. Doing this helps
the company evaluate the potential of the market through analyzing aspects such as
Vietnamese culture, the current situation of the country, future forecast, market demand,
social trends, etc. Hence, the research objective of the thesis is to develop a market study
of Vietnam for Marimekko. It serves as a reference for the company when considering
whether or not to enter this dynamically developing southeast Asian country – Vietnam.
Thus, the research questions are formed to help the thesis achieve its objectives.

The main research question is: Is Vietnam a potential market for Marimekko?

Research sub-questions are created in order to find the answer to the main question:

      •    Sub-question 1: How competitive is the target market?
      •    Sub-question 2: What is the volume of demand?
      •    Sub-question 3: Does the target customer group welcome the presence of
           Marimekko in Vietnam?
      •    Sub-question 4: What are the entry barriers?
      •    Sub-question 5: What are the risks when entering this market?
      •    Sub-question 6: What are viable strategies for Marimekko to enter the market?

Answering these questions will help Marimekko understand more about this market, its pros
and cons, its dos and do nots. Then, based on what has been studied, the company can
make the right decision and develop an effective plan for entering this market.

Research Scope and Limitations

This thesis aims to develop a study regarding the Vietnamese apparel and textile industry
for Marimekko. Thus, the author chose Vietnamese people as the target group for the
research. This group consists of people from 16 to 65 years old of both genders, but mainly
women. The research’s geographical scope is Ho Chi Minh city, Hanoi, and some other
cities within Vietnam.

Research papers always have limitations. An online survey was chosen to be one of the
data collection methods for empirical research. As a result, young adults are more active
on social media than middle-aged and older adults, it leads to the fact that the age groups
of the responders do not distribute equally. Hence, the findings mostly reflect the study of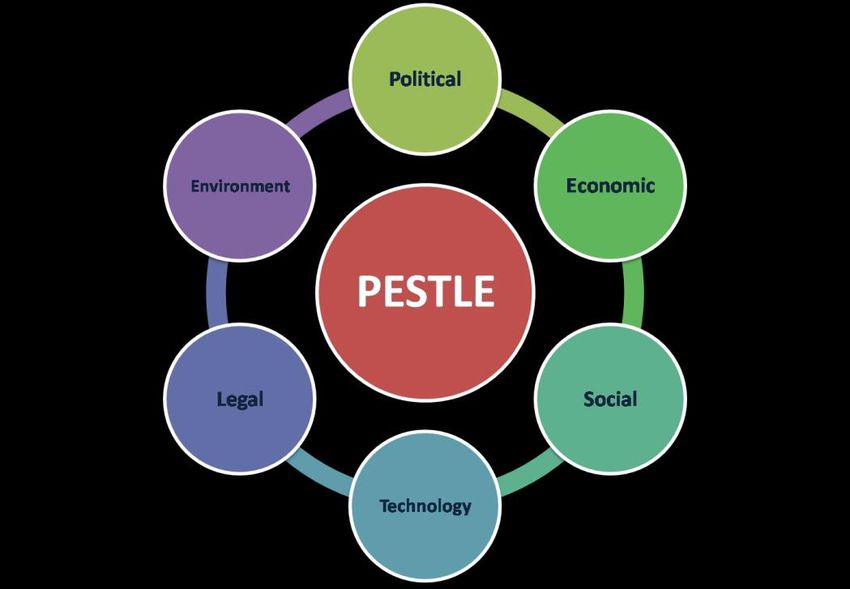
3

Vietnamese under 35 as the majority of the respondents. Being aware of this restriction, the
author designed several interviews reaching Vietnamese ladies in their 30’s to 60’s.
Unfortunately, due to the corona pandemic only five interviews were conducted. Lastly, the
thesis is created to develop a market analysis. Thus, there are recommended strategies,
but a business plan do not happen as an output of the thesis.

1.3   Research Methodology and Data Collection

Research Approach

Induction and deduction are the two available research approaches. The inductive approach
starts with observations and moves toward more extensive generalizations and theories.
That is why this approach is unofficially named the “bottom-up” approach and its illustrated
diagram is named “hill-climbing”. In contrast, the deductive approach begins by studying an
existing theory, goes down to more specific details and then comes up with a final
confirmation. For that reason, this approach is also informally called the “top-down”
approach and its step-by-step graph is called “waterfall”. (Burney 2008.)

The suitable approach for the research is determined by two elements: the research’s
nature and the amount of time available for conducting the research (Saunders, Lewis &
Thornhill 2012, 148). The purpose of this research is to analyze a market and determine its
potential as a conclusion. What is more, the timeframe of carrying this study out is
approximately three months. For these two characteristics, deductive reasoning is
appropriate for this thesis. The research approach is illustrated in Figure 1 below.

Figure 1 Deductive research approach (adapted from Burney 2008)
4

Research Methodology

According to Saunders et al. (2012, 162-164), the two dominant methods of research are
qualitative and quantitative. Qualitative method starts with observations and analyzes facts
to form a theory. Contrarily, the quantitative method starts with a theory which it then tests
for the precision of the hypothesis. (Newman & Ridenour 1998, 3.)

For qualitative research, oral information is commonly gathered. Usually, data is produced
from interviews, direct observations, investigation of artifacts, papers and cultural
documentations, visual records and individual experiences. (Stumpfegger 2017.) For
quantitative research, numeric information is normally collected through structured
interviews, surveys, observations, records, and documents. Unlike qualitative methodology,
quantitative research focuses on the information’s broadness across a significant number
of cases instead of its depth on a smaller number of cases. (Oak Ridge Associated
Universities 2020.)

The thesis objective is to determine if Vietnam is a promising market for Marimekko. Data
collected for the research includes people’s interests and behaviors regarding fashion
trends, apparel shopping, and personal expenses on clothing. For example, how much they
are willing to spend on shopping per month, or what kind of clothes they normally buy. This
data collection procedure involves both text and numeric data. On the other hand, existing
reports and statistics are also accessed to obtain figures and literal data. Accordingly, both
qualitative and quantitative methods are applied in this thesis.

Data Collection

There are two basic types of data which are primary and secondary data. Primary data is
new data that the author collects directly through the research. Secondary data, on the other
hand, are sources that are have been already published or created by other people.
(Kovalainen & Eriksson 2008, 77-80.)

According to Saunders et al. (2012, 304-305), primary data collection includes face-to-face
interviews, emails, phone calls, questionnaires, web-based surveys, emails or mails, the
researcher’s observations, etc. Secondary data collection involves sourcing from books,
articles, journals, or reports.

Based on the above information, this thesis includes primary as well as secondary data. To
collect primary data to support the study, a number of direct in-person interviews and online
survey were made with the target consumer group. To collect secondary data, published
hardcopy and digital versions of books, reports, journals, articles, dependable online
sources and knowledge from prior lectures were referred.
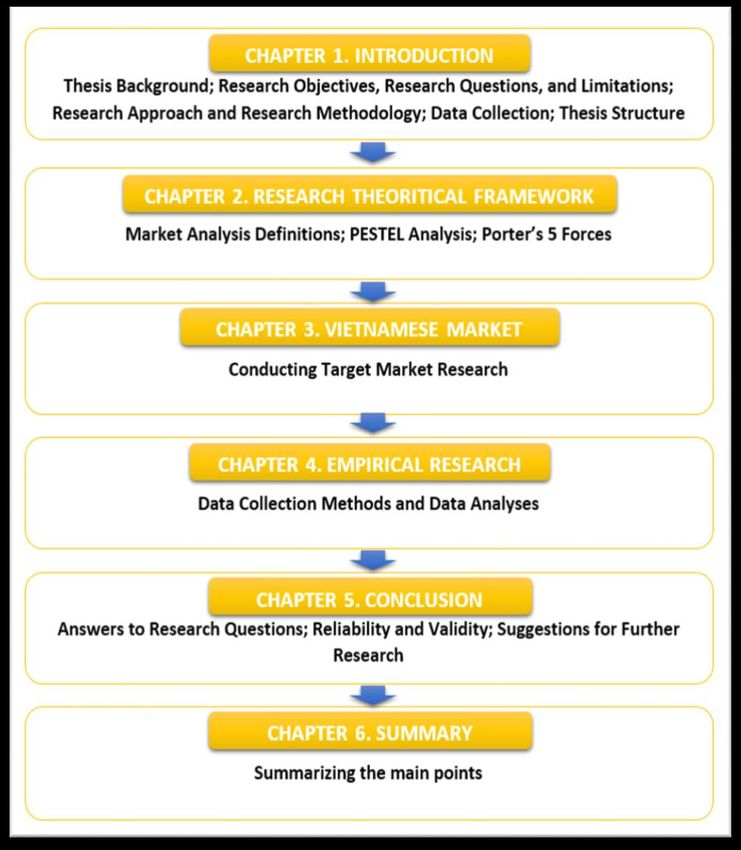
5

1.4   Thesis Structure

The below Figure illustrates the structure of this thesis with each chapter described briefly.

Figure 2 Thesis structure

Chapter 1: demonstrates the basic of the thesis. The first subchapter shows the factors that
inspired the author to form the idea of starting this market analysis. The next subchapter
presents the questions, the objectives, and the limitations of the research. Next, the
research approach and methods of conducting the study are described. The last two
subchapters respectively show the data collection methods applied in this study and the
thesis structure.

Chapter 2: entails all the relevant theories that serve as a cornerstone when conducting a
market analysis. Chapter 2 begins with the definitions of market analysis. And then, the two
6

following chapters give a detailed description of the theories that are used in the thesis,
namely PESTLE analysis and Porter’s Five Forces.

Chapter 3: is about the market analysis. In this chapter, a study of the Vietnamese apparel
and textile market is generated using secondary data collected from trusted internet
sources, reports, articles, and published books. The market analysis outline is developed
based on the author’s idea and consultation with the thesis supervisor, and general
knowledge obtained from readings and lectures. The chapter starts with a sub-chapter
giving an overview of Vietnam. The macro and microenvironments of the Vietnamese
apparel and textile industry are then analyzed using the two analysis models mentioned in
the theoretical chapter. Subsequently, the following-up chapter gives a closer look at the
apparel and textile industry of the target market by discussing critical factors that need to
be taken into account before entry.

Chapter 4: briefly introduce the company then describes the research’s data collection
procedure and data analysis. To begin with, Marimekko’s history, products and goals are
introduce. Then, the second sub-chapter provides the theories and facts relating to data
collection methods employed in this thesis. The third sub-chapter analyses the data
collected. Both qualitative and quantitative methods are utilized to collect primary data for
this research, with interviews representing the qualitative research method and
questionnaire representing the quantitative one.

Chapter 5: concludes the thesis by declaring the findings to the research questions. The
reliability and validity of the thesis as well as suggestions for further study are also
presented.

Chapter 6: is the summary chapter which recaps all the important points of the thesis.

7

2     RESEARCH THEORETICAL FRAMEWORK

2.1   Market Analysis Definition

Market analysis plays a major role in market research and is a vital element of a business
plan. Merriam-Webster (2020) defines market analysis as a component of marketing
research that is carried out to identify the nature and the size of a specific market. A market
analysis usually comes in the form of a report that assists companies in gaining more
understanding of a target market or industry. Based on the outcomes of the analysis, the
market’s opportunities and threats are addressed, providing the ground for decision-making
with which companies can access the the target markets. (IONOS 2018.) Market analysis
is useful for businesses that are planning to enter a new market. Basically, by using market
analysis as a tool to evaluate the new market, the enterprises can determine whether their
new business venture will be a smart move. (Bush 2019.)

Market analysis offers a complete picture of the target market. It helps organizations detect
a market’s attractiveness, its current and future risks, discuss the industrial outlook of the
market, analyze the competitions, and determine cultural and legal legislations. (Tanner
2020.)

2.2   PESTLE Analysis

PESTLE analysis is a situational analysis tool among the most frequently applied models
for assessing the business macro environment (Gupta 2013, 13). PESTLE is also known
for entailing smaller approaches such as PEST, PESTEL, PESTLIED, and STEEPLE
(Cadle, Paul & Turner 2010, 3). PESTLE is the acronym derived from the following: Political,
Economic, Social, Technological, Legal, and Environmental, Figure 3 (PESTLE Analysis
2020). In order to eliminate inefficiency in the process of forming decisions on the base of
the results derived from the analysis, limitations should be made-known (Perera 2017, 3).

External factors are identified opportunities and threats in SWOT analysis, thus when using
PESTLE, companies should focus on clarifying external factors instead of thinking of ways
to solve the circumstances. (Cadle et al. 2010, 5.) Using the PESTLE model as a tool to
evaluate the market and the industry before venturing into a new market, a business can
then explore market conditions and build the implementation plan based on the findings
(Perera 2017, 5).
8

Figure 3 PESTLE Analysis (Nutsen 2019)

   •   Political

Political factors are related to governmental decisions that leave impacts on the economy
or industry. For instance, legislations and fiscal policies, as well as trade tariffs and trade
conflicts. (The University of Sydney 2020.) In other words, the political environment is the
extent to which the government intervenes in the economy (University of Minnesota 2020)
such as by raising taxes on imported goods in order to promote domestic goods
consumption.

   •   Economic

Economic factors have direct effects on a company which may last for a long time (PESTLE
Analysis 2020). These factors consist of economic growth, interest rates, exchange rates,
and inflation rates (University of Minnesota 2020). For example, a company’s product prices
may increase in conjunction with a surge in inflation. Economic factors can also be divided
into macro and micro-economic factors. Macro-economic factors concern the management
of demand in an economy. Micro-economic factors deal with the way people spend, and
specifically have a significant impact on B2C businesses. (Professional Academy 2020.)

   •   Social

Social factors, also called socio-cultural factors, refer to the common beliefs and attitudes
of a community (Professional Academy 2020), ranging from consumer demographics to
9

culture and lifestyle (Investopedia 2019). Specifically, they involve health awareness,
population growth, age distribution, career attitudes, and safety consciousness.
Consumer’s tendencies as influenced by social factors bear upon the market demand for a
company’s products and services. (University of Minnesota 2020.) For example, a company
may need to change or stop the way it uses laboratory animals for testing a certain product
if the community is having a serious attitude toward animal testing. (Postlewhite 2018.)

   •     Technological

Technological factors are concerned with research and development, automation,
technology innovations, and the speed of change in technology (University of Minnesota
2020). In other words, technological factors are technological changes and their
applications in various fields, industries, and research (Investopedia 2019). They influence
businesses through the development of new means of communicating with target markets,
and new methods of producing and distributing goods and services (Professional Academy
2020).

   •     Legal

Businesses need to understand the legal aspects of the market in which they are operating
so as to succeed in trading because different countries have different standards and
regulations. All factors relating to health and safety, equal opportunities, consumer rights
and laws, advertisements and product labeling are included in this category. (Professional
Academy 2020.)

   •     Environmental

Environmental factors are factors related to weather, climate change, geographical location,
environmental offsets. They have vital effects on industries such as farming, tourism,
agriculture, etc. (PESTLE Analysis 2020.) These factors have increasingly become crucial
in the last two decades, given the growing scarcity of raw materials, contamination issues,
demand for more ethical and sustainable operations, and carbon emissions targets set by
the governments (Professional Academy 2020).
10

2.3       Porter’s Five Forces

Porter’s Five Forces is a model that was developed by Harvard Business School professor
Michael E. Porter. As shown in Figure 4, the model consists of five threatening elements -
powerful buyers, powerful suppliers, potential new entrants, substitute products, and degree
of rivalry. According to Porter, the structure of all industries is pillared by these five forces.
They also determine the rules of a competition and the primary causes of profitability for an
industry. (Porter 2008, 78-93.)

                                                THREAT OF
                                                  NEW
                                                ENTRANTS

                               POWER OF       COMPETITIVE         POWER OF
                              SUPPLIERS         RIVALRY            BUYERS

                                                THREAT OF
                                                SUBTITUTE
                                                PRODUCTS

Figure 4 Porter’s Five Forces (adapted from Porter 2008, 78-93)

      •    Rivalry Among Existing Competitors

This force represents the quantity of rivals existing within an industry and their power to
surpass one another. The more competitors, the more diverse the ranges of products and
services offering available, the less power a company has. On the contrary, the lower the
degree of rivalry, the bigger the power a company has, for example, to set higher prices
and customize conditions of trade agreements to reap more profitability. (Porter 2008, 78-
93.)

      •    Threat of New Entrants

This force represents the threat posed by potential new entrants into the market. Peculiarly,
new entrants with relevant proficiencies and a strong financial bases can take advantage of
their available resources to compete. (Porter 2008, 78-93.) The current position of a
company may be weakened substantially if the time and money required to enter a market
are low and vice versa. In other words, an ideal market for companies to operate in is a
market with strong barriers to entry. (Chappelow 2020.)
11 • Bargaining Power of Suppliers The third force comes from suppliers in terms of the amount of suppliers providing main inputs of goods or services, the peculiarity of these inputs, and the costs of switching from one supplier to another. Thus, a company would depend greatly on a supplier if there are only a few available suppliers in the industry. Consequently, the supplier would have a greater power to control the prices and other aspects of the trade arrangements. For example, prices would be charged higher or product and service quality would be inadequate. The profitability of an industry can be limited when the suppliers are more powerful. In contrast, the more suppliers there are in an industry or the lower the costs of switching suppliers, the more power a company holds over the costs of inputs and the margins of their profits. (Chappelow 2020; Porter 2008, 78-93.) • Bargaining Power of Buyers The next factor that has effects on an enterprise is the power buyers have when it comes to decreasing prices. The strength of this force depends on the number of buyers existing in a market, the significant of each customer, and the costs to attract new customers and to market its products or services. When a company has a small but powerful customer base, these customers have greater power to bargain for cheaper prices and better deals. On the other hand, when a company has a large but independent customer base, the company has the power to control the prices in its best interest. (Chappelow 2020.) Power of buyers is considered to be the counterpart of power of suppliers because it can push companies to lower prices and provide better quality and service (Porter 2008, 78-93). • Threat of Substitute Products or Services The last force is the threat of substitute products or services, meaning products or services that can replace a companies’ available ones. A company’s power could decrease if its customers have the options to choose from identical or near-identical alternatives offered by other companies in the market. By contrast, when a company’s products or services are unique and have no close substitutes, its power over the prices and favorable terms would increase. (Chappelow 2020.) The profitability of a company would be limited by ceiling prices established by substitute products or services. If a company does not constantly prop itself up by employing good marketing practices and enhancing product performance among other possible operational upgrades, its profitability and growth potential will be badly impacted. (Porter 2008, 78-93.)
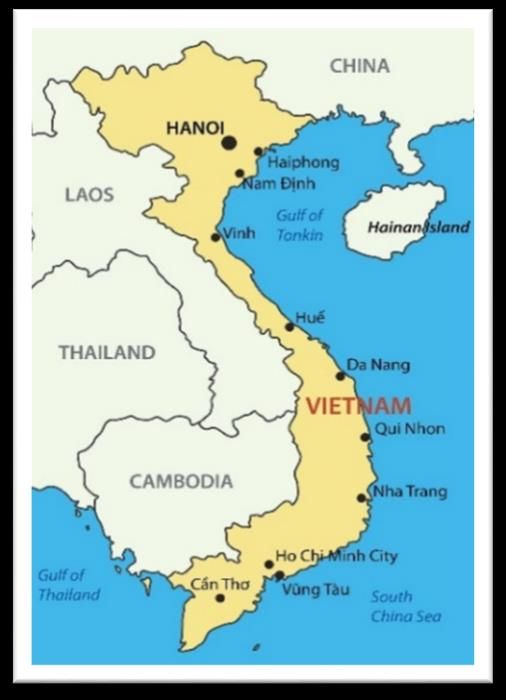
12

3     VIETNAMESE APPAREL AND TEXTILE MARKET STUDY

3.1   Vietnam Overview

With a land area almost equal to that of Norway, Vietnam is a small country with a population
of over 98 million (Countrymeters 2020). It is situated in southeast Asia, bordering three
countries - Cambodia, Laos, China, and two seas - the South China Sea, and the Gulf of
Thailand. Hanoi is the country’s capital city, but the biggest city is Ho Chi Minh City which
is also known by the name Saigon (Image 1).

Having been frequently invaded by China from the Third Century until XX Century after its
expansion into the south, Vietnamese history and culture have been greatly influenced by
the Chinese. After the end of the civil war between the north and south in 1975, the whole
country has been governed by the Socialist Republic Party until today. (Jamieson, Hickey,
Duiker, Buttinger, Osborne & Turley 2020.) This is the only political party the country has.

Image 1 Vietnam (Vietnam Maps 2020)

Vietnam is ranked 115th out of 190 countries around the world with a score of 85.1 for ease
of doing business for 2020, surpassing Malaysia at 126th with 83.3, Indonesia at 140 th with
81.2, and Laos at 181st with 62.7 (Doing Business 2020).

In 2019, Vietnam was ranked 42nd out of 129 countries in the world on the Global Innovation
Index (GII) by the World Intellectual Property Organization. Last year was also the first year
Vietnam ever achieved this ranking. The GII positions countries by evaluating 80 factors
13

including both traditional and modern measurements such as international patents or mobile
application creations. (Vietnam Investment Review 2019.)

According to a report from Transparency International (2020), in 2019, Vietnam was ranked
96th out of 180 countries in the world for corruption level with a score of 37 on 100, in which
0 is highly corrupt and 100 is very clean. This was an improvement for the country seeing
that it was granted the score of 33 in 2018 and 35 in 2017.

Since the establishment of the Socialist Republic after the reunification in 1975, Vietnam
has not experienced any critical riots against the political system. There was only a few
disturbances in recent years such as the anti-China protests in the lower center of Vietnam
in 2014 (Hodal & Kaiman 2014) and the mass protests against the government’s
cybersecurity law which required international media companies like Google and Facebook
to situate their local offices in Vietnam and store all data relating to Vietnamese users within
the country (Nguyen & Boudreau 2018). However, these riots were extinguished quickly
and at times violently by the government following their eruptions. The freedom of speech,
press, and access to international information in Vietnam is limited. Any operations of
establishments dedicated to human rights, independent labor, and politics are banned in
Vietnam. (Human Rights Watch 2019.) In general, Vietnam and its citizens are completely
controlled by the government. Freedom House, the US government-funded rights group,
has indicated that Vietnam is one of the harshest environments for media in Asia and
declared the status of press freedom in Vietnam as “not free”. Indeed, Vietnam was ranked
176th among 180 countries in the world by World Press Freedom. (Ghani 2019.) In short,
foreign businesses need to acknowledge the media regulations of the country in order to
avoid any unexpected consequences while doing business there.

3.2       PESTLE Analysis of the Business Environment in Vietnam

In order to understand in depth the textile and apparel industry in Vietnam, a study of the
business’s surrounding environment is necessary to be conducted beforehand. By using
the PESTLE model, this sub-chapter analyses the business macro-environment in the
country. Here the author presents relevant factors with thoroughness and a focus on the
impacts they have on international enterprises operating in Vietnam.

      •    Political

All companies and individuals selling goods and services for commercial purposes are
required to pay tax. In 2020, Vietnam’s Corporate Income Tax (CIT) rate is set at 20% - the
fifth year in a row. This is the lowest rate in 20-year-period. The amount companies are
charged with for CIT depends on their net income in a fiscal year. (Trading Economics
14
2020a.) Figure 5 shows more details of the tax rate Vietnam has had for each year from
2000 to 2020 and is forecasted to have for the next three years.
35 32.5 32 32 32
30 28 28 28 28 28
25 25 25 25 25
25 22 22
20 20 20 20 20 20
20 17 17
%
15
10
5
0
2000 2005 2010 2015 2020
Figure 5 The Corporate Tax Rate in Vietnam 2000-2020 (adapted from Trading
Economics 2020a)
Business License Tax (BLT) is an indirect tax. It is applied to all businesses, organizations,
and individuals – both domestic and foreign, that engage in the country’s business activities.
The tax is required to be paid annually. The total amount depends on the company’s
registered capital as listed on their business registration certificates. (Samuel 2020.) Table
1 shows the amount of BLT rates per year for businesses in Vietnamese Dong (VND).
Table 1 Business License Tax (BLT) Rates for Economic Entities (Samuel 2020)
REGISTERED CAPITAL (BILLION VND) BLT / YEAR (VND)
Over 10 3,000,000
Under 10 2,000,000
Branches, representative offices, business 1,000,000
premises, public service providers, other
business entities
All products and services used with the purposes of production, trading, and consumption
are subjected to Value Added Tax (VAT) in Vietnam. Imported goods are required to pay
not only VAT but also import duties to the customs authorities. (PwC Vietnam 2019a.) The
following Table 2 and Table 3 indicate the VAT rates and the formula to determine the VAT
payable amount, respectively.15
Table 2 VAT Rates in Vietnam (adapted from PwC Vietnam 2019a)
RATE Applicability
0% Goods and services exported or sold to non-tariff zones, goods sold to duty-
free shops, and other exported services.
5% Goods and services belong to the follow categories:
Clean water; teaching aids; books; unprocessed foodstuffs; medicine and
medical equipment; husbandry feed; various agricultural products and
services; technical/scientific services; rubber latex; sugar and its by-products;
certain cultural, artistic, sport services/products and social housing.
10% Other goods and services.
Table 3 VAT payable amount calculation (adapted from PwC Vietnam 2019a)
Determination of VAT payable
Annual revenue from 1 VAT payable = Output VAT – Input VAT
billion VND
Annual revenue of less VAT payable = Value added of goods or services sold x VAT
than 1 billion VND rate
• Economical
After the application of a series of political and economic reforms dubbed “Đổi Mới” in 1986,
Vietnam has changed significantly in all aspects. From 2002 to 2018, 45 million people were
lifted from poverty. The proportion of national poverty decreased from more than 70% to
under 6%. Gross Domestic Product (GDP) per capita grew 2.5 times stronger, recording at
2500 USD in 2018. (World Bank 2019a.) Figure 6 demonstrates the growth in Vietnam’s
GDP in a 25-year-period between 1995 and 2019, as well as a forecast for 2020.16
300
250
Billion USD 200
150
100
50
0
1995 2000 2005 2010 2015 2020
Figure 6 GDP of Vietnam 1995-2020 (adapted from Trading Economics 2020b)
In June 2019, the government of Vietnam together with the Euro Commission signed the
EU-Vietnam Free Trade Agreement (EVFTA) and the Investment Protection Agreement
(EVIPA) in Hanoi. These accords eliminate some existing limits to trade and investment
collaboration between the two parties. The EVFTA has been considered to be the most
promising free trade agreement that the Euro Commission has ever signed with a
developing country like Vietnam. (PwC Vietnam 2019b.) However, textile companies in
Vietnam were unable to immediately receive the fully tax deductions granted under this
agreement since the tax rate is decreased gradually from 12% to 0% in a span of three to
seven years (PN 2019). Figure 7 below depicts the timeline for Vietnam’s integration with
the global economy from 1986 to 2019.
Became a
Signed the EU-Vietnam Free
member of Participate in Joined the
Doi Moi Trade Agreement (EVFTA)
ASEAN and World Trade ASEAN
(Political and and the Investment
normalized Organization Economic
Economic Protection Agreement
relationship (WTO) Community
Reforms) (EVIPA)
with USA (AEC)
1986 1993 1995 1998 2007 2008 2015 2018 2019
Vietnam – Japan Signed the
Collaborated Entered the Asia-
Economic Comprehensive and
with World Pacific Economic
Partnership Progressive Agreement
Bank, IMF… Cooperation
Agreement for Trans-Pacific
(APEC)
(VJEPA) Partnership (CPTPP)
Figure 7 Timeline of the global economic integration of Vietnam (adapted from PwC
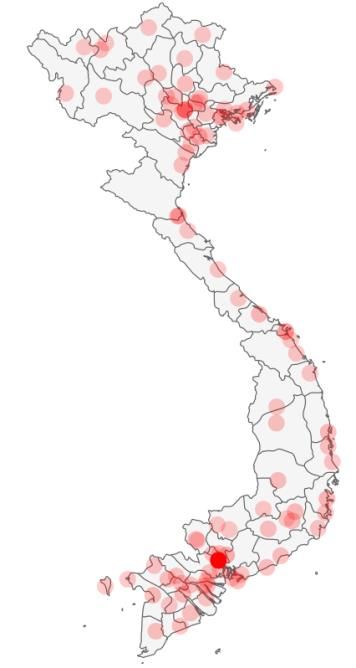
Vietnam 2019b)17 During the time the author was conducting the thesis, the coronavirus outbreak occurred suddenly and rapidly spread uncontrollably all over the world. Vietnam was one of the countries suffering from this global epidemic. In order to stop the spreading of coronavirus, the Vietnamese government ceased to grant visa to all foreign citizens (Vu 2020). Additionally, the authorities also put a number of main streets under temporary lockdown and commanded businesses to close early (Le 2020). People were advised to stay at home and avoid going to public and crowded places. Schools were closed and many employees were required to work from home or even laid off. As a result, the pandemic greatly affected the performance of the Vietnamese economy in particular and the global economy as a whole. In Vietnam, its major impacts were felt through the following elements: growth, investment, and trade, interruption of critical production, and a decrease in consumption of services and tourism. (Anh 2020.) Heavily wounded industries included textiles, footwear, aviation, and technology (Vietnam Financial Times 2020). • Social According to Countrymeters (2020), Vietnam has an almost equal ratio of men and women in its population, with the male population at 49.4% and the female population at 50.6%. The percentage of people under 15 years old is 25.2%, while the proportion of people over 65 years old is just 5.5%. A such, the population from 15 to 64 years old takes up to 69.3%. Figure 8 represents the proportions of different age groups and genders in Vietnam. Figure 8 Vietnam age ratio and gender ratio (Countrymeters 2020) In 2019, 37% of the Vietnamese population lived in urban areas, which translates to more than 35 million people. In 2020, this amount increased to over 36.7 million or 38%. The population density of the country is 311 people per Km2 or 806 people per mi2, calculated on the country total area of 310,070 Km2. (Worldometer 2020.) Table 4 presents Vietnam population in six major cites, follow by the Vietnam population distribution map. As shown
18

in Figure 9, the shade displayed corresponds to the magnitude of the population. The darker
the shade, the higher the value.

Table 4 Vietnam population in major cities (City Population 2019)

                          Population in major cities of Vietnam

 Ho Chi Minh City                              7,021,000

 Hanoi                                         3,471,000

 Da Nang                                       988,561

 Hai Phong                                     841,000

 Bien Hoa                                      807,000

 Can Tho                                       804,000

Figure 9 Population Distribution in Vietnam (World Population Review 2020)

According to World Bank (2019b), the total number of people present in the labor force in
Vietnam was over 57 million, and the participation rate was estimated at over 76%.
Particularly, 42% of these people had work related to agriculture, 35% were involved in
services, and 23% participated in the industry. In 2007, Vietnam joined the World Trade
Organization (WTO) and since then the national structure for labor sources has changed
19
speedily. The demand for skilled workers has increased from 10 to 15% in recent years as
more foreign companies have entered the market. However, the increased rates of basic to
averagely skilled occupations still exceeded that of highly skilled job positions. On the
contrary, elementary works fell dramatically from 61.7% to 39.98% with a 5.98% of decline
rate every year and low skilled labor demand dropped swiftly partly due to constant
improvements in educational policies implemented by the government. (Iris Data-Driven
Agency 2019.)
In order to stay competitive, the Vietnamese government has implemented many essential
reforms for the economy’s most major sectors with the objectives of improving labor
productivity, skills, and quality. The success of these efforts was proved by a rise of 22.5%
in labor productivity since 2008 and in 2017 the labor productivity per employee was 93.2
million VND (4,159 USD). (Das 2018.)
The average monthly salary of an employee in Vietnam was 6.6 million (290 USD) in 2017,
9.3% higher than the earlier year (Das 2018). In particular, they usually spend 11% of their
monthly income on clothes and footwear (Nguyen 2018a). Figure 10 shows monthly
spending on different categories of Vietnamese people.
7
Health 9
Gadgets & household items 34
Transport & communications 10
Clothes & footwear
Utility
11
Entertainment & education
Food & drinks
16 13
Figure 10 Monthly spending of Vietnamese people (adapted from Nguyen 2018a)
According to PwC Vietnam (2019b), the average salary per hour for people working in
manufacturing is estimated to be $3 in 2020, while their counterparts in China can earn up
to $6.5 per hour. Table 5 shows the median monthly wages in different cities and Figure 11
describes the average monthly salary of a typical textile manufacturing worker in different
Asian countries.20
Table 5 Median Monthly Salaries in Vietnam by cities (Vietnam Economic Times 2018)
Median Monthly Salary in Vietnam (USD)
Ho Chi Minh City $456
Hanoi $407
Da Nang $452
Binh Duong $444
Bac Ninh $421
372
400 320
350 270 255 248
USD/month
300 231
250 197
200
150
100
50
0
Figure 11 Average monthly wages of a manufacturing worker in different Asian nations
(Hoang, Nguyen & Duong 2019)
• Technological
In 2019, 64 million Vietnamese used the internet, of which 94% used the internet daily and
6% used at least once a week (Brands Vietnam 2019). This number jumped to 68.17 million
people in January 2020 (Hootsuite 2020). According to Hootsuite (2020), there were 65
million active social media users in January 2020. Although there are many mobile
applications, Vietnamese people still spend 65% of the total time they dedicate to phone
usage on four certain applications, namely Facebook (31%), Youtube (13%), Messenger
(11%), and Zalo (10%). As a result, media companies are incentivized to use Facebook and
Youtube more, and these channels have therefore become information centers.
Vietnamese people also use social networks and SMS text more than websites and emails.
Over 90% internet users participated in social networks and texting, and the time they spent
on social media channels is five times higher than that on websites. (Phuong M, 2019.)21
Vietnamese people usually spent 6 hours 30 minutes every day on the internet, of which 2
hours 22 minutes is spent on social media and 2 hours 09 minutes on television (Hootsuite
2020). Thus, television advertisements and social media networks are efficient making
stream through which a company can build brand visibility and brand awareness, learn more
about the target audience, and build a connection between its brand and the consumers.
Although a high percentage of people use smartphones, payment via phone applications or
other usages of digital financial services, are not yet prominent in Vietnam. The amount of
people who use payment apps accounted for only 12% of total smartphone users (Phuong
M, 2019). Only 30% of adults have a bank account, 4.1% of which had a credit card and
21% made online payments (Hootsuite 2020). In general, the Vietnamese still prefer to use
cash as the main payment method.
Although the development of the internet and technology has played a vital role in business
operations, many retail enterprises in Vietnam have yet to fully utilize technological
advancements to optimize resources, reduce costs, and reinvest. The Big C supermarket
chain, for example, has only started to apply technology several years ago. In a survey with
more than 1,000 respondents who are shop owners, entrepreneurs of small and medium
businesses, 30% of them still used written papers to manage their operations, almost 60%
used Excel files, only a few enterprises knew how to apply technology in their sales through
multi-channels. (Nhanh 2018.) It can be said that most retail businesses in Vietnam still
operate in the traditional way. In other words, it is a big market full of opportunities for any
foreign companies that already have an existing system of highly technological operation to
invest in.
• Legal
As Foreign Direct Investment (FDI) plays a vital role in Vietnam’s external economic affairs,
the government is striving to become a more and more attractive market to overseas
investors by continuously enhancing policies and institutional infrastructure with regard to
business and investment (Nguyen 2013). Specifically, the authorities have improved the
legal system, established better incentives and taxation regulations in favor of international
investors, and attempted to uphold its commitments in accordance with the world
community (Nordea Trade 2020).
Foreigners are authorized to do business in Vietnam through both direct and indirect foreign
investment. Direct investment means an individual or an organization from a foreign country
can fully own a business in Vietnam or partake in joint ventures with a Vietnamese business.
On the other hand, when a foreign person or company buys shares of a Vietnamese22
enterprise or invests in stocks and funds, it is considered as indirect foreign investments.
(Angloinfo Vietnam 2020.)
Before opening a business in Vietnam, a foreign company is required to supply four types
of legal documents: a certificate of incorporation, a company charter or articles of
association, audited financial statements of the previous twelve months, and valid personal
identity cards or passports of any of the business’ legal representatives. (Angloinfo Vietnam
2020.)
A foreign company has two options for storing money when doing business in Vietnam:
deposit its money in a foreign currency account of a Vietnamese bank or convert that money
into Vietnam Dong. Restrictions may be imposed when transferring the money out of the
country if the purpose of transferring does not fall under one of the following six categories:
Payment for imported goods and services.
Payment by overseas investors for:
- investing or reinvesting capital returned from business investment in Vietnam
- primary and interest on exterritorial loans and credits
- other legal benefits.
Payment for employees’ travel grants.
Payment of wages to Vietnamese employees working abroad.
Payment of wages and other statutory income to foreign employees.
Payment of wages to the board of management of foreign capital companies. (Angloinfo
Vietnam 2020.)
• Environmental
The environment in Vietnam, in general, is polluted. Hanoi, its capital city was ranked the
seventh most polluted city in the world by AirVisual in 2019 (Nguyen 2020). This is due to
many factors, including gas exhaust, industrial production emissions, inefficient waste
disposal, construction of buildings, contaminated natural water resources, littering, etc. The
primary causes are that the environmental consciousness of Vietnamese people is still low,
manufacturers are irresponsible, and the government has not set sufficient punishments for
individuals or organizations that are harming the environment.
In some regions, people were furious enough to speak out against the production activities
of some local factories that dispose of their industrial wastes in reckless manners (Do 2019).23
A Hongkong apparel and textile company, Smart Shirts, was fined 138 million VND (5800
USD) for excessively and repeatedly releasing poisonous chemical wastes into the
environment (Ngoan 2019). However, not all companies are penalized for their
environmental damages for some reasons. Chau Giang textile company, for example,
contaminated the air with incinerated wastes, but was strangely ignored by the authorities
(Doan 2019).
Unlike many other countries in the world, retail businesses and supermarkets in Vietnam
offer free plastic bags to all buyers. As a result, the amount of plastic wastes is
unimaginable. Typically, 35 plastic bags are consumed per week by a household and for all
households, this number adds up to 938 million bags per weekly (Nhien 2019). Using plastic
bags in everyday life’s activities has become a habit and eventually a culture in Vietnam.
Disposable plastic bags are considered to be convenient and free by Vietnamese and that
is why there are very few people who bring their own bags when going shopping. (Nguyen
2018b.) However, there have been several prominent changes regarding the replacement
of plastic bags implemented by retail businesses recently. For instance, many supermarket
chains have started using leaves to wrap vegetables instead of plastic wraps (Quynh 2019).
According to Brands Vietnam, 86% of Vietnamese consumers are willing to pay more for
products and services that have positive impacts on the environment (Uyen 2019). This
shows that Vietnamese people have heightened their awareness of environmental
protection.
3.3 Porter’s Five Forces Analysis
This sub-chapter describes the competitive environment within the Vietnamese garment
and textile industry using Porter’s five forces model.
• Threat of New Entrants
Firstly, the threat of government restrictions on the industry is considered to be low since
all kinds of investments in the textile industry are promoted. However, due to an increasing
amount of industrial wastes and emissions from the dying activities carried out large textile
factories in recent years, policy barriers have been set slightly higher.
Secondly, capital and technology requirements are moderate. For small to medium-sized
businesses, the costs for setting up textile and apparel shops are low. Specifically, the cost
of renting a street-front business premise with an area from 10 to 300 m2 in major cities is
5 million to 50 million VND/ month (200 – 2000 USD/month). For larger shops with an area
from 300 to 500 m2, the price can go up to 250 million VND/month (10,000 USD/month).
(Batdongsan 2020; Cho Tot 2020.) The cost of buying goods from suppliers depends on24 the size of the businesses, ranging from 50 million to 1 billion VND and more (2,000 – 50,000 USD). Also, the costs for setting up the facilities, installing management software and other equipment are from 30 to 50 million (1000-2000 USD). (Sapo 2019.) For establishing a textile and apparel factory in Vietnam, the capital and technology requirements are relatively high because of the expensiveness of initial investments in the production chain, hiring employees, setting up facilities, buying equipment, and other fixed assets are high. Thirdly, the great number of textile suppliers and traders existing in the area allows small to larger-sized businesses to have easier access to input materials as well as to distribution channels and customers. All in all, the entry barriers to the garments industry in Vietnam is assessed to be moderate. • Threat of Substitute Products or Services The threat of substitute products or services is considerably high due to the low costs of switching from one product or service to another. At the same time, the Vietnamese apparel market is filled with wide ranges of products with different prices and quality. Customers’ tendency of switching products following shifts in income, trends, age, etc. is also high. (Bui 2014.) Despite constant marketing efforts, it seems difficult for brands to maintain customer loyalty nowadays because there are many choices available in the market. In addition to big brands and specialized shops, markets are common shopping places that offer a colossal amount of similar products made by domestic textile companies or imported from China at much lower prices. Nevertheless, international brands can always compete with local brands and markets by taking advantage of their reputation, product quality and distinctiveness, and high-class services. (Hang 2020.) • Bargaining Power of Buyers Given the huge size of the young to middle-aged demographic in Vietnam, the consumption power for all categories including clothing is strong. However, the market has been supplied abundantly with many different choices of design, quality, service, and price. Vietnamese consumers are fairly price-sensitive due to low incomes and a prevalent bargaining culture when shopping. The costs to attract new customers and to advertise are significantly high. The costs of advertisement grew three times more expensive within a decade, but the conversion rate was still low (Mai 2019). Digital media advertisement has been forecasted to reach 323.6 million USD in 2020 (VTV 2018). A 30-second advertisement on main TV channels in the golden hour frame would cost from 40 million to 90 million (1,500 – 3,500 USD) in 2019 (Garden Media 2019).
25
In general, the power of buyers in Vietnam is slightly high.
• Bargaining Power of Suppliers
Input suppliers for the apparel industry in Vietnam are plenty but there is only a certain level
of differentiation between themselves. The information revolution brought forth by the new
era has created enormous opportunities for raw material suppliers to reach their potential
buyers and vice versa. Thus, companies would find it easy to search for suitable vendors
and the costs for changing to substitute suppliers are not high. Moreover, due to a high
volume of suppliers and broad provision of information, the exclusivity of suppliers is low.
All these factors weaken the bargaining power of suppliers. However, this statement seems
to be accurate only when inputs are imported from China, South Korea, and Taiwan - the
main suppliers for Vietnamese manufacturers. Manufacturers are forced to self-produced
raw materials or buy them from domestic suppliers or suppliers from the country members
of the CPTPP in order to meet the criteria for product origin and benefit from the tax
deduction agreement. (Bui 2014.) As a result, the bargaining power of domestic suppliers
is stronger. Figure 12 shows a list of main importers for the Vietnamese apparel industry in
2019.
Others, 19%
Thailand, 5% China, 40%
Japan, 5%
US, 7%
Taiwan, 9%
Korea, 15%
Figure 12 Vietnamese textile and apparel industry’s major import market (PHS 2019)
• Rivalry Among Existing Competitors
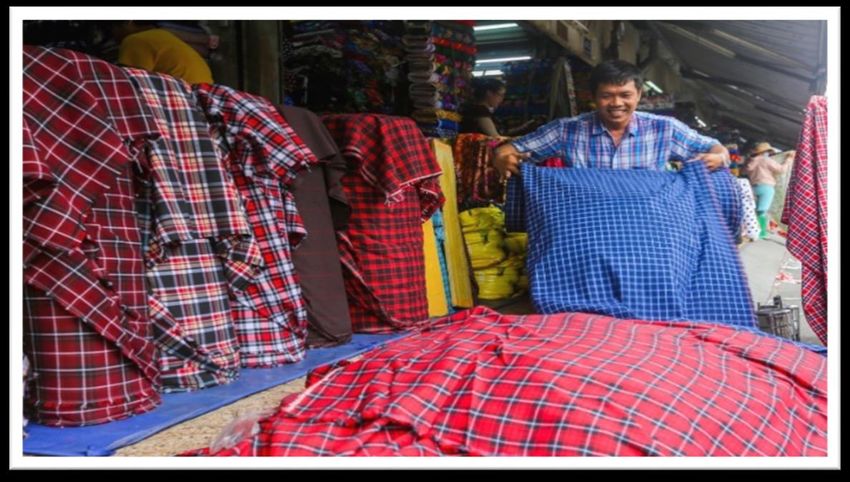
Although the market demand for clothing in Vietnam is remarkably high, the market supply
is also at an astounding level. There were 6,000 textile businesses in this Southeast Asian
country in 2019, 5,101 of which were apparel companies, taking up 85% of the total market,
780 were dying and fabric manufacturers, seizing 13%, and the 119 firms that produced
yarn and fiber, occupied the remaining 2%. (PHS 2019.) However, these firms target mainly26
overseas markets as most of their products are exports and many of them are B2B
enterprises.
On the other hand, the amount of small to large-sized retail garment businesses in Vietnam
is huge. Big brands’ stores and local smaller shops are located in shopping malls, on both
minor and major streets, in intersections, and other convenient places.
In conclusion, it can be said that the competition among rivals within the market is noticeably
intensive.
3.4 Vietnamese Textile and Apparel Market
• Apparel Market
The apparel market revenue in 2020 was 6.147 million USD with an annual growth rate of
7.6%, so the country was ranked 40th globally in term of apparel market volume. Women’s
apparel occupies the biggest segment with 3.064 million USD in market revenue. The
average revenue per capita is 63.15 USD in 2020. The market volume in terms of garment
items also grows gradually every year. To be specific, the total units of women’s clothing
produced in 2019 was 423.1 million, while for men it was 243.2 million and for kids 429.8
million. It was predicted that an increase to approximately 483 million items would happen
for women apparel, 281 million for men, and 477 million for kids. The median price per item
of clothes is 5.58 USD in 2020 and is estimated to be 6.45 USD in 2023. (Statista 2020a.)
Figure 13 shows the shares of apparel segments’ market turnover and Figure 14 displays
the price per piece of apparel from 2012 to 2023.
8000
7000
6000
5000
MILLION USD
4000
3000
2000
1000
0
2012 2013 2014 2015 2016 2017 2018 2019 2020 2021 2022 2023
Women's Garments Men's Garments Chilren's Garments27
Figure 13 The volume shares of apparel market turnover in Vietnam from 2012 to 2023
(Statista 2020a)
10 9.47
9.16
8.82
9 8.45 8.37
8.07 8.06
7.7 7.72
8 7.28 7.37
6.9 6.99
6.38 6.62 6.62
7 6.12 6.22
5.84 5.85
6 5.54 5.55
5.25 5.28
5.02
4.75
USD
5 4.47
4.17
4
2.83 2.95 3.05
2.57 2.71
3 2.29 2.44
1.95 2.05 2.15
1.64 1.75 1.85
2 1.54
1
0
2012 2013 2014 2015 2016 2017 2018 2019 2020 2021 2022 2023 2024 2025
Men's Clothing Women's Clothing Children's Clothing
Figure 14 Average price per clothing item in USD in Vietnam from 2012 to 2023 (Statista
2020a)
Online Shopping
The technological revolution 4.0 has changed drastically every aspect of people’s lives on
a global scale and at a rapid speed. It has clearly impacted all economic and social areas,
creating an abundance of opportunities for many industries, especially the retail industry. In
Vietnam, the technological transformation has improved the standards of services: more
diverse, more efficient, and quicker. In 2018, the amount of people shopping online on a
regular basis in Vietnam was 23 million, accounting for 1/3 of the total expenses of
eCommerce in Vietnam (Nguyen 2018). Fashion and beauty were the most purchased
product category for online shopping in 2019 (Hootsuite 2020). Juno.vn and Zara.com were
the two most profitable direct-sales eCommerce stores in 2019 with net sales of 36.8 million
USD and 15.2 million USD, respectively. (Statista 2020b). Shopee, Sendo and Lazada are
the prominent online shopping platforms in the country. In 2019, Shopee had almost 38
million visits to its official website while Sendo and Lazada have over 27 million (iPrice
2020). Big Vietnamese and international apparel brands like NEM, Canifa, Zara, or Adidas,
for instance, also allow their customers to shop directly from their official local websites.
Offline Shopping
Although online shopping has been a beneficial sales channel for the retail industry, in-store
sales are still the dominant channel. According to Statista (2020a), from 2017 to 2020,You can also read


