Tuna: fish and fisheries, markets and sustainability - Marie Lecomte, Julien Rochette, Renaud Lapeyre, Yann Laurans (IDDRI) September 2017 - | IDDRI
←
→
Page content transcription
If your browser does not render page correctly, please read the page content below
Tuna: fish and fisheries, markets and
                   sustainability

    Marie Lecomte, Julien Rochette, Renaud Lapeyre,
                 Yann Laurans (IDDRI)

                   September 2017

1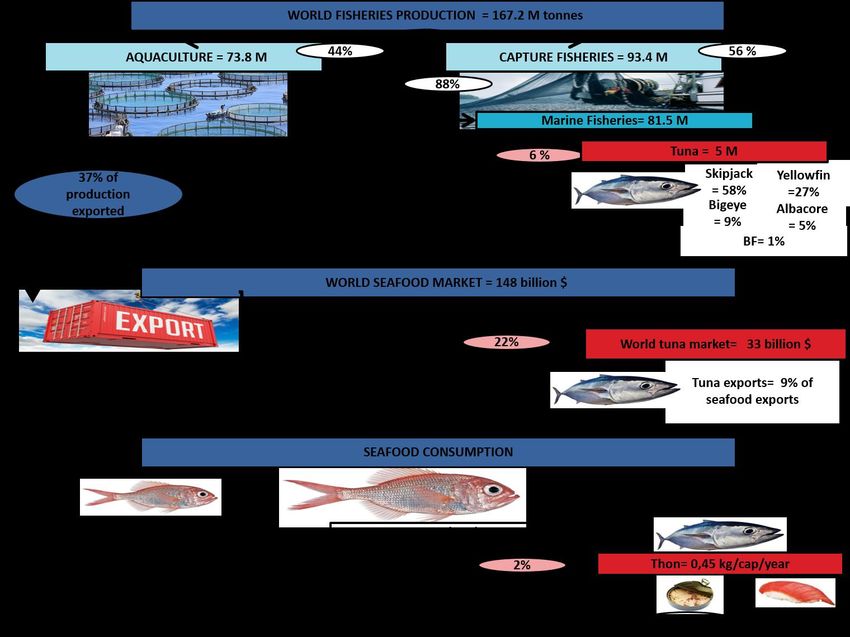
Context of the report

This report has been prepared in the context of the project “Diagnosis of the tuna industry in the Indian
Ocean”, co-funded by the Institute for Sustainable Development and International Relations (IDDRI)
and the French government in the framework of the programme “Investissements d’avenir”, managed
by ANR (the French National Research Agency) under the reference ANR-10-LABX-01.

It has been elaborated through a review of the scientific and grey literature, as well as interviews with
numerous experts and stakeholders at the global, regional and national level.

The authors would like to thank all those who kindly contributed to the preparation of this report by
providing information and insights. Special thanks go to the Steering Committee members of this
project who contributed significantly with their guidance: Selim Azzi (WWF France), Pascal Bach (IRD),
Norbert Billet (IRD), Thomas Binet (Vertigo Lab), Jacques Bruhlet (Eurothon), Christian Chaboud (IRD),
François Chartier (Greenpeace France), Pierre Commere (Association des entreprises de produits
alimentaires élaborés), Sylvain Cuperlier (Thai Union Europe), Elisabeth Druel (Client Earth), Margaux
Favet (MSC), Marc Ghiglia (Union des armateurs à la pêche), Michel Goujon (Orthongel), Patrice
Guillotreau (Université de Nantes), François Henry (AFD), Edina Ifticene (WWF France), Joséphine
Labat (WWF France), Edouard Le Bart (MSC), Francisco Leotte (MW Brands), Frederic Le Manach
(Bloom Association), Yvon Riva (Union des armateurs à la pêche), Thomas Roche (Ministère chargé de
l’écologie), Cécile Schneider (Conservation International), Pauline Soudier (WWF France), Yvan
Yvergniaux (Smart Fish).

For more information: lecomtemarie12@gmail.com / julien.rochette@iddri.org

2
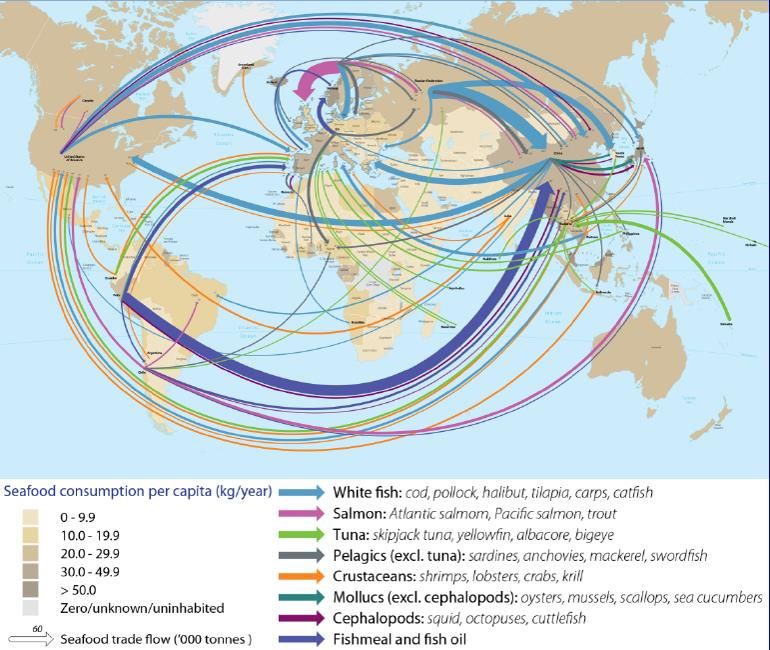
Table of contents

LIST OF ACRONYMS                                                                    5
LIST OF FIGURES                                                                     7
LIST OF TABLES                                                                      8
1. INTRODUCTION: THE PLACE OF THE TUNA SECTOR IN THE SEAFOOD INDUSTRY               9
    1.1 THE GLOBAL SEAFOOD INDUSTRY                                                 9
      1.1.1 Supply increasingly dependent on aquaculture                            9
      1.1.2 Global consumption of fish and fisheries products on the rise           10
      1.1.3 Seafood products at the heart of international trade                    11
    1.2 THE SIZE OF THE TUNA INDUSTRY                                               13
      1.2.1 The different species of tuna                                           13
      1.2.2 World tuna production                                                   14
      1.2.3 World tuna consumption                                                  14
      1.2.4 A globalised market                                                     14
    1.3 OBJECTIVES OF THE REPORT                                                    15
2. GLOBAL TUNA PRODUCTION                                                           16
    2.1 GLOBAL TUNA CATCHES                                                         16
      2.1.1 The different types of fishing gear used                                16
      2.1.2 The overcapacity of the world’s tuna fleet                              18
      2.1.3 Catches are levelling off                                               19
      2.1.4 Catch distribution                                                      20
    2.2 TUNA AQUACULTURE PRODUCTION: FATTENING FARMS                                21
3. MAIN TUNA MARKETS                                                                24
    3.1 MAIN FORMS OF CONSUMPTION                                                   24
    3.2 CANNED TUNA                                                                 27
      3.2.1 Production dominated by the purse-seine fleet                           29
      3.2.2 Sale of catches: the role of major trading companies and Bangkok        29
      3.2.3 Canned-tuna processing: production overcapacity                         31
      3.2.4 By-products and waste from the tuna processing industry                 34
      3.2.5 The key role of retailers and transnational firms                       34
      3.2.6 Traditional canned tuna markets now maturing                            38
    3.3 SASHIMI-GRADE TUNA                                                          44
      3.3.1 Sashimi-grade tuna production: the longline fleet and fattening farms   46
      3.3.2 Classification of tuna for the sashimi market                           46
      3.3.3 Global sashimi markets                                                  47
4. THE KEY FACTORS INFLUENCING THE GLOBAL TUNA MARKET                               50
    4.1 STANDARDS                                                                   50

3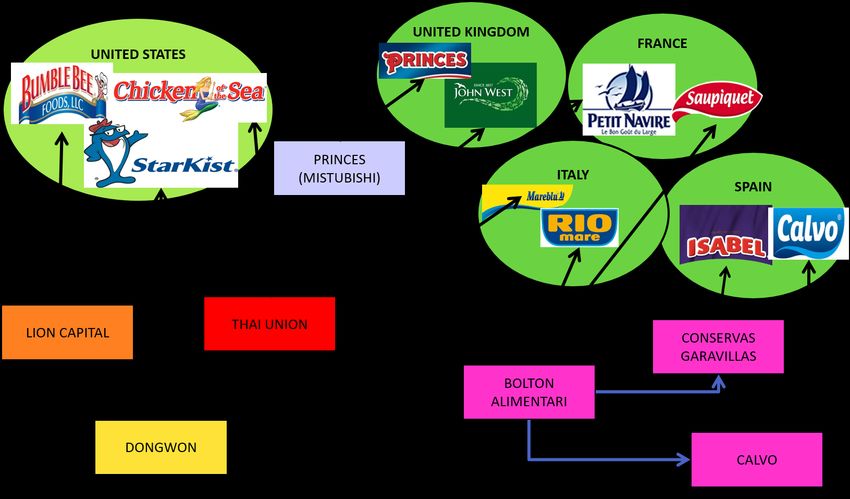
4.1.1 The Regional Fisheries Management Organisations role in managing production            50
      4.1.2 The fight against illegal, unreported and unregulated fishing                          52
      4.1.3 Health standards                                                                       55
    4.2 TARIFF REGIMES AND HOW THEY INFLUENCE MARKET ACCESS                                        56
      4.2.1 The general system: a tariff escalation policy for tuna-based products                 56
      4.2.2 Preferential tariffs that influence the location of canneries                          57
      4.2.3 Conclusion regarding tariff policy                                                     59
    4.3 THE CONSUMER TREND TOWARDS SUSTAINABLE PRODUCTS                                            60
      4.3.1 The sustainability of tuna products, a concern for consumers                           60
      4.3.2 The development of ecolabels and voluntary commitments                                 63
      4.3.3 Labelling and voluntary commitments: a useful approach – albeit with limited effects   66
5. CONCLUSION                                                                                      70
    5.1 TUNA, A MAJOR GLOBAL MARKET WITHIN THE FISH AND FISHERIES SECTOR                           70
    5.2 A GLOBAL MARKET INVOLVING NUMEROUS ACTORS                                                  72
    5.3 THE CANNING INDUSTRY, BETWEEN HORIZONTAL AND VERTICAL CONCENTRATION                        73
      5.3.1 Buyer concentration and the weak bargaining power of the fleets                        73
      5.3.2 The power of large retail chains                                                       74
    5.4 TOWARDS AN INCREASING GLOBAL DEMAND: WHAT CONSEQUENCES FOR THE TUNA FISHERIES?             76
REFERENCES                                                                                         78

4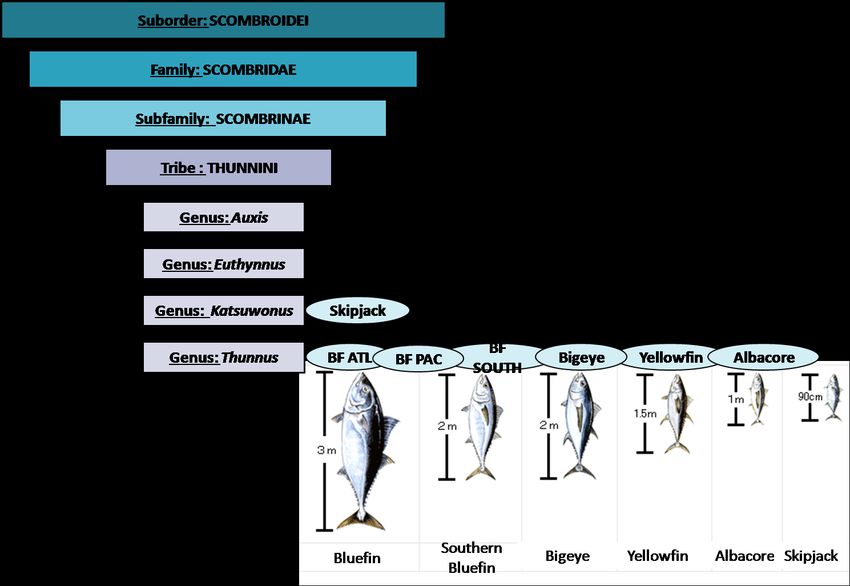
List of acronyms

ACP       Africa, Caribbean and Pacific

AGOA      African Growth and Opportunity Act

BF        Bluefin Tuna

CCBST     Commission for the Conservation of Southern Bluefin Tuna

CMM       Conservation and Management Measure

EBA       Everything But Arms

EFSA      European Food Safety Authority

EII       Earth Island Institute

EPA       Economic Partnership Agreement

EU        European Union

EEZ       Exclusive Economic Zone

FAD       Fish-Aggregating Device

FAO       United Nations Food and Agriculture Organization

FOS       Friend of the Sea

FTA       Free Trade Agreement

GRT       Gross Registered Tonnage

GSP       Generalized System of Preferences

IATTC     Inter-American Tropical Tuna Commission

HACCP     Hazard Analysis and Critical Control Point

ICCAT     International Commission for the Conservation of Atlantic Tunas

IEPA      Interim Economic Partnership Agreement

ILO       International Labor Organization

IOTC      Indian Ocean Tuna Commission

IPNLF     International Pole and Line Foundation

ISSF      International Sustainable Seafood Foundation

JFA       Japan Fisheries Authority

5
LDCs    Least Developed Countries

MFN     Most Favored Nation

MMPA    Marine Mammal Protection Act

MSC     Marine Stewardship Council

MSY     Maximum Sustainable Yield

NGO     Non-Governmental Organization

NOAA    National Oceanic and Atmospheric Administration

NTR     Normal Trade Relations

OPRT    Organization for the Promotion of Responsible Tuna Fisheries

PNG     Papua New Guinea

SAC     Scientific Advisory Committee

SIDS    Small Island Developing States

TAC     Total Allowable Catches

TUF     Thai Union Frozen Food

ULT     Ultra Low Temperature

VMS     Vessel Monitoring System

WCPFC   Western and Central Pacific Fisheries Commission

WCPO    Western and Central Pacific Ocean

WWF     World Wildlife Fund

6
List of figures
Figure 1 : World fisheries and aquaculture production in 2014 (Source: M. Lecomte, based on FAO, 2016b).         9
Figure 2: Apparent fish consumption in kg/capita/year (Source: FAO/OECD, 2015; Lem, 2014)                       11
Figure 3 : Main global seafood trade flows in quantity (Source: Nikolik, 2015)                                  12
Figure 4: Classification of scombroids and the main commercial tuna species(Source:Goujon, 2013)                13
Figure 5: Global tuna catch from 1950 to 2014 (Source: FIGIS, 2016)                                             19
Figure 6: Distribution of commercial tuna catches by ocean, species and gear in 2014 (Source: ISSF, 2016)       20
Figure 7 : Main tuna fishing countries in 2014 (Source: MACFADYEN 2016))                                        21
Figure8: Tuna production (Source: M. Lecomte, based on Macfadyen et al., 2016; Tveteras and Nystoyl, 2015)
                                                                                        Erreur ! Signet non défini.
Figure 9 : Market share of the different product forms by volume and value (Source: Macfadyen, 2016)            24
Figure 10: The main forms of tuna consumption (Source: M. Lecomte, based onMacfadyen et al., 2016)              26
Figure 11 : Global production of canned fish and fishery products in 2009 (million tonnes, product weight)
     (Source: Vannuccini, 2012)                                                                                 27
Figure 12: The canning industry (Source: M. Lecomte based onMacfadyen et al., 2016; Hamilton et al., 2011)) 28
Figure 13 : Volatility ranking for major commodity prices (lower is more volatile) (Source: Lem, 2016 based on
     Dahl and Oglend, 2013                                                                                      30
Figure 14: Location of main tuna canneries (Source: Campling, 2015a; Campling, Havice and Ram-Bidesi, 2007;
     Hamilton et al., 2011)                                                                                     33
Figure 15 : Market share of the top 10 distributors in various countries and groups of countries in 2012 (Source:
     MESIC, 2015)                                                                                               35
Figure 16: Main canned tuna markets and associated brands (Source:M. Lecomte, 2016,based onTUF, 2016; Lion
     Capital, 2014; Kalla, 2013; Bolton Alimentari, 2014; Dongwon, 2013)                                        37
Figure 17: The EuropeanUnion market (Source: M. Lecomte, based onHamilton et al., 2011; EUMOFA, 2015; Brus,
     2011)                                                                                                      40
Figure 18:The United States canned tuna market (Source: M.Lecomte, based on Hamilton et al., 2011;
     Melbourne, 2016; NOAA, 2014)                                                                               43
Figure 19: The sashimi sector (Source:M. Lecomte, based on Hamilton et al., 2011; Macfadyen et al., 2016;
     Tveteras and Nystoyl, 2015)                                                                                45
Figure 20: The Japanese sashimi market(Source: M. Lecomte,based on Hamilton et al., 2011; Kawamoto, 2016;
     Benetti, Partridge and Buentello, 2015)                                                                    49
Figure 21: The European Union’s IUU system(Source: European Commission, 2015b)                                  54
Figure 22: Limits of sustainability approaches (M. Lecomte, based on diverse sources)                           67
Figure 23: Global aquaculture and fishery production and the tuna supply chain (Source: M. Lecomte, based on
     FAO, 2016b; Macfadyen et al., 2016 )                                                                       71
Figure 24: The tuna supply chain (Source: M.Lecomte, based on Macfadyen et al., 2016; Macfadyen, 2016;
     Hamilton et al., 2011)                                                                                     72

7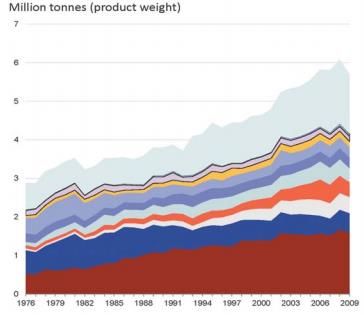
Figure 25: Bargaining power of the canning industry actors (Source: M. Lecomte, based on CAMPLING, 2012;
     Guillotreau, Mongruel and Jimenez-Toribio, 2008; Macfadyen and Defaux, 2016; Miyake et al., 2010)) 75

List of tables
Table 1: Major species of commercial tunas                                                                 14
Table 2: Aquaculture production of the three Bluefin tuna species in 2014 (Source: Tveteras and Nystoyl, 2015)
                                                                                                           22
Table 3: Annual volumes sold by the three major tuna trading companies (Source: Hamilton et al., 2011;Tri
     Marine, 2013)                                                                                         31
Table 4: Comparison of combined tuna canning capacities and tuna fleet catches in 2012 (Source: Hsu, 2012;
     FIGIS, 2016)                                                                                          33
Table 5: Global sashimi supply (Source: ISSF, 2016; Tveteras and Nystoyl, 2015)                            46
Table 6: List of tuna RFMOs (Source: ISSF, 2016)                                                           51
Table 7: Trade preference systems in the European Union and the United States (Source: Campling, 2016; Dross,
     2015; European Commission, 2015a)                                                                     58
Table 8: Summary of the status of the 23 tuna stocks in 2016 (Source:ISSF 2017)                            61
Table 9: Summary of differences between the three leading ecolabels (Source: Miller and Bush, 2015; Potts et
     al., 2016; WWF, 2012)                                                                                 64
Table 10: Commitments of some retailers for sourcing tuna supplies(Source: Leadbitter and Benguerel, 2014;
     Greenpeace, 2015a; Greenpeace, 2015b)                                                                 65

8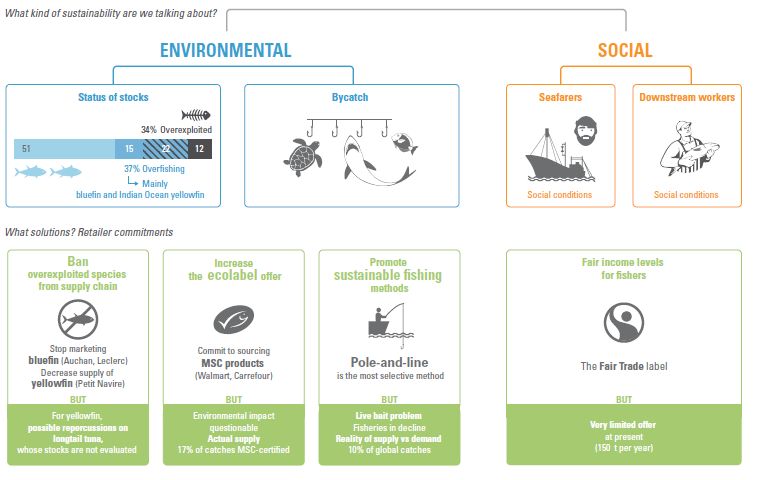
1. Introduction: the place of the tuna sector in the seafood industry

      1.1 The global seafood industry1

          1.1.1 Supply increasingly dependent on aquaculture

For fifty years, global fisheries production has been steadily increasing. While capture fisheries peaked
in the 1990s and have since levelled off, aquaculture production has seen significant growth. In 2014,
the contribution of the aquaculture sector to fish supply for human consumption for the first time
exceeded supply from wild-caught fish sector (FAO 2016a). This growth in aquaculture production is
driven by China, which accounts for 60% of world production (FAO, 2016b).

In 2014, capture and aquaculture production stood at 167 million tonnes, 44% of which derived from
aquaculture (FAO, 2016b) (Figure 1). Capture fisheries, mainly marine catches, totalled some 93 million
tonnes (FAO 2016a).

    Figure 1: World fisheries and aquaculture production in 2014 (Source: M. Lecomte, based on FAO,
                                                  2016b).

1
Seafood includes fish, cephalopods, shellfish (molluscs and crustaceans) as well as seaweeds and marine plants.

9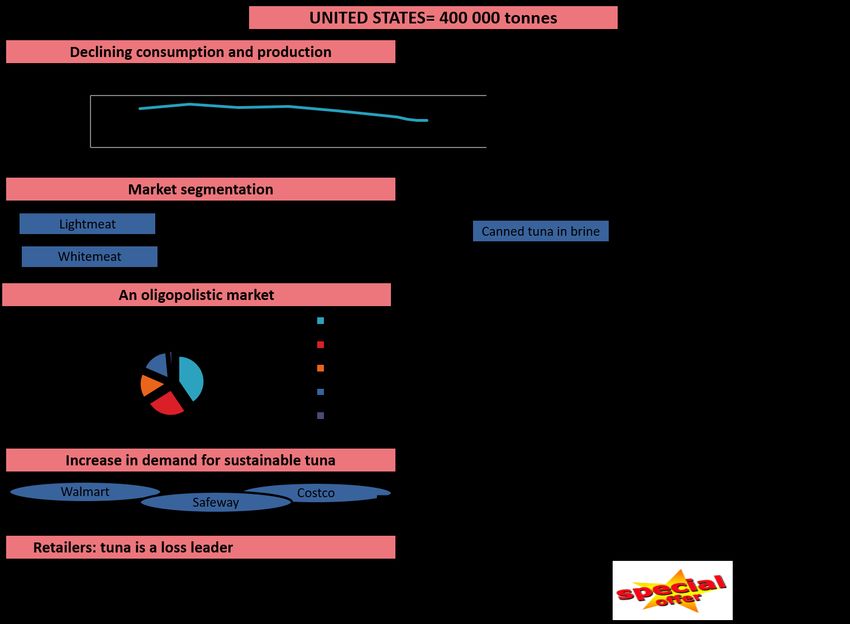
For the first time since 1998, the Peruvian anchoveta no longer ranked as the top species caught (Figure
1). The Alaska pollock accounted for the highest production, followed by the Peruvian anchoveta,
skipjack tuna, sprat and Spanish mackerel (FAO, 2016b). These five species represent 17% of world
marine catches. In 2014, the catches of four species groups with high commercial value (tunas,
lobsters, shrimps and cephalopods) reached record levels (7,7 million for tunas, 160,000 tonnes for
American lobster, 3.5 million tonnes for shrimps and 4.8 million tonnes for cephalopods) (FAO, 2016b).

Overall, the status of the world’s marine fish stocks has not improved. The share of sustainably fished
stocks declined from 90% in 1974 to 68.6% in 2013 (FAO, 2016b). Currently, 31.4% of marine fish stocks
are fished at a biologically unsustainable level (FAO, 2016b). The stocks of the ten most-productive
species are now fully fished with a very limited potential for increases in production (FAO, 2016b). This
means that world fish production is highly dependent on the world’s aquaculture production.

        1.1.2 Global consumption of fish and fisheries products on the rise

Overall, 87% of world fish production is for direct human consumption (FAO, 2016b). The remaining
21 million tonnes are mostly used by the fishmeal industry (FAO, 2016b).

At the global level, fish consumption has more than doubled over recent decades, rising from an
average 9.9 kg per capita per year (kg/cap/year) in the 1960s to 20.1 kg in 2014 (including 9.5 kg from
capture fishing) (FAO, 2016a; GLOBEFISH, 2016). This increase is partly linked to the sharp rise in per
capita fish consumption in developing countries (from 5.2 kg in 1961 to 17.8 kg in 2010), although the
highest levels of consumption are still found in developed countries (23 kg in 2013) (FAO, 2014; FAO,
2016b). According to the model developed by the world bank, the total fish production will be 186
million tons in 2030, with 62% of food fish produced by aquaculture by 2030, whereas the total fish
consumption is estimated at 151 million tons in 2030 (World Bank 2013). Figure 2 shows per capita
fish consumption in various countries and groups of countries. Oceania has the highest fish
consumption of all continents, followed by Asia.

10
Figure 2: Apparent fish consumption in kg/capita/year (Source: FAO/OECD, 2015; Lem, 2014)
Apparent fish consumption in kg/capita/year
40
35
Kg per capita per year
30 34
25
26 27 27
20 25
23 22 23
20 21 21
15 19
10
5 10
0
Nutritionally, fish is a relatively important source of animal protein. In 2013, it accounted for 6.7% of
total world protein consumption, and 17% of global animal protein intake (FAO, 2016a).In some coastal
countries, fish proteins provide up to 50% of total protein intake (especially in Indonesia, Bangladesh
and Kiribati) (Cury and Yunne, 2006).
1.1.3 Seafood products at the heart of international trade
Seafood products are one of the most traded commodities in the world: in 2012, some 200 countries
reported exporting fish and fishery products (FAO, 2014). In 2014, fish and fishery products accounted
for 9% of total agricultural exports and 1% of world merchandise trade in terms of value (FAO 2016a),
with exports worth US$ 148 billion (FAO 2016a). The main fish and fishery products traded
internationally are shrimp (15% of export value), salmon (14%), whitefish (e.g., hake and cod, 10%),
tuna (9%) and fishmeal (3%). Together, these products represent 51% of global fish and fishery product
exports (Potts et al., 2016). Figure 3 depicts the main flows of this trade.
11Figure 3: Main global seafood trade flows in quantity (Source: Nikolik, 2015) China is a major player in the capture fisheries and aquaculture trade, being not only the world’s leading producer but also top exporter of these products (FAO, 2016b). The main poles of consumption are Japan, United States (US), and European Union (EU). These markets rely heavily on seafood imports to meet their domestic demand products: in 2014, their imports totalled 63% of imports by value and 59%by volume of global imports (FAO, 2016b). In 2014 and 2015, the EU was by far the largest market for fish imports, way ahead of the United States and Japan, with a market estimated at US$ 54 billion (FAO 2016a). Over half (60%) of fish exports by value come from developing countries (FAO, 2016b). They play a key role in these countries’ economies, as in value they outstrip the main agricultural exports such as rice and sugar (FAO, 2016b). In these countries, consumption of fish products depends on local production and is more tied to supply than demand. However, consumers in emerging economies are currently seeing a more diversified supply of fish following an increase in seafood imports (FAO 2016a). 12
1.2 The size of the tuna industry

        1.2.1 The different species of tuna

The term “tuna” denotes several species of ocean fish in the Thunnini tribe. Within this tribe, 14 species
are divided into 4 genus: Auxis, Katsuwonus, Euthynnus and Thunnus (Figure 4).

Figure 4: Classification of scombroids and the main commercial tuna species (Source:Goujon, 2013)

Among these fourteen species, seven are of major importance for trade. Present in the three oceans
(except for the Atlantic and Pacific Bluefin tunas), these species (Table 1) are highly migratory,
gregarious and predatory (Goujon, 2013).

13
Table1: Major species of commercial tunas
English name Scientific name FAO abbreviation
Skipjack tuna Katsuwonus pelamis SKJ
Yellowfin tuna Thunnus albacares YF
Bigeye tuna Thunnus obesus BE
Albacore tuna Thunnus alalunga ALB
Atlantic Bluefin Thunnus thynnus ABF
Pacific Bluefin Thunnus orientalis PBF
Southern Bluefin Thunnus maccoyii SBF
1.2.2 World tuna production
All tuna comes from capture fisheries. In 2014, commercial tuna catches stood at 5 million tonnes and
represented 5.5% of global capture fisheries.
1.2.3 World tuna consumption
Tuna is one of the most popular seafood products worldwide (Guillotreau et al., 2016). World tuna
consumption is estimated at 0.45 kg per capita per year, which represents 2.2% of global fish
consumption (Glitnir, 2007). This level of consumption is close to the global consumption of Nutella
(0.51 kg per capita per year) (Mitzman, 2014), with canned tuna being the most frequently consumed
form (Chemerinski, 2013).
1.2.4 A globalised market
The tuna market is a global market. In 2013, almost half (46%) of tuna catches were traded on the
international market through globalised value chains (FAO, 2015). In the international fishery trade,
tuna is the fourth most traded product and accounts for 9% of the overall value of seafood exports,
after shrimps (15%), salmon (14%), and whitefish (10%) (Potts et al., 2016).
141.3 Objectives of the report The tuna industry is one of the most complex and dynamic fish and fishery sectors (Hamilton et al., 2011). In 2014, its final sale value was estimated at US$ 33 billion, equivalent to 24% of the global fisheries industry2 (Macfadyen, 2016). The purpose of this report is to shed light on and analyse the different links in this chain. Section 2 presents the various market segments of tuna production, while Section 3 decrypts the two main markets – canned tuna and sashimi. Section 4 identifies the key factors shaping global demand, and Section 5 concludes with a synthesis of the main trends of the global tuna market. 2 If this is based on G. Nikolik (2015), who estimated the export value of fish and fisheries products at US$ 140 billion (Nikolik, 2015). 15
2. Global tuna production

In 2014, tuna production stood at 5 million tonnes, with an ex-vessel value of US$ 9.76 billion
(Macfadyen, 2016). This production came chiefly from capture fishing (2.1) and more marginally from
tuna-fattening farms (2.2).

     2.1 Global tuna catches

        2.1.1 The different types of fishing gear used

The main types of fishing gear used to capture tuna are the purse-seine net, longline, pole-and-line
and gillnet. Other more artisanal gears are also used but this accounts for only a relatively small share
of total catches.

2.1.1.1 Purse seining
A purse seine is a long trapezoid-shaped net that encircles the school of tuna, which is then trapped as
the bottom edge of the net is drawn tight. Purse seiners are usually large vessels between 45 and 115
metres long (ICCAT, 2008). They typically use advanced technology to detect, capture and conserve
the tuna. The operation take place above the thermocline3and the tuna species targeted are mainly
skipjack and yellowfin in tropical waters, and albacore and bluefin in temperate waters (Majkowski,
2003b). Once on board, the tuna are stored in brine tanks at temperatures from-17 to -20°C
(Groizeleau, 2014). Some more recently constructed seiners are equipped with freezer tunnels for
stowage at -55°C and target European sashimi markets and steak tuna markets.

Seiners work on two fishing strategies: they can cast their seine on free tuna schools or target schools
that have gathered around natural or man-made floating objects that attract tuna swimming
underneath. Most of these floating objects, dubbed drifting fish aggregating devices (FADs), are man-
made floating structures made of wood. These have been increasingly used since the 1990s, and
currently almost 65% of purse-seine catches are carried out using FADs (Scott and Lopez, 2014). On
average, the sets of purse-seine on FADs are 50% more productive4than on free-school (Scott and
Lopez, 2014). Worldwide, it is estimated that nearly 91,000 FADs are deployed annually, which is not
without impact on the marine environment and international markets (Scott and Lopez, 2014).

3
 A thermocline is the transition layer between warmer mixed water at the ocean's surface and cooler deep water
below(NOAA 2015).
4
 In terms of tonnes per set for the three tropical tuna species combined (Scott and Lopez, 2014).

16
In terms of catch, FAD fishing results in a significant level of unwanted by-catches: 4–5% of catches per set comprise non-targeted species, such as turtles, rays and other fish species (Scott and Lopez, 2014). Moreover, the yellowfin and bigeye tuna harvested by FAD fishing are smaller (
2.1.1.3 Pole-and-line
Pole-and-line technique involves fishing tuna with poles equipped with a line and hook and is reputed
to be the most selective: “one man, one fish, one hook at a time”. This fishery operates surface fishing
and mainly targets albacore tuna. On board, the catches are generally stored in tanks filled with salt-
water ice slurry (Majkowski, 2003a). The main pole-and-line fisheries are from Japan, Indonesia and
the Maldives (Gillett, 2016). Currently, this fishing technique is widely advocated by environmental
NGOs as being the most sustainable method and the demand for tuna from bait-boat catches is on the
rise, especially in the European markets.

        2.1.2 The overcapacity of the world’s tuna fleet

The notion of fishing capacity is a concept whose definition varies depending on whether it derives
from biologists, economists or managers (FAO, 1999; Martin, 2012). However, the commonly accepted
definition is the quantity of fish that can be fished by a fishing unit (i.e., a vessel or fleet) (FAO 1999).
For the tuna fisheries, the approximation of capacity most often used is the number of vessels for
longline fleets, and the fish-holds’ capacity for purse-seine fleets (Miyake et al., 2010). The problem of
the excess fishing capacity of tuna fleets has been recognised for some twenty years (Miyake et al.,
2010). Overcapacity seems to be a feature common to all the regional fisheries management
organisations (RFMOs)and leads to excessive fishing effort (WWF, 2016).

In 2012, the companies that were members of the International Sustainable Seafood Foundation (ISSF)
committed voluntarily to cease building new vessels unless they scrapped an equivalent capacity (ISSF
2016a).However, to promote adhesion to this voluntary commitment, an 18-month moratorium was
introduced ahead of effective implementation. In addition, this commitment did not include the
seiners already under construction at the time (Valsecchi, 2016). As a result, between 2010 and 2015,
134 seiners and 136 longliners were built and put into operation (Valsecchi, 2016).

This resolution ignited a wave in purse seiner construction, and leads to the construction of faster and
bigger vessels. This helped to end the growth of purse seine vessels but contributes to increase the
fishing capacity per seiner (BRUS, 2016a).The overcapacity of fleets is not only defined by the number
of vessels (ISCF, 2009). Other factors are also taken into account, such as the vessel’s storage capacity,
their size and fishing efficiency (notably the technological advances that enhance a vessel’s efficiency)
(Miyake et al., 2010).

In purse seine fisheries, support or auxiliary vessels play a major role. These are not fitted with fishing
gear but help one or more fishing vessels to detect tuna schools and manage the FADs (Assan et al.,
2015). These support vessels should also be factored in when evaluating capacity as they help to

18
improve the seiners’ fishing efficiency. In addition, increasingly sophisticated FAD technology improves
fleet efficiency, a prime example being the development of buoys equipped with echo-sounder devices
that provide real-time information on the amount of biomass located under the rafts (ISI FISH, 2016).
This overcapacity is particularly problematic when it comes to the aspirations of some developing
countries (notably island nations) to develop their own tuna fishing fleets. In fact, as most of the global
tuna fleet is owned by developed countries, either indirectly or via joint-ventures, developing countries
are now claiming their right to develop their own fishing industry (Atuna, 2009).
In addition to the official fleet, there is also a “ghost fleet” comprising vessels over 40 years old that
should have been scrapped. These vessels are sometimes put back into operation when market prices
raise, thus creating market distortions and making it difficult to manage quotas and catches. The
annual catch of this fleet is estimated to be in the region of 600,000 tonnes (Valsecchi, 2016).
2.1.3 Catches are levelling off
Global tuna catches have rapidly and steadily increased since the 1950s (Figure 5).From 1950 to 2015,
the global catch rose from 500,000 tonnes to 5 million tonnes, representing a 1,000% increase. During
the period 1960–1990, annual catch growth was 7%; this slowed down to 3.3%between 1990 and 2000
then to 2.5%between 2000 and 2015. For the period 2010–2025, a 2% growth is projected, which
points to a levelling off of catches (Valsecchi, 2016).
Figure 5: Global tuna catch from 1950 to 2014 (Source: FIGIS, 2016)
Global tuna catch from 1950 to 2014 (‘000 tonnes)
6000
5000
4000
‘000 tonnes (t)
3000
2000
1000
0
1950
1953
1956
1959
1962
1965
1968
1971
1974
1977
1980
1983
1986
1989
1992
1995
1998
2001
2004
2007
2010
2013
192.1.4 Catch distribution
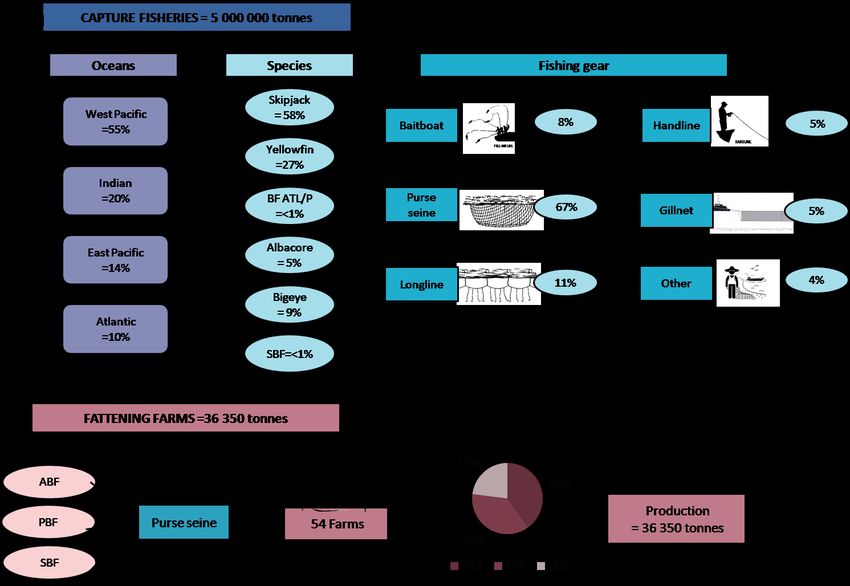
Figure 6 shows the distribution of commercial tuna catches by ocean, species and fishing gear.
Figure 6: Distribution of commercial tuna catches by ocean, species and gear in 2014 (Source: ISSF,
2016)
Most tuna are caught in the West Pacific. The Indian Ocean, in second position, accounts for 21% of
catches and the Atlantic 10%. Skipjack represents 58% of the global catch and is the most fished species
in each ocean. Yellowfin is the second most fished tuna species, accounting for 27% of catches,
followed by bigeye and albacore. The three bluefin species represent an infinitesimal share of catches
(less than 1%). The most productive fishing gear in all three oceans is the purse-seine, which accounts
for 67% of catches, mainly of skipjack and yellowfin. Longline, in second position with 11% of catches,
accounts for most bigeye, albacore and southern bluefin catches. Next comes pole-and-line (8%),
which accounts for a significant share of skipjack catches, then handline gear and gillnets, which each
represent 5% of catches.
Among the fishing nations, Indonesia is in the lead in terms of tuna catches, with 12% of the global
catch (Figure7). The Indonesian fleet, which uses an unmatched variety of gears, operates in the Pacific
and the western part of the Indian Ocean. Japan, in second position, accounts for 8% of catches and
fishes almost exclusively in the Western and Central Pacific. The Philippines, in third place, represents
7% of catches, using mainly purse-seine and pole-and-line gear (Macfadyen et al., 2016).
20Figure 7: Main tuna fishing countries in 2014 (Source: MACFADYEN 2016))
2.2 Tuna aquaculture production: fattening farms
Tuna aquaculture production began in the 1990s. Aquaculture farming involves fattening wild-caught
tuna, mainly bluefin, in large cages. The caught fish are fattened until they reach a commercial size.
Currently, three bluefin species are used in this activity: the Atlantic bluefin (mainly in the
Mediterranean), the Pacific bluefin (Japan and Mexico) and the southern bluefin (Australia)6 (Benetti,
Partridge and Buentello, 2015).
In 2012, there were 54 farms, located on the Mediterranean rim (Italy, Spain, Malta, Croatia and
Turkey), in Australia, Mexico and Japan, with an overall nominal capacity of 50,000 tonnes (Macfadyen
6
Although there have been attempts to farm yellowfin tuna in Mexico and Oman, this species is not yet produced
commercially.
21et al., 2016). In 2014, effective production of these farms stood at 36,350 tonnes distributed as shown
in Table 2 below.
Table 2: Aquaculture production of the three Bluefin tuna species in 2014 (Source: Tveteras and
Nystoyl, 2015)
Region Species Production in 2014 (t)
Japan Pacific BF 9 000
Mexico Pacific BF 4 500
Australia Southern BF 8 350
Mediterranean Atlantic BF 14 500
TOTAL 36 350
The tuna farms belong to vertically integrated joint ventures, owned by Japanese, Koreans and Spanish
interests. Regarding the Mediterranean tuna farms, the two main companies are the Japanese firms
Mitsui and Company Ltd and Mitsubishi Corporation, and the Spanish firm Ricardo Fuentes e Hijos SA.
Japanese firms are the main investors in Mediterranean tuna farms (LONGO, 2015).
Almost all production from these farms is destined for the Japanese sashimi market –to the extent that
some authors have dubbed them “sushi farms” (Longo, 2015; Kurokura et al., 2012). Farmed tuna can
have a very high market value on the end markets. In 2011, the average ex-farm price for
Mediterranean and Australian farms was 15,7 $/kg . Final market price for high grade bluefin tuna
range between 40 to 100 USD/kg (Benetti, Partridge and Buentello, 2015).
Figure 8 summarises the main species and associated fishing gear involved in tuna production.
22Figure8: Tuna production (Source: M. Lecomte, based on Macfadyen et al., 2016; Tveteras and Nystoyl, 2015) 23
3. Main tuna markets
3.1 Main forms of consumption
Tuna is supplied for consumption in several different product forms (Macfadyen and Defaux, 2016):
- Canned tuna, by far the most widespread form, and tuna pouches;
- Sashimi/sushi tuna, specific to the Japanese market;
- Tuna consumed as steaks, mainly on European and American market;
- Fresh tuna or dried/salted/smoked tuna on local markets;
- Katsuobushi, a Japanese condiment made with flakes of dried bonito or skipjack tuna, which
are fermented then smoked.
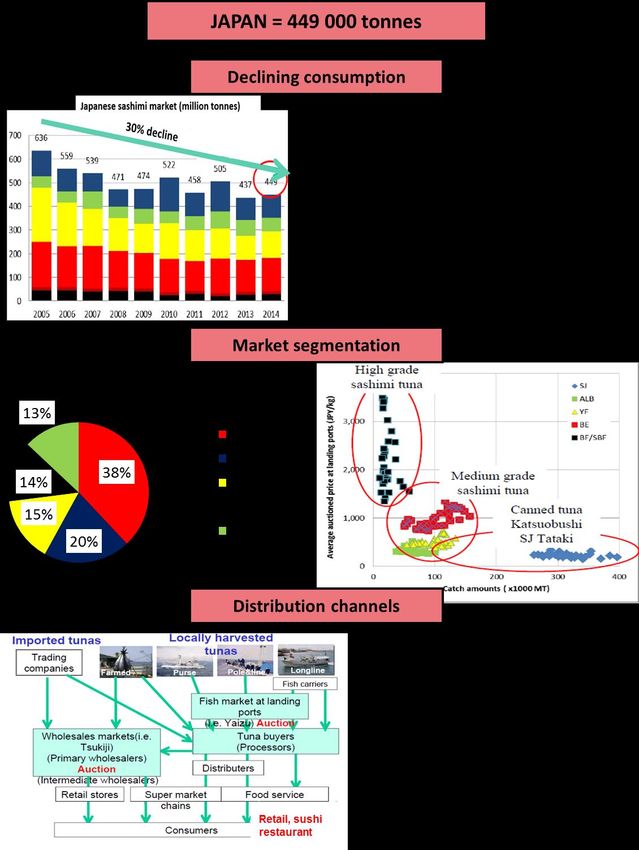
Figure 9 shows the share of these different forms of consumption. For simplicity of analysis, steak tuna
has been included in the sashimi category, while katsuobushi, which is specific to the Japanese market,
has been integrated into the canned category. The Japanese katsuobushi market was estimated at
36 000 tons in 2014 (Kawamoto, 2016). The market for tuna consumed as steak is estimated at 47 500
tons (ITC Trade Map, 2016, Bailly, 2016).
Figure 8 : Market share of the different product forms by volume and value (Source: Macfadyen,
2016)
Markets by value (2014)
Markets by volume (2014)
live weight equivalent 25
20
billion dollars
10% 0%
15
Canned tuna
10 19,7
14% 5 11,6
Sashimi/fresh 1,4
0
76% Local
consumption
Both in terms of volume (76% live weight equivalent) and value (60%), canned tuna is the foremost
form of consumption. Although sashimi-grade tuna represents only 14% of tuna catches, this market
24accounts for 36% of the global tuna market in terms of value. This clearly shows that sashimi tuna is a
high-end market, where catches bring in elevated prices.
In terms of markets, the main areas of consumption are concentrated in: Japan, leader on the global
tuna market (all forms of consumption combined), the US and the EU (Kawamoto, 2016).Although local
consumption accounts for a sizeable share of catches (10%), it represents only 4% of market value: the
consumed value of catches is on the whole twice the ex-vessel value, as only a very low margin is taken
during processing (Macfadyen et al., 2016).
Each of these forms of consumption is typically associated with a specific fishing technique and/or tuna
species (Figure 10):
- Almost all purse seine catches (mainly skipjack) are destined for canning;
- Longline and liners catches are destined for the sashimi market (except for yellowfin, generally
destined for canning);
- Gillnetter catches go to canneries and local markets as dried or smoked products;
- Pole-and-line catches have multiple destinations: canned tuna markets (mainly for eco-label
canning), the katsuobushi market and the fresh tuna consumption market.
25Figure 9: The main forms of tuna consumption (Source: M. Lecomte, based onMacfadyen et al.,
2016)
Two main value chains can be identified: the value chain for canned tuna, which supplies a global mass
market, and that of sashimi-grade tuna destined for a high-end market with catches bringing in higher
prices. The sections below describe in greater detail the canned tuna and sashimi-grade tuna sectors.
263.2 Canned tuna
Tuna is a major commodity for the seafood canning industry being the world’s leading canned seafood
species in terms of volume (Figure 11):
Figure 10: Global production of canned fish and fishery products in 2009 (million tonnes, product
weight) (Source: Vannuccini, 2012)
Others
Anchovies
Salmon & trout
Cephalopods
Mackerel
Herring
Other molluscs &
aquatic invertebrates
Shrimps & prawns
Other shellfish
Sardines & sardinella
Tuna & bonito
Likewise, in the tuna industry, canned tuna stands as the leading product in terms of value (60% of
total value, Figure 9). Each year, nearly 75% of tuna catches are destined for canning – in 2014,
equivalent to 3.8 million tonnes. Figure 12 depicts the sector’s overall organisation.
27Figure 11: The canning industry (Source: M. Lecomte based on Macfadyen et al., 2016; Hamilton et al., 2011)) 28
3.2.1 Production dominated by the purse-seine fleet

The main species used for canning are the skipjack, yellowfin and, to a lesser extent, albacore tuna.
The most-harvested species, the skipjack, is mainly destined for staple consumer products whereas
the yellowfin and albacore are sold at higher prices. The largest markets for the albacore are the United
States, France and Spain (Oceanic Development, Poseidon Aquatic Resource Management Ltd, and
MegaPesca Lda, 2005).

Most of these species are caught by purse-seiners (67% of world catches) and to a lesser extent by
pole-and-line vessels (10% of total world catch). In March 2015, 1,955 tuna purse-seiners were in
operation (Justel-Rubio and Restrepo, 2015). The main countries operating a purse-seiner fleet are:
the United States, South Korea, Spain, Papua New Guinea (PNG) and Taiwan (Guitton et al., 2016). In
2014, these fleets accounted for 47% of purse-seine catches (Guittonet al., 2016).

The purse-seiner fleet is part of a globalised international industry and most of the vessels belong to
large industrial groups or investment groups. Very few purse-seiners are now owned by family
businesses. Among the reasons for this concentration are the high operating costs and overheads, and
vertical integration allows vessel owners to cut production costs while at the same time securing their
supplies (Miyake et al., 2010).

Pole-and-liners account for a lesser share of catches (11%) and their number is declining due to their
increasing operating costs (Gillett, 2016). Today, a growing fraction of their catches goes to the market
for ecolabelled products.

        3.2.2 Sale of catches: the role of major trading companies and Bangkok

Once landed, purse-seiner catches for canneries are sold on international markets or to trading
companies.

When purse-seiners are owned by the large vertically integrated groups, they are required to supply
the groups’ own factories. On the other hand, purse-seiners belonging to fishing firms can sell their
catches either directly on international markets or to trading companies. These vessels use two sales
channels: either the fishing company has a commercial firm in charge of selling catches from the entire
fleet or each ship’s captain can sell his catches individually (Campling, 2012).

3.2.2.1 The tuna market: the role of Bangkok
The leading marketplace for canning-grade tuna is Bangkok. Indeed, Thailand is the world’s foremost
canning operator and Thai imports destined for canneries accounted for almost half of the world’s

29
skipjack and yellowfin imports in 2010 (Guillotreau et al., 2016). The main suppliers to the Thai market
are Taiwan (20% of imports), the United States (19%) and South Korea (17%) (Guillotreau et al., 2016).
Given the huge quantities purchased by the Thai canneries, the price of frozen tuna in Bangkok serves
as the international benchmark for whole round tuna destined for canning (Ecuador, Côte d’Ivoire,
Seychelles, Spain) (Guillotreau et al., 2016). The round tuna price is thus almost uniform across the
world and also highly volatile, as is the price of crude oil (Figure 13).
Figure 12: Volatility ranking for major commodity prices (lower is more volatile) (Source: Lem, 2016
based on Dahl and Oglend, 2013
3.2.2.2 The major trading companies
The role of trading companies is to purchase the raw materials (fresh-caught tuna) from the fishing
vessels and to coordinate their transport to tuna canneries. Providing highly efficient services, these
companies are key links in the canned tuna supply chain (Hamilton et al., 2011). In fact, the sale of
catches to trading companies enables vessel operators to focus their efforts on fishing rather than
having to deal with financial, administrative and logistic aspects and the risk associated with selling
their catches. For the canneries, purchasing raw material from these companies ensures easier access
to supplies as it allows them to avoid having to manage a large number of vessel owners selling in small
catch volumes (Hamilton et al., 2011).
The market is currently dominated by three companies: Itochu, Tri Marine and FCF. Between them,
these firms handle almost 30% of the world’s canning-grade tuna catch (Table 3). They thus provide
3080% of the raw material needs of Thai canneries (which are the world’s leading producers of canned
tuna). As the Thai canneries do not own their own fleets, they rely heavily on the trading companies
(Campling, Havice and Ram-Bidesi, 2007; Barclay, 2010). Of the three companies, FCF handles the
largest volumes of catch and tuna trading is its core business.
Tri Marine has chosen a vertical- integration strategy, extending its activities to the entire tuna supply
chain, and has a more global presence (especially in the European market). Itochu handles the lowest
volumes of tuna and has a more diversified business model including seven lines of business (Hamilton
et al., 2011).
Table3: Annual volumes sold by the three major tuna trading companies (Source: Hamilton et al.,
2011;Tri Marine, 2013)
Company Volumes sold
FCF 650 000 tonnes/year
Tri Marine 400 000 tonnes/year
Itochu 200 000 tonnes/year
Total 1 250 000 tonnes/year
3.2.3 Canned-tuna processing: production overcapacity
The tuna processing industry started up in Europe in the 1950s before gradually expanding into
countries with available low-cost labour in the 1980s. Today, canned tuna is produced in nearly 40
countries (Figure 14). The three major producers are Thailand, Spain and Ecuador. The main landing
ports and processing facilities are Bangkok (Thailand), Pago Pago (American Samoa) and Manta
(Ecuador) (Guillotreau et al., 2016). Most of these canneries belong to vertically integrated
transnational firms that own the leading tuna brands sold on consumer markets.
The canneries use two types of raw material: whole frozen tuna (known as “round tuna”) or loins.
Many canneries use both forms of tuna for their production (Miyake et al., 2010).
For round tuna, they use two supply channels. The first involves direct sourcing from the landings of
fishing vessels offloaded in a port close to the canneries (whether or not the vessels are owned by the
canneries). This “traditional” form of supply is still used by the canneries in Tema (Ghana) and those
based on islands such as Papua New Guinea or the Seychelles. The second supply channel involves
using reefer vessels that transport round tuna in bulk to the canneries. This supply method is becoming
31increasingly widespread, particularly in the Thai canning factories (Miyake et al., 2010). Generally, the canneries’ demand for frozen tuna is fairly price-elastic (Guillotreau et al., 2016). In the Western and Central Pacific Ocean and the Indian Ocean, elasticity of demand for frozen round tuna lies in the region of 1.55 (Garcia del Hoyo, Jimenez-Toribio and Guillotreau, 2010; Bertignac et al., 2000; Guillotreau et al., 2016). This means that a 1%increase in ex-vessel prices would lead to a more than proportional decrease in demand from the canneries (Guillotreau et al., 2016). Until the 1990s, round tuna was the most common form of supply: the whole tuna was canned within a single production unit. This canning method is called “full processing” or “full canning”. In recent years, some canneries have opted to source their supplies in the form of loins. This process is known as “split processing”. The canned production process is based on two production units: one processing plant produces the loins, which are then purchased by a cannery to produce cans of tuna. The use of loins is a growing trend in canneries in developed countries and offers several advantages. It helps to reduce labour costs, as nearly 80% of these costs in canned tuna production are incurred by cooking, cleaning, and loining the fish (Miyake et al., 2010). Likewise, the utilisation of loins helps to reduce transport costs as loins represent only 45% of the weight of a whole fish. In addition, loins can be shipped in containers rather than bulk reefers, which also lowers costs (Campling, 2016). Thus, supplying tuna in loins allows canneries in developed countries to significantly reduce their production costs and remain competitive with respect to the low production costs of some developing countries. The European tuna loin market is expanding rapidly as shown by the speed at which the autonomous tariff quota7for loins is exhausted each year. This source of supply depends heavily on European and American tariff policies and will remain so as long as these countries continue to protect their domestic canning plants (Campling, 2016). 7 Tariff quotas constitute an exception to the normal state of affairs since they permit, during the period of validity of the measure and for a limited quantity, the total (total suspension) or partial waiver (partial suspension) of the normal duties applicable to imported goods. They are normally granted to raw materials, semi-finished goods or components not available in the EU (suspensions) or which are available but in insufficient quantities (tariff quotas), but no tariff quotas are granted for finished products (Source: European Commission, 2016a). 32
Figure 13: Location of main tuna canneries (Source: Campling, 2015a; Campling, Havice and Ram-
                                Bidesi, 2007; Hamilton et al., 2011)

At the present time, the combined maximum production capacity of these tuna canneries is higher
than global catches. In 2012, there were an estimated 184 canneries with a total capacity of 15,940
tonnes/day, whereas tuna catches amounted to 13,389 tonnes/day (Table4). This excess capacity is
even more evident when compared to the catch effectively destined for canning, which amounts to
10,042 tonnes/day.

 Table4: Comparison of combined tuna canning capacities and tuna fleet catches in 2012 (Source:
                                       Hsu, 2012; FIGIS, 2016)

     Combined capacity of tuna canneries (2012)                        15 940 tonnes/day

                Total catches (2012)                                   13 389 tonnes/day

         Catches destined for canning (2012)                           10 042 tonnes/day

33
3.2.4 By-products and waste from the tuna processing industry
Canned tuna processing generates a sizeable quantity of by-products and waste. On average, the meat
destined for canning represents 45% of the fish’s live weight8 (Macfadyen and Defaux, 2016). The
remaining 55% constitute processing residues, composed as follows (Macfadyen and Defaux, 2016):
- 35% of the live weight constitutes by-products that will be used by other industries and
transformed in co-products. 10% of these by-products (generally, red meat) are used for
animal feed. The heads are sometimes used to produce fish oil. The remaining 90% is used to
produce fishmeal.
- 20% of the live weight is non-reusable waste, including mainly blood and water.
In 2014, by-products from the canning industry were valued at US$ 300 million, i.e. 0,9% of final value
of the global tuna sector (Macfadyen and Defaux, 2016).
3.2.5 The key role of retailers and transnational firms
In European and American markets, supermarkets and hypermarkets dominate canned tuna
distribution chains. These retailers thus play a key role and act as an interface between the canners
and consumers.
On these traditional markets, the retail sector is characterised by a high degree of concentration. In
the US, the 10 leading retailers have 25.5% of market share, while on the main canned tuna markets
in Europe (France, Germany, United Kingdom, and Spain) their market share borders on 39% (Figure
15).
8
This conversion factor nonetheless varies depending on the size and species of the tuna processed.
34Figure 14: Market share of the top 10 distributors in various countries and groups of countries in
2012 (Source: MESIC, 2015)
Market share of the 10 leading distributors
45
40
35
30
25
20 39 40 40
15
26
10
17
5 9
0
World Europe United States France Germany United Kingdom
This high level of concentration means that the canners find themselves dealing with a relatively small
number of buyers and depend on only a handful of retailers to sell their products. The retailers are
thus able to unilaterally impose their terms and conditions on the canners. In fact, whereas the
canneries’ demand for frozen tuna is price-elastic, consumer market demand is considered to be
inelastic both in Europe and, to a lesser extent, in the United States (Guillotreau et al., 2016). As a
result, retailers use multiple strategies to mitigate increases in raw tuna prices and keep retail prices
stable (Guillotreau et al., 2016). These strategies involve using their private-label brands reducing the
quantity of tuna in the can, using tuna mixed with vegetables, etc. (Guillotreau et al., 2016). Retail
prices on supermarket shelves thus fluctuate much less than ex-vessel prices (Jiminez-Toribio,
Guillotreau and Mongruel, 2010).
Canned tuna products are thus increasingly produced in canneries under direct contract to retailers
and sold under the supermarkets’ own (private) labels (Hamilton et al., 2011). These private-label cans
give retailers a fairly high margin despite their low retail prices (Miyake et al., 2010).
On top of using private labels, retailers also exert vertical pressure on the sectors upstream in the
supply chain or, in other words, on the canneries (Miyake et al., 2010). Canneries engage in a price
negotiating system with the retailers in order to produce products at the lowest possible prices. The
retailers sign annual contracts with the canneries specifying a given quantity at a fixed price. This price
is fixed in line with Bangkok price forecasts over the year. Should a price hike occur, it is very difficult
35for the canneries to renegotiate these contracts in their favour so that the price increase is absorbed by the canneries. Thus “when prices rise, it is very difficult to pass this on to the retailers, and when prices drop, competition increases and the same retailers obtain discounts” (Lem, 2016). This pressure on costs is then transferred to the ship-owners to make them decrease their sales price. Alongside these retailers, a handful of firms operating at several levels of the supply chain share the global market for canned tuna. These are mainly vertically integrated companies whose brands (national labels) are leaders on end markets, as shown in Figure 16. These firms are seen as some of the industry’s key players (Österblom et al., 2015). They are present worldwide via extensive networks of subsidiaries and dominate canned tuna sales, both in terms of value and volume, with brands that dominate the main consumer markets. These firms are also involved in the principal tuna RFMOs, be it through their presence as observers or their participation in the industry’s delegations. They take part in the global governance of the tuna sector (Österblom et al., 2015). Among these firms, Thai Union, a Thai company, is the world leader in the canned tuna segment, with an annual canned production estimated at 300,000 tonnes (i.e., 18% of global canned tuna production) (TUF, 2016). Its brands (Chicken of the Sea, John West, Petit Navire, Mareblu) dominate the main canned tuna markets. 36
Figure 15: Main canned tuna markets and associated brands (Source:M. Lecomte, 2016,based on TUF, 2016; Lion Capital, 2014; Kalla, 2013; Bolton
Alimentari, 2014; Dongwon, 2013)
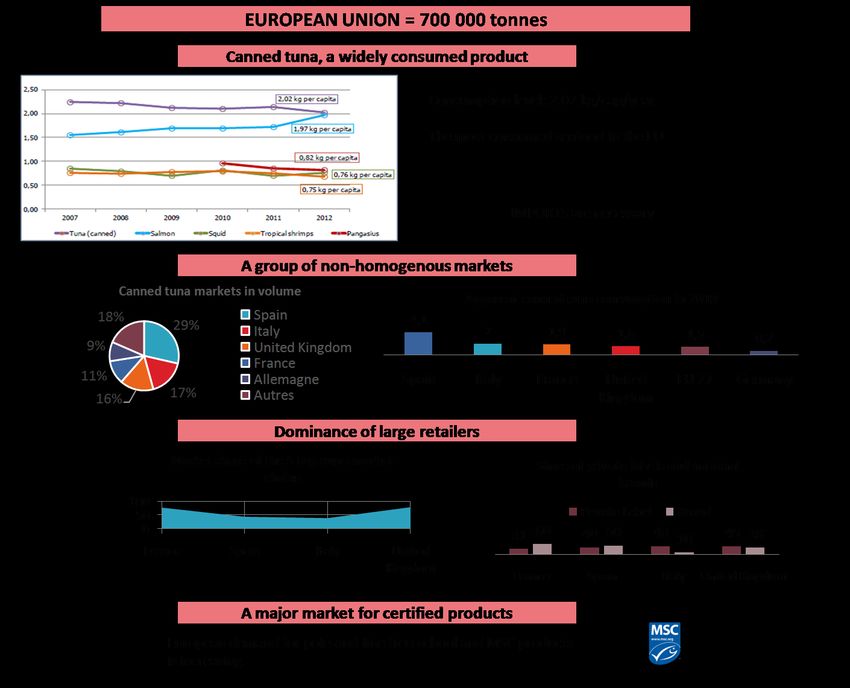
373.2.6 Traditional canned tuna markets now maturing Canned tuna is a low-cost product distributed worldwide (Hamilton et al., 2011). In 2014, the global market of canned tuna was estimated at 1.7 million tonnes (processed weight) valued at US$ 19 billion (Macfadyen, 2016). The principal markets for canned tuna are the EU and the US. These markets are globally integrated and form a single interdependent market (Jimenez-Toribio, Guillotreau and Mongruel, 2010). Import prices for tuna canned in brine, for example, follows the same long-term trends on both the EU and US markets (Jimenez-Toribio, Guillotreau and Mongruel, 2010; Miyake et al., 2010) and demand is considered to be relatively inelastic (Jimenez-Toribio, Guillotreau and Mongruel, 2010; Guillotreau et al., 2016). These traditional markets are currently maturing, with consumption levels stabilising in the EU and declining in the US. Growth in the sector is thus tied to demand from the Middle East, Latin America and other emerging markets such as Eastern Europe and Asia (CAMPLING 2015c; GLOBEFISH 2016b). The Middle East’s canned tuna market is estimated at 134,000 tonnes, valued at US$ 1 billion (excluding Iran), while Latin America currently accounts for 15% (250,000 tonnes) of world canned tuna consumption (Chemerinski, 2016; Sengupta, 2016). 3.2.6.1 The European Union market The EU market is the world’s largest market for canned tuna, with annual consumption reaching around 700,000 tonnes9 (Vieites Baptista de Sousa, 2012). It is the only market that combines strong demand and high prices (Campling, Havice and Mc Coy, 2015). Within the EU, canned tuna is the most consumed seafood, with consumption standing at around 2.02 kg per capita in 2012 (EUMOFA, 2015). In the 1990s, domestic production dominated supply but, since 2002, most of the canned tuna consumed in the EU is imported (Hamilton et al. 2011). Currently, the EU’s self-sufficiency rate for tuna is 26%, tuna being one of the most imported products (EUMOFA, 2015). In 2013, European production of canned tuna stood at 166,000 tonnes, with Spain as the leading producer (AGRITRADE, 2014). The main suppliers of European imports (in volume) were Ecuador, Mauritius, Thailand, Seychelles and the Philippines (GLOBEFISH, 2015). Within the EU, the largest markets for canned tuna are Italy, the United Kingdom, France, Spain and Germany. In terms of volume, the United Kingdom is in first place, followed by Italy, then France 9 Processed weight. 38
(Figure17). Yet, these European markets are not all homogenous, either in terms of the type of
products consumed or of prices. The Italian market generates the highest value with prices averaging
20 times more than those in the other markets, while Spain comes first for per capita consumption of
canned tuna, even though its market volume is lower (Campling, 2015b). As for the type of canned
product consumed, the main markets divide into three categories (Campling, 2015b):

       - The market in northern European countries (United Kingdom, Germany). These mainly
       consume low-cost skipjack (mostly in brine) imported from Southeast Asia (mainly from
       Thailand);
       - The market in southern European countries (Italy, Spain). These are both tuna-canning
       countries that mainly process yellowfin and are typified by high consumption of yellowfin in
       olive oil;
       - France is an intermediate market where both above-mentioned products are consumed. The
       flagship product here is “natural tuna”, which consists of yellowfin in brine, canned raw.

Currently, European canned tuna markets are dominated by a handful of trading companies,
processors and retailers that wield considerable market power (Guillotreau, Mongruel and Jimenez-
Toribio, 2008). In some European countries, notably in Spain, the domestic canning industry has
considerable influence and exerts a high degree of market power over retailers and consumers
(Guillotreau, Mongruel and Jimenez-Toribio, 2008). In southern European markets, for instance, the
industry has imposed on consumers differentiated yellowfin products that yield higher gross margins
(Guillotreau, Mongruel and Jimenez-Toribio, 2008).

In each of these markets, large retailer chains dominate the sales channels with their private-label
brands. In the United Kingdom and France, the market share of the top five supermarket chains
reaches 80% (Hamilton et al. 2011). In 2010, the market share of private-label products was 60% in
France, 50% and42% in the United Kingdom (Brus, 2011). The EU market is also the foremost market
for ecolabelled seafood products (notably, Germany and the Netherlands) (CBI, 2015). The most widely
used ecolabel is that of the Marine Stewardship Council (MSC) (Campling, Havice and Mc Coy, 2015).
In recent years, European demand for products from pole-and-line or free-school fishing has been on
the rise (GLOBEFISH, 2014).

39
Figure 16: The European Union market (Source: M. Lecomte, based on Hamilton et al., 2011;
EUMOFA, 2015; Brus, 2011)
403.2.6.2 The United States market The US market is the second-largest market in terms of volume after the EU market. It is also one of the longest-standing markets and provided the impetus for the development of the export-oriented tuna-canning industry in Japan and Thailand (Hamilton et al., 2011). Tuna is the third most frequently consumed fish and seafood product on the American market and represents 37% of all fish and seafood products consumed in the United States in 2013 (INTRAFISH, 2015). In 2015, canned tuna had a household penetration rate of 67% (compared with 72.3% in 2011) (Melbourne, 2016). However, like the consumption of fish and seafood products overall, canned tuna consumption has been declining since the 2000s (Figure 18). As a result, the US market has stagnated in recent years, with an estimated average annual volume of nearly 400 000 tonnes valued at US$ 1.6 billion in 2015 (Campling, Havice and Mc Coy, 2015; Havice, Mc Coy and Campling, 2016). American demand for canned tuna is relatively inelastic (Daloonpate, 2002). One explanation for this low sensitivity to price variation is that American consumers perceive canned tuna (Guillotreau et al., 2016) as being an inexpensive product for seasonal consumption (Guillotreau et al. 2016). Higher or lower prices would not dramatically change consumption levels (Guillotreau et al., 2016). Given that domestic production is decreasing, the American market is more and more dependent on imports. In 2014, canned tuna production was 177,354 tonnes and accounted for 53% of total consumption (NOAA, 2014). The main source of supply for American canned tuna is Thailand (46% of imports in 2014), then to a lesser extent China (12%) and Vietnam (8%) (ITC Trade Map, 2016). In the US, the vast majority of canned tuna is sold through retail channels, which concentrate 62% of sales in value. It is a key category in this distribution channel. The average value of the consumer basket is higher when canned tuna is in the basket. This product is used as a loss leader and represents a key product in the retailers’ marketing strategies (Melbourne, 2016). Tuna cans are often sold as a promotional item to drive purchase volumes (Atuna 2013b). In this retailing strategy, supermarkets use their private-label brands to increase their profit margin and it is the suppliers who absorb the cost of these promotions (Hamilton et al., 2011). There are two distinct market segments in the American market: “light meat” tuna and “white meat”. The “light meat” (mainly skipjack) is the cheapest product on the market and accounts for the highest sales volumes (68% of sales volume in 2015). The term “white meat” refers to albacore, which constitutes the premium market in the United States. It accounted for 35% of sales in value in 2014 (Melbourne, 2016). The American canned tuna market also breaks down into tuna canned in oil and tuna in brine. In the 1980s, the public’s growing awareness of health issues boosted consumption of 41
You can also read