A Twitter-Lived Red Tide Crisis on Chiloé Island, Chile: What Can Be Obtained for Social-Ecological Research through Social Media Analysis? - MDPI
←
→
Page content transcription
If your browser does not render page correctly, please read the page content below
sustainability

Article
A Twitter-Lived Red Tide Crisis on Chiloé Island, Chile:
What Can Be Obtained for Social-Ecological Research
through Social Media Analysis?
Aldo Mascareño 1,2, *, Pablo A. Henríquez 3 , Marco Billi 2,4 and Gonzalo A. Ruz 5,6
 1    Centro de Estudios Públicos, Monseñor Sótero Sanz 162, Providencia, Santiago 7500011, Chile
 2    Escuela de Gobierno, Universidad Adolfo Ibáñez, Diagonal Las Torres 2640, Peñalolén, Santiago 7941169, Chile;
      marco.dg.billi@ug.uchile.cl
 3    Facultad de Economía y Empresas, Universidad Diego Portales, Av. Sta. Clara 797, Huechuraba,
      Santiago 8581169, Chile; pablo.henriquez@udp.cl
 4    Center for Climate and Resilience Research (CR)2, Universidad de Chile, Blanco Encalada 2002,
      Santiago 8370449, Chile
 5    Facultad de Ingeniería y Ciencias, Universidad Adolfo Ibáñez, Diagonal Las Torres 2640, Peñalolén,
      Santiago 7941169, Chile; gonzalo.ruz@uai.cl
 6    Center of Applied Ecology and Sustainability (CAPES), Santiago 8331150, Chile
 *    Correspondence: amascareno@cepchile.cl

 Received: 9 September 2020; Accepted: 10 October 2020; Published: 15 October 2020

 Abstract: Considering traditional research on social-ecological crises, new social media analysis,
 particularly Twitter data, contributes with supplementary exploration techniques. In this article, we argue
 that a social media approach to social-ecological crises can offer an actor-centered meaningful perspective
 on social facts, a depiction of the general dynamics of meaning making that takes place among actors,
 and a systemic view of actors’ communication before, during and after the crisis. On the basis of a
 multi-technique approach to Twitter data (TF-IDF, hierarchical clustering, egocentric networks and
 principal component analysis) applied to a red tide crisis on Chiloé Island, Chile, in 2016, the most
 significant red tide in South America ever, we offer a view on the boundaries and dynamics of meaning
 making in a social-ecological crisis. We conclude that this dynamics shows a permanent reflexive work
 on elucidating the causes and effects of the crisis that develops according to actors’ commitments,
 the sequence of events, and political conveniences. In this vein, social media analysis does not replace
 good qualitative research, it rather opens up supplementary possibilities for capturing meanings from
 the past that cannot be retrieved otherwise. This is particularly relevant for studying social-ecological
 crises and supporting collective learning processes that point towards increased resilience capacities and
 more sustainable trajectories in affected communities.

 Keywords: social-ecological crisis; social media analysis; meaning-making; learning processes; Twitter
 data; red tide; Chiloé Island

1. Introduction
    Global climate and environmental changes increase in depth and extension in different regions of the
world [1] and bring forth the need for a deep and urgent transformation of our society as a whole and the
way social analysis deals with the many levels those general, eventually sudden changes involve.

Sustainability 2020, 12, 8506; doi:10.3390/su12208506                           www.mdpi.com/journal/sustainability
Sustainability 2020, 12, 8506                                                                             2 of 38

     From a scientific point of view, climate and environmental changes are translocal, if not global
processes [2–7]. They combine different natural levels of species-landscape interaction as well as different
layers of reality, namely, natural, social and technological, that relate with each other in complex ways [8–11].
From the point of view of social actors, however, the network of repercussions and exchanges arising
from social-ecological events are regularly a locally-lived phenomenon. Certainly, some actors may be
more aware of the fact that what they locally experience is related to other local experiences in different
geographical spaces, and also to transnational structures and networks with a global scope. But for most of
them who are not scientists or corporate actors with vested interests, the reality and meaning of a natural or
social-natural event come defined by the concrete social-spatial position in which the event is experienced
and interpreted [12,13]. To put it in the traditional terms of social sciences, structure and agency represent
different points of entrance into social analysis [14].
     In line with this difference, social sciences have developed special methods for capturing structural
realities (mostly viewed as aggregate of individual preferences in quantitative research) and actors’
experiences (mostly regarded as phenomenologically lived-events in qualitative research). With the
rise of social media and big data analysis, however, new opportunities for social research arise,
which challenge accustomed paradigms in the social sciences. The difference between qualitative and
quantitative methods becomes rather blurred [15] because of several reasons: social media cover a
variety of communicative flows (interpersonal communication, official communication, citizen sensing,
interorganizational communication), they work in real time, and can capture the big picture of a critical
situation and combine it with information on actionable insights [16]. It is, thus, our contention
that by applying suitable methods to social media information, it becomes possible to associate
the structural approach to social-ecological crises –namely, the behavioral patterns and complexly
interrelated semantic networks– with the more phenomenological actor-centered approach—i.e., shared
meanings, common experiences, and learning processes oriented to reinforce community resilience
and the transformation towards sustainability coming from different social actors. This attempt of
constructing a mixed approach to social-ecological systems (SES) by addressing structural realities and
actors’ experiences through social media analysis can contribute to the discussions on the role of the social
in SES literature. Human impacts on the environment neither come from isolated individual decisions nor
from their simple aggregation, but from socially constructed constellations of meaning wherein values,
knowledge, social diversity and power relations play a fundamental role. Observing how these meaningful
constellations work and how they motivate resilience practices and learning processes in crisis situations
is thus crucial for a better understanding of the social-ecological nexus [17–25].
     Additionally, this effort can contribute to the emerging scholarship in the realm of neogeography,
volunteered geographical information, and participatory geographic information systems. This scholarship
signals the opportunities associated to crowd-sourced information and other sources of big data for the
analysis of a variety of social phenomena [26], including crises [27,28], environmental degradation [29],
inequalities [30], and disaster consequences and response [31–33]. Neogeography has also highlighted how
the growing availability and accessibility of user-generated information transforms the comprehension
of actors, practices and contents of social-geographical analysis and place-making [34,35], thereby opening
new avenues for citizen engagement in knowledge production [36,37] and generating new challenges in
terms of quality assurance [38,39] and critical analysis [40].
     Taking this framework into consideration, in this article we aim to identify what can be obtained for
social-ecological research through social media analysis, particularly Twitter analysis, of a crisis situation.
Our case-study is the social-ecological red tide crisis on Chiloé Island, Southern Chile, in 2016, the most
extended and intense red tide in South America ever recorded [41]. In a previously published article [42],
the authors have analyzed this event in detail mostly under an actor-centered qualitative approach with a
few elements of social media research. In the meantime, other researchers have applied similar methods to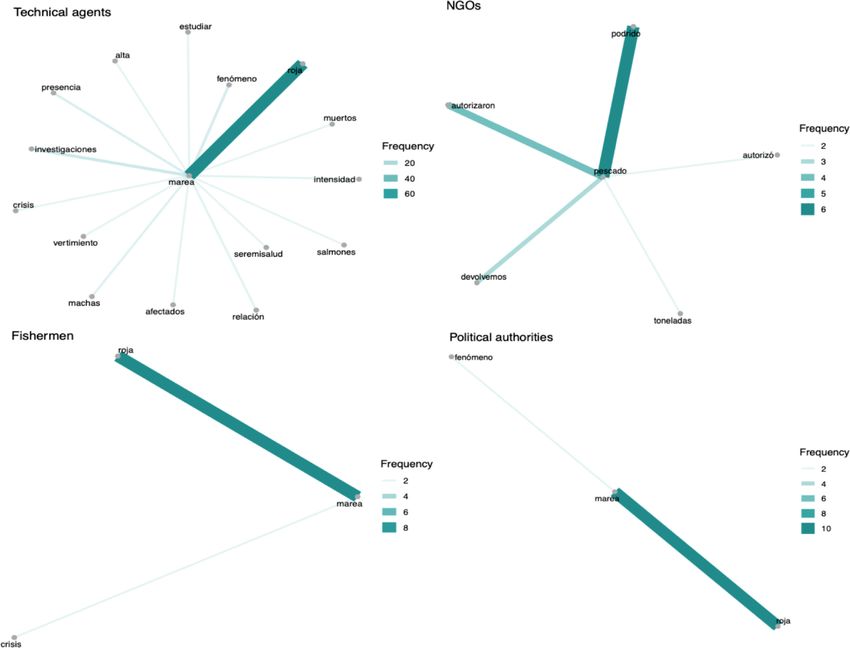
Sustainability 2020, 12, 8506                                                                            3 of 38

explore this case [43–45], while others conducted a more structure-centered research, whether referring to
quantitative ecological data [41,46] or to communicative consequences [47,48]. Considering this, we argue
that the case of the 2016 red tide crisis on Chiloé Island, is a well-suited case for identifying the novel
knowledge that can be gained for social-ecological research when conducting social media analysis
with a multi-method approach. From this exploration, we conclude that social media and particularly
Twitter analysis, when performed through multiple techniques and interdisciplinarily conducted, offers (a)
a structural systemic view of the semantic boundaries and networks of a social-ecological crisis, (b) an
involvement with the meaningful, phenomenological aspects of these events, and (c) a depiction of the
processes of meaning making that take place among actors and that can be a source of transformation
efforts towards a more sustainable future.
     In order to accomplish this, we begin with a literature review of the intersection between social media
analysis and social-ecological crises aimed at identifying the different research lines on the topic and
positioning our research. Secondly, we offer a characterization of the 2016 red tide crisis on Chiloé Island,
Chile, with a view on the different methods applied by recent research and the results obtained in
each case. Next, we describe our multi-method approach, and then we present our results in dialog
with the qualitative and quantitative research conducted on the same case and on social-ecological crises
in general, and discuss them regarding the aims of our study. Finally, we draw the conclusions from
our work.

Literature Review: Social Media and Social-Ecological Crises
     Social media are increasingly recognized as a promising tool to gather and analyze data which
would otherwise be inaccessible or excessively costly and time consuming [49,50]. During the last years,
particularly the scientific literature linking Twitter and other social media with social-ecological crises and
emergencies has grown [51]. Most scholarship in this field was published from 2013 onward. The most
relevant disciplinary approaches are—in a descending order—communication research, information and
computer science, business and management, social sciences (e.g., psychology, sociology, geography) and
public health.
     Four main strands of literature can be distinguished. The first and most established one refers to the
use of Twitter (and social media) as a tool for crisis communication and reputation management in private
corporations. The literature either highlights the potential relevance of these tools, reports on case studies
or examines the differential effectiveness of particular practices and strategies [52–56].
     Related to the above, a second strand of literature examines the use of Twitter by public agencies.
Usually, this scholarship focuses on one or few case studies analyzing the growing relevance of these
media as tools for supporting vulnerability assessment [57] and facilitating community resilience [58]
as well as integrated disaster responses [59] and territorial planning [60]. While much literature adopts
a positive stance towards the use of these methods, often offering recommendations for public agents,
other contributions adopt a more critical tone, focusing on how agencies select information strategically,
on the politics behind the use of these media, its limits and underlying risks [61–63].
     A third strand of literature discusses the potential of Twitter and other social media as sources of
information to reduce risks, identify and prevent crisis situations and put in place early warning systems.
This scholarship debates different advanced methods and techniques for Twitter mining, labelling and
automated screening, as well as the potential usefulness of crossing social media data with other
information sources such as geospatial data [64–69]. This literature shows the relevance of Twitter
information during disasters so that authorities can make better decisions [70] and also highlights Twitter
importance to create awareness and minimize possibles damages [71–73].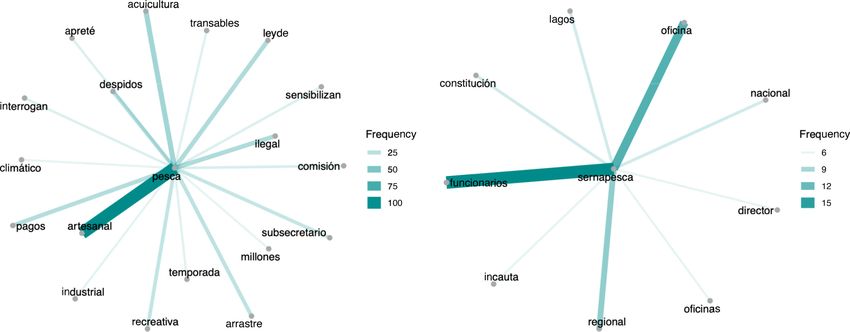
Sustainability 2020, 12, 8506                                                                            4 of 38

     A fourth and last strand of literature offers insights on the dynamics and potential performance of
Twitter communication, investigating a broad variety of questions, including:

•     What motivates the behavior of Twitter users, e.g., how do they deal with uncertainty in Twitter
      communication, what drives twitting and re-twitting, the emergence and role of influential social
      media users in disaster situations [74–76];
•     How social media become the space for controversies and ‘issue arenas’ [77] and the influence they
      have on crisis situations [78], e.g., promoting political upheavals and situations of social change in
      regions affected by crises or natural disasters [79–81];
•     How Twitter and other social media interrelate with traditional media, e.g., how well they fare at
      different functions, how they overlap and feed each other [82,83] and how routine social media
      communications and networks are affected by disaster situations [84];
•     How Twitter and social networks spread information (and misinformation) about crises, e.g., modeling
      information diffusion in Twitter networks, assessing its ability to reinforce risk communication,
      understanding the birth and reproduction of fake news and hoaxes, among others [85–90];
•     Finally, how does Twitter drive sense-making about crisis, and what kind of contents, framing
      narratives and sentiments are dominant in different contexts, groups of actors, and stages of a crisis.

      This last research trajectory is the most relevant for the study proposed in this article. Evidence from
different types of crisis situations suggests two overarching trends in Twitter activity: (a) the emergence
of plural and often competing sets of meaningful interpretations of the crisis (narratives) containing
different farmings, semantics and sentiments elicited by diverging actors’ experiences, which give shape
to different ‘publics’ or interpretative communities that either pre-exist or emerge as a result of the
crisis itself [78,91–94]; and (b) the tendency of crisis communication to evolve from an initial acute stage
characterized by the breakdown of accustomed structures of meaning, a shared feeling of uncertainty,
and the cacophonic, noisy and irreflexive spreading of information, to a more evaluative and retrospective
exercise of sense-giving from which a defined interpretation emerge [95–99].
      Noticeably, while these patterns have been studied with respect to both social-political controversies
and natural disasters, little understanding exists so far about how they manifest in social-ecological
crisis situations, where the immediacy of the ecological trigger (the 2016 red tide in Chiloé) inlays into a
pre-existing situation of latent and self-induced criticality (historical discontent and transformations in
the Chiloé case study). Understanding sense-making or meaning-making can be key to assess whether
social-ecological crises activate learning processes in public opinion, thereby pushing it to embrace
transformative stances that might pave the way towards more sustainable trajectories.
      In this vein, social-ecological systems (SES) literature is a fertile field of research. The SES approach
investigates the complex adaptive system dynamics linking human and natural systems [100], explores
their trajectories and interdependencies at multiple scales [101,102] as well as pathways for the sustainable
governance of these systems [103,104]. In recent years, increasing attention has been devoted to the
role played in social-ecological systems sustainability by mismatches of scale between social-ecological
phenomena and institutional arrangements [105], time-delayed ecological feedbacks on biodiversity upon
human activities [106], the relevance of values, knowledge, social diversity and power relations in the
processes of meaning-making leading to resilience practices, learning, and sustainability [17–24], and the
complex interactions between interlocked social-ecological systems [107], events which may have been
playing a salient role in the 2016 Chiloé red tide crisis.
      Fisheries and fishing ecosystems, in particular, have been abundantly explored within social-ecological
research. Fishing resources are a classical example of a common-pool resource [108], and thus prone
to over-exploitation and under-caring. This has led to ample interest in exploring the possibility of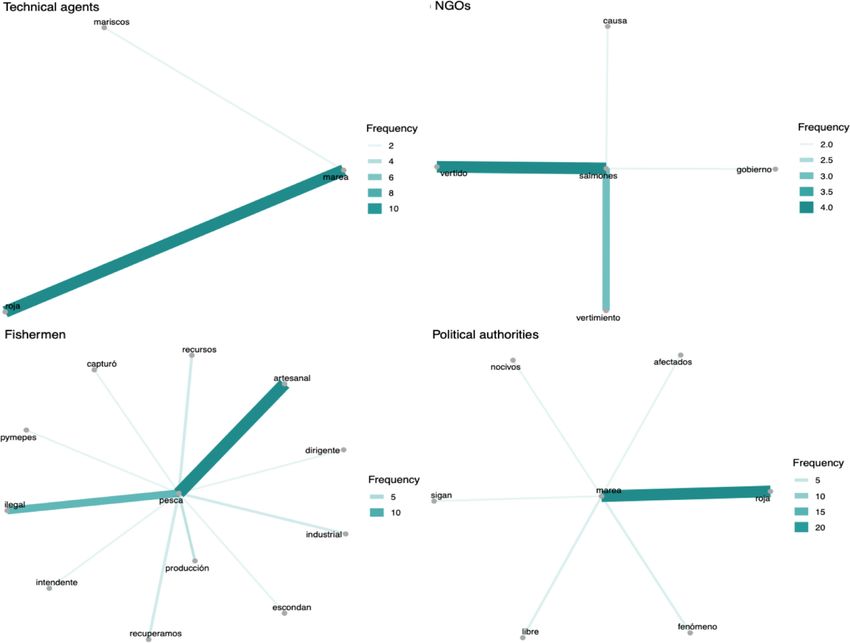
Sustainability 2020, 12, 8506                                                                           5 of 38

setting up sustainable fishing communities, particularly through the use of polycentric frameworks and
principles [109,110], and has also led to investigate the resilience of fishing communities in the face of
internal and external stresses [111–113].
      Within this context, Chiloé is a widely employed case study on the sustainability of fishing
ecosystems, especially in association with the sustainability of salmon and shellfish aquaculture and
their environmental and social impacts on the island and its population [114–118]. The 2016 events have
contributed to boosting this literature, with new contributions multiplying in recent years, covering
long-term socio-cultural and social-ecological trends and transformations contributing to explain the
crisis [44,119,120], the specific influence played by the salmon dumping on the crisis [46]; local perceptions
on the crisis and its relationship with climate and environmental change [121] and the different frames
employed in media coverage of the crisis [47,122]. Noticeably, only one of these studies [48] makes use of
social media analyses, and as we observe in detail in the next section, it is focused on the limited use of
these platforms for concrete political actions than on the evolution of social media communications as a
way to understand the underlying dynamics of the crisis.

2. Background: The 2016 Red Tide Crisis on Chiloé Island
     Chiloé Island is located between latitudes 41◦ 40 and 43◦ 20 S in southern Chile (Figure 1). According to
the last available data [123], the population of the island amounts to 180,185 inhabitants, divided into
10 municipalities. Until 1980, Chiloé’s economy depended on subsistence-oriented agriculture, artisanal
fishing and woodcutting [114]. From the 1980s onwards, the island became a center of the world salmon
industry. Currently, it is the second global producer after Norway [124].

                                        Figure 1. Chiloé Island, Chile.

     As a consequence of the intensive aquaculture, several crises have affected the region in the last
decades [125], being the 2016 red tide crisis the last one. On February 2016 the most significant algal bloom
in the history of Chiloé Island was declared. The affected area comprehended the interior and exterior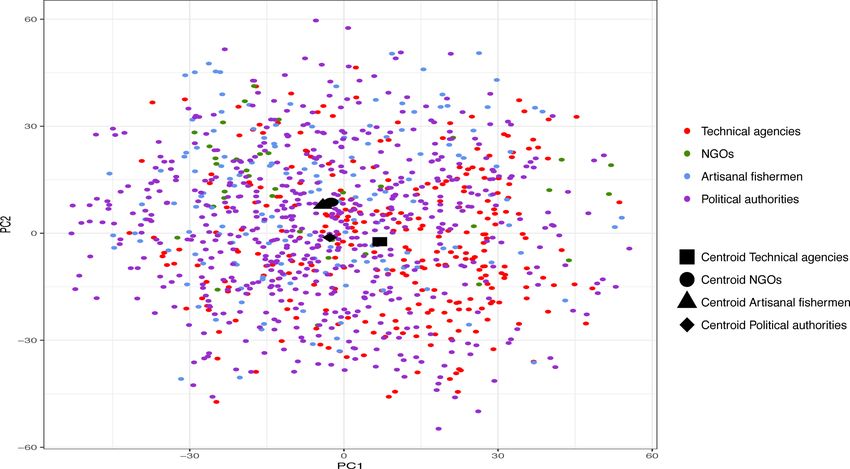
Sustainability 2020, 12, 8506                                                                                                                    6 of 38

coast of the Island and the Reloncavi Gulf. The following factual events constitute the basic structure of
the crisis:
•      February 2016: First algal bloom (first pulse) producing a mortality of 25 million fish (39,942 t) by the
       second week of March 2016;
•      10 to 26 March 2016: Dumping of 4600 t of dead fish 75 nautical miles off the northwest coast of
       Chiloé Island;
•      Third week of March 2016: Second algal bloom (second pulse);
•      19 March 2016: Ban on fishing and shellfish extraction issued by the Chilean Ministry of Health
       covering nearly 2000 km of coast;
•      25 April 2016: Massive stranding of shellfish on in Chiloé’s coasts;
•      29 April 2016: Chiloé is declared ‘catastrophe zone’ by the Chilean government;
•      2 to 19 May 2016: Massive demonstrations of Chiloé’s inhabitants against government’s measures
       and the salmon industry that took over the island;
•      Late May 2016: End of demonstrations thanks to a controversial agreement with the Chilean
       government [42,44].
     As stated in the Introduction, this crisis has been mostly studied under an agent-centered qualitative
approach [42–45], while other authors have conducted a structure-centered research based on quantitative
ecological data [41,46] or on communication analysis [47,48]. Table 1 summarize these research approaches
on the 2016 red tide crisis on Chiloé Island and their main conclusions.

                                 Table 1. Research on the 2016 red tide crisis on Chiloé Island.

    Reference    Year   Keywords                                  Methods                            Conclusions
                                                                  Framing method                     Nature is responsible for the crisis; origins of
                        Chiloé; socio-environmental;              (communication sciences) and       the crisis are beyond the salmon industry. The
    Ref. [47]    2018
                        contentious politics; framing; red tide   discourse analysis of online       conflict is due to disagreements regarding
                                                                  press                              monetary compensations.
                                                                                                     Chiloé’s social-ecological system (SES) is an
                                                                  In-depth interviews, content
                                                                                                     unstable regime prone to sudden shifts.
                        Chiloé Island; controversy; governance;   analysis of press articles and
                                                                                                     Controversies manipulate the epistemic
    Ref. [42]    2018   regime shift; resilience; salmon          archives, and semantic analysis
                                                                                                     construction of SES. This requires to be
                        aquaculture                               of Twitter data (5104 tweets
                                                                                                     managed through non-authoritative forms of
                                                                  from 2013 to 2017)
                                                                                                     governance
                                                                                                     Findings suggest that social media are mostly
                        Politics; technology; popular
                                                                  Content analysis on Twitter data   used for sharing information rather than
    Ref. [48]    2018   mobilization; social media; Internet;
                                                                  (409 tweets on April 2016)         promoting or instructing Twitter users to
                        Twitter
                                                                                                     perform concrete political actions
                                                                                                     Islandness in Chiloé Island is a political stance
                        Chiloé; conflict; islandness; islands;    Qualitative analysis based on      in opposition to the state. It expresses the
    Ref. [44]    2019
                        salmon farming; social mobilization       in-depth interviews                power asymmetries between islanders and the
                                                                                                     Chilean state
                                                                                                     Several factors work against the adaptation of
                                                                                                     Chiloé’s ecosystem services, such as
                        Social-ecological systems; Latin
                                                                                                     dominance of governmental institutions, low
    Ref. [126]   2019   America; complexity; Chile;               Social-ecological survey
                                                                                                     participation, lack of collective learning,
                        environmental governance; Chiloé
                                                                                                     market influences, centralized
                                                                                                     decision-making, among others
                                                                  Oceanic modeling (Mercator         The analyses show consistently that the
                        Harmful algal blooms; aquaculture,
                                                                  model) and transport               dumping of dead fish into the sea could well
    Ref. [46]    2020   pollution control; ocean transport;
                                                                  simulations (Lagrangian            have played a fueling role for the second pulse
                        ecological crisis; risk management
                                                                  transport code Ariane)             of the red tide
                                                                  Content analysis of three          Social actors continue posting on the crisis long
                                                                  Facebook fan pages in Chiloé       after the phenomenon passed. Digital media
    Ref. [43]    2020   Book chapter; no keywords
                                                                  between 2016 and 2018 (n =         continue distributing news on the topic long
                                                                  2937)                              after legacy media lost interests
                                                                                                     Tensions between local identities limit the
                        Chiloé; identities; salmon industry;      Content analysis of
    Ref. [45]    2020                                                                                projection of the island identity because of a
                        territory                                 semi-structured interviews
                                                                                                     non-accomplished self-recognition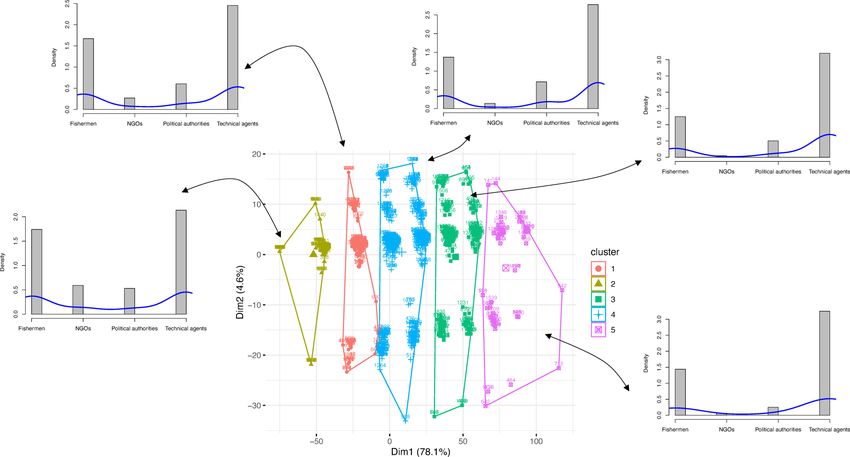
Sustainability 2020, 12, 8506                                                                         7 of 38

     As seen, most of the research on the 2016 Chiloé red tide crisis follows qualitative criteria. In-depth
interviews are the most preferred source of data, while content analysis is the most frequently selected
technique. Three studies [42,43,48] resort to social media analysis in their design, while one of them [126]
uses survey data for assessing Chiloé’s social-ecological services, and another one [46] applies modeling
and simulations for its purposes, being this an oceanographical analysis of the triggering role that the
dumping of dead salmons into the sea played in the 2016 red tide crisis.
     By drawing on the set of multiple techniques and procedures presented in the next section, we aim to
offer an understanding of the social-ecological red tide crisis that integrates the meaningful components of
qualitative research with a systemic general view on the network boundaries and its most characteristic
behavioral patterns.

3. Data and Methods
     This research uses two independent datasets. The first dataset was obtained from Google Trends to
confirm the geospatial interest on the red tide. The second dataset was obtained from Twitter to analyze
semantic contents in three periods: before, during and after the crisis.

3.1. Google Trends (GT)
     Google Trends (https://trends.google.com/trends/) is a service that outputs the time series data of
search intensity to show the extent to which a particular keyword is searched for in a specified period and
location [127]. Search intensity is an index of search volume adjusted to the number of Google users in
a given geographical area. This value ranges from 0–100, where the value of 100 indicates the peak of
popularity (100% of popularity in a given period and location) and 0 complete disinterest (0%). Google data
dates back to 2004 and can be provided as a daily or monthly data.
     GT have been extensively used in various research domains, such as epidemic forecasting, financial
analysis, marketing, tourism and general research exploring public opinion [128]. GT may qualify analyzed
phrases as “search term” or “topic”. Search terms are literally typed words, while topics may be proposed
by GT when the tool recognizes phrases related to popular queries.
     The search intensity data are obtained from Google Trends. We specify the region as CL (Chile) and
use two terms “marea roja” (red tide) and “Chiloé” (Chiloé) as search keywords. We collected the Google
data from 1 January 2004 to date of collection (1 February 2020). The data were obtained using R 3.6.1
gtrendsR package version 1.4.4 to search the time series.

3.2. Twitter Data
      We used the public timeline API method provided by Twitter to collect information about the
non-protected users who have set a custom user icon in real time. In our case, users were placed
into four main groups that predominantly relate to four social positions: technical agents (Actors 1),
non-governmental organizations (Actors 2), fishermen social organizations (Actors 3), and political
authorities (Actors 4). Details of the user, such as IDs, screen name, and date were extracted. We used a
Python library called Tweepy to connect to Twitter Streaming API and download the data. The dataset
is a random sample of 27,935 tweets (including retweets) captured over the period 2013–2017 in order
to differentiate three periods in our analysis: before the crisis (from 2013 to February 2016), during the
crisis (from March to May 2016) and after the crisis (from June 2016 to January 2017). This sample includes
tweets from 11 unique users (see Table 2).
Sustainability 2020, 12, 8506                                                                                          8 of 38

                                         Table 2. Actors and Twitter accounts.

              Actors                                 Twitter Accounts                  Number of Tweets
              Actors 1: Technical agents (Fishing    @sernapesca,
              National Service, Institute for the    @ifop_periodista,
                                                                                               9794
              Promotion of Fishing, Chilean Army,    @Armada_Chile,
              Association of Salmon Farmers)         @SalmonChileAG
              Actors 2: Non-governmental
                                                     @GreenpaceCL,
              organizations (Greenpeace, Crea                                                  4781
                                                     @fundacioncrea
              Foundation)
              Actors 3: Fishing organizations
              (National Association of Artisanal     @ConapachChile, @fetrapes                 3673
              Fishers, Federation of Fishermen)
              Actors 4: Political authorities
                                                     @meconomia, @subpescaCl,
              (Ministry of Economy, Subsecretary                                               9687
                                                     @intendencialos1
              of Fishing, Intendancy Los Lagos)
              Total                                                                           27,935

3.3. Pre-Processing
     Raw data is highly susceptible to inconsistency and redundancy. Preprocessing of tweets is necessary
and include the following points:
•     Remove all URLs (e.g., www.xyz.com), hashtags (e.g., #topic), targets (@username);
•     Remove all punctuations, symbols, numbers;
•     Correct the spellings; sequence of repeated characters is to be handled;
•     Remove stop words;
•     Remove non-Spanish tweets.
     Then, to analyze the actors’ tweet in relation to the red tide event, we selected only those tweets
containing the keywords in Table 3. The final corpus for the four groups of actors amounts to 5104 tweets.
This analysis was conducted using the open-source R software environment for statistical computing.

                                     Table 3. Keywords for the selection of tweets.

       Original words in Spanish                              Translation
       Crisis, desastre, alga, nocivo, paralización,          Crisis, disaster, algae, harmful, paralyzing, protest,
       protesta, floración, verter, vertedero, cambio,        bloom, dump, dumping zone, change, climatic,
       climático, ley, pesca, artesanal, muerto, salmón,      law, fishing, artisanal, dead, salmon, warming,
       calentamiento, niño, marea, roja, eutrofización,       niño, tide, red, eutrophication, dumping,
       vertimiento, varazón, molusco, marisco,                stranding, mollusc, shellfish, shell fisherman,
       mariscador, petitorio, sacrificio, deliberado, zona,   request, sacrifice, deliberate, zone, catastrophe,
       catástrofe, bono, buzo, mortandad, toxico              bonus, diver, mortality, toxic

3.4. Term Frequency-Inverse Document Frequency (TF-IDF)
     Term frequency-inverse document frequency (TF-IDF) is a numerical statistic that demonstrates how
important a word is to a corpus -a very popular research method in the field of natural language processing
(NLP) [129] which we used in the context of the red tide. TF-IDF method determines the relative frequency
of words in a specific document through an inverse proportion of the word over the entire document
corpus. The method uses two elements: Term frequency (TF) of term i in document j and inverse document
frequency (IDF) of term i. TF-IDF can be calculated as [130]:
Sustainability 2020, 12, 8506                                                                         9 of 38

                                                                             N
                                       aij = t f ij id f i = t f ij × log2        ,                      (1)
                                                                             d fi
where aij is the weight of term i in a document j, N is the number of documents in the collection, t f ij is
the term frequency of the term i in a document j and d f i is the document frequency of the term i in
the collection.

3.5. Hierarchical Clustering
     Among the many clustering algorithms, we used the agglomerative hierarchical clustering approach
to identify clusters of words based on the TF-IDF matrix, where each row represents the weights of a word
for different documents (tweets). The agglomerative version of hierarchical clustering assumes that each
data point is an initial individual cluster. Then, in each iteration, the two closest (under some criterion)
clusters are merged. One of the advantages of using agglomerative hierarchical clustering is that it is not
required to specify the number of clusters manually beforehand, like in k-means. The clusters are naturally
identified through the resulting dendrogram representation. In this work, we used Ward’s method,
which minimizes the total within-cluster variance, as the criterion for merging clusters (words) during the
clustering process.

3.6. Egocentric Networks
     In this study, we use the method called egocentric networks to identify significant subnetworks that
are associated with the red tide. In particular, an ego-network is the part of a network that involves a
specific node we are focusing on, which we call ego. The network consists of a neighborhood, with all
the nodes connected to the ego, at a particular path length. We create subnetworks were the nodes are
words from the corpus. Two nodes (words) are connected with an edge if and only if there is a bigram that
contains them. Each edge has a weight equal to the number of bigrams (frequency) of this kind generated
from the analyzed dataset.

4. Results and Discussion
      The fundamental aim of our analysis is to identify and relate two different layers of social
exploration in social-ecological crises, namely, the actor-centered meaningful components of the crisis’
experience in the 2016 red tide event in Chiloé Island as well as the general dynamics of actor’s behavior
and communications.
      To begin with, we present two time series of the most important concepts of our research: Chiloé
and red tide. Data has been recovered from Google Search between 2004 and 2020. Then, we offer a
more detailed time series of Twitter’s utterances of the four actors of our research (technical agencies,
NGOs, artisanal fishermen, and political authorities) between 2013 and 2017, so that we can capture
the periods before, during and after the crisis with our selected keywords (Table 3). In a second step,
we identify the meaningful semantic components from actors’ point of view; we do this by analyzing word
clouds by actors before, during and after the crisis combined with the examination of egocentric networks
for different actors and periods. In a third step, we move to a higher level of observation by examining the
semantic clustering of the whole corpus in the three periods. Topics and tweets are analyzed to reconstruct
the external and internal semantic boundaries of the different phases of the 2016 red tide crisis. Finally,
in a fourth step, we present a principal component analysis of actors’ utterances to show their topological
distribution and the form they semantically overlap and differentiate. In Table 4 we summarize our main
findings which we describe in detail below.
Sustainability 2020, 12, 8506 10 of 38
Table 4. Summary of techniques and findings.
Technique Focus Analysis
Chiloé is regularly viewed as a
Time series present the period under
touristic zone. In 2016 the island
consideration with two main words
was the center of attention because
Time series for an introductory characterization
of the red tide. The group of actors
and offers a general view on the
we follow for the analysis are active
frequency of utterances by actors.
on Twitter long before the crisis.
‘Fishing’ and derivatives (artisanal
The technique identifies the fishing, fishermen, fishing
meaningful semantic components regulations, fishing industry) are
from actors’ point of view. It offers a central concerns of Chiloé
detailed view on both the central inhabitants. As such, the 2016 red
Word clouds and peripheral concerns of different tide becomes relevant for technical
actors before, during and after the agencies and NGOs, while
crisis. It also allows to compare fishermen experience the crisis as a
semantic similarities and differences problem of employment. NGOs
between actors and periods. preserve the memory of the crisis
after the event.
Artisanal fishing and artisanal
These networks offer a detailed
fishermen appear as central sources
view on the relevant meaningful
of meaning-making in Chiloé Island.
components of the considered
Egocentric networks Semantic reflections of critical
periods. The analysis is conducted
events (stranding of shellfish and
by periods and actors with different
dumping of salmons) are produced
focal terms concepts.
during the crisis.
Before the crisis, three thematic
This technique identifies proximity groups of tweets can be
of words or tweets in the corpus. distinguished. The crisis produces a
We apply this to recognize internal reduction in the variety of themes,
Clustering and external semantic boundaries in which cluster more tightly together;
actors’ communication. These are while after the crisis, the themes
expressed in words’ and tweets’ multiply. A similar dynamics arises
aggregation. when clustering is applied to tweets
instead of topics.
The technique displays actors’
Before the crisis an important group
tweets distributed into a
of fishermen’s utterances do not
two-dimensional space, thereby
intersect with communications of
Principal component allowing to identify distance and
other actors. During and after the
analysis proximity between centroids and
crisis, NGOs’ communications
revealing the topological borders of
become closer to those of fishermen,
both actors’ communications and
yet with different emphasis.
the complete semantic area.
4.1. Time Series of Keywords and Actors’ Utterances
We present two time series offering a general view on our subject (the 2016 red tide in Chiloé Island)
on the one hand, and on the corpus we use for analysis, on the other. In Figures 2 and 3 we observe the
behavior of two basic words: “Chiloé” and “red tide”, from 2013 to 2017.Sustainability 2020, 12, 8506 11 of 38
Chiloe
Location
100
75
50
150 25
0
rti s n
po a
M rau a
R s
h s
Bí an
M o
’H le
An par s
y qu a
rin bo
ra ta
a a
fa o
cá
tá Lo gió
ro ni
XI ago
ío
l in
go A ilen
Bí
ic Co cam
At ast
to ais
O au
Ta co
et ca
lit
Pa im
pa
Va igg
ca R
e
o
a
g
L
C
s
Lo
a
An
ia
Ar
nt
la
Sa
120
y
Search intensity
s
ne
la
al
ag
M
90
60
05 013
08 13
11 13
02 13
05 014
08 14
11 14
02 14
05 015
08 15
11 15
02 15
05 016
08 16
11 16
02 16
05 017
08 17
11 17
02 17
8
01
0
0
0
0
0
0
0
0
0
0
0
0
0
0
0
/2
/2
/2
/2
/2
/2
/2
/2
/2
/2
/2
/2
/2
/2
/2
/2
/2
/2
/2
/2
/2
02
Figure 2. Time series of the keyword “Chiloé”, 2013–2017.
Red tide
100
Location
100
75
50
75
25
0
Search intensity
rti s n
M ’Hig ia
lp na
R s
C íos
au ío
po s
ra n
An M o
fa le
rin ma
a
a At sta
Bí iso
oq cá
tá Lo gió
XI ago
ro in
go O an
Ta lita
b
ot
to au
Ar B
Va hile
m
C pa
et g
ca R
a
a
Pa a
ac
e
c
o
ar
g
ui
y ac
L
s
Lo
50
ic
An
ia
Ar
nt
la
Sa
y
s
ne
la
al
ag
M
25
0
05 013
08 13
11 13
02 13
05 014
08 14
11 14
02 14
05 015
08 15
11 15
02 15
05 016
08 16
11 16
02 16
05 017
08 17
11 17
02 17
8
01
0
0
0
0
0
0
0
0
0
0
0
0
0
0
0
/2
/2
/2
/2
/2
/2
/2
/2
/2
/2
/2
/2
/2
/2
/2
/2
/2
/2
/2
/2
/2
02
Figure 3. Time series of the keyword “red tide”, 2013–2017.
In Figure 2 we notice a clear upward trend in Chiloé searches that begins before the crisis (2009),
with cyclical surges before the summer season (probably related to tourism). In 2016, we observe that a
non-seasonal surge appears at the moment of the crisis, thereby showing that the island captured wider
public attention. However, the surge is short-lived, and the searches quickly go back to their cyclical
form, with non-appreciable changes in the general trends. Figure 3 explains the short-lived surge in 2016.
As seen, the concept of “red tide” presents a massive spike in searches during the crisis period, but withSustainability 2020, 12, 8506 12 of 38
no evident aftereffects. The general attention drops after the crisis as rapidly as it had surged, and remains
mainly as a local phenomenon, as argued by [47].
Going deeper into our analysis, we can observe in Figure 4 a general framework of the research period
in a time series of actors’ utterances in Twitter data from 2013 to 2017.
a) b)
15
Number of tweets
Number of tweets
10 10
5 5
0 0
Jan−2013 Jan−2014 Jan−2015 Jan−2016 Jan−2017 Jan−2015 Jan−2016 Jan−2017
Date Date
Armada de Chile Prensa IFOP Servicio Nacional de Pesca y Acuicultura Fundación Crea Greenpeace Chile
c) d)
60 12.5
Number of tweets
Number of tweets
10.0
40 7.5
5.0
20
2.5
0 0.0
Jan−2013 Jan−2014 Jan−2015 Jan−2016 Jan−2017 Jul−2015 Jan−2016 Jul−2016 Jan−2017
Date Date
Confederación Nacional de Pescadores Artesanales de Chile Federación de trabajadores pesqueros Intendencia de los Lagos Ministerio Economía Subsecretaría de Pesca y Acuicultura
Figure 4. Time series of actors’ utterances 2013–2017. (a) Number of tweets from Actors 1, (b) Number of
tweets from Actors 2, (c) Number of tweets from Actors 3, and (d) Number of tweets from Actors 4.
As seen, several actors –particularly sectorial ones and Greenpeace– were already active in the
analyzed topics before the beginning of the red tide crisis. For most of them, a spike can be detected
as the crisis begins, although the general distribution does not differ significantly from the observed
behavior before or after. There are, however, actors that start tweeting on the relevant topics of the corpus
(see Table 3) as an effect of the crisis. Some of them are sectorial actors, such as the National Federation
of Chilean Fishermen (Conapach) and the Fisheries Promotion Institute (IFOP), while others are not
directly involved with the fishing sector, such as the Ministry of Economy (Minecon), local authorities
(Intendencia), the Navy (Armada de Chile) and Crea Foundation. Noticeably, most of them remain active
at tweeting relevant topics of the corpus months after the events, showing that Twitter users continue
posting on the crisis long after the phenomenon passed, as argued by Ref. [43].
4.2. Actor-Centered Meaningful Components before, during and after the Crisis
In this subsection, we aim at identifying the basic meaningful components that characterize actors’
experiences on different periods of the crisis. For this, we use the analysis of word clouds combined
with egocentric networks of selected concepts. Figures 5–8 shows word clouds with the main keywords
containing the utterances of four actors (technical agencies, NGOs, artisanal fishermen and political
authorities) before (Figure 5), during (Figure 6), after the crisis (Figure 7), and in the whole considered
period (Figure 8).
As shown, there are divergences and congruencies regarding the meaningful topics for each group.
In Figure 5 (before the crisis), we can observe that “fishing” (pesca) and particularly “fishing regulations”
(ley de pesca) are two of the most significant topics for technical agencies, fishermen and political
authorities, while NGOs are not interested in the particular topics relevant for the island, but on general
issues such as climate change and the melting of glaciers. Fishing regulations is a significant topic for
artisanal fishermen and for the fishing industry as well because it defined several aspects regarding the
political economy of the island, such as fishing sectors, fishing quotes, ban on fishing particular species
and concession periods for the industry [131].Sustainability 2020, 12, 8506 13 of 38
Interestingly, as shown in Figure 6 (during the crisis), the topics red tide (marea roja) or Chiloé disaster
(desastre) become central for technical agencies and NGOs, while the topics fishing and fishermen are
significant for artisanal fishermen and for political authorities. Even fishermen keep more or less the
same of topics before, during and after the crisis, focusing on a critical discussion on fishing regulations
affecting artisanal fishing and shellfish extraction. Certainly, the topic red tide turns out to be relevant for
fishermen and political authorities as well, yet the former read the crisis as a problem of employment and
subsistence (fishing), while the latter observes this as a political problem in need of an agreement (acuerdo).
As Ref. [42] find out, Chiloé inhabitants and particularly fishermen are used to red tides. They know how
to identify secure sectors for shellfish extraction and fishing. However, the dimensions and intensity of the
2016 red tide crisis were so extraordinary that there was no place to move the work activity. Thus, the red
tide became a factual work prohibition.
As seen in Figure 7, while technical agencies, fishermen and political authorities return to topics related
to fishing and fishing regulations as in the period before the crisis, the words “salmons”, “Chiloé” and
“government” remain as the most significant topics in NGOs discourse. Put in other words, NGOs enter
late into the crisis discourse; they, however, preserve the key message of the crisis in the long run,
thereby accomplishing a denunciative memory function that counts as a source for collective learning
processes as to how to deal with this type of critical situations, as argued by Ref. [54,126]. These can also be
seen by NGOs in Figure 8, where the words “Chiloé”, “disaster” or “salmons” are clearly distinguishable
as significant communication topics, while the other actors share fish-related words as central topics.
Word clouds are one of the easiest ways of visualizing both the meaningful boundaries of different
discourses as well as the relevant topics the actors are interested in. A more detailed view on the
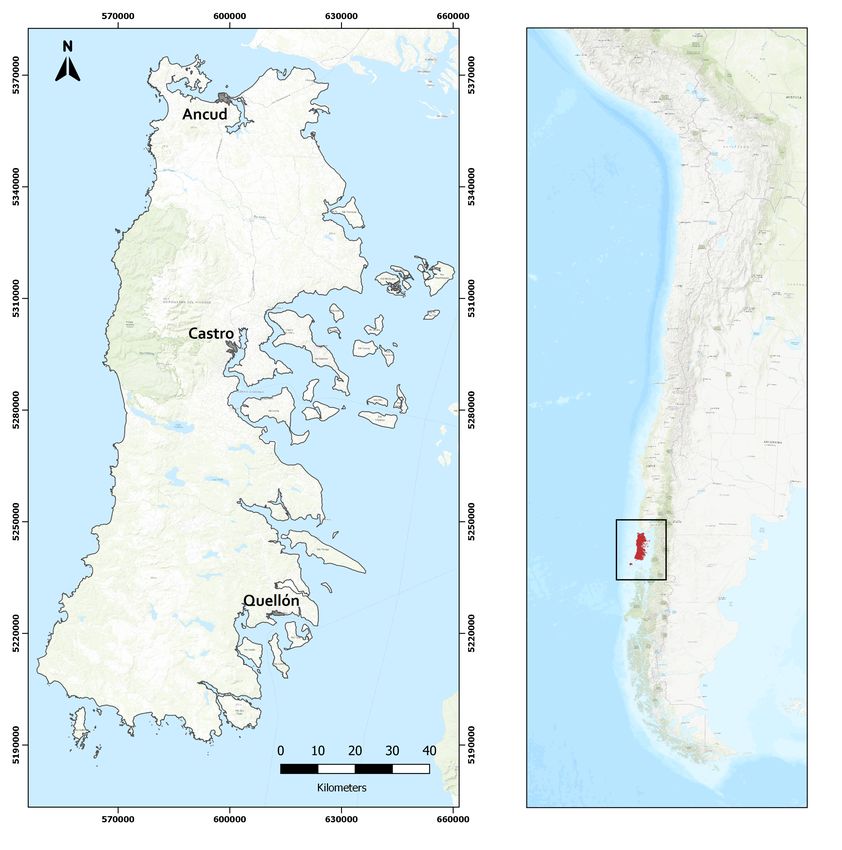
meaningful construction of discourses is offered by egocentric networks. In Figures 9–11, we observe
different networks of meaning construed from the perspective of relevant concepts of the crisis, such as
artisanal fishing, red tide, dumping of salmons, and Sernapesca (the National Fishing Service).
Figure 5. Keywords by groups of actors, 2013 to February 2016.Sustainability 2020, 12, 8506 14 of 38
Figure 6. Keywords by groups of actors, March to May 2016.
Figure 7. Keywords by groups of actors, June 2016 to January 2017.
In Figure 9, before the crisis, we analyze two central concepts: artisanal fishing (pesca artesanal)
and Sernapesca. Related to the concept of artisanal fishing (and fishing), we observe most of the topics
which are relevant in the word clouds in the same period, yet we identify here the weight of relationships
among terms. This allows us to build the limits of the general semantic structure of the period from a
particular and localized social position. The focal points before the crisis are “fishing” and “Sernapesca”.
Fishing means “artisanal fishing” in the first place, as shown in Figure 9. It refers to a group of words
concerned with sustainability problems experienced by artisanal fishermen, such as industrial fishing,
illegal fishing, trawl fishing, dismissals from the industry, aquaculture, recreational fishing, and the
fisheries law (leyde-pesca). When we compare this information with the word clouds, we notice that this
web of meaning is mainly related to artisanal fishermen and to political authorities, while the network
around Sernapesca in Figure 9 (the National Fishing Service) represents the communication of technical
agencies before the crisis, which deals mainly with the bureaucratic functioning of the office and the role
of seizing (incauta) illegal fishing.Sustainability 2020, 12, 8506 15 of 38
Figure 8. Keywords by groups of actors, 2013 to 2017.
Figure 9. Egocentric networks by topics, 2013 to February 2016.
In the networks during the crisis (Figure 10), the concept of artisanal fishing remains as a
significant vertex. However, its network changes and new relevant links are drawn to the nodes
“commission” and “leaders”, which represent fishermen in a series of negotiations with the government
until the end of the crisis in May 2016. The other two networks are at the semantic core of the crisis: the
vertex “red-tide” and “salmons”, which reconstruct two crucial events in the development of the crisis.
The former relates directly with the massive stranding of shellfish (vertex machas) on 25 April 2016, as well
as with the “presence of the red tide phenomenon” conceptualized in the network as a “crisis”; the latter
refers to the “dumping of tons of dead salmons” into the sea that took place 75 nautical miles off the
northwest coast of Chiloé Island from 10 to 26 March 2016.Sustainability 2020, 12, 8506 16 of 38
Figure 10. Egocentric networks by topics, March to May 2016.
Figure 11. Egocentric networks by topics, June 2016 to January 2017.Sustainability 2020, 12, 8506 17 of 38
In the networks after the crisis (Figure 11), we observe a focus on persons. While during the crisis
the vertex “red-tide” refers to the phenomenon itself, after the crisis it deals with the consequences:
the “affected” persons and areas, and the zones “free” from the algae. The focus on persons is confirmed
by the vertexes “fishing” and “fishermen”, which show how important is the artisanal dimension in social
relations on Chiloé Island. While the vertex “artisanal fishing” draws its main links to problematic topics
already present before the crisis (such as illegal fishing, aquaculture), the vertex “artisanal fishermen”
focuses on the ways out of the crisis, either politically or economically. Politically, the vertex refers to the
negotiations with the government after the crisis, including terms such as dialog, process, organization,
attention, reunion, which denote some processes of collective learning. Economically, the vertex is closely
related with the concept of entrepreneurship (emprendimiento). Belonging to this semantic family are
also terms such as products, productive, commercialization and multipurpose, which mostly refer to the
different economic activities fishermen carry out to cope with the crisis.
As seen, artisanal fishermen and artisanal fishing are central vertexes of meaning-making on Chiloé
Island. The world is construed around them as they become a source of meaning for reconstructing social
life (politically and economically) when a disrupting event such as the red tide crisis takes place. However,
when we compare the webs of meaning for different actors during and after the crisis, we notice that only
for fishermen artisanal fishing is relevant, as shown in Figures 12 and 13.
Figure 12. Egocentric networks by actors, March to May 2016.
In Figure 12, during the crisis, we observe that for every actor the vertex “red tide” is relevant.
Nonetheless, while for fishermen the event is understood as a “crisis”, political authorities consider it as a
“phenomenon”. This semantic difference reflects the ontological gap between the lived experience of the
crisis and observing the crisis from a distance: it is a crisis when we experience it, and it is a phenomenonSustainability 2020, 12, 8506 18 of 38
when we observe it. A similar sense share NGOs: they are rather interested on the causes of the red
tide as they reflect on the authorization of dumping rotten fish (vertex pescado podrido) into the sea
on March 2016. They do not “live” the experience; they analyze it, but their work becomes crucial after
the crisis for maintaining the memory of the facts and trigger learning processes as well as inform on
support activities for fishermen. After the crisis (Figure 13), technical agencies and NGOs come along
these lines, while only for fishermen is “artisanal fishing” the most relevant vertex organizing other
meanings. When compared with Figure 11, we can conclude that it is their narrative, namely fishermen’s
narrative, what governs island’s self-identity. Certainly, there might be conflicts in the construction of this
identity as Ref. [45] have argued, yet if there is some identity on the island, fishermen have a significant
role to play in it.
Figure 13. Egocentric networks by actors, June 2016 to January 2017.
4.3. Constructing the General Meaningful Depiction: Semantic Clustering
Having analyzed in detail the meaningful construction of different actors on the crisis through word
clouds and egocentric networks, we aim now to increase the level of abstraction to observe the whole
semantic structure of the periods before, during and after the crisis. We begin this analysis by using
hierarchical clustering on the topics of our corpus (Figure 14).
In Figure 14a, before the crisis, we observe three themes that stand out from the rest. The first one
(orange) refers to illegal fishing of sardine and the pressures for authorizing it. Contrasting this set with
the word clouds, we can identify that mostly artisanal fishermen support this statement. The second
group (light green) refers to the development of the salmon industry in the region, which has historically
been object of a highly contentious debate about its environmental and social sustainability. The keyword
“salmon fever” (fiebredelsalmon) refers to a documentary issued at that time precisely denouncing thisSustainability 2020, 12, 8506 19 of 38
situation. Interestingly, the salmon industry will be on the spotlight in the period during the crisis because
of the dumping of dead salmons into the sea [46]. This reveals that the industry is a permanent source of
conflicts in the region.
The third group (blue green) concentrate terms related to the “fisheries law” or “Longueira law”,
after the minister promoting it, which was passed in February 2013 and originated political and social
controversies as it was blamed for favoring industrial fishing and affecting artisanal fishermen. Tweets on
the topic also alleged bribes received by congressmen from the fishing industry to approve the legislation.
Other topics are also present in this period (violet group). They turn later into key elements of the red
tide crisis and the uprising of Chiloé inhabitants during May 2016. Tweets mention, e.g., artisanal fishing,
artisanal fishing associations, unemployment; some of them mention possible threats affecting the island,
including climate change, the ban of fishing for some species, sectorial projects to contain sea weed in the
region, and even the practice of dumping dead fish into the sea, which positions as the most relevant topic
in the next period.
In Figure 14b, during the crisis, there are two outstanding, yet expected topics: one refers to the
relationship between the dumping of dead salmon into the sea and the red tide bloom; the second one
concerns with the effect of algal blooms on fishing coves and aquaculture projects. Other words refer to
different aspects of the crisis, such as the death of tons of fish, the economic “disaster” it produced on the
fishing industry (and the salmon industry in particular), the surveillance work and prevention brought
forward by the authorities to avoid intoxications, the stranding of fish and shellfish at Chiloé coasts on
25 April 2016 —a strong image which captured media attention for weeks—, and the different initiatives
attempted by both the central Government and local authorities to contain the crisis and negotiate with
local fishermen organizations. A mention is also made to the fisheries law, one of the most relevant topics
of the previous period. As we can observe, the red tide crisis dominates completely the semantic scenario,
thereby transforming communication into a rather unidimensional realm.
In Figure 14c, after the crisis, we can observe an increase in the diversity of themes, which seems to
be signaling that the communication is going back to some type of meta-stability. While the singularity or
one-dimensionality of communication is over, there are seems to be a general meaning pointing out to the
reconstruction after the crisis. To this meaning contribute the focus on “recovery” (training programs and
programs supporting local entrepreneurship), other mentions aimed at improving monitoring, surveillance,
management of fishing resources and the training of local fishermen—all of them pointing out to collective
and organizational learning processes. One of the key themes is Sernapesca’s campaign to observe fishing
prohibitions. Some other topics call for a larger change and to advance new legislations.
Maybe the most interesting result here is the new role taken up by the expression “red tide”, which
raised to a highly condensed semantic linking up to the nexus of ideas and themes that made up the crisis
itself. The concept acts as a kind of “semantic memory” or trace of the crisis, yet apparently unconnected
from other themes. The previous findings are confirmed when looking at how the tweets cluster across the
three periods. Before the crisis, three thematic groups of tweets can be distinguished. The crisis produces a
reduction in the variety of themes, which cluster more tightly together. While after the crisis, the themes
multiply.
In Figure 15a, before the crisis, we observe three groups of tweets. Cluster 1 (red) and 2 (green)
present a similar participative structure of the four actors, with a less dense participation of NGOs and
an intense participation of fishermen. We also find a relevant participation of political authorities in
cluster 3 (blue). Since this technique clusters tweets (and not topics), in each case we have analyzed the
contents of nine nearest tweets to the cluster’s centroid (see Appendix A), in order to identify the thematic
profile of clusters: cluster 1 refers mainly to regulations and risks, cluster 2 refers to surveillance activities,
and cluster 3 informs on activities of political authorities in relation to fishing topics.You can also read