Learning from Tumultuous Times: An Analysis of Vulnerable Sectors in International Trade in the Context of the Corona Health Crisis
←
→
Page content transcription
If your browser does not render page correctly, please read the page content below

JULY 2021
Research Report 454

Learning from Tumultuous Times:
An Analysis of Vulnerable Sectors in
International Trade in the Context of the
Corona Health Crisis
Oliver Reiter and Robert Stehrer

The Vienna Institute for International Economic Studies
Wiener Institut für Internationale Wirtschaftsvergleiche
Learning from Tumultuous Times:

An Analysis of Vulnerable Sectors in International
Trade in the Context of the Corona Health Crisis

OLIVER REITER
ROBERT STEHRER

Oliver Reiter is Economist and Robert Stehrer is Scientific Director at the Vienna Institute for
International Economic Studies (wiiw).

This work was commissioned by the Austrian Federal Ministry for Digital and Economic Affairs.
Abstract

The COVID-19 pandemic marks an unprecedented shock to global growth and trade and brought
international dependencies into the spotlight. This triggered discussions on resilience and robustness of
global value chains. In this paper we assess which products can be considered as vulnerable to trade
shocks at the global level – referred to as ‘risky’ products – by constructing a ‘product riskiness indicator’
for 4700 globally traded products based on components such as market concentration, clustering
tendencies, network centrality of players, or international substitutability. In a second step the bilateral
imports of risky products are matched to multi-country input-output tables enabling the analysis of the
importance of internationally sourced risky products by country and using industries. Higher-tech
industries are more prone to supply-chain vulnerability given the large share of risky products in high-
tech product categories. Third, we apply a ‘partial global extraction method’ to assess the GDP impact of
reshoring. Assuming that imports of risky products are re-shored from non-EU27 to EU27 countries
suggests an increase in the EU27 GDP of up to 0.5%. The non-EU27 countries lose from such re-
shoring activities accordingly. This suggests that it is also in the interest of the supplier countries and
industries to assure robust or at least resilient supply chains. Finally, selected policy aspects in the
context of the envisaged EU Open Strategic Autonomy are debated.

Keywords: supply chains, vulnerability, resilience, robustness, global extraction method

JEL classification: F14, F17, F52
CONTENTS

1. Introduction .................................................................................................................................................... 11

2. Assessing the vulnerability of product trade .................................................................................. 13

2.1. Methodology ..................................................................................................................................13

2.1.1. Outdegree centrality .......................................................................................................................13
2.1.2. Tendency to cluster ........................................................................................................................14
2.1.3. International substitutability ............................................................................................................14
2.1.4. Hirschmann-Herfindahl Index ........................................................................................................15
2.1.5. Non-tariff measures .......................................................................................................................15
2.1.6. Constructing the ‘product riskiness indicator’ .................................................................................16

2.2. Data and descriptive results...........................................................................................................16

2.2.1. Characteristics and import shares of risky products ......................................................................17
2.2.2. Risky products in the overall import flows of Austria and the EU27 ...............................................18

2.3. Validation .......................................................................................................................................26

2.3.1. Comparison with other results .......................................................................................................26
2.3.2. Comparison to COVID-19 related measures .................................................................................27

2.4. Risky products in industry supply chains .......................................................................................29

2.4.1. Risky trade by using industries ......................................................................................................29
2.4.2. Random walk centrality ..................................................................................................................31

2.5. Results from a ‘partial global extraction method (PGEM)’ .............................................................32

2.5.1. Final demand shocks and EU final demand re-shoring .................................................................32
2.5.2. The impact of GVC re-shoring .......................................................................................................34

2.6. Summary........................................................................................................................................36

3. Policy aspects................................................................................................................................................. 38

3.1. General aspects .............................................................................................................................38
3.2. Classification and assessment of GVC shocks..............................................................................40
3.3. Policy aspects and challenges for the ‘new normal’ ......................................................................42

3.3.1. Main policy suggestions .................................................................................................................42
3.3.2. Challenges for the ‘new normal’ and EU policies ...........................................................................44
3.4. Conclusions ................................................................................................................................... 52

4. Bibliography................................................................................................................................................... 54

Appendix ...................................................................................................................................................................... 57

A.1 Tables ................................................................................................................................................ 57
A.2 Graphs ............................................................................................................................................... 61
TABLES AND FIGURES

Table 1 / Top 10 Risky import products ....................................................................................................17
Table 2 / Risk classification of selected products in 2010 ........................................................................27
Table 3 / Risk classification of COVID-19 products ..................................................................................28
Table 4 / Growth of imports from 2019 to 2020 ........................................................................................29
Table 5 / List of identified vulnerable industry sectors ..............................................................................36
Table 6 / Main policy recommendations for GVCs ...................................................................................43
Table 7 / Supply risk vs. necessity matrix .................................................................................................44

Figure 1 / Seasonally adjusted monthly trade volume index, 2015 = 100 ................................................11
Figure 2 / World trade in HS 2d sections by product riskiness index........................................................18
Figure 3 / Development of the share of risky products in imports by region .............................................19
Figure 4 / Development of the share of risky products in imports by region and use category ................19
Figure 5 / Share of risky products in imports, 2018 ..................................................................................20
Figure 6 / Share of imports versus share of risky products in the EU27 and Austria, 2018 .....................21
Figure 7 / Share of imports versus share of risky products in the EU27 and Austria for HS group 8,
 2018..........................................................................................................................................21
Figure 8 / Imports of risky and non-risky products by partner...................................................................23
Figure 9 / Import flows and shares by HS section (all countries)..............................................................24
Figure 10 / Import flows and shares by HS section (extra-EU27 imports) ................................................25
Figure 11 / Share of risky products in imports by exporting country, 2018 ...............................................26
Figure 12 / Austria, 2014: Share of risky imports in using industries’ imports and selected partner
 country ......................................................................................................................................30
Figure 13 / Random walk centrality and share of risky products in Austria, 2014 ....................................31
Figure 14 / GDP effects of a final demand shock .....................................................................................33
Figure 15 / GDP effects of final demand re-shoring .................................................................................33
Figure 16 / Results from ‘partial hypothetical extraction’ exercise: GVC effect ........................................35

Box 1 / Selected firm level evidence on GVC shocks ...............................................................................39
Box 2 / Assessment of strategic stockpiling..............................................................................................46
Box 3 / Re-shoring value chains ...............................................................................................................47
Box 4 / Rare earth metals .........................................................................................................................48
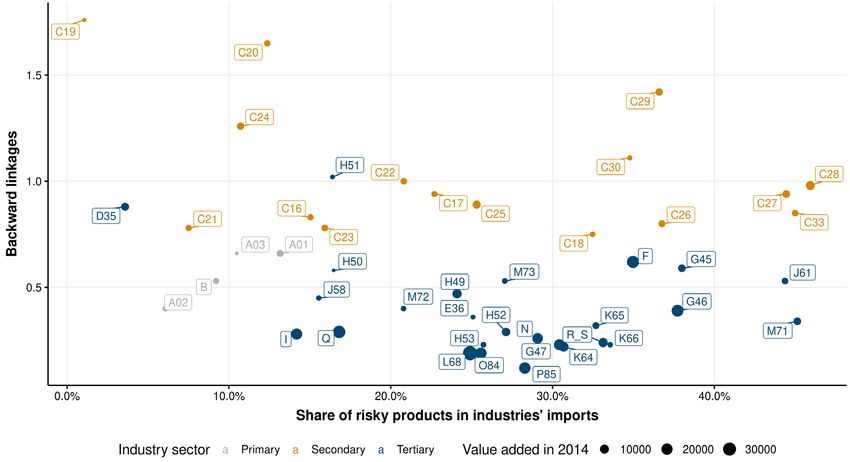
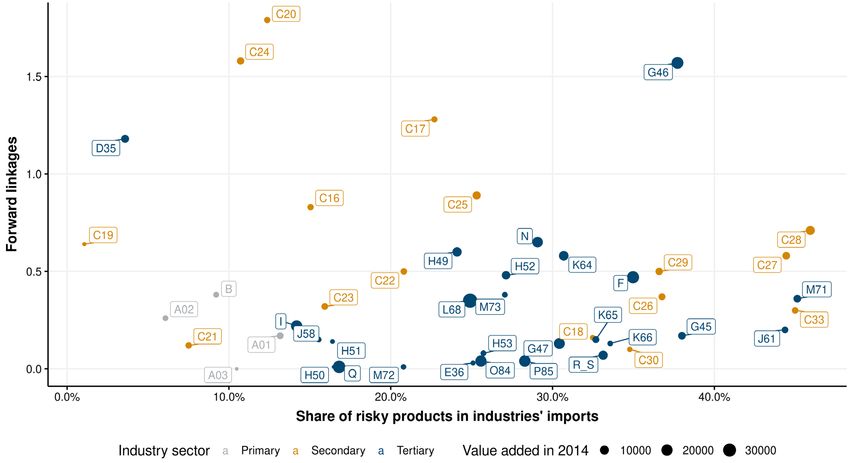
Appendix

Table A.1 / Non-risky and risky products by HS 2-digit ............................................................................ 57
Table A.2 / WIOD industries ..................................................................................................................... 59

Figure A.1 / Austria, 2014: Share of risky imports in using industries’ imports and selected partner
 country, service industries ....................................................................................................... 61
Figure A.2 / Random walk betweenness and share of risky products in Austria, 2014 ........................... 61
Figure A.3 / Random walk centrality and share of risky products in Austria, all industries, 2014 ............ 62
Figure A.4 / Backward linkages and share of risky products in Austria, all industries, 2014 ................... 62
Figure A.5 / Forward linkages and share of risky products in Austria, all industries, 2014 ...................... 63
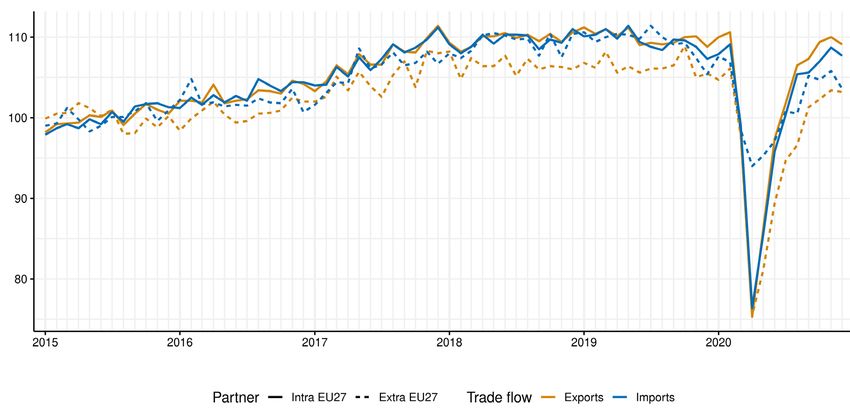
INTRODUCTION 11
 Research Report 454

1. Introduction

The COVID-19 pandemic showed that international production networks and global supply and value
chains can be fragile and vulnerable to various shocks. This is also reflected in the fact that trade is more
volatile than GDP, given the many interlinkages as already known from previous crises. As Figure 1 shows,
trade volumes collapsed in the first months of 2020 and partially recovered in the second half of 2020.
Overall, exports of the EU27 were 8.6% below values for 2019 while imports fell by 9.6%. Splitting total
trade into intermediate, consumer and capital goods trade, we find that exports and imports of intermediate
inputs declined by 10.1% and 13.4% respectively, consumer goods by 6% and 4.6% and capital goods by
9.9% and 6.3%. The latest estimates for annual GDP growth are declines of 6.8% for the euro area and
6.4% for the EU27 for 2020. 1 For the US, real GDP is projected to have declined by 3.5% in 2020. 2.

Figure 1 / Seasonally adjusted monthly trade volume index, 2015 = 100

Source: Eurostat.

In response to the health crisis and the threat of shortages of critical supplies, countries around the
globe quickly began to restrict the export of specific products like masks and other health related
equipment (as well as the cross-border mobility of people), resorting to a kind of "emergency
protectionism" at least in the short run. In addition, various supply side shocks emerged due to severe
lockdowns in various regions or countries, hampering production activities and transport facilities.
However, in a world where production is organised along global value chains (GVCs) the frictionless flow
of goods is necessary to preserve the supply of needed commodities.

1
 See https://ec.europa.eu/eurostat/documents/portlet_file_entry/2995521/2-02022021-AP-EN.pdf/0e84de9c-0462-6868-
 df3e-dbacaad9f49f (accessed 29.3.2021)
2
 See https://www.bea.gov/news/2021/gross-domestic-product-4th-quarter-and-year-2020-advance-estimate (accessed
 29.3.2021)
12 INTRODUCTION
 Research Report 454

 In addition to the many regionalised production and supply shocks, the pandemic particularly made
 various strong dependencies on Chinese manufacturing obvious. For example, as many producers in
 the pharmaceutical industry had moved parts of their production to low-cost destinations such as China
 and India, the sudden stop in international shipments left many hospitals with shortages of needed
 equipment. 3 As a result, for example, the Environment, Public Health and Food Safety Committee of the
 European Parliament has urged the Commission "to find ways to restore pharmaceutical manufacturing
 in Europe". 4 These developments raise the obvious questions of how vulnerable our economies are to
 demand and supply shocks – both apply in the case of the COVID-19 health crisis – from within and
 outside the EU in general, and what role GVCs play in the transmission of these shocks. Therefore, the
 issue of resilience of international trade and production integration is again becoming a topic of
 economic research and an objective of public policy to mitigate economic and health risks. This applies
 on the level of individual firms and the way international production integration is organised along
 regional and global supply chains, but also to public sector activities (whether they be organised market-
 oriented or operated by government institutions) as the examples of the supply of critical supplies (like
 drugs, medicines, masks, etc.) show.

 This study contributes to this literature by identifying potential vulnerabilities of global value chains at the
 product level. First, an assessment is made of the vulnerability of product supplies concerning
 internationally traded products, by developing a product riskiness index. This index allows us to identify
 possible vulnerabilities of industry sectors and dependencies on trading partners. Based on this, policy
 aspects concerning the resilience and security of (strategic) supply chains are discussed. As will be
 outlined, however, this is a complex issue as it includes many dimensions with blurred boundaries
 between them and therefore the results can only lay the groundwork for further discussions.

 In Section 2, following the recent literature, the method for identifying ‘risky’ products is outlined. The
 method is applied at the level of detailed trade data (Harmonised System HS 6-digit products) including
 about 5000 products. A summary of the most important results is then shown descriptively. The index for
 product riskiness is also compared to the development of imports in 2020 with a focus on the products
 essential to combatting the health effects of the pandemic. 5 Further, the bilateral trade data for risky
 products are aligned with multi-country input-output tables to assess the role of ‘risky’ products in
 imported intermediates and to assess potential effects of re-shoring activities. Section 3 is then devoted
 to providing an overview of potential measures to reduce vulnerabilities and increase resilience based
 on recent contributions to the literature.

 3
 For Austria, see e.g.: https://orf.at/stories/3158930/
 4
 See https://www.europarl.europa.eu/news/en/press-room/20200712IPR83214/covid-19-eu-must-step-up-efforts-to-
 tackle-medicine-shortages (accessed 13.4.2021)
 5
 Unfortunately, at present it not possible to differentiate the trade disruptions that happened in 2020 in terms of the
 various specific causes like shocks to the production and supply side (e.g., the effects of lockdowns and production
 shut-downs in the exporting countries), obstacles to international transportation, policy-induced measures like export
 restrictions for specific (critical) products, or general trade protection measures. Concerning these aspects decent data
 for 2020 that would enable a systematic analysis of the factors behind supply disruptions, are not yet available. As of
 11.1.2020: The Global Trade Alert data only provide a few observations for 2020. The WTO I-TIP database for non-tariff
 measures does not (yet) report any quantitative restrictions (export restrictions would fall into this category). The list of
 export restrictions on the ITC MacMap Website is not machine-readable available (yet).
ASSESSING THE VULNERABILITY OF PRODUCT TRADE 13
 Research Report 454

2. Assessing the vulnerability of product trade

In this section we first introduce the methodology of how to define the ‘riskiness’ of trade in products at
the detailed HS 6-digit level (Section 2.1). This method identifies more than 400 products as ‘risky’ or
vulnerable to supply shocks. A descriptive assessment of the magnitudes of these products and their
composition focussing on the EU27 and Austria is presented in Section 2.2. In the following Section 2.3
we validate our findings with results from the existing literature and compare them with the products
identified as being ‘risky’ during the COVID-19 pandemic (which also highlights the distinction between
‘risky’ and ‘essential’). Linking the import of these products to a multi-country input-output table, the
WIOD, we then assess the importance of these risky products as imported intermediate inputs in the
industry’s production, indicating the vulnerability of global value chains (Section 2.4). Finally, in Section
2.5 we apply a ‘partial hypothetical extraction approach’ to assess the impact of supply and demand
shocks with respect to the risky products identified.

2.1. METHODOLOGY

As a first exercise, we replicate the product fragility indicator developed by Korniyenko, Pinat and Dew
(2017), abbreviated henceforth as KPD. The indicator is constructed based on three separate components
– the outdegree centrality, the tendency to cluster, and international substitutability – that capture structural
dependencies or weaknesses which make the products potentially “risky”, “fragile” or “volatile”. In addition,
we add two more components – the Hirschmann-Herfindahl index and accounting for non-tariff measures -
which we expect should make this indicator more robust and more accurate. As in KPD we exclude
products that are not reported in all years. Contrary to KPD however, we also consider final or consumption
products according to the UN BEC classification: while KPD is mainly concerned with shocks that affect
supply chains, we are also interested in shocks that might affect end consumers.

In the next subsections we present the method for the components of the indicator. Most calculations
below are carried out separately for every product. For ease of presentation we exclude the product
index k where possible.

2.1.1. Outdegree centrality

The first component ‘outdegree centrality’ detects the presence of central players. Central player refers
to a country that exports to many countries and has a high market share in the importing countries. As
the name suggests, this component is based on the outdegree centrality of all countries, for a given
product defined as

 = �
 ¯
 =1
14 ASSESSING THE VULNERABILITY OF PRODUCT TRADE
 Research Report 454

 Here, is the value of country i’s exports to country j, and ¯ is the average value of country j’s
 imports. Based on this, KPD define the standard deviation of the outdegree centrality

 1
 1 = � ∑ =1( − ¯ )2 ,

 where ¯ is the average outdegree centrality, as the first component 1 of their index. In a situation where
 one country i is the supplier of all other countries for a specific product, that country will have a high
 outdegree centrality, while the other countries have an outdegree centrality of 0. In this case the
 standard deviation for country i has a high value. On the contrary, in a situation where all countries
 export to all other countries and no country stands out, the outdegree centralities will be similar and the
 standard deviation will be low.

 2.1.2. Tendency to cluster

 The second component of the KPD product fragility index is the ‘tendency to cluster’. If countries form
 clusters characterised by trade only within this cluster, then a supply disruption within a cluster can have
 severe effects on the countries in the cluster. To capture this, KPD propose to use the clustering
 coefficient – which is a commonly used metric in network analysis – to assert the tendency of countries
 to trade within groups. This clustering coefficient is defined as

 1 1 +
 = �
 ( − 1) ¯ 2
 ,

 where refers to the number of countries that are connected to node i, is the weight of the connection
 between i and j, ¯ = ∑ ⁄ is the average weight of i’s connections and is an indicator variable that
 takes a value of 1 when a connection between i and j exists and 0 otherwise. This cluster coefficient is then
 averaged and multiplied by the diameter of the network. The diameter is the longest distance between
 two nodes that exist in a network. The second component of the product fragility index is then

 2 = � � ⋅
 =1

 The more countries that form clusters and the larger “apart” countries are from each other (i.e., the
 diameter has a high value), the more fragile is this product network.

 2.1.3. International substitutability

 The third component of the product fragility index captures international substitutability. For this, KPD
 use the “revealed factor intensity” methodology of Shirotori, Tumurchudur and Cadot (2010) to compute
 human capital intensities per country and product. They calculate Balassa-style weights from the trade
 data ( are the exports of country i and product k and are the total exports of country i):

 ⁄
 =
 ∑( ⁄ )
ASSESSING THE VULNERABILITY OF PRODUCT TRADE 15
 Research Report 454

The revealed human capital intensity can then be computed as = ⋅ where refers to a human
capital measure (such as years of schooling) in country i. The third component of the fragility index is
then again defined as the standard deviation of the revealed human capital intensity (as before, ¯ is the
average human capital intensity for product k):

 1 2
 3 = � �� − ¯ �

 =1

Trade between countries with very different revealed human capital intensity implies a larger component
for the product fragility measure.

2.1.4. Hirschmann-Herfindahl Index

In addition to these three components suggested by KPD we add an additional component that captures
the situation when an importer country is dependent on just a few exporting countries, meaning that the
market concentration among the exporting countries is high. For this we calculate the Hirschmann-
Herfindahl index (HHI) that is commonly used to quantify the market concentration of firms in a market.
First, we compute the HHI, for a given product, for every importing country in our sample, i.e.

 2

 = � � �

 =1

Here, is the trade flow from country i to country j and are total imports of country j. Then we
aggregate these country-level HHI values with a weighted average, where the weights are the total
imports of a country. This yields the fourth component 4 which is defined as

 4 = � ⋅
 =1

where = ⁄∑ =1 so that the weights sum up to one.

2.1.5. Non-tariff measures

In our second addition, we want to identify products that are often targeted by non-tariff measures. As
Grübler and Reiter (2021) show, TBT STC and SPS STC 6 are the two types of non-tariff measures that
have the most consistently negative effect on trade flows. We compute the fraction of world trade (for a
given product) that is affected by one of the two measures as

 5 = � � ⋅ �� �
 =0 =0 =0 =0

6
 TBT STC are special trade concerns (STC) of technical barriers to trade. Specific trade concerns to Sanitary and
 Phytosanitary measures (SPS STC)
16 ASSESSING THE VULNERABILITY OF PRODUCT TRADE
 Research Report 454

 where is a dummy variable indicating whether the flow between exporter i and importer j is
 affected by a TBT STC or SPS STC.

 2.1.6. Constructing the ‘product riskiness indicator’

 To calculate the ‘product riskiness index (PRI)’ 7 the five components are normalised. The normalised
 scores of the components are then used by the k-means algorithm to find four groups of similar
 products. The group of products that shows the highest values in all five components over the whole
 period is considered as the group of risky products. The other three groups of products are considered
 non-risky. The resulting product riskiness index is thus defined on product level and has no time
 dimension. That means that short run fluctuations in the trade data have only a limited impact on the
 product riskiness index. We assess however how the relative importance of these thus defined risky
 products has evolved over time.

 There is one caveat to consider: As the product riskiness index is based on global trade data, it identifies
 structural weaknesses on the global level. These weaknesses may or may not apply to every single
 country individually. 8 Thus further and more detailed information may be required when applying the
 product riskiness index to the trade flows of a single country (or region like the EU-27).

 2.2. DATA AND DESCRIPTIVE RESULTS

 The components of the product riskiness index are calculated using the BACI dataset. 9 To calculate the
 ‘International substitutability’ and the ‘Non-tariff measures’ components we additionally make use of the
 following two datasets: First, information on human capital on a country-year level is based on the ‘mean
 years of schooling’ variable reported in the ‘Human Development Report’ by UNDP (2019). Secondly,
 data on non-tariff measures is sourced from the wiiw NTM data. 10

 The results of the analysis presented below are based on the BACI dataset. This database spans a
 period of 23 years (from 1996 to 2019), includes 4706 products and contains more than 200 countries as
 both exporters and importers. The main advantage of the BACI database is that it provides reconciled
 trade flows on detailed HS 6-digit level across countries (see Gaulier and Zignago (2010) for a
 description of the process), which means that differences in the reporting of trade flows from importer or
 exporter countries have been eliminated.

 7
 We refer to this index as the ‘product riskiness index’ as it includes more components than the original ‘product fragility
 index’ suggested by KPD.
 8
 E.g. even if the Hirschmann-Herfindahl index shows a high concentration in exporting countries (on average), this may
 not apply equally to every importing country.
 9
 The BACI trade data is provided by the CEPII institute free of charge:
 http://www.cepii.fr/CEPII/en/bdd_modele/presentation.asp?id=37
 10
 The wiiw NTM data is available from https://wiiw.ac.at/wiiw-ntm-data-ds-2.html. See Ghodsi, Grübler, Reiter and
 Stehrer (2017) for a description of the data.
ASSESSING THE VULNERABILITY OF PRODUCT TRADE 17
 Research Report 454

2.2.1. Characteristics and import shares of risky products

In this section we describe some selected aspects of the risky products. Our product riskiness index
identifies 435 out of 4706 products as risky (9%). Of these, 294 risky products are intermediate products
(68%) and the remaining 141 goods are classified as final or consumption goods according to the BEC
classification.

Table 1 shows ten risky products with the highest share in world trade. The products belong mainly to the
HS-section 84 (machinery and mechanical appliances) and group 85 (electrical machinery and equipment);
all of them are intermediate products. Interestingly however, a risky final product tops the table. This
product (HS code 300490) consists of medicaments and takes the first position. The other two final goods
that are in the top ten are television receivers (852812) and other plastic articles (392690).

Table 1 / Top 10 Risky import products
Product code Share in world
 Product description
(HS1996) trade, in %

 Medicaments: consisting of mixed or unmixed products n.e.s. in heading no. 3004, for
300490 1.62
 therapeutic or prophylactic uses, packaged for retail sale

 Data processing machines: portable, digital and automatic, weighing not more than
847130 0.75
 10kg, consisting of at least a central processing unit, a keyboard and a display

 Line telephony or telegraphy apparatus: electrical, parts of the apparatus of heading no.
851790 0.49
 8517

847170 0.48 Data processing machines: storage units

 Television receivers: colour, whether or not combined, in the same housing, with radio-
852812 0.44
 broadcast receivers or sound or video recording or reproducing apparatus

 Data processing machines: input or output units, whether or not containing storage
847160 0.43
 units in the same housing

880330 0.40 Aircraft and spacecraft: parts of aeroplanes or helicopters n.e.s. in heading no. 8803

 Reception and transmission apparatus: for use with the apparatus of heading no. 8525
852990 0.38
 to 8528, excluding aerials and aerial reflectors

 Optical devices, appliances and instruments: n.e.s. in heading no. 9013 (including liquid
901380 0.33
 crystal devices)

392690 0.31 Plastics: other articles n.e.s. in Chapter 39

Source: BACI, wiiw calculation.

In Appendix Table A.1 we list the number of risky and non-risky products in each of the 96 HS 2-digit
product groups. This confirms the product specific results in Table 1. In HS group 8 (which consists of
articles of base metals, machinery and mechanical appliances, vehicles, and transport equipment) almost
30% of products are classified as risky. The share is particularly high in HS85 (Electrical machinery and
equipment and parts thereof; sound recorders) where more than 40% of the products are classified as
risky. The highest number of risky products is reported in HS group 84 (Nuclear reactors, boilers,
machinery & mechanical appliance; parts) with 147 out of 475 products (31%). This product group alone
accounts for about one third of the number of risky products. A very high share of risky products is also
found for HS group 90 (Optical, photo- and cinematographic, measuring, checking, precision instruments)
with 57 out of 128 (44%). Note that almost two thirds of the products characterised as risky are part of HS
group 8 (including the products from HS group 90 this share increases to 77%) which indicates that high-
tech products are mostly considered as being risky products.
18 ASSESSING THE VULNERABILITY OF PRODUCT TRADE
 Research Report 454

 In terms of trade values, Figure 2 shows the shares of global trade. This basically confirms the above
 results: HS section 84 (Nuclear reactors, boilers, machinery, and machinery appliances, etc.) account for
 about 25% of the traded values, followed by HS section 85 (electrical machinery, etc.), then HS section 90
 (furniture, bedding, mattress, etc.), 30 (pharmaceuticals), and 62 (apparel & clothing).

 Figure 2 / World trade in HS 2d sections by product riskiness index

 Source: BACI, wiiw calculation.

 2.2.2. Risky products in the overall import flows of Austria and the EU27

 Having defined the risky products, we then calculate the share of these in each country’s imports. In
 Figure 3 we plot the share of the value of risky products in the total value of imports for Austria, the
 EU27, and the world.

 As can be seen below, over time the share of risky products as defined by the product fragility index
 behaves similar for the three different regions. According to this, the share of risky products in world
 trade, depicted in grey, amounts to 26%, i.e. almost a quarter of the value of traded products can be
 considered as ‘risky’ according to this method. Austria shows a much higher share of risky products
 (between 31 and 35%) throughout the period. The shares for the EU27 are below the Austrian figures
 with around 30-32%. Over time, the share of risky products had been declining (it peaked in 2003) for
 the world economy until the crisis, but since then it has increased. For the EU27 and Austria this share
 was relatively stable before the crisis, but has also started to increase since then. 11

 11
 These trends can be driven either by price effects or changes in quantities which is not assessed here.
ASSESSING THE VULNERABILITY OF PRODUCT TRADE 19
 Research Report 454

Figure 3 / Development of the share of risky products in imports by region

Note: Including intra-EU trade
Source: BACI, wiiw calculation.

Figure 4 differentiates these import shares by use category, i.e. whether classified as an intermediary
product or for final use. First, one can see that the share of risky products in final goods imports at 40-
50% is higher than their share in intermediary imports with a range between 20 and 30%. Second, the
shares of final goods imports are more similar across the regions considered than intermediates imports.
These results are in line with the fact that GVC trade is more regionalised than final goods trade (see
Baldwin and Freeman, 2020b, for example).

Figure 4 / Development of the share of risky products in imports by region and use category

Note: Including intra-EU trade
Source: BACI, wiiw calculation.
20 ASSESSING THE VULNERABILITY OF PRODUCT TRADE
 Research Report 454

 Figure 5 then indicates the share of risky products in imports for the European member states in 2018.
 The shares range from 35-40% in Czechia, Hungary, Slovakia, Germany, and Austria to less than 20%
 in Cyprus and Malta. As one can see, countries with a still sizeable share of manufacturing have a
 higher share of risky imports which is due to the larger proportion of high-tech goods classified as risky.

 Figure 5 / Share of risky products in imports, 2018

 Note: Including intra-EU trade
 Source: BACI, wiiw calculation.

 In Figure 6 we contrast the share of imports with the share of risky products for every trading partner of
 Austria and the EU27 in 2018. The size of the points is proportional to the total trade flow between
 Austria (or the EU27) and the specific country in 2018. In this graph we only label countries that have
 both a higher-than-average share of imports and a higher-than-average share of risky products. In the
 panel for Austria, the obvious outlier is Germany, where almost 40% of imports are sourced. There are
 several other EU countries highlighted (Italy, Czechia, Hungary, the Netherlands, …), while the only non-
 European countries are the major economies of China, Japan, and South Korea. China occupies a
 special position as it has a respectable share of imports (3%) and a high percentage of risky products
 (45%). Relatively high shares of Austrian imports of risky products stem mostly from the UK and other
 EU member states. China has a similar special position in the EU27 panel, where it is both the country
 with the biggest share of imports (exports from China account for about 17.3% of European imports) as
 well as having the highest share of risky products (among the highlighted countries) with 48.8% of
 imports being risky products). Also, the share of risky products from the US and the United Kingdom
 (GBR) which account for about 10% of EU27 imports lies at around 27%. Figure 7 graphs this for the
 products in HS group 8. Overall, the patterns are pretty much the same which indicates again that these
 higher-tech products account for an important part of risky trade.
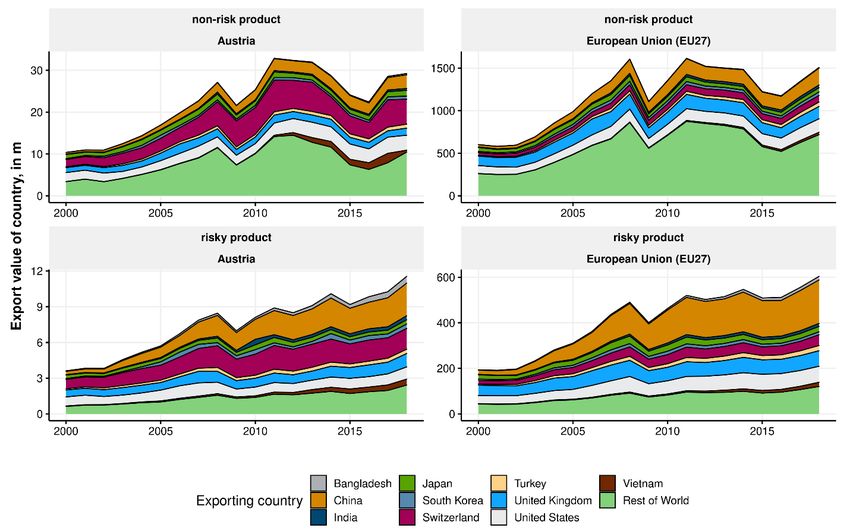
ASSESSING THE VULNERABILITY OF PRODUCT TRADE 21
 Research Report 454

Figure 6 / Share of imports versus share of risky products in the EU27 and Austria, 2018

Note: including intra-EU trade.
Source: BACI, wiiw calculation.

Figure 7 / Share of imports versus share of risky products in the EU27 and Austria for HS
group 8, 2018

Note: including intra-EU trade.
Source: BACI, wiiw calculation.
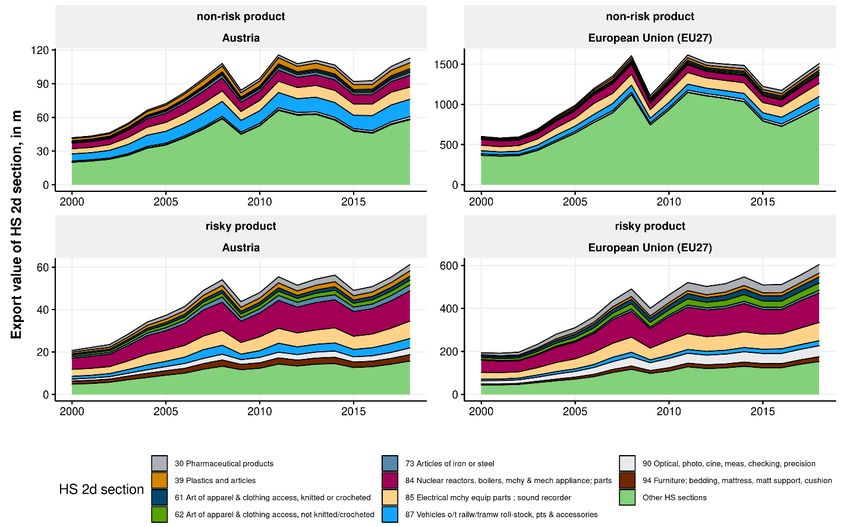
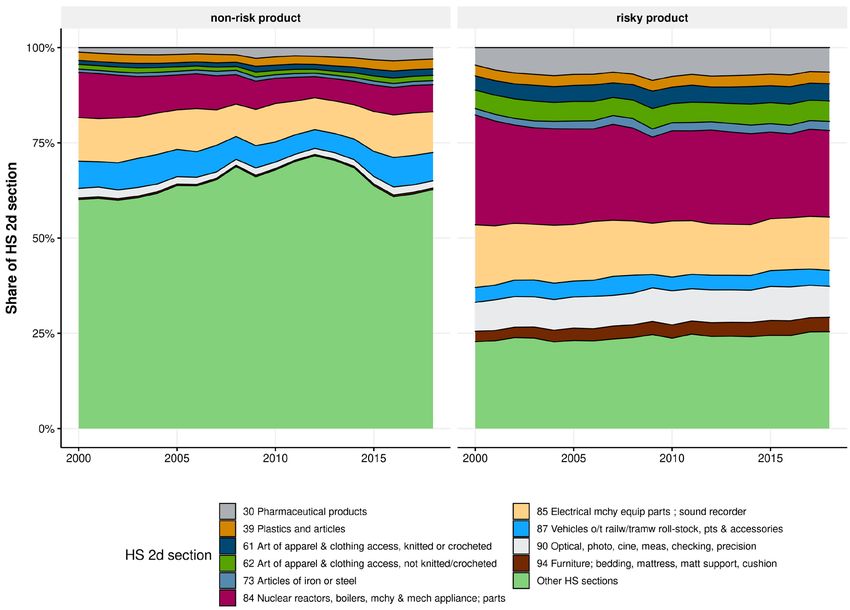
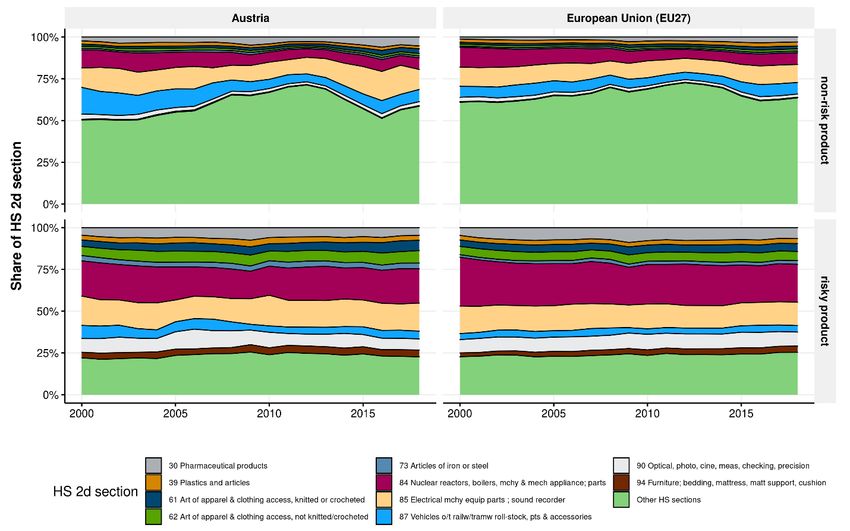
22 ASSESSING THE VULNERABILITY OF PRODUCT TRADE
 Research Report 454

 This raises the question of where these risky products are imported from and how this has developed over
 time. Figure 8 presents the volume and shares of imports of risky products and non-risky products in the
 imports of Austria and the EU27. The upper graph shows the value of imported products and the lower
 graph the respective shares by partner country. There are two important facts: First, with respect to Austria
 one can see that the imports of risky products have become more important. These have increased by a
 factor of around four, whereas non-risky products increased by a factor of around three. This dynamic has
 become much stronger since the crisis in 2009 (see also Figure 2). The pattern has been less pronounced
 for the EU27 as a whole where both product groups have increased by roughly a factor of three. Again,
 one finds that the dynamics between these two product groups differentiated after the crisis.

 The second important fact is the increasing role of China in these developments. These can be clearly
 seen in the lower part of the graph which presents the respective shares of imports by partner country.
 Whereas China’s share has of course increased in overall trade flows, this has been particularly
 pronounced for risky products. For Austria the share of imports from China in this group increased from
 around 5% in 2000 to around 20% in 2018. This dynamic was even more pronounced for the EU27. For
 the other partner countries, the shares correspondingly decreased (or remained roughly stable), though in
 terms of imported values these shares also increased. Other important regions where Austria’s or the
 EU27’s imports are coming from (apart from the Rest of world with around 25%) are the United States and
 the United Kingdom with around 10-15%, and Switzerland with about 25% for Austria, though less for the
 EU27.

 With respect to imported product groups the shares developed less dynamically, as can be seen in the
 lower part of Figures 9 and 10. These graphs show the imports of Austria and the EU27 of the ten most
 important HS sections for risky products for the global country sample. However, there are striking
 differences across product groups. Focussing on risky products one finds that product groups 84 (Electrical
 machinery and equipment and parts thereof; sound recorders and reproducers, television image and
 sound recorders and reproducers, and parts and accessories) and 85 (Railway or tramway locomotives,
 track fixtures and fittings and parts thereof, rolling-stock and parts thereof; (electro-)mechanical traffic
 signalling equipment) dominate and together account for about 50% of imported risky products, but
 account for much less for non-risky products (around 15%). HS sections 30 (Pharmaceutical products) and
 90 (Clocks and watches and parts thereof) make up another 10%. Finally, ‘Other HS sections’ account for
 about 25% of risky products but capture almost 50% of non-risky products.
ASSESSING THE VULNERABILITY OF PRODUCT TRADE 23
 Research Report 454

Figure 8 / Imports of risky and non-risky products by partner

Note: For Austria, rest of world excludes intra-EU trade.
Source: BACI, wiiw calculation.
24 ASSESSING THE VULNERABILITY OF PRODUCT TRADE
 Research Report 454

 Figure 9 / Import flows and shares by HS section (all countries)

 Note: Including intra-EU trade.
 Source: BACI, wiiw calculation.
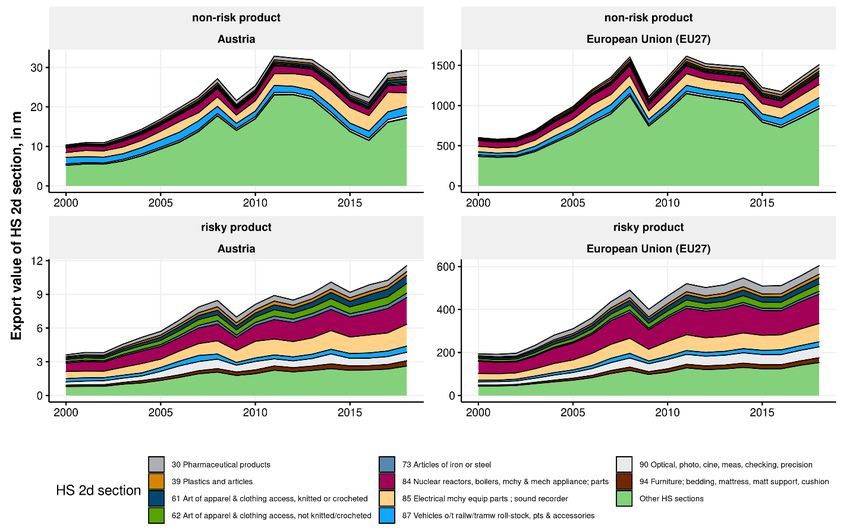
ASSESSING THE VULNERABILITY OF PRODUCT TRADE 25
 Research Report 454

Figure 10 / Import flows and shares by HS section (extra-EU27 imports)

Note: Excluding intra-EU trade.
Source: BACI, wiiw calculation.
26 ASSESSING THE VULNERABILITY OF PRODUCT TRADE
 Research Report 454

 Figure 11 combines the information and shows the imports by the most important HS sections with respect
 to risky imports and partner countries. One can see that imports in the above discussed HS sections 84
 and 85 stem mostly from China, Japan, South Korea, the United Kingdom and the United States, and HS
 section 30 (pharmaceuticals) from Switzerland and the United Kingdom. Imports of risky products from
 Vietnam and particularly Bangladesh consist mostly of products from HS sections 62 and 61.

 Figure 11 / Share of risky products in imports by exporting country, 2018

 Source: BACI, wiiw calculation.

 2.3. VALIDATION

 In this section we now provide a comparison of the results with other existing studies. Additionally, we
 analyse the impact of the pandemic crisis on trade and how this relates to the product riskiness of trade.

 2.3.1. Comparison with other results

 First, promisingly, our results are comparable to the result of KPD even though we use different data
 sources to achieve a wider coverage in terms of countries and years. For example, for the international
 substitutability component we use data on mean years of schooling from the UNDP (2019) which is
 available for more countries and more recent years, compared to the PWT9.1 data that KPD use. Also,
ASSESSING THE VULNERABILITY OF PRODUCT TRADE 27
 Research Report 454

for the underlying trade data we use the BACI HS1996 dataset since it is available for a longer period. In
addition, we employ further indicators to identify the riskiness of products.

In their work KPD classify 421 products as being risky. With our extended framework and different data
sources we find 435 risky products. Thus, in terms of the total number of products being considered as
risky our two frameworks are very similar. Furthermore, KPD present two case studies: the 2011
Japanese earthquake and subsequent nuclear catastrophe and the floods in Thailand in the same year.
For each of the two natural disasters they identify three products that were mentioned in the media as
being severely affected and then check if their methodology had identified those products as being risky.
Table 2 shows these six products (according to KPD) as well as the risk classification according to our
methodology.

Table 2 / Risk classification of selected products in 2010
 HS Code Description Risk classification
 Japanese earthquake
 840890 Combustion Engines # Other Engines risky
 853229 Electrical Capacitors # Other risky
 901380 LCDs # Other devices, appliances and instruments risky
 Thailand floods
 847170 Computers # Storage units risky
 854121 Semiconductor devices # with a dissipation rate of less than 1 W non-risky
 870421 Delivery trucks # not exceeding 5 tonnes risky

Source: KPD, wiiw calculation.

Our product fragility index identifies five out of the six products as risky, like the results in KPD. Only
certain semiconductor devices are treated as non-risky. Since our index contains additional information,
it is not surprising that our index considers fewer products as risky.

2.3.2. Comparison to COVID-19 related measures

Another aspect is the supply of critical goods to combat pandemics (which might be considered
‘essential products’). The EU Commission published a list of medical products that are needed to deal
with the COVID-19 pandemic, and which were relieved of import tariffs. 12 This list contains 103 products,
98 of which are contained in our risk/non-risk classification. 13 Table 3 states which of these 98 products
are considered as risky or non-risky given our results by the HS section.

About one third of these 98 COVID-19 related products are classified as risky. As can be seen in Table
3, the largest number of risky COVID-19 products falls into HS Section 90 (Optical, photographic,
cinematographic, measuring, checking, precision instruments) and contains products like breathing
appliances and gas masks; surgical instruments (electro-cardiographs, ultrasonic scanning apparatus)
and the like. The six products in HS Section 62 considered as risky are different types of track suits:

12
 For the publication of the EU Commission decision, see: https://ec.europa.eu/taxation_customs/sites/taxation/files/03-
 04-2020-import-duties-vat-exemptions-on-importation-covid-19.pdf. The updated list of products can be found here:
 https://ec.europa.eu/eurostat/documents/6842948/11003521/Corona+related+products+by+categories.pdf.
13
 The product list contains 103 products in CN 8-digit codes. The conversion to HS 1996 classification (which is the basis
 for our product riskiness index) reduces the number of products to 98.
28 ASSESSING THE VULNERABILITY OF PRODUCT TRADE
 Research Report 454

 hazmat suits worn by medical staff in hospitals when treating the infectious patients. Section 84 (Nuclear
 reactors, boilers, machinery & mechanical appliances; or parts thereof) contains another four risky
 products, such as sterilizers and machinery for filtering and purifying gases, but also data processing
 machines. Products from the COVID-19 list that are classified as non-risky by our methodology thus fall
 into Section 29 (Organic chemicals). One of the products in this section is pure alcohol. HS Section 39
 (Plastics and articles) contains six products that are considered non-risky: these six products are
 different types of plastic tubes.

 Table 3 / Risk classification of COVID-19 products
 Number of
 non-risky risky
 HS Section products products
 22 Beverages, spirits and vinegar 3 0
 28 Inorganic chemicals; compounds of precious metal, radioactive elements 2 0
 29 Organic chemicals 4 0
 30 Pharmaceutical products 4 1
 34 Soap, organic surface-active agents, washing preparations 3 2
 37 Photographic or cinematographic goods 2 0
 38 Miscellaneous chemical products 1 3
 39 Plastics and articles 8 3
 40 Rubber and articles 3 1
 48 Paper and paperboard; art of paper pulp 2 0
 56 Wadding, felt and nonwoven; yarns; twine, cordage 2 0
 61 Articles of apparel and clothing access, knitted or crocheted 2 0
 62 Articles of apparel and clothing access, not knitted/crocheted 6 6
 63 Other made up textile articles; sets; worn clothing 2 1
 65 Headgear and parts 2 1
 73 Articles of iron or steel 2 0
 76 Aluminium and articles 1 0
 84 Nuclear reactors, boilers, machinery and mechanical appliances; or parts thereof 3 4
 85 Electrical machinery and equipment; parts thereof; sound and television image recorder 2 1
 87 Vehicles other than railway or tramway roll-stock, parts and accessories thereof 2 0
 90 Optical, photographic, cinematographic, measuring, checking, precision instruments 9 9
 94 Furniture; bedding, mattress, matt support, cushion 1 0
 Sum 66 32

 Source: EU Commission, wiiw calculation.

 An obvious question which arises is how trade dynamics for these product groups differ and whether
 there is an indication that trade of these groups was hampered or not. 14 Table 4 gives an overview of the
 growth rates of EU27 and Austrian imports (2019-2020) differentiating between the dimensions of non-
 risky and risky products and COVID-19 related or not.

 This first shows that imports of non-COVID-19 related products fell significantly due the sharp recession
 and decline in trade flows. For these products, the declines amount to almost 10% and 8.1% for non-
 risky products and risky products respectively. For the EU27, the corresponding numbers are -11.8%
 and -7.6%. In stark contrast, imports of COVID-19 related products strongly increased and even more so

 14
 We consider here the longer run (2019-2020) and not short-term fluctuations (see Mirodout, 2020, for an assessment of
 short-term fluctuations for vital medical supplies).
ASSESSING THE VULNERABILITY OF PRODUCT TRADE 29
 Research Report 454

for the products classified as risky. Specifically, Austrian imports of non-risky COVID-19 related products
increased by 12.4%, whereas those of risky products by 13.6%. The respective numbers for the EU27
are 14.8% and 17.5%. Thus, these figures suggest that the trade system for risky products has indeed
been at least resilient (even though it might not have been robust at higher frequencies). Table 4 also
shows the imports of the EU27 separated into extra-EU27 and intra-EU27 imports. Intra-EU27 seems to
have increased less than extra-EU27, but also decreased less. Extra-EU27 imports of COVID-19 related
risky products actually soared by 30.6% in 2020 compared to 2019.

Table 4 / Growth of imports from 2019 to 2020
 non-risky risky
 products products
Austria COVID-19 related 12.4% 13.6%
 Non-COVID-19 related -9.8% -8.1%
EU27 COVID-19 related 14.8% 17.5%
 Non-COVID-19 related -11.8% -7.6%
Austria (extra-EU trade) COVID-19 related 15.6% 30.6%
 Non-COVID-19 related -15.2% -7.5%
EU27 (extra-EU trade) COVID-19 related 14.1% 9.8%
 Non-COVID-19 related -9.4% -7.6%

Source: EU Commission, EU Comext, wiiw calculation.

2.4. RISKY PRODUCTS IN INDUSTRY SUPPLY CHAINS

So far we have considered the shares of risky products in imports based on product classification.
However, for international production networks and GVCs it is also important to consider the industries
using intermediary products in their production. Analysing which sectors show a high share of risky
products in their imported intermediate inputs allows us to identify industries which are vulnerable to
supply shocks and might destabilise an economy.

2.4.1. Risky trade by using industries

Trade data do not include such information on the using industry. We therefore proxy this by combining
the trade data from BACI with the input-output data from the World Input-Output Database (WIOD) and
by using a mapping from the HS product classification to the NACE Rev. 2 industry classification. In this
way we can map the product fragility indices from all HS 6-digit products to the using industries. 15 This,
for example, tells us how much and which electronic products Austria has imported from China. Further
information from the world input-output database (WIOD) includes imports of the using industries in a
bilateral dimension (i.e. for example how many products the Austrian automotive industry imports from
the Chinese electronics industry). Assuming that the product mix of the Austrian automotive industry’s
imports is the same as the product mix of Austria’s imports as a whole (i.e., using the ‘proportionality’
assumption that has also been applied to construct multi-country SUTs, see Timmer et al. 2015), we can
calculate a risk score for every cell in the input-output table. By aggregating the share of imported risky

15
 We use the same mapping as has been used for the WIOD.
30 ASSESSING THE VULNERABILITY OF PRODUCT TRADE
 Research Report 454

 products for one using industry across all its partner countries and industries we arrive at a riskiness
 index for each industry. 16

 Figure 12 shows how the shares of risky products in Austrian imports vary by industry as well as by
 exporting region. 17 Not surprisingly given the above results, high-tech sectors, defined as industries C26
 (Manufacture of computer, electronic and optical products), C30 (Manufacture of other transport
 equipment), and C33 (Repair and installation of machinery and equipment) are characterised by a high
 proportion of risky products in their intermediate imports. Given the tight interconnection of the European
 member states, it is no surprise that the largest share of risky imports is still sourced from within the
 EU27. Furthermore, we see that - considering extra-EU trade flows - imports from non-EU countries and
 China account for a larger share of risky imports mostly in these higher tech industries which account for
 up to 10-12% in industries like C26 (Manufacture of computer, electronic and optical products) and C33
 (Repair and installation of machinery and equipment).

 Figure 12 / Austria, 2014: Share of risky imports in using industries’ imports and selected
 partner country

 Source: BACI and WIOD, wiiw calculation.

 16
 There is an important caveat worth mentioning: The import product mix of an industry is, obviously, in general not the
 same as the import product mix of the country. But there is simply no way to aggregate the product level characteristics
 to industry level without further information. Furthermore, having to use proportionality assumption means that the share
 of risky products of a specific supply industry, e.g. the Chinese electronics industry, will be the same for all Austrian
 industries.
 17
 We restrict the figure to show only agricultural, mining and manufacturing industries, as they are the main transmitter of
 shocks and the industries that are the most dependent on international trade flows. See e.g. Stehrer and Stöllinger
 (2015. p. 6ff) for a discussion of the importance of manufacturing sectors with respect to global value chain participation.
 A figure depicting the service industries can be found in the Appendix.
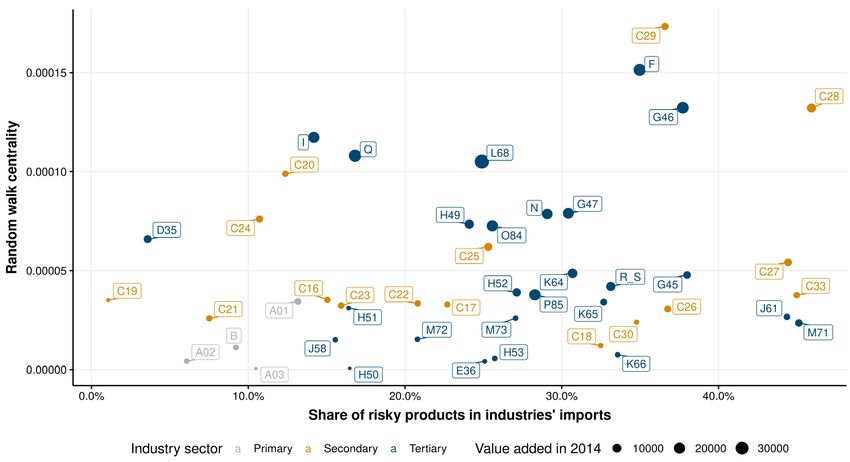
ASSESSING THE VULNERABILITY OF PRODUCT TRADE 31
 Research Report 454

2.4.2. Random walk centrality

An input-output table can also be considered as a network, where the industries are the nodes and the
trade flows are the (weighted) edges between them. Thus, we can characterise which country-industries
are strongly interconnected, have a ‘central’ position in the network or are rather ‘remote’. There are
several ways to quantify the centrality of an industry in the network and there are even centrality
measures specifically developed for economic input-output tables. Blöchl et al (2011) argue to use
random walk measures. A random walk starts on a specific node in the network and then randomly
follows an edge to another node, where it again randomly decides on an edge to take. The probability of
walking along a certain edge is dependent on the weight of the edge (i.e. in input-output tables, the
value of the respective trade flow). Blöchl et al (2011) develop two random walk measures, called
random walk centrality and random walk betweenness. Random walk centrality can be interpreted as
identifying which industries are most likely affected by and transmitting a supply shock while random
walk betweenness reveals the nodes where a shock lasts the longest.

Figure 13 / Random walk centrality and share of risky products in Austria, 2014

Source: BACI and WIOD, wiiw calculation.

Figure 13 depicts an overall positive relationship between random walk centrality and the share of risky
products in the imports of Austrian industries 18: Industries that tend to have a high share of risky
products also tend to have a high random walk centrality, i.e., are most likely to be affected by a supply
shock. This is especially the case for industries in C29 (Manufacture of motor vehicles, trailers and semi-
trailers) and C28 (Manufacture of machinery and equipment n.e.c.): as they show both a high share of
risky products in imports and a high random walk centrality they exhibit vulnerability (a high share of
risky imports) as well as elevated importance (a high random walk centrality). The corresponding figure

18
 We compute the random walk centrality over the full WIOD, thus the computed values show the relative centrality
 position of an Austrian sector within the network defined by the whole WIOD and not only within Austria.
You can also read