Horizons MARCH 2018 01 | - FROM THE EDITORIAL TEAM - HubSpot
←
→
Page content transcription
If your browser does not render page correctly, please read the page content below
Horizons
CLIPPERMARITIME

                  C O N TA I N E R   MARCH 2018

                                     01 |
                                     FROM THE EDITORIAL TEAM

                                     02 |
                                     GLOBAL OUTLOOK

                                     03 |
                                     TRADE LANE REPORTS

                                     04 |
                                     FLEET & VESSEL CASCADE

                                     05 |
                                     TRUMP –
                                     WHAT’S THE BIG DEAL?
CLIPPERMARITIME Horizons

           01

Contents
                FROM THE EDITORIAL TEAM					                                           03

           02   GLOBAL OUTLOOK			                         				                         04

           03   TRADE LANE REPORTS				                        		      		               07
                East-West
                3.1: Asia-North Europe				                                  			        08
                3.2: Asia-Mediterranean				                                 			        15
                3.3: Transpacific-Asia-West Coast North America		             		       22
                3.4: Transpacific-Asia-East Coast North America		             		       29
                3.5: Transatlantic-North Europe / Mediterranean-North America			       36
                North-South
                3.6: Asia-East Coast South America					                                42
                3.7: Asia-West Coast South America					                   		           48

           04   FLEET & VESSEL CASCADE			                    				                      55

           05   TRUMP – WHAT’S THE BIG DEAL?						 63

           06   APPENDICES & GLOSSARY				                             		               71

                                                                                                          022
INTRODUCTION                                                                                                                                  CLIPPERMARITIME Horizons

01
From the
Editorial team
After a successful launch in February 2018, the          may strike, the impact of tariffs being placed on         demand changes in key trade routes, including from
team at ClipperMaritime would like to thank the          industrial metals in the US, are all factors that are     Asia to North America, and addressing the latest
many subscribers from ports, terminal operators,         going to impact international trade – and with it, the    impact of the fleet and vessel cascade, we have
ocean carriers and the supply chain community that       readership of Horizons.                                   provided an assessment of this dynamic.
have kindly offered constructive and helpful feedback
                                                         Supply chain networks had been growing more               We have seen that trade agreements are an
and comments.
                                                         global over time, and China’s entry into the WTO          important facilitator of trade although it remains
One very interesting question received from the Port     in 2001 greatly accelerated the addition of more          necessary to consider other factors, such as the
of Montreal concerned how a free trade agreement         far-flung nodes to these networks. Now, other             level of development of a country, the state of the
can be quantified and what impact it might have          emerging economies - Vietnam and Indonesia are            international economy, commodity prices, exchange
on trade. On the back of Montreal seeing growth of       the current stars - are fueling the growth in global      rates and technological changes. Clearly, all factors
over 6% in 2017, and with January 2018 container         trade, especially since 2008. Cheap labour and            of interest to ports and shipping who help support the
handling volumes 11.7% higher than January 2017,         access to raw materials have made these economies         container supply chain globally
the future impact of CETA is an important factor as      competitive, but it is the growth in global consumption
                                                                                                                   If, like the Port of Montreal, there is a topic of interest
the port continues to develop its facilities.            that provides the pull maintaining the momentum.
                                                                                                                   impacting our industry that you feel would benefit the
With CETA provisionally effective from September         So, what is the impact of a free trade agreement or       growing and diverse readership of our publication,
2017, this is already an important and valid question.   a tariff on products and on the container shipping        please let us know. We welcome your thoughts at
Indeed, the threat to NAFTA, the fall-out from           industry? Well, in addition to us providing a monthly     horizons@clippermaritime.com and look forward to
BREXIT and its replacement by other deals the UK         global outlook for the industry and outlining supply-     hearing from you.

                                                                                                                                                                                 03
CLIPPERMARITIME Horizons

02

      Global
     Outlook

                                     4
GLOBAL OUTLOOK                                                                                                                                                  CLIPPERMARITIME Horizons

Supply overview                                                     THE Alliance 13%.

                                                              Demand overview
•   In late 2017, an estimated 1.6 million TEU was due                                                                                      Mexican volumes have been factored into our
    to be delivered in 2018, but approximately 300,000                                                                                      Asia to WCSA trade analysis which brings
    TEU of this total has been delayed into 2019 as           •     For the seven trade lanes reviewed in this report,                      indicative head-haul load factors up to 60%.
    carriers fear the impact of overcapacity.                       total loaded import and export TEU increased by
                                                                    9% YoY in January 2018.                                           •     Our demand forecasts for 2018 point to
•   New services have been launched (or are about                                                                                           continued growth. The two Asia to European
    to be) in key East-West trade lanes by HMM, SM            •     For the head-haul trades covered in this report,                        trades lie between the 2-4% range with Asia
    Lines and APL. We believe these are primarily for               exports out of Asia grew by 8% YoY with South East                      to ECNA growth potentially reaching double-
    individual company strategic reasons.                           Asian exports showing the fastest growth of 14%.                        digits for a second year. Risks remain later in
                                                              •     European import flows were surprisingly quite weak                      the year if the East Coast port contracts are
•   Two new Asia to WCSA services will be launched in
                                                                    in January, down 1% YoY – in stark contrast to the                      not successfully concluded and we will monitor
    2Q18 due to the regulatory re-structuring required
                                                                    16% growth in volumes into North America. This                          trade flows carefully. The two trades from Asia
    by Maersk Line’s acquisition of Hamburg Sud.
                                                                    transpacific growth was driven by a 28% YoY surge                       into Latin America have recovered well in 2017,
•   Largest vessel Maersk Line Hangzhou 15,282 TEU                  in flows to the US East Coast and highlights the                        but previous years of weakness must be put into
    deployed on 2M’s pendulum service covering Asia                 strength of the pre-Chinese New Year cargo surge                        context. We are forecasting growth of 7-8% for
    to North Europe and WCNA, but service will now be               on this lane compared to the European trades.                           these routes in 2018.
    de-coupled keeping smaller 13,500 TEU units in the
    transpacific trade.                                       •     Indicative load factors on the head-haul trades are
                                                                    higher than in November 2017 and in our last report
•   New orders are being focused on 11,000 TEU                      due to the spike prior to Chinese factory shutdowns.
    vessels and some are appearing in the Latin
    American trades – these may now be replacing
    smaller 8,000 TEU units which in turn will need re-
    deploying in other trade lanes. A risk for shipowners
                                                              TRADE LANE STATUS - JANUARY 2018
    and other trades.                                                  Trade                No.               Monthly           Monthly           Indicative    Base Demand     Ocean Carrier
                                                                       Lane               Operators           Demand            Nominal            Nominal      Forecast 2018    Short-Term
•   Our latest assessment of the cascade highlights                                                            (TEU)          Supply (TEU)       Monthly Load                     Outlook
                                                                                                                                                  Factor (%)
    that four Asia to North Europe strings will start to be
    upgraded with another 14 ships of at least 18,000                Asia-ECSA                12              135,324            122,292             100%           7.0%
    TEU in 2018, pushing out smaller 13-14,000 TEU
                                                                      Asia-Med                13              543,550            632,546                 86%        3.5%
    vessels into the Asia-Mediterranean, transpacific
                                                                  Asia-North Europe           12              920,201           1,173,842                78%        2.5%
    and Asia to Mid-East trades. Despite pushing some
    ships into 2019 delivery, the Ocean Alliance is most             Asia-ECNA                14              638,162            693,413                 92%       10.0%
    affected by the orderbook and will have the largest              Asia-WCNA                18             1,079,981          1,318,478                82%        4.0%
    impact at the trade route and service level.                     Asia-WCSA                15              190,560            319,719                 60%        8.0%
•   An estimated 90% (by capacity) of ships over                    Transatlantic
                                                                                              16              402,695            648,579                 62%        6.0%
    10,000 TEU in the current orderbook are for the               (ECNA & WCNA)
    three major alliances. Ocean Alliance has the             Load factors are indicative only based on nominal supply and do not account for wayport,
    largest share (56%), followed by 2M (23%) and             out of scope or deadweight adjustments.

                                                                                                                                                                                                05
GLOBAL OUTLOOK                                                                                                                                              CLIPPERMARITIME Horizons

Key takeaways                                                 REGIONAL SUMMARY LOADED TEU (IMPORT/EXPORT),
                                                              JANUARY 2018/2017
•   New service launches are mainly driven by individual
    strategies and trade route re-structuring and the
    remaining primary global operators are unlikely to
    launch new strings in any key lane right now.
•   The transpacific contracting season is imminent and
    cargo owners will be signing new agreements from
    May / June. From our cascade model, we see more
    capacity entering the two key lanes this year and
    into 2019. Together with increasing US intermodal
    costs and current spot market conditions, we believe
    these will help dampen the prospect of significant
    rate increases for shippers.
•   For the short-term, our trade lane indicators remain
    quite positive judged on the existing supply/demand
    balance. The two transpacific, trans-Atlantic and Asia
    to ECSA lanes are green with strong recent demand
    growth in evidence. However, the transpacific lanes
    are certainly at risk from both additional capacity and
    geo-political factors (US protectionism).
                                                              SUPPLY AND DEMAND OVERVIEW - MONTHLY TEU
                                                              JANUARY 2018
•   The two primary Asia to Europe trades are not in
    serious danger, but newbuild deliveries will continue
    to be deployed in these routes throughout 2018
    which will add pressure. The second cascade will
    push larger vessels into the Mediterranean. The
    fundamentals on the Asia to WCSA trade remain
    strong for now, but capacity will be increased in the
    immediate future and this will change the dynamics
    for the worse.
•   Our analysis of the impact of some Free Trade
    deals that have been signed on overall trade flows
    provides a mixed view on the relative success before
    and after the deals were signed.
                                                                 Actual supply (Bar)              Supply forecast (Bar)                 High demand forecast
                                                                 Actual demand                    Trend demand forecast                 Low demand forecast

                                                              Data refers to trade lanes analysed in this report-basis nominal TEU capacity and loaded TEU demand

                                                                                                                                                                                       06
CLIPPERMARITIME Horizons

03

     Trade Lane
        Reports

                                        7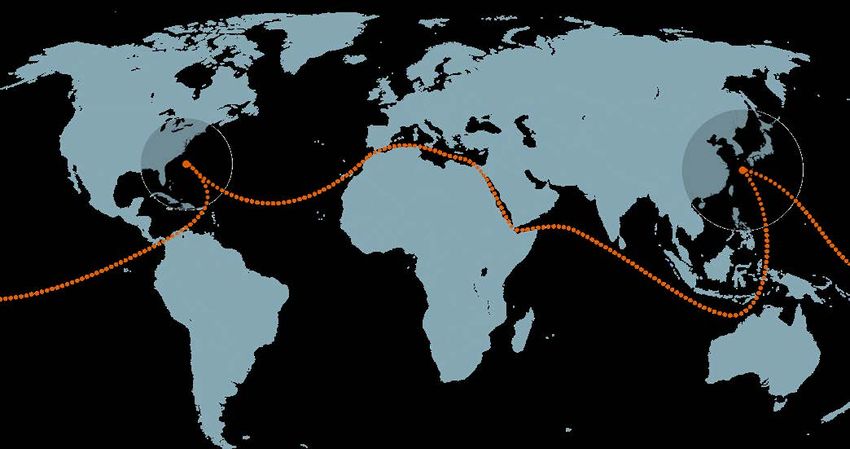
TRADE LANE REPORTS                                                  CLIPPERMARITIME Horizons

Asia–North Europe
Ocean carriers have minimised spot freight rate erosion,
but capacity increases are expected.
                                                                    S U P P LY

                                                                                  ROLLING
                                                           MOM %
                                                                                 12 MONTH
                                                           CHANGE
                                                                                 % CHANGE
                                                           +13%                  +15%
                                                                    DEMAND

                                                                                  ROLLING
                                                           MOM %
                                                                                 12 MONTH
                                                           CHANGE
                                                                                 % CHANGE
                                                           -4%                   +7%
                                                             OCEAN CARRIER
                                                           SHORT-TERM OUTLOOK

                                                                                               08
TRADE LANE REPORTS                                                                                                                               CLIPPERMARITIME Horizons
ASIA–NORTH EUROPE

Supply/demand balance and forecast
Alliances preparing for Q2                             Section 4 Fleet & Vessel Cascade outlines that
                                                       around 400,000 TEU in total is due to be delivered
                                                                                                                        •   Weekly nominal capacity to rise by 10%, with anot-
                                                                                                                            her five ships in the series due by the end of 2018.
network changes – demand after                         from the orderbook during 2Q18, which includes
                                                                                                                        Cosco
                                                       another eight ships of 20,000 TEU – all of these
Chinese New Year will be crucial.                      units will head into this trade.                                 •   A 20,000 TEU and 19,000 TEU ship will replace two
                                                                                                                            13,386 TEU vessels in the Alliance’s FAL2 service
In March 2018, the head-haul nominal monthly           The seven ships of this size delivered up until the
                                                                                                                            in early April 2018.
capacity between Asia and North Europe was 1.2         end of February did not cause freight rates to crash
million TEU compared to 1.1 million TEU recorded       as carriers voided a number of vessels during                    •   Increased weekly nominal capacity estimated to be
for March 2017. With Chinese New Year falling later    Chinese New Year.                                                    over 17% compared to Q3 2017.
in mid-February 2018, ocean carriers did not void                                                                       The head-haul Asia to North Europe trade performed
                                                       Current vessel upgrades will up the pressure in the
sailings until well into February.                                                                                      well in 2017, although container flows in 2018 started
                                                       trade lane. This view is further reinforced by Ocean
The anticipated disruption likely to be caused by      Alliance activities:                                             rather weakly:
newbuild deliveries is yet to be factored into liner                                                                    •   January 2018 recorded 920,000 TEU, compared to
                                                       Evergreen
operating dynamics.                                                                                                         953,000 TEU for January 2017 – a decline of 3.5%
                                                       •   The first 2 x 20,000+ TEU ships to be phased
                                                                                                                            and surprising given that Chinese New Year fell in
                                                           into Ocean Alliance FAL7 service in April and
                                                                                                                            mid-February.
                                                           June, respectively - a further nine units due in
                                                           2018 and seven in 2019.                                      •   Volumes in January 2018 were stronger than
   Demand outlook and 2018 forecast                                                                                         December 2017 – up by 2.0%. This is in line with
                                                                                                                            the usual pre-CNY cargo surge.
   Total volumes on the head-haul trade
   reached just over 10 million TEU in 2017, a         ASIA-NORTH EUROPE SUPPLY/DEMAND BALANCE AND FORECAST
   4.1% rise on 2016. Our statistical analysis
   of the last five years suggests a trendline
   for this year of minus 1.9% which is skewed
   by the recent weak figures for December
   and January. Our 80% confidence interval                                                                                                                 Actual supply (Bar)
   suggests a range of between minus 9%                                                                                                                     Actual demand
   and plus 5.6%, but our latest assessment                                                                                                                 Supply forecast (Bar)

   remains that growth will lie within the 2%                                                                                                               Trend demand forecast

   to 3% range. Ocean carriers are trying                                                                                                                   High demand forecast

   to manage supply/demand balance by                                                                                                                       Low demand forecast

   delaying the delivery of a number of ULCVS
   till 2019.
                                                       NOTE: TEU volumes and percentage changes refer to 12 month period Feb 2017 to Jan 2018

                                                                                                                                                                                    09
TRADE LANE REPORTS                                                                                                                             CLIPPERMARITIME Horizons
ASIA–NORTH EUROPE

Supply/demand                                              Supply
balance and                                                Little change in March 2018,                               •   Hamburg is also on the North Europe schedule.

forecast (cont.)
                                                                                                                      •   Colombo to be utilised – to maximise regional
                                                           although “independent” HMM                                     transhipment opportunities.
                                                           service confirmed.                                         While the obvious conclusion here is that the
The lead-in to the Chinese New Year was strong with                                                                   vessels are too small, HMM will not experience the
most major lines experiencing full ships (load-factors                                                                economies of scale enjoyed by its competitors. The
                                                           The early months of 2018 have seen little change in        plan is regarded as a little optimistic, but an objective
of over 95% were recorded), with reports of small          terms of vessel deployment:
pools of cargo rolling over in Asia to the next sailing.                                                              assessment will note the following:
This has helped to fill vessels and push up load           •   Largest ship size in March 2018 is 21,413 TEU –        •   With the demise of Hanjin in 2016, the presence
factors in early March after the Chinese holiday period        same as in January/February 2018                           of a strong and reliable South Korean shipping
finished and has helped keep spot freight rate erosion     •   Average ship size for March 2018 of 14,730 is a            line with global coverage for shippers is very
to a minimum.                                                  minimal increase on the position at start of year          important at both a strategic and political level.
Last year finished weak, with the SCFI reporting               (of 14,696 TEU).                                       •   The new weekly AEX service is an opportunity
head-haul spot rates at $864 per TEU, against $1,200       •   Number of ships in service has risen marginally            for HMM to assess the viability of a longer-term
at the end of 2016. Ocean carriers have had some               – from 199 in January/February 2018 to 201 for             return to the key Asia to North Europe market as a
success improving rates in Q1 2018:                            March 2018.                                                vessel deployer, rather than a mere slot charterer,
•   January 2018 four-week average at $896 per TEU                                                                        with the objective of providing BCO shippers
                                                           New HMM vessel deployment was verified on this
    – a 3.6% rise over year end 2017.                                                                                     better assurances that it has the ability to cater for
                                                           key trade route in March 2018 (via PR News), with
                                                                                                                          their shipping requirements.
•   February 2018 four-week average at $912 per            the following reported:
    TEU – a 1.8% increase over the January 2018                                                                       •   The ships to be deployed are small enough that
                                                           •   AEX string to be launched in April 2018 –
    average.                                                                                                              they will not impact the short-term spot freight
                                                               an independent service offered outside the
                                                                                                                          rate market, While slot costs for HMM will be
However, any pick-up immediately after the Chinese             agreement with 2M Alliance.
                                                                                                                          expensive, ships are likely to be chartered at low
holidays was not reflected in improved spot freight        •   Loop to be operated with 10 x 4,600 TEU ships              daily rates of well under $10,000.
levels which by mid-March fell to $741 per TEU,                (owned and chartered vessels).
the lowest recorded in 2018 so far. Ocean carriers                                                                    •   HMM does not need to aggressively under-bid
are seeking GRIs from April (CMA CGM’s FAK rate            •   First sailing leaves Busan on 9 April – ship size of       competitors since it is already an existing operator
of $900 per TEU is an example), but this will be               4,728 TEU.                                                 in many major trades and will secure some former
challenging to achieve due to newbuild deliveries                                                                         Hanjin business quite naturally – although not at
                                                           •   First inbound port is Rotterdam (World Gateway)
and the revamped Alliance networks becoming                                                                               the rate it did in 2017.
                                                               on 9 May, last outbound call from Felixstowe on
operational. Rising bunker costs are adding to the             15 May, 2018.
squeeze for ocean carriers, which are struggling to
ensure that fuel costs are factored into the rates.

                                                                                                                                                                                   10
TRADE LANE REPORTS CLIPPERMARITIME Horizons
ASIA–NORTH EUROPE
Supply
MONTHLY STANDING SLOT NOMINAL CAPACITY (MILLION TEU), OPERATOR SHARES AND MAJOR TRADE LANE SUPPLY DETAILS
APR 17 MAY 17 JUN 17 JUL 17 AUG 17 SEP 17 OCT 17 NOV 17 DEC 17 JAN 18 FEB 18 MAR 18
Maersk Line
MSC
Hapag-Lloyd
Cosco
CMA CGM
Average TEU 15,010 14,971 14,989 14,833 14,828 14,783 14,585 14,926 14,450 14,778 14,216 14,230
Max TEU 21,100 21,100 21,100 21,100 21,100 21,413 21,413 21,413 21,413 21,413 21,413 21,413
# deployed vsls 187 193 194 195 201 203 199 199 199 202 199 201
# services 17 18 18 19 19 19 18 18 18 18 18 18
• The new service will also help prepare HMM for • Present eight vessels to be increased to nine – • AE2/Swan – average weekly capacity of 18,900
future expansion plans. The company is poised although smaller units of 5,000 TEU to remain in TEU
to order a series of 20,000 TEU ships from South service.
• AE6/TP6/Lion/Pearl – average weekly capacity
Korean yards for 2020 delivery, but it certainly will
Despite the cessation of the Thailand origin call, the 13,500 TEU.
not be able to fill these ships by itself. After the
continuation of the service indicates that the operator,
current deal with the 2M lines expires in 2020,
CMA CGM, remains confident that targeting the
HMM will become more attractive as a potential
South East Asian market with smaller vessels and
partner of THE Alliance member lines.
a fast transit into North Europe remains a robust
It was reported in the February edition of Horizons strategy. However, a weak rolling 12 month volume
that the SEANES service operated by CMA CGM growth out of Thailand remains a warning for the
was using small ships and some changes were ocean carrier.
anticipated.
The number of void sailings in early 2018 was spread
The Ocean Alliance has now confirmed the following: amongst all Alliances - 2M (3 services), Ocean (4
services) and THE Alliance (3 services).
• New port rotation – Laem Chabang and Tangier
Med dropped, but Yantian, Le Havre, Algeciras However, in late February only the following had
and Beirut added. been reported for week 9 by 2M Alliance:
11TRADE LANE REPORTS CLIPPERMARITIME Horizons
ASIA–NORTH EUROPE
Demand
Germany and UK volumes flat, In 2018 the UK economy is expected to slow as public
spending cuts and uncertainty over BREXIT continue,
In 2017 the port saw total box volumes rise by 24%
to 1.6 million TEU, supported by the introduction of
but Poland to see good growth, although inflation remains on track to fall to the Bank of the new T2 facility.
England’s 2% target.
again. The port is actively seeking to increase its share of
Yet, volume demand is likely to stay flat, as seen by non-transhipment traffic, and the country’s economic
China continues to represent the major source of the February 2017 to January 2018 trade from China position in 2018 should assist this process.
loaded imports into North Europe for the period falling by 0.6% (to 1.65 million loaded TEU).
Current EC forecasts predict that 2017’s 4.7% GDP
February 2017 to January 2018, and is considerably
Similar trends were noted for Germany over the same growth in 2017 will be about matched this year with
larger than all other origins combined:
period: 4.2% expected due to good domestic demand and
• China - 7.3 million TEU in total, but by sub-region: public investment fully recovered from the decline of
• Loaded containers from Asia were down 2% to 1.8
2016.
• PRC East – 3.9 million TEU, up by 6% million TEU
The ability of DCT Gdansk to continue to receive
• PRC South – 1.9 million TEU, down by 2.5% • China to Germany cargo flows declined 1% to 1.3
some of the largest container ships in service
million TEU.
• PRC North – 1.5 million TEU, a rise of 5% remains a crucial factor of the port’s competitiveness.
However, the European Commission (EC) is predicting
• South Korea – 524,000 TEU, a rise of 8%
that the German economy will see slightly faster GDP
• Vietnam - 498,000 TEU, an increase of 5% at 2.3% in 2018 (up on the 2.2% in 2017), driven by
strong private consumption, higher investment and
For the leading destinations in North Europe from
growing foreign demand.
Asia, UK growth remained flat, while the East Europe
region continues to see higher growth, consistent Yet, one of the country’s leading container ports,
with the position reported in the February edition of Hamburg, continues to struggle with draught
Horizons, as the following number show: restrictions due to dredging issues, and trade flow for
the Baltic and Russia is drifting away, primarily to DCT
• UK – 2.2 million TEU – negligible growth
Gdansk in Poland.
• Netherlands – 1.7 million TEU – up by 3%
Loaded container demand for Poland did increase by
• France – 677,000 TEU – rise of 10% 16% to 666,000 TEU in the February 2017 to January
• Poland – 666,000 TEU – strongest increase, 2018 period, which is primarily due to the successful
with 16% growth of DCT Gdansk( helped by two direct calls from
2M and Ocean Alliance lines).
• Russia – 564,000 TEU – improvement of 10%
12TRADE LANE REPORTS CLIPPERMARITIME Horizons
ASIA–NORTH EUROPE
Demand
TOP ROUTES BY VOLUME, TOP ORIGIN COUNTRIES,
GROWING / DECLINING ROUTES TOP DESTINATION COUNTRIES
TOP ROUTES BY VOLUME TOP ORIGIN COUNTRIES BY VOLUME
TEU %YoY TEU %YoY
China to United Kingdom 1,653K -0.6% PRC East 3,941K 5.9%
China to Netherlands 1,270K 4.0% PRC South 1,922K -2.5%
China to Germany 1,341K -0.9% PRC North 1,407K 4.8%
China to France 540K 12.8% Vietnam 498K 4.8%
China to Poland 520K 16.4% South Korea 522K 7.1%
China to Belgium 517K -0.3% Thailand 316K -0.9%
China to Russia 317K 3.2% Malaysia 232K 12.3%
China to Sweden 231K 4.9% Indonesia 249K -0.4%
China to Denmark 173K 9.1% Japan 264K -6.5%
Vietnam to Germany 106K -4.1% Taiwan 206K -10.4%
TOP GROWTH ROUTES TOP DESTINATION COUNTIRES BY VOLUME
TEU %YoY TEU %YoY
China to Lithuania 59K 22.4% United Kingdom 2,164K 0.1%
South Korea to United Kingdom 49K 22.0% Netherlands 1,742K 2.7%
South Korea to Russia 106K 20.9% Germany NWC 1,836K -2.1%
China to Poland 447K 16.4% Belgium 805K 0.9%
China to France 479K 12.8% France NWC 677K 9.8%
Poland 666K 15.5%
ROUTES IN DECLINE Russia 564K 9.9%
TEU %YoY Sweden 310K 5.8%
Indonesia to Germany 55K -4.5% Denmark 221K 8.4%
Vietnam to Germany 106K -4.1% Finland 139K 2.1%
Thailand to Netherlands 67K -3.1%
China to Norway 88K -3.1%
China to Germany
13
1,341K -0.9%
TEU volumes and percentage changes refer to 12 month period Feb 2017 to Jan 2018TRADE LANE REPORTS CLIPPERMARITIME Horizons
ASIA–NORTH EUROPE
Cascade
• We anticipate operators upgrading several services to c.20k TEU
over the course of 2018: these include 2M’s Condor, and the NEW BUILD / EXISTING FLEET BREAKDOWN OPERATOR SHARE TODAY
Ocean Alliance’s FAL1, FAL2 and FAL7. This is emphasised by (STANDING SLOTS TEU)
CMA CGM as it deploys the newly delivered CMA CGM Antoine
de Saint Exupery to its flagship service with two similarly sized
units due to follow within the year.
• String upgrades are also impacted by the specific geographies of
their rotations. In last month’s edition of Horizons, we highlighted
the differing growth rates of volumes between Northern, Central,
and Southern China (slower growth in the North): the Ocean
Alliance’s FAL3 which serves this northern region and currently
operating with an average of c.13k TEU, is therefore less likely
to receive the 20k ULCVS in the orderbook than routes calling CASCADE BY VESSEL VOLUMES
further south.
• Similarly, THE Alliance has two weekly services (FE1 and FE5) OPERATOR SHARE MARCH 2021
focused on the relatively small Japanese and South East Asian (STANDING SLOTS TEU)
markets. Despite its member lines’ 14,000 TEU newbuild orders,
they will not necessarily move straight into these services without
significant port call restructuring.
• These South East Asian trades are potentially at risk from the
imminent influx of capacity from new build deliveries to the North
Asia routes creating empty headhaul slots. With bunker costs
increasing the value of consolidating the moves currently served
by dedicated South East Asia – North European destinations
is increased. The only factor offsetting these benefits is the CASCADE BY OPERATOR
time-sensitivity of goods as adding calls to the main North
Asia – North Europe strings would inevitably add two to three
days to headhaul voyage durations. We will be monitoring the
supply:demand balance closely over the coming months to
provide further comment on this in due course.
• Directly resulting from new build activity, we see Maersk Line’s
market share cut to 19% and Evergreen entering the top 5
operators in terms of TEU deployed thanks to 16 deliveries
between now and 2021.
14TRADE LANE REPORTS CLIPPERMARITIME Horizons
Asia–Mediterranean
Cargo growth will be needed as trade prepares for
new Alliance networks and upgraded vessels.
S U P P LY
ROLLING
MOM %
12 MONTH
CHANGE
% CHANGE
+4% +5%
DEMAND
ROLLING
MOM %
12 MONTH
CHANGE
% CHANGE
+3% +7%
OCEAN CARRIER
SHORT-TERM OUTLOOK
15TRADE LANE REPORTS CLIPPERMARITIME Horizons
ASIA–MEDITERRANEAN
Supply/demand balance and forecast
Spot freight rates continue to For 2018, the key anticipated developments will focus
on the following, both of which represent potential
• The indicative trade lane load factor of 86% for
January 2018 was robust moving into the Chinese
trend below Asia to North Europe pressures on the supply-demand balance and spot New Year factory shutdown period
freight rates:
levels – but gap is narrowing. The trade route entered 2018 with SCFI head-haul
• Direct vessel deployment from revised Alliance spot rates at $738 per TEU. The following trends were
Head-haul liner capacity in the Asia-Mediterranean services evident:
trades has remained fairly flat for now, but we
• The continued threat posed by the cascade. • January 2018 four-week average of $758 per
anticipate this changing later in the year, and the trade
TEU.
receives larger vessels via the cascade. Based on the most up-to-date information available,
head-haul loaded container demand started positively • February 2018 four-week average of $794 per
• Total monthly nominal head-haul capacity in
in 2018: TEU.
March 2018 was 637,000 TEU – by comparison
March 2018 stood at 615,00 TEU • January 2018 demand was 544,000 TEU, up by These spot rates were higher than the $738 per TEU
2% on the 532,000 TEU for December 2017 and at the end of 2017, but were still around 20% lower
• The number of operational weekly services has
by 4% over the January 2017 total of 524,000 than a year ago. By mid-March, there was further
also remained constant, at 13.
TEU. erosion of rates to $665 per TEU as volumes had not
• Largest vessels in service have increased, but picked up after the factory shutdowns.
only marginally, from 16,652 TEU in March 2017
to the current 16,810 TEU (2M upgrading its Jade
service).
Demand outlook and 2018 forecast
ASIA-MEDITERRANEAN SUPPLY/DEMAND BALANCE AND FORECAST
Total volumes on the headhaul trade reached
5.87 TEU in 2017, a strong 5.3% uplift on
2016. Our statistical analysis of the last five
years suggests a trendline for this year of Actual supply (Bar)
2.8% with our 80% confidence interval giving Actual demand
a range of between minus 6% and plus Supply forecast (Bar)
11%. Our view is that demand growth in the Trend demand forecast
range of 3-4% can still be expected and the High demand forecast
momentum for the largest sub-trades into Low demand forecast
the Western Mediterranean and also Turkey
remain positive.
NOTE: TEU volumes and percentage changes refer to 12 month period Feb 2017 to Jan 2018
16TRADE LANE REPORTS CLIPPERMARITIME Horizons
ASIA–MEDITERRANEAN
Supply/demand Supply
balance and Ocean carriers preparing • Other major providers of slots in March 2018 are
forecast (cont.)
CMA CGM (0.14 million TEU), Yang Ming (0.13
to introduce new Alliance million TEU) and Cosco (0.12 million TEU).
networks - trade remains at • In addition, Hapag Lloyd, Evergreen, Zim, K
Line and NYK Line are also active, but did not
The trend of spot rates being noticeably below risk from cascade. introduce any capacity adjustments in Q1 as
they wait for changes in Q2 when new Alliance
those in the much larger Asia to North Europe trade
have been in evidence since mid-2017 and there structures become operational.
are no immediate signs this will change moving into The Asia-Mediterranean trades continue to be split
into several sub-regions and liner networks build As identified in the February edition of Horizons,
Q2 2018. But the gap has narrowed a little mainly both THE Alliance and Ocean Alliance will amend
because North Europe rates have fallen faster during services around calls to both the West Mediterranean
and East Mediterranean (which includes the Adriatic their service in April 2018, although specific vessel
the Chinese New Year holiday. deployment details remain scarce:
and Back Sea areas) separately.
• Start of January 2018 difference - $150 per TEU • THE Alliance will offer three services, all
There is also a heavy use of transhipment in both
• Start of March 2018 difference - $106 per TEU sub-regions, and this enables operators to utilise commencing in the first week of April:
As 2018 progresses, gateway ports in the Central larger vessels making fewer calls and then onward • MD1 – links China and South Korea,
Mediterranean in particular, will continue to target feedering. However, the desire for direct calls also via Singapore, with West Mediterranean
cargo destined for Central European hinterlands. This remains, especially at ports that are able to offer (including Tangier-Med) ports of Barcelona
ocean carrier strategy is vital if upgraded ships are to good import-export cargo demand, such as at and Valencia, plus inbound/outbound calls
be filled on this route. Valencia (Spain), or Piraeus (Greece). at Damietta. Pusan, Hong Kong and Tangier
In terms of how the trade is developing on an Med are new calls.
individual liner basis, key conclusions from Q1 2018 • MD2 - from China and South Korea,
include: via Singapore, to Central and East
• MSC remains the biggest provider of TEU slots, Mediterranean, with calls at Piraeus, Genoa,
with 0.45 million in March 2018, showing a slight La Spezia and Fos. Here Qingdao, Shekou,
increase on its offering in January/February 2018. Fos and inbound/outbound calls at Piraeus
are new calls.
• Maersk Line’s total monthly slots are 0.20 million
TEU in March 2018, although this is a very small • MD3 – is focused on the East Mediterranean,
rise on the 0.19 million TEU for January/February with South Korea and China, via Singapore
2018. Collectively, 2M has a dominant share on and stops at Jeddah, then calling to Ashdod,
the route and deploys the largest vessels Ambarli, Izmit, Izmir and Mersin. Shekou and
Izmit represent new port calls.
17TRADE LANE REPORTS CLIPPERMARITIME Horizons
ASIA–MEDITERRANEAN
Supply
MONTHLY STANDING SLOT NOMINAL CAPACITY (MILLION TEU), OPERATOR SHARES AND MAJOR TRADE LANE SUPPLY DETAILS
APR 17 MAY 17 JUN 17 JUL 17 AUG 17 SEP 17 OCT 17 NOV 17 DEC 17 JAN 18 FEB 18 MAR 18
MSC
Maersk Line
Cosco
CMA CGM
Yang Ming
Average TEU 10,369 10,493 10,669 10,519 10,629 10,914 10,658 10,499 10,900 10,540 10,112 10,548
Max TEU 16,652 16,652 16,652 16,652 16,652 16,652 16,652 16,652 16,652 16,810 16,810 16,810
# deployed vsls 134 141 140 139 139 140 140 140 140 140 140 140
# services 13 13 13 13 13 13 13 13 13 13 13 13
As the new service patterns are introduced, and the • Tangier- Med recorded a 12% increase in While the selection of ports of calls could change,
potential for further vessel upgrading is guaranteed 2017 total volumes, to around 3.3 million TEU, liner investment in facilities (whether directly or
via the cascade, successful ports will be those supported by both Maersk Line and CMA CGM through sister companies, such as APM Terminals
facilities (in all sub-regions) that can accommodate who together offer nine weekly services (across a / Maersk Line both part of the AP Moller Group) will
larger ships through a combination of water depths range of trade routes). play a significant role in dictating rotations and cargo
and infrastructure. Terminal ownership remains an flows. This will not change, irrespective of vessel
The terminals are able to cater for the largest
influencing factor too. For example: deployment or service upgrades.
ships in (and entering) service.
• Cosco subsidiary, PCT, operates container
• Other examples include CMA CGM
terminals at Piraeus, so in Q1 the line has been
concentrating its Central Mediterranean hub port
making regular calls with six different services in
focus at Marsaxlokk, MSC developing Asyaport
which it operates vessels. The port can receive
in Turkey and Maersk Line supporting East Port
ships of 20,000 TEU.
Said at the Eastern Mediterranean entrance to the
Suez Canal.
18TRADE LANE REPORTS CLIPPERMARITIME Horizons
ASIA–MEDITERRANEAN
Demand
Asian demand growth continuing • Spain volumes were 821,000 TEU, up by 4%, with
China continuing to provide a dominant 78%.
– locations in all sub-regions • Mediterranean French ports handled 343,000
benefitting. TEU, a rise of 5% - China is, once again,
dominant as it represented 76% over the period.
Chinese loaded container demand in the February
The European Commission expects Italy’s GDP
2017 to January 2018 period grew, while activity from
growth in 2017 of 1.5% to be matched in 2018, and
both South Korea and Vietnam also increased:
stated that the economy will become more self-
• Total demand from China reached 4.1 million sustaining, if somewhat limited in growth potential.
TEU, comprising: The fragile banking system remains a concern too.
• PRC East – 2.2 million TEU, up 6% The country’s ports will hope that key initiatives,
such as Contship Italia Group’s efforts to extend
• PRC South – 1.1 million TEU, marginal
hinterlands into Central Europe, southern Germany
increase of 1%
and locations such as Switzerland continue to gain
• PRC North – 849,000 TEU, a rise of 2% momentum.
• South Korea – 569,000 TEU, up by 5% For Turkey’s economy, the OECD is projecting a drop
• Vietnam – ships less than other countries at on the 7% GDP growth gained in 2017, but only to
194,000 TEU, but this up by 13% around 5%. In 2017, the government injected more
funds into the economy, and exports recovered, but
In terms of leading country destinations for Asian business and consumer confidence continue to lag in
loaded container demand, the market in the 2018.
Mediterranean is highly established, but will remain
split amongst West, Central and East sub-regions: The country’s ports compete with others in the
region, but for the highly competitive transhipment
• Italy is the largest market – 1.01 million TEU market, using larger ships, the ability to offer import-
(+2.8%) in the February 2017 to January 2018 export demand will remain crucial.
period, of which China accounted for 73% and
demand growth of 4.1%.
• Turkey is the second largest destination – 878,000
TEU (+7.2%) over the same period, which means
the volume growth has picked up favourably in Q4
2017 and into 2018. Chinese share is 54%, with
South Korea seeing higher growth of 12.6% to
132,000 TEU.
19TRADE LANE REPORTS CLIPPERMARITIME Horizons
ASIA–MEDITERRANEAN
Demand
TOP ROUTES BY VOLUME, GROWING / DECLINING ROUTES TOP ORIGIN COUNTRIES, TOP DESTINATION COUNTRIES
TOP ROUTES BY VOLUME TOP ORIGIN COUNTRIES BY VOLUME
TEU %YoY TEU %YoY
China to Italy 736K 4.1% PRC East 2,187K 5.6%
China to Spain 639K 4.8% PRC South 1,088K 0.5%
China to Turkey 474K 2.1% PRC North 849K 2.2%
China to France 259K 3.8% South Korea 569K 5.4%
China to Israel 261K -6.9% Vietnam 194K 12.9%
China to Algeria 226K -16.6% Thailand 209K 4.0%
China to Ukraine 188K 17.3% Malaysia 148K 10.9%
China to Slovenia 179K 15.6% Indonesia 152K 4.5%
China to Egypt 158K -11.6% Japan 152K -2.2%
China to Greece 164K 7.3% Taiwan 119K -3.9%
TOP GROWTH ROUTES TOP DESTINATION COUNTRIES BY VOLUME
TEU %YoY TEU %YoY
Malaysia to Turkey 44K 18.5% Italy 1,010K 3.8%
China to Romania 91K 18.0% Turkey 878K 7.2%
China to Ukraine 160K 17.3% Spain MED 821K 3.7%
Thailand to Turkey 43K 16.2% France MED 343K 4.9%
China to Slovenia 155K 15.6% Israel 336K -6.1%
Slovenia 322K 8.0%
ROUTES IN DECLINE Algeria 289K -8.5%
TEU %YoY Egypt MED 264K -13.2%
China to Algeria 226K -16.6% Ukraine 214K 17.8%
China to Egypt 158K -11.6% Greece 201K 6.2%
China to Israel 261K -6.9%
South Korea to Slovenia 97K -4.2%
South Korea to Spain 53K -3.9%
20
TEU volumes and percentage changes refer to 12 month period Feb 2017 to Jan 2018TRADE LANE REPORTS CLIPPERMARITIME Horizons
ASIA–MEDITERRANEAN
Cascade
• The Asia – Mediterranean trade lane is impacted by both new build
deployment and secondary vessel redeployment when the largest OPERATOR SHARE TODAY OPERATOR SHARE MARCH 2021
new build vessels are allocated to Asia – North Europe services. By (STANDING SLOTS TEU) (STANDING SLOTS TEU)
2021, our analysis shows 34 vessel upgrades split evenly between
these deployment categories.
• All three major Alliances are actively varying their deployments,
specifically we envisage:
• 2M Alliance upgrading its Tiger service from c.13k TEU to 15.5k
TEU; and
• Ocean Alliance upgrading its MEX1 service from 11k TEU to 13.5k
TEU; and
• THE Alliance upgrading its MD1 service from 9k TEU to 14k TEU.
• Maersk Line is likely to strengthen its position as the second largest
operator in TEU capacity terms, increasing market capitalisation
from 13 to 19 percent, with MSC making the fewest upgrades (2x
redeployments of the MSC Venice and MSC London in the fourth
quarter of 2019 and no new build activity) resulting in a seven percent
loss of market share. However, as an alliance, 2M retains a dominant
position in this trade lane.
NEW BUILD / EXISTING FLEET BREAKDOWN CASCADE BY VESSEL VOLUMES CASCADE BY OPERATOR
21TRADE LANE REPORTS CLIPPERMARITIME Horizons
Asia–West Coast North America
Alliance stability expected, 2018 demand started strongly –
but vessel capacity upgrades expected.
S U P P LY
ROLLING
MOM %
12 MONTH
CHANGE
% CHANGE
+7% +4%
DEMAND
ROLLING
MOM %
12 MONTH
CHANGE
% CHANGE
+7% +7%
OCEAN CARRIER
SHORT-TERM OUTLOOK
22TRADE LANE REPORTS CLIPPERMARITIME Horizons
ASIA–WEST COAST NORTH AMERICA
Supply/demand balance and forecast
Retailers replenishing stocks In early March 2018 the full impact of the Chinese
factory closures was strongly felt, and carriers must
• January 2018 total of almost 1.17 million TEU was
9% higher than December 2017 figure of 1.06
aiding short-term demand growth. be bracing for falling spot rates, especially following million TEU and 7% stronger than the 1.09 million
an increase in average ship sizes in 2017. The TEU for January 2017.
The start of a new year represents a time for anticipated cascade of vessels from current Asia-
• Indicative load factors were an estimated 85% in
replenishing of stock and inventories following the North Europe trades is expected as newbuilds from
January 2018, an increase on the December 2017
holiday season and Chinese New Year periods. the orderbook enter service, even allowing for some
ratio, but down on the 88% recorded for the same
Invariably this is followed by a drop-off in some delays from 2018 to 2019.
month in 2017 – reflecting the vessel cascade
demand into North America. This has clearly assisted
Despite the ongoing shift of container traffic from the process that occurred during 2017.
spot freight rates in head-haul Asia to WCNA routes,
West Coast to the East Coast in recent years, the
along with pre-Chinese New Year volumes and load In the February edition of Horizons, it was noted that
situation now looks to be reaching a ‘new normal’
factors (as reported in the February 2018 edition of head-haul spot freight rates started 2018 strongly,
with the West Coast now stabilising at 50% (of total
Horizons). with the $1,523 per FEU, a strong uplift on the
port handling volumes based on port statistics) for
$1,100 per FEU of the previous six weeks.
2015, 2016 and 2017 and the 1% gain (to 7%) by the
Demand outlook and 2018 forecast US Gulf Coast coming from East Coast ports (now at Indeed, compared to 2016, average weekly 2017
43% for both 2016 and 2017). rates were 20% higher, and the position remained
Total volumes on the headhaul trade positive, as the monthly averages from SCFI
reached 11.6 million TEU in 2017 (+5.6% Using our most recent (to January 2018) data, the
confirmed:
YoY) and the second successive year of following trends of head-haul loaded units can be
5% growth. Our statistical analysis of the identified:
last five years suggests a trendline for this
year of 3.5% with our 80% confidence
ASIA-WEST COAST NORTH AMERICA SUPPLY/DEMAND BALANCE AND FORECAST
interval giving a range of between -4% and
11%. Our view is that positive momentum
will continue in 2018, and annual growth
will lie within the 3-5% range. Geo-political
tension between China and the US could Actual supply (Bar)
impact trade flows, but it is too early to Actual demand
assess the severity of such a disruption. Supply forecast (Bar)
Should the negotiation of a new contract for Trend demand forecast
longshoremen on the US East Coast break High demand forecast
down in late September, this could trigger Low demand forecast
a temporary shift of cargo by shippers from
the East to West Coast.
NOTE: TEU volumes and percentage changes refer to 12 month period Feb 2017 to Jan 2018
23TRADE LANE REPORTS CLIPPERMARITIME Horizons
ASIA–WEST COAST NORTH AMERICA
Supply/demand Supply
balance and Further service upgrades on 6 x 4,253 TEU deployed and means a 50%
forecast (cont.)
increase in capacity. Dalian and Oakland have
transpacific WCNA routes as been dropped in favour of new calls in Prince
Rupert and Tacoma, with Los Angeles maintained
niche operator joins. in the rotation.
• January 2018 four-week average - $1,468 per • South Korea’s SM Line confirmed the launch of its
FEU. Some of the major operators in the transpacific new transpacific PNS service from mid-May 2018
WCNA trades continue to re-vamp and alter service using relatively small ships of 6 x 4,000 TEU –
• February 2018 four-week average - $1,484 per schedules, while a new entrant is also joining the 4,600 TEU. Vancouver (BC) and Seattle represent
FEU. route: the WCNA port calls, with Yantian, Ningbo,
As expected, some erosion has taken place leading Shanghai, Tokyo, Busan and Gwangyang filling
• Ocean Alliance is increasing capacity on the
into March after the Chinese New Year holiday the rotation. The operator is strategically targeting
Evergreen-operated PSW8 service, with 8,500
season, with the mid-March spot rates declining to the Pacific North West rather than the crowded
TEU ships replacing existing vessels of 7,000
$1,016, a 50% drop since the start of the year and southern California gateways of Los Angeles/Long
TEU in April and May 2018. Consequently, during
the lowest recorded weekly rate since June 2016. Beach.
Q2 2018 weekly capacity is set to rise by around
Given the strong overall cargo volume growth, this 10.5%. • HMM’s ‘premium’ services were launched in May
dynamic must be worrying for ocean carriers since 2017, PS1, PS2 and PN2, and the ocean carrier
at the moment they are heading for the dark days of • Ocean Alliance’s current PSW8 vessels will
is looking to increase its market share for the
mid-2016 when rates were stuck firmly below $1,000 switch to the PNW3 service led by Evergreen
future. The largest ships currently utilised are
per FEU. which currently uses 5,400 TEU units. Due for
6,800 TEU units - relatively small for the WCNA
completion in mid-June 2018, the change will
The annual contracting season could prove route now. Upgrading could be achieved via larger
see nominal weekly capacity in the PNW3 string
challenging for shipping lines if service changes bring ships from the charter market.
increase by almost 19%.
too much additional capacity, especially as there • APL launched a new service linking Asia, USWC
will be a need to factor in rises in fuel costs in 2018. • THE Alliance is adding 25% more weekly capacity
and Alaska. Named the Eagle Express (EEX), it
However, further positive demand growth is projected to its PS4 service during March and April 2018 by
will commence in July 2018 and offer a weekly
in this trade route for 2018. replacing the existing Yang Ming ships of 6,500
connection between the key Chinese ports of
TEU with vessels of 8,200 TEU – 8,600 TEU
Ningbo, Shanghai with Los Angeles and Dutch
capacity. The move will see an average weekly
Harbour with Yokohama and Busan. Outside
capacity of 8,300 TEU, an increase of 26% over
of the Alliance network it is focusing on US
the previous position, with Los Angeles and
Government cargo inbound to the US with the
Oakland still the two West Coast ports of call.
Dutch Harbour call handling reefer exports back
• The Alliance is launching a newly restructured to Asia. Small ships of around 2,000 TEU nominal
service, dubbed PS8, using Yang Ming’s ‘M’ Class capacity will be used, reflecting the specialist and
of 6,588 TEU vessels – these replace the existing niche nature of the routes and cargo linked.
24TRADE LANE REPORTS CLIPPERMARITIME Horizons
ASIA–WEST COAST NORTH AMERICA
Supply
MONTHLY STANDING SLOT NOMINAL CAPACITY (MILLION TEU), OPERATOR SHARES AND MAJOR TRADE LANE SUPPLY DETAILS
APR 17 MAY 17 JUN 17 JUL 17 AUG 17 SEP 17 OCT 17 NOV 17 DEC 17 JAN 18 FEB 18 MAR 18
Maersk Line
Cosco
CMA CGM
MOL
MSC
Average TEU 7,358 7,466 7,649 7,605 7,615 7,710 7,877 7,932 7,966 8,089 7,691 7,971
Max TEU 14,000 14,000 14,000 14,000 14,000 14,000 14,000 14,000 14,000 14,568 14,000 15,282
# deployed vsls 272 273 283 283 283 283 283 284 283 284 283 286
# services 36 35 36 36 36 36 38 38 39 39 39 39
As reported in the February edition of Horizons, the • The largest ship upgrades occurred in 2017, • Maersk Line monthly standing slot capacity
largest contributor to additional supply remains the with the March 2017 figure of 13,568 TEU rising unchanged compared to one year earlier at 0.38
ongoing industry cascade, and this trend is expected to 14,000 TEU in April 2017, where it largely million TEU.
to continue. remained until March 2018. Maersk Line re-
• MSC has increased the March 2017 slots of 0.08
deployed the 15,282 TEU Maersk Line Hanoi to
In terms of the overall impact of the ongoing operator million TEU to 0.17 million TEU in March 2018,
the AE6/TP6 ttranspacific/Asia from the North
developments, the March 2018 position is: driven by vessel upgrades.
Europe pendulum loop, representing a major
• Total monthly nominal capacity of 1.23 million upgrade from the current 13,500 TEU vessels. • APL has been another major provider of additional
TEU in January 2018, a 7% increase on the In April 2018 the TP6 will be de-coupled into an slots, its 0.21 million TEU in March 2018
January 2017 position and an indication why spot end-to-end transpacific service deploying these compares with just 0.08 million TEU for March
freight rates have fallen since the beginning of the smaller vessels. 2017, reflective of network changes following
year CMA CGM’s acquisition (CMA CGM’s TEU slots
• The major transpacific WCNA operators remain
have fallen over the past 12 months). CMA CGM
• Average ship size reached 7,791 TEU in March unchanged now that the Alliance membership
and APL are now sister companies and so the
2018, 3% higher than one year earlier, when it process is resolved, and actual scheduled
combined share of the two carriers should be
stood at 7,586 TEU. services have been published and begin to
considered when reviewing trade shares.
adopt new formations. This will continue from Q2
2018, as the following dynamics at the end of Q1
represent the current position:
25TRADE LANE REPORTS CLIPPERMARITIME Horizons
ASIA–WEST COAST NORTH AMERICA
Demand
China demand to WCNA Volumes from Thailand are growing rapidly (+14%),
but are less than half those out of Vietnam in total.
dominates – volumes at major Direct port coverage from Laem Chabang is also
strong, and should these trends continue, operators
Southern Californian gateways have a sound case to upgrade vessels on current
continue to grow. South East Asian loops. Direct services are a distinct
advantage for shippers.
For the February 2017 to January 2018 period, China This robust growth is reflected in the loaded box
remained the dominant origin of containerised goods volumes handled by the largest container ports on
shipped to the WCNA area, with 6.8 million TEU (a the Western seaboard. During the same February
rise of 7.4%). By contrast, volumes to Canada fell 2017 to January 2018 period, the following trends
by 0.5% (1.39 million TEU) – a disappointment for include:
the port of Vancouver. To put this dominance into
perspective, the next largest country-to-country pairs • Los Angeles – 4.3 million TEU, up 3%
over this same period were: • Long Beach – 3.3 million TEU, a rise of 8%
• Vietnam to US – 661,000 TEU, up by a strong • Vancouver – 1.3 million TEU, down 4%
20%
• Tacoma – 724,000 TEU, down 17%
• China to Mexico – 581,000 TEU, a rise of 9%
• Oakland – 665,000 TEU, an increase of 5%
• Taiwan to US – 430,000, an improvement of 5%
• Prince Rupert – 597,000 TEU, up 4%
The break-neck pace of demand growth from
Vietnam was reported in the February edition of • Seattle – 485,000 TEU, a strong improvement of
Horizons. The bilateral trade agreement in place is 23%
clearly influencing products being shipped to the US
and Canada, and the 19.7% growth that has occurred
over the past 12 months is expected to continue,
especially as revamped WCNA transpacific services
by the 2M Alliance, Ocean Alliance and THE Alliance
all schedule calls to Cai Mep port (Ho Chi Minh City) .
26TRADE LANE REPORTS CLIPPERMARITIME Horizons
ASIA–WEST COAST NORTH AMERICA
Demand
TOP ROUTES BY VOLUME, GROWING / DECLINING ROUTES TOP ORIGIN PORTS, TOP DESTINATION PORTS
TOP ROUTES BY VOLUME TOP ORIGIN PORTS BY VOLUME
TEU %YoY TEU %YoY
China to USA 6,781K 7.4% Yantian 2,249K 7.9%
China to Canada 1,386K -0.5% Shanghai 2,233K 4.1%
Vietnam to USA 661K 19.7% Ningbo 1,062K 10.4%
Taiwan to USA 430K 5.1% Qingdao 730K 6.7%
South Korea to USA 405K -3.7% Xiamen 486K 13.0%
Japan to USA 492K 5.9% Busan 525K 1.5%
Thailand to USA 325K 13.7% Ho Chi Minh 403K 14.0%
Hong Kong to USA 208K -3.7% Xingang 415K 9.4%
Indonesia to USA 195K 0.2% Other China 373K -29.9%
Malaysia to USA 153K 1.3% Laem Chabang & Bangkok 349K 12.0%
TOP GROWTH ROUTES TOP DESTINATION PORTS BY VOLUME
TEU %YoY TEU %YoY
Vietnam to USA 553K 19.7% Los Angeles 4,268K 2.5%
Thailand to USA 286K 13.7% Long Beach 3,284K 8.0%
China to USA 6,313K 7.4% Fraser Port & Vancouver 1,285K -3.8%
Taiwan to Canada 76K 6.9% Oakland & San Francisco 665K 4.5%
Japan to USA 464K 5.9% Tacoma 724K -17.1%
Seattle 485K 23.2%
ROUTES IN DECLINE Prince Rupert 597K 3.6%
TEU %YoY
Japan to Canada 55K -9.4%
South Korea to USA 405K -3.7%
Hong Kong to USA 208K -3.7%
Philippines to USA 88K -2.8%
China to Canada 1,386K -0.5% TEU volumes and percentage changes refer to 12 month period Feb 2017 to Jan 2018
27TRADE LANE REPORTS CLIPPERMARITIME Horizons
ASIA–WEST COAST NORTH AMERICA
Cascade
• The Asia – West Coast North America trade sees the largest influx
of redeployed vessels resulting from our predicted cascade. A OPERATOR SHARE TODAY OPERATOR SHARE MARCH 2021
key driving force behind this is the downstream impact of Ocean (STANDING SLOTS TEU) (STANDING SLOTS TEU)
Alliance’s expansion through new build vessel deliveries due in 2021.
This is most keenly felt with 23 of Evergreen’s vessels reallocated
here by the beginning of 2021.
• We also view this trade as the likely destination for 15 new build
vessels on order:
• 3x PIL New Panamaxes due in the third quarter of 2018;
• 3x NYK ULCVs (14k TEU), one due imminently with two further
deliveries in mid 2020;
• 3x Cosco New Panamaxes (13.5k TEU) due mid 2019; and
• 6x Evergreen Post Panamaxes (11k TEU) due at the beginning of
2021.
• The net impact of these changes gives Evergreen a 14% market
share by capacity in 2021, while Maersk Line remain the largest
operator with a 15% share in 2021, down 2% from its current position.
NEW BUILD / EXISTING FLEET BREAKDOWN CASCADE BY VESSEL VOLUMES CASCADE BY OPERATOR
28TRADE LANE REPORTS CLIPPERMARITIME Horizons
Asia–East Coast North America
(via Panama Canal and Suez Canal)
Pre-Chinese New Year volumes strong, but freight rates S U P P LY
declined in March despite the positive demand.
ROLLING
MOM %
12 MONTH
CHANGE
% CHANGE
+29% +15%
DEMAND
ROLLING
MOM %
12 MONTH
CHANGE
% CHANGE
+32% +7%
OCEAN CARRIER
SHORT-TERM OUTLOOK
29TRADE LANE REPORTS CLIPPERMARITIME Horizons
ASIA–EAST COAST NORTH AMERICA
Supply/demand balance and forecast
East Coast ports looking for • Monthly nominal capacity in March 2018 was
691,000 TEU, unchanged from February
Bridge in New York/New Jersey and the results
of the Savannah Harbour Expansion Project
continued strong trade demand • The number of weekly services offered has not
(SHEP) at Savannah.
in 2018. remains at 20 in 2018 The enlarged Panama Canal has allowed operators
to re-deploy much larger vessels on the Panama
• The route is mostly served by the same fleet in
The Panama and Suez canal routes are key options All-Water routing, but these increases will not
2018 so far, but this fleet now represent a 15%
for Asian cargo destined for the East Coast of North continue indefinitely. Improving water depths and port
capacity increase compared to a year ago:
America, but also as an alternative to the transpacific infrastructure on the North American East Coast is a
West Coast for the hinterlands of Chicago, the Ohio • Average ship size in March 2018 is 7,984 distinct positive, but vessels beyond 14,000 TEU-class
Valley, Memphis and Atlanta. TEU, marginally higher than the February are highly unlikely unless services via the Suez Canal
2018 figure of 7,775 TEU – but significantly are re-structured and upgraded.
A summary of the competitive supply position in early
above the March 2017 figure of 6,928 TEU.
2018 leads to the following conclusions: Using the most up-to-date information available,
• The largest ship in service in 2018 has head-haul loaded container demand in the Asia-ECNA
remained at 14,414, which represents a major trades reflected a surprisingly strong cargo spike in
Demand outlook and 2018 forecast increase in size and operator strategy on the the two-month lead up to the Chinese New Year:
10,700 TEU recorded for March 2017.
Total volumes on the head-haul trade reached • January 2018 totals were 638,000 TEU, which
5.8 TEU in 2017, a very robust 11.4% rise on • The largest ship size reflects the step-change compares with 564,000 TEU for December 2017
2016. Not only does this highlight the strength of in infrastructure projects at key ports, such and 484,000 TEU for January 2017. An upturn in
the trade, particularly for volumes out of China, as the raising of the air draft of the Bayonne volumes is usual prior to the Chinese New Year
but it also reflects a shift in the trade away from
the West Coast. Lower spot freight rates will also
be attracting shippers. Our statistical analysis
ASIA-EAST COAST NORTH AMERICA SUPPLY/DEMAND BALANCE AND FORECAST
of the last five years suggests a trendline for
this year of 14.7% with our 80% confidence
interval giving a range between 6% and 23%.
Our view is that demand growth will continue to
Actual supply (Bar)
be strong this year and could reach double-digits
Actual demand
for a second year. The most serious threat to
Supply forecast (Bar)
this growth forecast is a trade war between the
Trend demand forecast
US and China. One other risk remains the re-
negotiation of new labour contract between the High demand forecast
International Longshoremens’ Association (ILA) Low demand forecast
and the United States Maritime Alliance (USMX),
which is to be renewed at the end of September.
NOTE: TEU volumes and percentage changes refer to 12 month period Feb 2017 to Jan 2018
30TRADE LANE REPORTS CLIPPERMARITIME Horizons
ASIA–EAST COAST NORTH AMERICA
Supply/demand Supply
balance and Influx of larger ships now One development in the US East Coast is the
forecast (cont.)
continued expansion of HMM’s direct involvement
being seen at ports – but in trades between Asia and North America, with the
following occurring by the end of May 2018:
more to come from April 2018. • Deployment of two of its own vessels (8,566 TEU
period, but these are higher monthly aggregate size) on Zim’s Seven Star Express service.
totals than in the normal peak season period The trend of successively larger ships calling at ECNA • HMM has been a slot charterer since May 2016.
running from June to October. The January 2018 ports was a feature of the trade from Asia in 2017, but
totals are preliminary figures from CTS. It remains the same level of increase is not expected for 2018, • This further outlines HMM’s desire to increase its
to be seen if these trends continue into 2018, and as the biggest ships on All-Water trades shows: direct operating involvement in activity from Asia,
if there has been a genuine shift of Chinese cargo to supplement Transpacific to North America West
• March 2017 – 10,700 TEU Coast developments.
to the East Coast.
• April 2017 – 13,208 TEU • HMM is about to confirm a newbuilding order
• The January 2018 indicative load factors were
an estimated 82%, consistent with the 81% in • August 2017 – 14,414 TEU – still the largest in involving 12 x 22,000 TEU ships and 8 x 13,000
December 2017, but lower than the 90% for service in March 2018 and not expected to change. TEU units, all due by 2022. While the larger
January 2017 – reflecting the increased supply of vessels are for Asia-North Europe, the carrier’s
To put the March 2018 positions into context, the
TEU slots during 2017. 13,000 TEU ships could be in the Asia-North
leading operators based on monthly TEU standing slot
America trade, but at this stage it is too early to
The positive start for 2018 was reflected in SCFI capacity are:
say which coast.
head-haul spot rates, which averaged $2,647 • Maersk Line (2M)– 0.33 million TEU
per FEU in January 2018 and $2,773 per FEU in At the same time, Boston is going to be the recipient
February 2018. However, by mid-March, rates had • MSC (2M) – 0.32 million TEU of a call from the Ocean Alliance (CMA CGM, Cosco,
fallen significantly to $2,009 per FEU, the lowest APL, Evergreen, OOCL) from the start of April 2018
• Cosco (Ocean) – 0.25 million TEU
since late 2017. This is partly driven by the fall-off as part of its service restructuring. This Alliance has
in cargo volume after the Chinese holiday. Another • Evergreen (Ocean Alliance) – 0.14 million TEU previously called at the port with its AWE 2 service
factor seems to be aggressive carrier pricing to that also linked to the WCNA.
• Zim– 0.14 million TEU
protect market share. In the lead-up to the annual The new call is on the established Vespucci/AWE1/
It is notable that 2M has a relatively large capacity
contracting period with BCOs, ocean carriers will AW4/NUE/ECC2 and is deploying 10 x 8,500 TEU -
share in this route as opposed to the much larger
not want further spot rate erosion. The general 9,000 TEU units (Evergreen x 7, CMA CGM x 2 and
WCNA trade and that Zim as an independent has
market consensus is that contract rates will stay OOCL x 1). Boston will be called after Savannah
clearly focused its strategy on serving East Coast
steady relative to 2017, and this also remains and Charleston, but before New York/New Jersey,
destinations rather than West Coast.
our view as ocean carriers jostle to retain clients. so although it will not benefit from the likely larger
Shippers are also very pre-occupied with rising inland exchanges of a first inbound or last outbound call,
costs, bunker costs, lack of trucking capacity and sufficient local demand is warranted to offer a weekly
demurrage/free-time issues. connection.
31You can also read