CFA Institute Research Challenge - Hosted by - Asia-Pacific Research ...
←
→
Page content transcription
If your browser does not render page correctly, please read the page content below
CFA Institute Research Challenge
 Hosted by
 CFA Society Sydney
 Abercrombie & Co

The CFA Institute Research Challenge is a global competition that tests the equity research and valuation,
investment report writing, and presentation skills of university students. The following report was submitted by a
team of university students as part of this annual educational initiative and should not be considered a
professional report.

Disclosures:
Ownership and material conflicts of interest
The author(s), or a member of their household, of this report holds a financial interest in the securities of this company.
The author(s), or a member of their household, of this report knows of the existence of any conflicts of interest that might bias the content or
publication of this report. The conflict of interest is that one of the authors, or a member of their household, of this report holds stock in the
company.
Receipt of compensation
Compensation of the author(s) of this report is not based on investment banking revenue.
Position as an officer or a director
The author(s), or a member of their household, does not serve as an officer, director, or advisory board member of the subject company.
Market making
The author(s) does not act as a market maker in the subject company’s securities.
Disclaimer
The information set forth herein has been obtained or derived from sources generally available to the public and believed by the author(s) to be
reliable, but the author(s) does not make any representation or warranty, express or implied, as to its accuracy or completeness. The
information is not intended to be used as the basis of any investment decisions by any person or entity. This information does not constitute
investment advice, nor is it an offer or a solicitation of an offer to buy or sell any security. This report should not be considered to be a
recommendation by any individual affiliated with CFA Society Sydney, CFA Institute, or the CFA Institute Research Challenge with regard to this
company’s stock.
Abercrombie & Company
 Abercrombie Has the Golden Child Telecommunications Operators
 Australia | Australian Securities Exchange (ASX)
 & Company Lost Its Shine?
 Company: Telstra (“TLS”)

 Date: 19-Sep-2018 Closing Price: AU$3.21 Sell (-20.2% Total Return)
 Ticker: TLS-ASX Target Price: $2.67
 Executive Summary
 TLS-AU Overview
 We initiate coverage on Telstra (TLS-ASX) with a SELL recommendation based on a 12-month price
 Target Price [A$] 2.67 target of $2.67, representing a -20.2% downside from the last close of $3.21 on 18 September 2018.
 Last Closing
 Telstra’s (TLS-ASX) substantial competitive moat as the nation’s wholesaler has been eroded via the
 [A$] 3.21 introduction of the National Broadband Network (NBN). The reduction in barriers to resell broadband
 18/09/18
 opened the competitive landscape for nimbler players to enter and grow market share. TLS is hanging
 Market Cap [A$m] 38,140 its hat on its ability to generate long-term value from the 5G rollout and recoup losses incurred due to
 Shares Out m 11,878.9 fierce competition in the mobile and NBN space. But this bet is not likely to yield sizeable returns amidst
 a hypercompetitive environment. Without this growth potential, other strategies like Telstra2022 cost cuts
 52 Wk High [A$] 3.79 to improve margins will not sufficiently compensate for low mobile and NBN returns to drive up EPS.
 52 Wk Low [A$] 2.60 1. Rising Mobile Competition | Prepare for the Game of Phones
 Table 1: Price History (Rebased) With 44% of TLS’s revenue derived from its mobile segment and the less attractive economic profile of
 ASX200 - Rebased TLS
 NBN, increased reliance is placed on their ability to capture market share in the mobile space.
 i) Tightening Competitive Landscape: The market believes the proposed merger of TPG (TPM)
$8 and Vodafone (VHA) will lessen competition and concentrate the industry. Our analysis
 suggests that the merged entity will have the bundling benefits and intent to be a stronger
 challenger to TLS and will be able to compete for more than their 20% mobile market share.
$6
 The resulting competitive pricing in the mobile space could erode Average Revenue Per User
 (ARPU) and increase subscriber churn for the incumbent, triggering an earnings downgrade.
$4 ii) Customer Flight: Reduced customer satisfaction from recent network outages has left TLS
 near all-time low Net Promoter Scores (NPS). This lays the foundation for customer flight in the
 run up to the NBN’s churn event, which could see TLS struggle to retain mobile market share.
$2
 2. All in on 5G | Hold the Door for Rivals to Enter 5G
 2013 2014 2015 2016 2017 2018
 Source: Abercrombie & Co Analysis Historically, the rollout of new mobile networks (e.g. 3G and 4G) marked TLS’s opportunity to boost
 mobile margins by commanding increased ARPUs as the first-mover of the superior network. This
 Graph 2: Returns Analysis expectation will not be met for the upcoming 5G rollout in a hyper competitive market as the telcos, Optus
 8% and a potential TPM-VHA, will be as ready as TLS for 5G.
 WACC: 6.6%
 iii) Optus and TPM ready to go: TLS’s historically high mobile ARPU will subdue to 1% growth at
 6% the commercial launch of 5G. Optus is committed to launch alongside TLS with sufficient
 spectrum and 5G trials, and the TPM-VHA merger could guarantee maximum spectrum since
 4% without the merger, the individual entities were limited by their debt capacities.
 iv) Differentiation is King: The upcoming 5G release and NBN migration underscores a major
 2% churn event. We believe TLS will lose 4% market share, as they struggle against Optus’ product
 differentiation (content-driven strategy) and TPM-VHA’s cost differentiation (product bundling).
 0%
 16 17 18 19 20 21 22 23 3. Commoditised NBN | Winter is Still Coming
 ROIC ROE The NBN rollout has triggered the migration of TLS copper customers to the new network. However, we
 Source: Abercrombie & Co Analysis expect more earnings pressure as competitors improve the quality of connections. Combating these rivals
 may compromise cost cuts that TLS relies upon to stave off a significant dividend reduction.
 TLS-AU Key Financial Data FY18 i) Incumbent’s Curse: Despite competition pushing down ARPU, TLS has always at least
 D/E 46.8% maintained their network quality advantage. New changes to the Connectivity Virtual Circuit
 (CVC) cost that telcos must pay to support bandwidth speeds will finally catalyse unprecedented
 Net Debt/Equity 1.6x quality convergence between competitors. The $2.5bn cost savings program is also unlikely to
 Dividend Yield 7.1% yield EBITDA relief amidst an unreliable record and accelerating cost of sales.
 ii) Indebted to the Dividend: TLS has always been viewed as a high dividend yield firm for an
 EV/EBITDA1 5.4x
 enormous retail investor base. But earnings headwinds from NBN, mobile and capex needs
 P/E(LTM) 10.6x mean a major dividend cut is imminent to retain an A credit rating.

 (1) EV/EBITDA (exc. NBN one-offs 6.3x)
 Financial Analysis

 FY18A FY19E FY20 2021 2022 2023 CAGR
 Revenue [A$m] 26,904.0 25,462.3 25,237.1 25,457.3 26,242.2 27,217.9 0.2%
 EBITDA [A$m] 9,656.0 9,372.1 9,264.0 9,319.4 9,580.5 9,909.5 0.4%
 EBITDA Margin [%] 0.4 36.8% 36.7% 36.6% 36.5% 36.4% 0.2%
 EBITDA Growth [%] (6.8)% (2.9)% (1.2)% 0.6% 2.8% 3.4%
 NPAT [A$m] 3,008.0 2,548.7 2,427.6 2,394.2 2,278.6 2,392.2 -3.7%
 NPAT Growth [%] (5.5)% (15.3)% (4.8)% (1.4)% (4.8)% 5.0%
 Postpaid Mobile ARPU [A$m] 58.05 55.73 54.62 53.53 53.53 53.53 -1.3%
 Postpaid Mobile ARPU
 [%] (4.4)% (4.0)% (2.0)% (2.0)% - -
 Growth

 1

Diagram 1: Revenue Business Description
 Breakdown in FY18
 Other (inc. General Overview
 Media)
 6% Having transformed from its former status as a government owned natural monopoly, TLS is one of
 Global
 Connectivity Australia’s darling telecommunications companies. With dominant market positions in mobile and fixed-
 6% line spaces, TLS boasts a 16.7m mobile customer base and provides access to 11m fixed-line services.
 These two segments collectively comprise 62% of TLS’s total revenue (TR) (See: Diagram 1). It has
 NAS recently come under a change in focus and structure in both areas. From 2014, it began disconnecting
 14% fixed customers and moving them onto NBN representing a move from a wholesaler of broadband to a
 Mobile retailer. TLS also has footholds in more peripheral telco services. Whilst Data & IP (10% of TR), NAS
 40%
 (14% of TR) and Global Connectivity (6% of TR) have promising, albeit historically volatile, growth, they
 Data & represent a small proportion of TLS’s TR. Despite the proliferation of its products in Australian homes
 Fixed
 IP (Exc. One- and enterprises, TLS’s historical performance over the last five years reflects that of a company forced
 10% offs) to adapt rather than one undergoing a smooth transition. EBITDA margins have declined from 42.4% to
 Recurring 22% 35.9% between FY13 and FY18. The declining EBITDA figures are a result of (1) TR growth of 1.91%
 NBN DA over the same period on a CAGR basis, and (2) Increasing operating costs of 5% p.a (See: Diagram 3).
 2%
 Source: Abercrombie & Co Analysis Business Model

 Diagram 2: Mobile Revenue
 TLS’s business model follows a matrix configuration; six broad products that run laterally across three
 Breakdown in FY18 ($m) end consumer groups: Personal, Small Business, and Enterprise (See: Diagrams 2 and 4).
 $8,000 165 14 Mobile: Comprises 40% of TLS’s FY18 annual revenue. Over the previous 5 years, mobile revenue has
 890
 $7,000 958 grown at a CAGR of 1.97%. Revenue is generated via three channels: (1) through 20 simplified mass
 7401

 market pre-paid contracts that offer a range of phone, data and text/call combinations; (2) mobile
 $6,000
 broadband solutions with three price points (See: Appendix 23); and (3) wholesale of mobile network
 $5,000 facilities to wireless communications providers such as Boost Mobile, Aldi Mobile and Lyca Mobile.
 5374

 $4,000 Fixed: The combined services (voice, data and other) comprise 22% of TLS’s FY18 total revenue.
 $3,000 Revenue is generated through: (1) fixed voiced plans across 4 price points, (2) fixed data from 100GB to
 Unlimited with a which can be bundled up with additional entertainment additions included from the
 $2,000
 ‘unlimited data’ plans which includes a $100 Foxtel standard installation fee. Fixed voice and data plans
 $1,000 come with a $99 connection charge for new customers and (3) wholesale of broadband or NBN network
 $0
 facilities follows the same Telstra Wholesale Agreement.
 Data & Internet Protocol: Provides solutions for fast and scalable Virtual Private Networks (VPN)
 e
 d
 2M
 Pr d

 oa id

 l
 ta
 i

 llit
 an
 pa

 a

 To
 ep

 M

 te

 between a firm’s offices through ethernet connections. TLS is able to effectively cross-sell Cloud
 db
 st

 Sa
 Po

 Products, Security Services and Application Networking which contributed 10% to total revenue in FY18.
 Br

 Source: Abercrombie & Co Analysis Competitors like Evotec and other data network providers in higher ARPU Area Network connections
 Diagram 3: EBITDA Breakdown in have reduced revenue recently.
 FY18
 Network Application Services (NAS): Represents TLS’s IT services segment providing Cloud solutions
 Recurring and other integrated services. NAS revenue increased 8.6% in FY18 with integrated service revenue
 NBN DA
 5% driving this growth (39.5%) followed by Cloud services (14.4%), which has grown with TLS’s service of
 Data/IP
 14% connecting users to the public or private cloud data centre partners. NAS has a steady EBITDA margin
 Mobile
NAS 3% 38%
 of 10% and contributes 14% to TLS’s TR.
 Media: Entertainment packages can be purchased standalone, or in mobile bundles. TLS’s entertainment
 segment includes (1) Foxtel which operates on a per-month subscription model starting the most basic
 ‘Entertainment’ package for $26 per month to the ‘Platinum HD’ package for $111 per month, (2) TLS TV
 which can be bought for $192 outright; and (3) BigPond Movies including a library of movies and TV
 Global Fixed
 shows to rent as opposed to a subscription. In FY18 this segment has seen -1.2% revenue growth fuelled
Connectivity Exc. partly by the mass migration of 18,000 subscribers.
 8% Net One-Off One Off
 NBN DA NBN
 17% C2C Other: Income growth in ‘other’ was largely due to increased NBN disconnection fees (and associated
 18%
 Source: Company Filings
 one-offs) in line with the NBN network rollout. This category also includes Technology, Innovation and
 Strategy (including TLS Ventures and Ooyala), New Businesses (including TLS Health), and Media &
 Diagram 4: Heatmap of Relative Marketing. With FY18 revenue growing by 38.3%, this segment has been the fastest growing, albeit due
 Intensity of TLS’s Key Segments to NBN one-offs. This segment contributed 6% to total revenue in FY18.

 Personal
 Small
 Business Enterprise Industry Overview & Competitive Overview
 Industry Overview: Market Dynamics
 Mobile
 NBN Disruption: The government rollout of NBN has replaced the monopoly fixed-line internet network
 Fixed that TLS formerly commanded. The loss of this wholesaler position will cost TLS $3bn annually once the
 NBN completes. In contrast, the lower relative charges for retailers of NBN and negligible capex required
 NAS for competitors to resell NBN services has led to intense competition, with over 180 Retail Service
 Providers (RSP) now competing for NBN market share. RSPs are guaranteed uniform price and quality
 Data/IP
 by NBN Co, unlike when TLS, a competitor, was a wholesaler. Since consumers have wide access to
 comparable NBN providers, this has given rise to a period of intense churn. Despite this, NBN Co
 Media
 wholesale prices have not declined consistently. NBN Co recently reduced most wholesale prices to $45
 but are still optimistic of achieving a $52 target by 2021. NBN ARPU remains sluggish (growing from $43
 Other
 to $44 between FY15-18), so industry analysts expect higher access charges to remain unsustainable.
 With nearly 3m households and businesses currently connected, there is an activation rate of
 45,000/week. By 2021, it is expected 75% of Australia will connect to NBN.
 Leader Neutral Competitive

 Source: Abercrombie & Co Analysis
 2
Mobile Competitors are Rising: Increasing competition between mobile service providers has fuelled
 Diagram 5: Data Allowances by downward pressure on TLS’s mobile ARPU, which is now $57.67. Industry mobile ARPU continued to
 Year decline 3.1% over the past year. Over the past 4 years, the mean annual ARPU decline has been 7.1%.
 100% Whilst the 3 main players (TLS, Optus and VHA) have maintained fairly stable market share over the past
 5 years, the rise of Mobile Virtual Network Operators (MVNOs) has contributed to price pressures. These
 80% smaller players resell mobile services by leasing capacity from the big 3, and often provide prepaid plans
 at a cheaper price point with larger data inclusions (eg. Amaysim $40 15GB data for 28 days; also see
 60%
 Appendix 23). The growth of data capacity has contributed to the popularity of affordable MVNOs, with
 40%
 the total market share of Amaysim, Vaya and other MVNOs increasing whilst TLS market share has
 declined by 2% over FY17.
 20%
 Lessons from Overseas: Globally, incumbent telcos have faced analogous pressures to TLS from rising
 0%
 competition, technological disruption, and limited organic growth prospects. This highlights the difficulty
 Prior to FY14 FY16 FY18 for TLS to navigate beyond a low Average Margin Per User (AMPU) post-NBN world and retain mobile
 2013 market share. For instance, consistent declines in mobile ARPU in the US, driven by competition and
 data usage spikes, drove: (1) merger frenzies to consolidate and seek higher growth and AMPU
 20GB Wireless territories. This trend was also seen in the UK, when BT acquired EE in 2016 to create a 35m
 customer base. (2) Other incumbent telcos have opted to expand into adjacent operations or create
 Source: Abercrombie & Co Analysis
 bundled offerings to boost AMPU, such as AT&T’s merger with entertainment conglomerate Time Warner
 and Swisscom’s expansion into hospitality and cloud infrastructure. (3) Other telcos have faced further
 Diagram 6: Complaints to AMPU constraints and ARPU declines from aggressive competitors, which take advantage of a higher
 Ombudsman by Issue
 churn environment by undercutting. French telco Illiad disrupted the industry and claimed 5.4% market
 share in their first 6 months. Orange, the incumbent, failed to achieve positive growth for the next 7 years.
 Industry Overview: Consumer Dynamics
 Landline
 Phone Rising Demand for Data: Over the past 5 years, data consumption has increased significantly for mobile
 Internet 27%
 40%
 users and households (See: Diagram 5). Average monthly household data downloads over fixed-line
 connections have grown from under 10GB/month in 2010 to 95GB/month in 2016. This demand is
 projected to grow to 420GB/month by 2026 with technological advancements. Mobile trends follow a
 similar pattern, with 61% of mobile data plans comprising at least 3GB in 2017, compared to only 36% in
 2013. Demand has been fuelled by the rapid uptake of subscription video on demand (SVOD) apps which
 Mobile Phone consume significant data. Netflix in particular, has demonstrated substantial growth in the Australian
 33%
 market, averaging 100,000 new subscribers/month immediately following its launch. With mobile
 penetration reaching saturation levels ~96% and over 70% of 18-34 year olds regularly streaming videos
 Source: Telecommunications Industry Ombudsman on mobiles, telcos have upgraded their 4G networks to accommodate faster download speeds. Major
 investments in 5G technology are likewise expected as data demand grows.

 Diagram 7: Complaints against Over the Top (OTT) Disruption: OTT refers to applications and services provided to consumers over
 Telcos the internet without needing to be accessed via the telco providers. The growing popularity of OTT apps,
140,000 particularly messaging services like WhatsApp and Skype, have successfully deprived traditional
 revenues telcos received from their voice products. According to the Communications Department,
120,000
 Facebook’s messaging apps now outnumber global SMS volumes 3:1. Our analysis suggests many OTT
100,000 apps are now seen as a cheaper alternative for traditional text and calls and have driven sharp declines
 80,000
 in mobile voice revenues across major Australian telcos. The growth of OTT services has forced telcos
 to invest in mobile data plans, though these have lower margins than voice. We believe this market trend
 60,000 will continue, especially as telcos invest in data-centric products amidst diminishing mobile voice revenue
 40,000 (TPM planned to enter mobile with data-only plans; TLS eliminated excess data charges).
 20,000 Falling Trust in Telcos: Continual disruptions to coverage have contributed to falling trust levels
 between consumers and telcos. TLS in particular has the worst NPS score of all major telcos after
 0
 FY14 FY15 FY16 FY17 numerous NBN and mobile coverage issues (See: Diagram 12). The level of Australians who trust telcos
 has fallen to 53% in 2018. NBN problems relating to connectivity led to 23,000+ complaints to the Industry
 Telstra Optus Vodafone Ombudsman over 6 months in 2016, prompting a regulatory review. Complaints also rose 31.2% to
 iiNet TPG Primus Optus, 32.1% to Primus, 37.5% to VHA and 44.9% to TPM (See: Diagrams 6 and 7). Similar complaints
 spurred NBN Co to delay the NBN HFC rollout. In April 2018 TLS suffered major coverage outages of
 Source: Telecommunications Industry Ombudsman emergency hotlines. Optus also was forced into public apologies and free World Cup streaming after
 allocating insufficient bandwidth to subscribers.
 Diagram 8: NBN Wholesale Competitive Positioning: National Broadband Network
 Market Share
 TLS continues to lead with 48% NBN market share, compared to its closest rivals: TPM (26%), Optus
 Others
 Vocus 6% (14%) and Vocus (6%) (See: Diagram 8). However, our analysis indicates that relative to the pre-NBN
 6% period, the rollout of the technology has noticeably increased competition and reduced market share,
 particularly in regional areas where TLS holds 55% market share compared to its traditional share near
 70%. The setting of wholesale prices by NBN Co, instead of TLS, has created a $3bn earnings hole for
 TLS once the rollout is complete. As a result, bandwidth quality has generally been standardised, with
 Optus the exception of telcos who have not afforded purchasing CVC capacity to manage bandwidth during
 14% Telstra
 48% peak periods. We conducted a price survey (See: Appendix 23) across major telcos and identified that
 TLS charges substantially higher prices for their NBN50 services ($89 per month), compared to rivals like
 TPM VHA ($69) and TPM ($70). NBN churn rates have steadily increased over the past 5 years, and will
 26% continue during the rollout, labelled a ‘once in a generation churn event’ by NBN Co.
 Competitive Positioning: Mobile
 Our telco price survey reveals that TLS’s basic SIM plan is substantially more expensive at $49 for
 Source: Abercrombie & Co Analysis 20GB/month compared to rivals like Optus ($36 for 30GB/month) (See: Appendix 23). This reflects TLS’s
 traditional focus on higher value consumers willing to trade cost for greater network coverage and TLS’s
 3
Diagram 9: Postpaid Mobile superior brand equity. However, significant capex by competitors on improving network coverage
 ARPU Using BT/EE Acquisition including Optus’ $1bn upgrade of its regional network and TPM’s expected merger with VHA may further
 62
 increase competitive intensity and reduce mobile ARPU (See: Diagram 9). Whilst TLS has been the
 market leader in mobile, with 37.9% of total market share (postpaid and prepaid), this has fallen from
 60
 39.9% the year prior. Cheaper and higher data plans offered by smaller players like VHA and Amaysim
 58 helped capture market share away from TLS and Optus. TLS’s prepaid market share declined from 41.5%
 56 in FY17 to 34.8% in FY18, as lower cost prepaid plans have become more attractive during high churn
 54 periods. Almost 50% of consumers switched providers in the past 3 years. TLS’s strategy has angled
 52 towards investing in cloud services and upcoming 5G mobile networks to fill the $3bn NBN earnings hole.
 50
 If successful, demand for such networks could bypass fixed broadband connections, leading to a growth
 FY17 FY18 FY19 FY20 option for TLS earnings. However, we believe there are technological limitations and execution risks that
 Source: Abercrombie & Co Analysis; NB: see Appendix
 may hinder the expectation of filling the $3bn hole with these sources.
 21 for further background regarding the case study
 Competitive Positioning: Telstra 2022
 The Telstra2022 (T22) strategy was unveiled to improve competitiveness. It has 4 pillars: (1) simplifying
 Diagram 10: Comparing Equity products from 1800 to 20 plans, following efforts that have already been made by competitors like Optus
 and Debt of TPM, VHA and SPV
 to reduce redundant packages. The removal of excess data charges may have limited upside to improve
 TPG VHA 1 VHA 2 SPV
 TLS’s position since it primarily appeases existing customers facing unpopular charges. It may also
$9 further reduce TLS mobile ARPU. (2) TLS aims to offset earnings loss by optimising operations with an
 ambitious $2.5bn cost reduction strategy. This represents a 35% cut on the underlying cost base of $7bn.
 7.6 We hold concerns that the cost out will not be met, considering management’s record belying costs and
$6
 0 TLS’s hefty cost of sales growth. Even if the cost out is achieved, it will require reductions in customer-
 facing services. This will increase churn amidst a turbulent period of competition and depress ARPU
 4.8 beyond any marginal gains in AMPU. (3) TLS will establish InfraCo as a standalone infrastructure
$3 5.5 business InfraCo meanwhile, we believe is geared to either be set up to bid for NBN Co post 2021 or
 5.4
 provide transparency of TLS’s infrastructure-related earnings. (4) T22 will also aim to streamline the
 1.9 organisational structure of the firm and focus on product leadership with new roles to build capabilities.
 1.7
$0
 Investment Summary
 -0.8
-$3 Net Debt Equity 1. Rising Mobile Competition | Prepare for the Game of Phones
 Source: Abercrombie & Co Analysis; NB: See Merger
 Model; VHA 1 is the standalone VHA; VHA 2 is the
 merged entity
 The $15bn TPM-VHA merger could threaten TLS’s mobile earnings. We believe the market has reacted
 positively to the announcement and expect a consolidated TPM-VHA may alleviate ARPU pressure. But
 against the backdrop of higher competition and data demand, TLS is likely to lose customers to TPM-
 VHA with incentive and capacity to be aggressive, and to other competitors with better customer service.
 Every Person Has Their Price | Quality Premium < Price Premium
 Diagram 11: Debt Trends of TPM-
 VHA Entity vs TLS Bundling Exposes an Overrated Quality Premium: TLS’s mobile advantage relied on its actual and
 5,000 2.50x perceived network superiority. Despite cheaper plans in the market, TLS maintained market share with
 high ARPUs because of customer preferences for quality networks. But the pace of VHA investments
 4,000 2.00x into infrastructure (like investing $2bn in FY17 on mobile coverage) has spurred rapid improvements in
 network quality. VHA call success rate for instance has quickly caught up, improving 610 basis points to
 3,000 1.50x
 98.9% compared to TLS’s call success rate of 99.20%. VHA has a credible network with the opportunity
 to pierce TLS’s customer base on quality and price. We developed a quality-price divergence matrix by
 comparing network metrics of VHA and TLS as proxies for quality (e.g. active cell towers; See: Appendix
 2,000 1.00x 15). Whilst TLS has superior quality metrics, our calculations reveal that the price that existing TLS
 customers were willing to pay for this quality advantage over VHA is only $23. However, the TLS plans
 1,000 0.50x are $29 more expensive than comparable VHA plans (See: Table 7 and Appendix 15). This crossed the
 matrix point where TLS customers would migrate to VHA. We posit that this switching decision has not
 - 0.00x been triggered for many TLS customers because there are 3.1m customers on bundles, locked in with
 20192020202120222023 lengthy broadband contracts, and switching to VHA does not fill a needed broadband replacement. The
 EBITDA TPM-VHA merger provides bundling of broadband and mobile and activates the gateway to capture these
 Net Debt customers. It exposes TLS’s overvalued quality premium and offers bundled broadband to trigger
 Net Debt / EBITDA migration. This is similar to the bundling impact after UK telco BT acquired mobile player EE. Postpaid
 TLS' Net Debt / EBITDA
 mobile ARPU declined from £25.9 to £23.4 from FY16-18 and the incumbent telco’s market share
 Source: Abercrombie & Co Analysis dropped 25% to 21% (Appendix 21). Further, whilst TLS has coverage over 99% of Australians, since
 85% of the population stays within urban areas, which VHA already covers, TLS’s coverage premium is
 less compelling. Consumers spending most time in urban areas may be less likely to accept a $29 price
 Diagram 12: Comparison of NPS premium for negligibly different network quality within urban areas. This boosts the incentive to switch to
 across Telcos TPM-VHA. We project TLS market share will fall by up to 5% in FY19. We expect industry ARPU to fall,
 25
 as TLS and Optus fight on price to close the gap between the quality and price premiums. Rather than
 having 4 main telco players prior to the merger, our view is that there were only two main bundle
 20 providers. With TPM-VHA, there are three quality bundle providers, enabling the price war to go on.
 15 Clinging to Price Relief: We expect TPM-VHA to be aggressive in pricing as a merged entity contrary
 to beliefs that TPM-VHA would abandon an undercutting strategy. We believe TLS’s ARPU will decrease
 10 to $55.73 in FY19, and TLS would miss EBITDA guidance of $8.7-9.4bn by 4%. We view VHA’s decision
 to create a Special Purpose Vehicle (SPV) (which involves VHA moving $4.8bn of debt and paying it
 5
 down with their half of the dividends from the TPM-VHA) as a means to ensure capex can be sustained
 0 without hiking mobile prices (See: Diagrams 10 and 11). This is because in the absence of the merger,
 FY15 FY16 FY17 FY18 network investments placed TPM at risk of breaching their 3.5x Net Debt/EBITDA covenant and VHA’s
 -5 $7.57bn debt (at August 2018) inhibited its ability to raise more debt to fund mobile capex. Instead, TPM-
 VHA will have a combined leverage of 2.2x Net Debt/EBIDTA (See: Diagram 11). Our merger model also
 -10 Source: Company filings
 affirms that TPM-VHA will be deleveraged with greater debt capacity from the merger, as Net
 Telstra Optus
 Vodafone
 Debt/EBITDA declines across our model forecast (See: Appendix 22). This enables a sustainable annual

 4
outlay of $898m in capex for mobile network and 5G upgrades, whilst allowing TPM-VHA to keep their
 Diagram 13: Average Customer prices low to capture market share. The prospect of TPM-VHA choosing an aggressive strategy is also
 Wait Times (hrs) supported by Mr Teoh’s claim after announcement that TPM-VHA will be a “leading challenger” and
 VHA’s motivation to reclaim the migration of customers from Vodafail.
 1.3 1.3 Customer Flight | Unprecedented Attrition Rates
 1 1
 0.8 Customer Dissatisfaction: In a low trust environment, TLS customers may have reached peak
 dissatisfaction. A comparison of NPS reveals TLS is reaching an all-time low in customer satisfaction,
 0.5
 from a score of 13 to 7 in FY18 (see: Diagram 12). Rivals like VHA have a score of 20. Against more
 reliable alternative providers, we believe dissatisfied TLS customers could flee, contributing to the
 projected 6.7% fall in FY19 earnings. Our analysis reveals the causes are: (1) outages; with 174 reported
 outages since January 1; and (2) longer wait times than competitors (See: Diagram 13). On our testing,
 it took on average 1hr 31min to reach a human on TLS’s hotline, exceeding the industry median of 1hr.
 m

 ne
 ng

 in
 tra
 us

 rg
 si

 pt

 fo
 lo

 ls
 ay

 Vi
 Te
 O
 Be

 da
Am

 Vodafail – the sequel? The previous two factors parallel the start of the ‘Vodafail’ saga in 2010, where
 Vo

 Source: Australian Communications Consumer Action
 Network VHA’s customers experienced outages and poor response rates. This reduced NPS by 250% from 2010
 to 2012. VHA experienced churn of 8.4% in half a year and of 33% over the entire period. Given the
 Diagram 14: TLS’s Capex and current period of high churn and similarities with VHA in Dec 2010, we appropriate the abnormal impacts
 Gearing of ‘Vodafail’ churn in the 1st year (at a 50% discount) to arrive at our FY19 churn estimate at 16%.
55% $7,000
 2. All in on 5G | Hold the Door for Rivals to Enter 5G
 $6,000
50%
 5G is the next generation of mobile internet connectivity (e.g. 3G and 4G), which is becoming a driving
 $5,000 factor of mobile uptake. TLS relied heavily on commercial 5G launch in 2020 reviving earnings.
 $4,000
 Historically, TLS enjoyed the premiums available as a first-mover during 3G and 4G rollouts. We
 challenge management’s guidance that TLS will be the first to market and forecast subdued ARPU growth
 [A$m]

45%
 $3,000 of 1% in FY20 and declining growth afterwards. We premise this on a hyper-competitive landscape that
 will not subdue at commercial launch of 5G as Optus and TPM-VHA will be as ready as TLS.
 $2,000
40%
 5G Rollout | Telstra No Longer First
 $1,000
 ARPUs skydive against main Rival Optus: TLS may be forced to introduce expected plan prices for
35% $0 5G that will be unable to meet the premium investors expect. TLS increased capex with network upgrades
 FY11 FY13 FY15
 during from FY11 and FY15 for 4G and 4GX (Diagram 14). These were offset by charging a premium for
 the new network with ARPU growth of 7.05% in FY11 and 5.51% in FY15 (Diagram 15). Having a
 Capex Gearing monopoly over 4G for a year before Optus turned on their networks and 4 years before allowing access
 Source: TLS Annual Reports to resellers (e.g. Woolworths Mobile, Boost) ensured TLS achieved perceived market leadership and
 could receive ARPU premiums before competitors caught up. However, as 5G rollout intensifies in FY19,
 our analysis affirms TLS will come to market at a similar time to Optus, eroding historical premium
 Diagram 15: TLS and Optus expectations. We modelled a -5% ARPU in FY19 and a subdued increase of +1% in FY20. These
 ARPU Growth Trends
 forecasts are premised on: (1) TLS’s plans to rush the “early 5G” stage by launching 200 5G-compatible
 sites this year has limited benefit as commercial 5G compatible devices only become available in 2020.
 FY11 FY13 FY15 FY17 FY19
 Therefore, Optus’ plan to rollout out an identical 5G network in early 2019 will make them as ready as
 11% TLS (See: Appendix 25) (2) Optus holds the most bandwidth in 5G spectrum at a population weighted
 average of 33.1% in major cities (See: Diagram 16). This allows trialling in capital cities where mobile
 6% usage is most concentrated; (3) Thus, Optus has been able to accelerate successful 5G trials in July
 2018 and matched similar TLS trials run in April 2018. We predict TLS will merely be equally placed with
 1%
 competitors to rollout 5G. They would lose the ARPU premiums historically relied upon to recoup capex.
 -4% TPM-VHA together ensures guaranteed spectrum: The upcoming spectrum auction provides TPM-
 -9%
 VHA the opportunity to acquire the resources needed to continue initial 5G trials. We believe TLS
 investors will revise ARPU and subscriber growth downwards as a result. With TLS’s debt financing
-14% capacity, we hypothesised that it could acquire all 60MHz of their spectrum allocation. Without a merger,
 TPM and VHA would be in fierce price competition to attain as much of the remaining 60MHz available
-19% but would still be expected to stay below its debt covenant of 3.5x. However, the TPM-VHA partnership
 eliminates a bidding war and accelerates 5G rollout as it ensures the maximum spectrum of 60MHz will
 Telstra Optus be available to the combined entity and we estimate potential cost savings to be around $30m (Appendix
 Source: TLS and Optus Annual Reports; USR
 28). We also forecast subscribers migrating from TLS. Though the rushed VHA Three partnership in 2011
 Analysis could not manage mass migrating customers, TPM-VHA has better network and resource capacity to
 succeed since: (1) TPM-VHA has already started deploying small cells in Sydney which are 5G
 Diagram 16: 5G Spectrum infrastructure alternatives to macro sites of traditional mobile base stations. This reduces overall costs
 Ownership in FY18 for the combined entity as it expands on TPM’s 21,000km fibre networks, (2) the combined entity will
 extract learning economies of Mr Teoh’s experience in cost-cutting market entrance and Iñaki Berroeta’s
 100% experience in mobile strategy; and (3) they have upgraded their towers to use 4.9G in preparation for 5G,
 allowing Western Sydney customers to use and be familiarised with VHA developments.
 80% Aggressive Entrant | Three is Not the Magic Number
 Differentiation is King in the Face of Data Commoditisation: Intensified 5G rollout coinciding with
 60%
 imminent NBN completion could trigger a major churn event for TLS. Consumers who are upgrading
 existing plans onto the new broadband and cellular network will become incentivised to join a new
 40% provider with targeted offerings. Investors may infer an imminent rollout would lead to TLS ceding 4%
 market share to its competitors in FY20, contributing to a 6.7% decline in mobile revenue. Historically,
 20%
 churn rates increase with each new network generation. The 4G rollout in FY11 caused a deviation from
 mean industry churn by 200bp (Diagram 17). With similar expected 5G rollout dates and data
 commoditisation (see Industry Overview), we expect product differentiation will drive market share
 0% growth. We believe TPM-VHA’s merger allows for differentiation via cost leadership. By bundling mobile
 Sydney Melbourne Brisbane and broadband, we expect to see reduction in prices greater than if consumers purchased mobile and
 Available Optus NBN Co Telstra
 broadband separately. Further, we believe that Optus’ monopoly on international football streaming is an
 Source: Abercrombie & Co Analysis 5
Diagram 17: Industry Churn in enticing point of differentiation. Optus’ $63m exclusive license of the English Premier League proved to
19% the Postpaid Mobile Space be an effective acquisition strategy as these streamers were more likely to be Optus customers by
 ~290bp. We view the recent World Cup streaming failure as merely short term because football
16% subscribers increased after the failure and Optus has significant quality and quantity over previous
 providers of World Cup streaming. In contrast, TLS uses a sublicensing strategy where non-TLS
13%
 customers can access content, eliminating the differentiation benefit. For instance, their AFL, NRL and
 Netball streaming lack the same growth popularity and compete directly with free-to-air .
10% 3. Commoditised NBN | Winter is Still Coming
 The NBN has diminished AMPU for TLS over time. Wholesale access and CVC costs remain high, and
7%
 FY11 FY12 FY13 FY14 FY15 FY16 NBN rollout has enabled smaller, efficient competitors to offer parallel broadband to TLS. ARPU has
 Industry Average remained low at $44, sluggishly growing $1 since FY15. We believe impacts of NBN commoditisation are
 fully priced in by a pessimistic market. In FY19, catalysts relate to the difficulty of the incumbent to keep
 Source: Abercrombie & Co Analysis any remnant of quality advantage and meet their cost target, and an impending dividend cut.

 Diagram 18: CVC per User Incumbent’s Curse | Competition and Costs Catching Up
 Projects (mbps)
 4 The churn will go on: In 2018, NBN Co began the progressive rollout of new wholesale NBN bundles.
 It encourages uptake of sufficient CVC, which enables telcos to support NBN peak speeds amidst
 3
 congestion. Bundles represent savings of 27% for 50mbps and 10% for 100mbps NBN. TLS’s prior NBN
 2
 competitive advantage was their investment in CVC above industry norms, which allowed them to achieve
 85% of maximum service speeds during peak time. However, our analysis indicates these bundles will
 1 spur improved competitor network quality as cheaper CVC bridges a previously unaffordable divide for
 smaller telcos. By modelling the resulting abnormal CVC uptake following other discount programs (See:
 0 Diagram 18), we determined the new bundle prices almost double industry average CVC/user by the end
 3/1/2017 3/1/2018 3/1/2019
 of 2019 to 2.93mbps. At these levels, quality convergence of bandwidth across telcos reduces ARPU and
 Source: Abercrombie & Co Analysis keeps churn high as consumers benefit from choice. TLS’s connection quality advantage will decelerate
 quicker than expected, thus we forecast TLS fixed data revenue to fall 5%, and net income to fall $440m.
 Diagram 19: Cost Increases
 Outstripping Savings T22 Cost program – dubious at best: With competition set to rise further in FY19, we do not believe
2500
 TLS’s $2.5bn productivity savings program will meaningfully increase margins. We hold concerns over
1500
 executing the remaining $1.8bn in fixed cost savings that the market expects. Under CEO Andrew Penn,
 costs ballooned $3bn since 2015 whilst EBITDA shrunk 4%. In contrast, mature telcos like VHA cut costs
 500 by $600m over the past decade. Overseas, BT Group has cut costs by $2bn. TLS has problems executing
 cost efficiency programs. Plans to cut 30% of labour could impact customer satisfaction as NBN support
 -500 FY17 FY18 FY19 FY20 personnel reduce. In a high churn setting from NBN rollout, this compounds market share loss. Even if
 Cumulative TLS NBN the $2.5bn fixed cost target is reached, we think the market has overlooked the rapid increase in cost of
 Network Cost Increases sales in FY18, growing $1bn (13.6%), faster than the cost out which only progressed $480m. Greater
 Cost Savings Achieved (m) than expected payments to NBN made up $494m of this rise in cost of sales. The record 6.9m users
 Source: Abercrombie & Co Analysis connecting to NBN in FY19 and temptation to purchase more CVC to combat rivals could trigger
 cumulative cost of sales increases of $2.4bn by FY20, eviscerating the productivity savings (See:
 Diagram 20: Projected Ordinary Diagram 19). We project NBN cost of sales to increase by $773m, reducing EBITDA by 2.9% in FY19.
 and Special Dividends (c)
 25 High Dividends to End | Not Enough Cash for Capex
 20
 Other concerns will take priority: Our analysis suggests a major dividend cut, beyond expectations, is
 15 coming. In FY18 TLS paid 22c in dividends, 30% lower than the 5-year average. We believe the market
 10 currently implies a 18c ordinary dividend/share in FY19, on a bare bottom 70% payout on lower end of
 TLS earnings guidance. This is still too optimistic. With capex and competition pressures posing
 5
 existential threats to TLS’s market leadership, we believe TLS will prioritise an A band credit rating (See:
 0 Financial Analysis). In light of a recent A- downgrade, cofounding events in FY19 risk depriving NPAT.
 FY18 FY19 FY20 FY21 FY22
 The looming $1.2bn capex outlay for their network program will lead to negative cash balances without
 Ordinary Special
 additional financing. Raising debt to cover this will breach the target debt servicing ceiling of 1.8x Net
 Source: Abercrombie & Co Analysis Debt/EBITDA. Other earnings pressures also strain TLS’s cash flow in FY19. Further NBN competition
 and aforementioned mobile declines both suppress ARPUs, losing $128m and $646m respectively. In
 Table 1: FY19 Upper and Lower our best-case scenario with zero premium for the 5G spectrum auction, TLS still commits $93m in capex
 Guidance
 with no recoupment until the 5G rollout. Thus, the dividend must give and we model that TLS will only
 have capacity to pay an ordinary dividend of 16c (See: Diagram 23), a 12.2% downside to expectations.
 FY19 FY19
 Lower Upper With a 55% retail investor base, this retreat could spark a sell off. A bull case cut to 17c leads to a 4%
 Guidance Guidance fall in price from our base Discounted Cash Flow (DCF). A bear case cut of 13c triggers a 10% price fall.
 EBITDA 8800m 9500m Valuation
 NPAT off
 Historical Our price target of $2.67 was computed via three valuation methods: Consolidated Discounted Cash
 2728m 2945m
 31% Flow Model (DCF), Sum-of-parts (SoP) Maintainable EBITDA Model, and SoP relative valuation. The
 Ratio SoP approach rendered a more accurate valuation of TLS than on a consolidated basis, as it recognises
 Payout the dissimilar growth prospects and financial and operational risk profiles of each business. A Dividend
 Ratio off 70% Discount Model (DDM) was also calculated, although not weighted in the overall valuation.
 70%
 Ordinary
 Div Consolidated Discounted Cash Flow Model [30% Weighting]
 Total
 1909.60m 2061.50m
 Our DCF model was calculated using a Two-Stage Free Cash Flow to Firm (FCFF) with a five-year
 Dividend forecast horizon and a terminal growth rate (TGR) of 3%. We computed an intrinsic valuation of $2.74
 Total per share. The five-year horizon represents the optimal period within which TLS’s cash flows, growth and
 Dividend risk assumptions can be projected without compromising the forecast accuracy.
 $0.17 $0.19
 per
 Share

 Source: Abercrombie & Co Analysis 6
Table 2: Valuation Output Revenue: Since TLS’s business model operates on subscription contracts, revenue is a function of ARPU
 (contract price) × subscriptions: positively impacted by population growth and gross additions; negatively
 Share impacted by switching subscribers (churn rates).
Method Weighting
 Price
 Mobile: [44%]: The primary driver of revenue is (73%) postpaid contracts. TLS’s postpaid ARPUs
DCF $2.74 50% declined by a CAGR of 1.3% between FY11-18 with average churn rates of 10.88%. The current churn
MEM $2.72 20%
 environment – further fuelled by ongoing NBN rollout – will see ARPUs further decline from $58.05-$53.53
 (FY18-20) as competitors attract subscribers in the run-up to the next generation rollout. We forecast
Multiples $2.44 30% increased net churn (gross churn less additions) of 4% in FY18 and 2% (FY19-20) given the same
 reasons, exacerbated by TLS’s low consumer satisfaction revealed by a 7 NPS score. Total mobile
Target
Price
 $2.67 revenue remains flat across the forecast: $9,468.7m (FY19) and $9,571m (FY23). The negative growth
 in postpaid is muted by moderate growth in the other 27% of mobile revenue (See: Appendix 14).
Source: Abercrombie & Co Analysis Fixed: [18%]: Fixed revenues derive primarily from data and voice products. Fixed data revenue grew at
 4.1% CAGR since FY14, but this obscures recent struggles to grow (1.6% FY17, -0.4% FY18). This
 stems from intensified competition with NBN. TLS’s lost wholesaler status and equal quality broadband
 Diagram 21: TLS’s Sales and available for 180 RSPs keep ARPUs low at $44. We project increased competitor capability and high
 EBITDA Margins churn through NBN activations will amplify revenue decline: -5% (FY19-20). Fixed voice fell 9.5% on
28 44%
 average over FY14-18 as growth of OTT and data alternatives usurped voice services. These revenues
 continued to fall -15% each year into the forecast, with no signs of a return to popularity for legacy voice.
27 42%
 NAS: [14%]: Annual revenue growth in NAS has been historically high yet volatile, with a mean of 20.2%
 40% and standard deviation of 12.1%. NAS represents the ancillary growth engine of the company. Recent
26
 38% growth may have been inflated, driven in part by the capture of clients transitioning from TLS’s own data
25 and IP networks, rather than capturing from rivals. Revenue is forecast to increase in line with reduction
 36% in Data & IP, with additional 8% uplift in industry demand for cloud.
24 34%
 Data & IP: [10%]: Data & IP declined by a mean of 9% since FY16, due to cannibalisation by the NAS
23 32%
 FY13 FY15 FY17
 segment, as legacy physical data networks have seen demand shift to replacement cloud networks. We
 project further discontinuance of legacy data VPNs with revenue declining 4.9% each year.
 Sales [A$b]
 Operating Expenses: Management forecasts the T22 $2.5bn cost cut regime by FY22. We expect a
 EBITDA Margin [%] disproportionate amount of costs to be reduced in the short-run as the company streamlines its 20 plan
 Source: Abercrombie & Co Analysis offerings and employee salaries reduced as per management’s guidance. Cost reductions may be
 unlikely to continue at this rate. Lack of NBN cost relief and capex for 5G rollout could also largely mitigate
 Table 3: Valuation Output any cost-reduction benefits. As such, we forecast moderate decline in OPEX as a percentage of revenue
 from FY19-FY20, which levels from FY21 across the rest of the horizon.
Forecast WACC 6.60%
 Capex: Forecasted to increase on the assumption that TLS will bid for all its available spectrum
Terminal WACC 7.01% allocations. The value of the spectrum auction with only two main telcos (TLS and TPM-VHA) may have
 a zero premium and should sum to ~$93m – contributing to the FY19 capex figure. The result is
PV Forecast FCFFs
($m)
 9,077.1 capex/sales ratio of 17.8%, the upper end of management’s 16-18% guidance. From FY20-23 we expect
 capex to increase from ~$5872m-$6633m with 5G infrastructure capex and new network towers.
PV Terminal FCFFs
 39,728.3
(Sm)
 Free Cash Flow to Firm (FCFF): FCFFs were discounted at the explicit WACC of 6.60%. Cost of equity
Enterprise Value
 48,805.4 of 8.39% was calculated via the CAPM, Fama-French Three Factor model and the DDM (Appendix 9).
($m) The cost of debt of 3.24% was computed via a triangulation of intrinsic and comparable methods
Less: Debt ($m) (16,860) (Appendix 10). TLS’s terminal value, which stores 81% of the company’s DCF value, was discounted by
 a terminal WACC of 7.01%. This higher discount rate reflects greater risk associated with TLS’s terminal
Add: Cash ($m) 629 cash flows against the backdrop of the firm restructuring, industry changes and intense competition.
 (Appendix 11). TLS’s terminal FCFFs are assumed to grow in line with our TGR of 3%. After summing
Equity Value ($m) 32,574.4
 FCFFs and subtracting net debt, we arrive at an equity valuation with an intrinsic price target of $2.74.
Shares Outstanding
(m)
 11,878.9 SoP DCF Maintainable EBITDA Model [50% Weighting]

Value Per Share $2.74
 Separating InfraCo offers the financial transparency needed to value core operations (CoreCo) separate
 to the infrastructure business. CoreCo was modelled with similar assumptions as the consolidated DCF.
Current Share Price $3.21
 Maintainable EBITDA: This represents the EBITDA attributed to the CoreCo (ex InfraCo). One-off
 receipts associated with the NBN transition process were stripped out as were recurring securitised
Source: Abercrombie & Co Analysis
 payments. The result is EBITDA trending from $5,499.2m to $5,209.9m (FY19-23) consistent with margin
 erosion discussed in the DCF payments.
 Table 4: Cost of Capital Output
 InfraCo Value Drivers: InfraCo’s value is a function of NBN recurring securities payments that can be
 Forecast Terminal forecasted accurately. Their EBITDA contribution grows 2% p.a. from $593m to $623m (FY19-23) where
 they plateau. One-off payments were stripped from InfraCo as they are a non-recurring item distorting
Re 8.39% 9.95%
 TLS’s intrinsic value. InfraCo’s overall EBITDA is forecast to fall from $3,125m to $2,418m (FY19-23).
Rd 3.24% 4.09%
 Risk Profiles: InfraCo’s value can be compared to a fixed annuity stream. An appropriate discount rate
Net Debt
 16,653 16,653 was implied using the BBB rated as a risk proxy and implying a spread above the 10-year government
($m) bond rendering a lower explicit and forecast WACC than CoreCo. Similarly, with InfraCo detached,
Equity CoreCo’s WACC was increased proportionately to reflect the riskier cash flow profile (See: Table 5).
 36,591 36,591
($m)
 FCFF Valuation: Two-stage FCFFs were calculated for each entity and discounted by the appropriate
D/V 0.31 0.31 discount rates. The resulting SoP valuation is consistent with a $2.72 price target, $1.04 contributed by
E/V 0.69 0.69
 InfraCo (23%) and $1.68 by CoreCo (73%). The (Maintainable EBITDA Model) MEM results in some
 valuation uplift in the standalone unit caused by recognising its attractive risk profile.
Tax Rate 30% 30%

 WACC 6.60% 7.01%

Source: Abercrombie & Co Analysis 7
Sum-of-Parts Output
 EV/EBITDA Forecast
 EV (DCF) ($m) FY19 EBITDA ($m) (FY19F) WACC FCFF CAGR
InfraCo 15,195.9 3,125.6 4.9x 5.2% (7.7)%
CoreCo 36,892.4 5,499.2 6.7x 7.2% (4.5)%
Total 52,088.3 8,624.8 6.0x

 Relative Valuation Trading Multiples [20% Weighting]
Debt ($m) (16,653.0)
 Trading multiples were used on the separate units and a consolidated basis, allowing differing growth
Implied Equity Value and risk profiles to be assumed by the multiples. A merit of the valuation first depends on selecting robust
 35,435.3
($m)
 comparables that reflect the growth, risk and cash flow profiles of TLS (See: Appendix 7). We computed
Shares on issue 11,893.3
 a $2.44 target price comprised of SoP EV/EBITDA, EV/Sales, EV/EBIT and consolidated P/E. NTM
Target price $2.44 multiples were used to reduce historical accounting biases, rendering a more forward-looking valuation.
Current Trading Price $3.21 Lower quartile multiples were applied to CoreCo whilst upper quartile multiples were applied to InfraCo
Implied Premium – recognising its more attractive risk and cash flow profile relative to the core (See: Appendix 8).
 (31.6)%
(Discount)
 SoP EV/Sales: weighted 9% given that the ability to generate revenue, particularly in mobile, is a key
 Table 5: WACC Outputs
 driver of value for telcos in light of competition. Further, it allows for comparison across international
 CoreCo WACC companies with minimal distortions (besides revenue recognition criteria) arising from other line items.
 The upper quartile multiple for InfraCo and lower quartile multiple for CoreCo rendered a summated
Forecast 7.16% share price of $2.09. TLS trades at a 2.1x EV/Sales ratio, representing a ~15.3% and ~31.7% premium
Terminal 7.58% to its comparable median and lower quartile multiples (respectively). One drawback is it is an imperfect
 proxy for value as it fails to consider operating efficiency discrepancies between TLS and its peer group.
 InfraCo WACC
 SoP EV/EBITDA: We ascribed 50% weight as it is a capital structure neutral metric that encompasses
Forecast 5.22% the operational efficiencies of each unit. InfraCo’s implied share price is $0.99 whilst CoreCo’s is $1.63,
 rendering a $2.62 price target on a consolidated basis. TLS’s current price implied a 6.41x EV/EBITDA
Terminal 5.60%
 multiple (summated basis) which reflects a marginal discount of ~5.9% to comparable peers, yet a 20.5%
Source: Abercrombie & Co Analysis
 premium to its lower quartile. Its attractive EV/EBITDA margin is due to InfraCo’s strong EBITDA margin.
Table 6: Summary Output of SoP EV/EBIT: We ascribed this multiple a 20% weighting as it provides a proxy for comparison of asset-rich
 companies with high D&A expenses. InfraCo’s implied price using this multiple is $0.95 whereas OpCo’s
 price is $1.50 yielding a total share price of $2.45, a 31% discount to the current share price of $3.21.
Mult-
iples
 TLS
 SP
 Infra
 Co
 Op
 Co
 Weight-
 ing
 P/E: Was moderately weighted at 20%. As a multiple it lacks predictive value due to its reliance on the
 current share price as a metric of value and is most exposed to the distortions that can arise from differing
 accounting treatments and capital structures. Also, it was used on a consolidated basis which implicitly
 bundles InfraCo and CoreCo’s risk and growth profiles into the one multiple. The peer-implied share price
 EV/
 $2.09 $0.45 $1.64 30%
 is $2.51. The current share price implies a 14.85x P/E ratio – a 18% premium to the comparable multiple.
Sales

 Financial Analysis
EV/
EBIT
 DA
 $2.62 $0.99 $1.63 50% Profitability | Competitive Landscape Supressing Profit Margins
 Mobile Revenue: Postpaid mobile ARPUs declined from $64.46 to $58.05 (FY12-18) due to increasing
 competition. The negative effect on revenue growth is muted by the overall subscriber growth profile:
 P/E $2.51 20% averaging 4% from (FY13-18) albeit at a decelerating rate (8.6% FY13 to 1.7% FY18). In determining the
 quantitative impact on future ARPUs we constructed a Quality Factor Model (QFM) that aimed to
 Value/ Share: $2.44
 understand network quality gained per marginal contract price in the Australian market. Comparing TLS,
 VHA and Optus, ‘network quality’ was proxied using five-factors (See: Appendix 15). Our analysis
Source: Abercrombie & Co Analysis
 indicates that TLS’s average contract is over-priced by $5.1 (7.98%) whilst Optus and VHA are fairly
 priced with
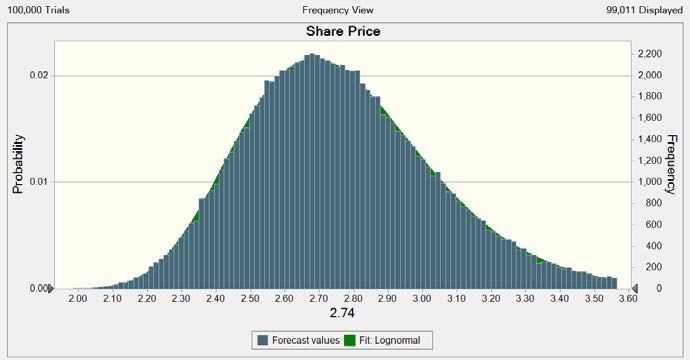
Diagram 22: Cash with 18c FY19 debt (A-) was due to muted earnings and increased competition. The profile is less attractive when
 Dividend applying Net Debt/EBITDA less Capex (1.2x – 3.4x) across the same horizon. We expect this to continue
 FY19 FY20 FY21 FY22 FY23 its decline as TLS rolls out the remainder of its $3bn commitment to 5G infrastructure investments,
2500 18.4 excluding expenditure related to spectrum auction which we forecast as ~$93m. We believe capex will
2000
 continue to rise as adjusted Net Debt/EBITDA increases from 4.0x to 4.8x.
 18
1500
 Finance-Dividend-Investment Trade-off: TLS faces a three-way trade-off scenario between its
 17.6 obligations (dividends and debt) and its goal to aggressively expand into 5G. Cash has rapidly decreased
1000 from ~$5.2bn in FY14 to ~$600m FY18. It has committed to two goals: (1) maintaining an A band credit
 17.2 rating; and (2) implement the $1.2bn of growth capex to invest in network and digital intangibles for FY19.
500
 With ~$600m of cash on the balance sheet, stagnant profit, and $825m of debt maturing in late 2018,
 0 16.8 TLS will struggle to meet its twin aims whilst also satisfying its dividend hungry investors. Using historical
 yields on TLS’s stock we can impute that the market expects an ordinary dividend of 18c for FY19.
-500 16.4 Funding the $1.2bn outlay (assuming no additional debt) leaves FY19 cash reserves at $600m, but by
 Cash Dividend
 Source: Abercrombie & Co Analysis
 FY22 cash reserves deplete to -$300m. With this projection, FY19 marks a decision point for TLS to avert
 negative cash balance. TLS has 3 options: (1) raise debt to fully fund the $1.2bn growth capex; but whilst
 we expect TLS to have no issues refinancing the $825m maturing loans in FY19, raising a further $1.2bn
 Diagram 23: Cash with 16c FY19
 in debt brings TLS past its own upper 1.8x Net Debt/EBITDA target (1.86x) which may risk another credit
 Dividend rating downgrade (2) reducing capex; but this would compromise TLS’s ability to be competitive. Also,
2500 16.4 reducing growth capex to $1bn still leads to -$157m cash in FY21, (3) reducing their dividend payout to
2000 16
 offset the debt required. We sensitised annual dividend against cash reserves over the forecast, implying
 that the minimum dividend cut from 18c required to avert negative cash was $0.02. We believe a base
1500 15.6 cut to $0.16 is warranted, with a bear case dividend cut to $0.12 emerging if competition is worse than
 expected or one-off NBN receipts are subdued impacting the special dividend.
1000 15.2
 Investment Risks
 500 14.8
 Valuation Risk Analysis | Sensitivity, Scenario and Risk Analyses
 0 14.4
 FY19 FY20 FY21 FY22 FY23 Sensitivity: Three sensitivity analyses were conducted on the key drivers of TLS’s valuation (Explicit
 Cash Dividend WACC, Forecast WACC and TGR). These inputs were sensitised as they encompass growth and risk
 Source: Abercrombie & Co Analysis assumptions. Given 81% of TLS’s DCF valuation is stored in the terminal value, the share price is
 extremely sensitive to its terminal WACC and TGR assumptions (See: Appendix 11). Scenario: We
 conceived bull and bear scenarios that varied our valuation inputs based on the TPM-VHA merger
 Diagram 24: Monte Carlo Output
 outcome and success, TLS’s competitive positioning in the mobile/5G space, and the disruptive impacts
 of the NBN. The analysis reveals that our bear scenario renders a share price of $1.98, a 38% discount
 to the current price, whilst our bull case renders a share price of $3.53 (10% premium to market) (See:
 Appendix 17). Monte Carlo Simulation: The 10,000 simulations presented a probability-weighted
 depiction of bull and bear scenarios conceived above. By altering churn, ARPU and growth rate
 assumptions, we found a price target range of $2.10 - $3.55 with 90% certainty. The simulation reveals
 72% of the potential outcomes are less than the current share price, resulting in a sell recommendation.
 Firm Specific Risks
 [F1] TLS Successfully Defends Its Market Share (Low Likelihood, Moderate Impact)
 Source: Abercrombie & Co Analysis
 Optus downside represents upside risk to our sell recommendation. Given subscriber growth is a key
 Diagram 25: Impact of Risk on driver of TLS’s mobile revenue, the upside risk will be material if it minimises growing attrition rates. While
 $4.00 Base DCF Value Optus appears confident that it can continue to increase subscription for its exclusive football streaming
 service, its World Cup streaming failure meant it could recoup little of its exclusive license for the World
 $3.00 Cup and the negative publicity would disincentivise TLS customers to switch.
 $2.00 Impact on Valuation: In this bull-case scenario, our analysis suggests that TLS’s churn in the mobile
 segment could decrease from 10.9% to 9.5% (FY18-19). Further, this will keep subscriber growth from
 $1.00 declining and TLS’s subscription will hold at 4% in FY19. This poses 2.4% upside to our base case DCF.
 $0.00 Mitigant: We believe Optus’ monopoly over international soccer in Australia, and better quality and
 quantity of viewing times (over SBS), will differentiate it from other phone/broadband bundling products.
 F
 F1
 F2

 1
 2
 1
 2
 M
 M
 C
 C
 C
 D

 [F2] Growth Risk - Telstra Enterprise (Medium Likelihood, High Impact)
 se
 Ba

 Source: Abercrombie & Co Analysis Any accelerated performance in TLS Enterprise will force upward share price revision. All telcos have
 been trying to pivot away from a ‘pure’ telco and avoid the fate of becoming ‘old pipe’ networks with
 Diagram 26: Investment Risk negligible other revenue streams. Success of business-related applications, 5G related business
 Matrix innovations and uptake of TLS’s Programmable Network which links all corporate solutions inside/outside
High Impact on TLS in the

 of Australia serves as a risk with high impact. It derives value as an ‘optionality’ for underlying network
 capabilities and offers potential for TLS to adopt the trading multiple of an evolving tech company.
 Next Year

 M1 F2
 Impact on Valuation: The growth of enterprise solutions could drag TLS out of a competitive commercial
 environment. We forecast Data and IP and NAS segment EBITDA growth to sustain revenue growth of
 10% and 30% respectively from FY20-23. This poses 35.7% upside to our DCF value. Taking EV/EBITDA
 multiples of enterprise focused firms gives a valuation at 96% premium to the relative valuation.
 C1
 Mitigant: We hold that TLS’s offerings in Enterprise will remain secondary to its core business as (1) the
 F1
 10% margins are lower than the 40% earned in mobile and (2) the bureaucratic structure and multitude
 of offerings limits its manoeuvring ability relative to smaller start-ups.
 M2
 Competitor-Based Risks
 C2 [C1] Merger Falls Short (Moderate Likelihood, Moderate Impact)
 If TPM-VHA accepts price stability, it reduces pressure on TLS’s mobile revenue, raising ARPU with an
 equilibrium state of 3 main telcos. This would greatly impact our valuation, as it quells the anticipated
 High Likelihood of Realising price war that TPM’s entrance into mobile with $0 unlimited data plans ($10 after 6 months) was expected
 in the Next Year
 9
 Source: Abercrombie & Co Analysis
You can also read