CARBON ROAD-MAP: A PATH TO NET ZERO - A plan to meet society and climate change needs - Sustainable Aviation
←
→
Page content transcription
If your browser does not render page correctly, please read the page content below

CARBON
ROAD-MAP: A
PATH TO NET ZERO
A plan to meet society and climate change needs

sustainableaviation.co.uk

Sustainable Aviation (SA) believes the data forecasts and analysis of this report to be correct as at the date of publication. The opinions contained in this report, except
where specifically attributed to, are those of SA, and based upon the information that was available to us at the time of publication. We are always pleased to receive
updated information and opinions about any of the contents.

All statements in this report (other than statements of historical facts) that address future market developments, government actions and events, may be deemed
‘forward-looking statements’. Although SA believes that the outcomes expressed in such forward-looking statements are based on reasonable assumptions, such
statements are not guarantees of future performance: actual results or developments may differ materially, e.g. due to the emergence of new technologies and applications,
changes to regulations, and unforeseen general economic, market or business conditions.

CONTENTS

FOREWORD                                              6. CARBON PRICING THROUGH EFFECTIVE
                                                      MARKET-BASED MEASURES
EXECUTIVE SUMMARY
                                                      6.1 Context for effective market-based measures
1. INTRODUCTION                                       6.2 Determining the UK aviation residual
1.1 Purpose and scope of this decarbonisation             emissions to 2050
     road-map                                         6.3 Requirements for effective market-based
1.2D evelopments in science based climate                measures
    change targets and UK policy                      6.4 Assumptions for effective market-based
1.3 UK aviation CO2 emissions performance                  measures in the road-map
                                                      6.5 Development of emission reduction options
2. 2050 EMISSIONS: HYPOTHETICAL
                                                      6.6 Opportunities for smart policy mechanisms
‘NO-IMPROVEMENTS’ SCENARIO
2.1 Introduction                                      7. IMPROVEMENTS IN AIR TRAFFIC
2.2 Defining ‘Growth in Aviation Activity’            MANAGEMENT AND OPERATIONS
2.3 The Hypothetical ‘No-Improvments’ Scenario        7.1 Introduction
                                                      7.2 Air traffic management
3. THE SUSTAINABLE AVIATION
                                                      7.3 Aircraft operations
DECARBONISATION ROAD-MAP
                                                      7.4 Airport operations
3.1 Introduction
                                                      7.5 Supporting products, technologies and
3.2 The 2020 decarbonisation road-map
                                                           research programmes
3.3 Recommendations to government
                                                      7.6 Potential CO2 savings from ATM and
                                                          operations
4. IMPROVEMENTS IN AIRCRAFT
AND ENGINE EFFICIENCY
                                                      GLOSSARY
4.1 Introduction and framework
4.2 Contributing factors                              REFERENCES
4.3 Baseline fleet characteristics                   FOOTNOTES
4.4 Fleet refresh model - General characteristics     APPENDICES
4.5 ‘Known’ aircraft: CO2- Reduction opportunity       Appendices to Chapter 1: Introduction
4.6 ‘Future’ aircraft: CO2- Reduction opportunity    Appendix 2: Hypothetical ‘No-Improvements’
4.7 ‘Future aircraft’ - Comparison with external       Scenario - Data Sources, Assumptions and
     references                                         Calculations
4.8 ‘Future’ aircraft efficiency - Enabling            Remaining appendices
     technologies

5. SUSTAINABLE AVIATION FUELS
5.1 Introduction
5.2 The Opportunities - a new sustainable fuels
     sector in the UK
5.3 Overcoming barriers
5.4 Potential CO2 savings

                                                                                      Carbon Report   2
FOREWORD

2020 is a critical year for global climate   of the benefits that brings to the UK’s
action. Amidst growing consensus that        economy and society. Indeed, the UK
the global community must act now            can develop its role as a global leader
to avoid the worst consequences of           in sustainable aviation technologies –
climate change, the UK will host world       innovating and introducing new, low
leaders at COP 26 in Glasgow. Aviation       carbon technologies, from new engine
has to play its full part in delivering      and aircraft designs to ground-breaking
a zero carbon future, and it is with         sustainable aviation fuels. A successful,
considerable pride that alongside the        sustainable aviation sector offers
publication of our new Decarbonisation       tremendous opportunities for the UK
Road-Map, UK aviation as represented         to create new highly skilled and highly
through Sustainable Aviation, has            paid jobs.
become the first national aviation sector
to commit collectively to achieving net      In the coming years aviation will
zero carbon emissions by 2050.               change, alternative fuels will power
                                             more long haul flights, aircraft will
Our commitment is a considerable             become more efficient and increasingly
step forward from the existing global        electrified, and precision satellite
industry target to half net emissions        guidance will drive further efficiencies.
by 2050, and recognises the need for         Aviation is determined to deliver these
aviation to go further, faster in reducing   changes to meet the critical challenge
our carbon footprint. We call on the         of climate change, but we cannot do
international bodies to build on the         so alone. Alongside this new Road-
achievements that have been made             Map and the industry’s commitment
to date by establishing a new                is a call to work in close partnership
long-term target, which is led by            with UK Government. This collaborative
climate science and consistent with          approach is essential to achieving the
the Paris Agreement.                         opportunities to decarbonise, and to
                                             ensure that the UK leads internationally
Sustainable Aviation’s new                   - delivering a global framework to
Road-Map, draws upon the latest              address aviation emissions in what is,
science and innovative opportunities         by definition, an international industry.
to decarbonise aviation. It shows that
it is possible for UK aviation to achieve
net zero carbon meeting anticipated
increasing demand for flying, with all
EXECUTIVE SUMMARY
Sustainable Aviation Carbon Road-Map: A Path to Net Zero Emissions
Climate change is a clear and pressing issue for people, businesses and governments across the world. Net zero carbon is within reach
for UK aviation, if we all play our part.
By 2050, the UK aviation industry can achieve net zero carbon emissions through the following initiatives compared with a scenario of
growth at today’s efficiency:
• 4.3 Million Tonnes of carbon dioxide (MtCO2) saving due to carbon pricing impact on demand
• 3.1 MtCO2 saving from better air traffic management and operating procedures
• 23.5MtCO2 saving from introduction of known and new, more efficient aircraft
• 14.4MtCO2 saving from sustainable aviation fuels
• 25.8 MtCO2 saving from Effective carbon Market Based Measures
Our Road-Map draws on expertise from all corners of the UK aviation industry, including airlines, airports, aerospace manufacturers
and air navigation service providers. It is based on a thorough review of the opportunities to cut aviation carbon emissions through
smarter flight operations, new aircraft and engine technology, modernising our airspace, the use of sustainable aviation fuels and
significant investment in carbon reductions through effective carbon market-based policy measures.
With these actions, the UK will be able to accommodate 70% growth in passengers through to 2050 whilst reducing net emission
levels from just over 30 million tonnes of CO2 per year down to zero.
DecarbonisationDecarbonisation Road-Map
Road-Map for UK Aviation for UK Aviation
70
Activity Growth (without carbon price)
Effect of carbon price on demand
]
Within-sector CO2 reduction
UK Aviation Carbon Emissions (MtCO2)
60 Improved Operations / ATM using
Fleet Upgrades, with known aircraft types less
50 Fleet Upgrades, with future aircraft types fuel
Sustainable Fuels
MBMs (EUETS + CORSIA)
40
MBMs (TBD)
Additional MBMs (TBD)
30
Net Emissions
Potential
pa th to glob
20 al indust
(50% of ry goal
MBMs
Po 2005 lev
ten el)
tial
pat
ht
10 on
et z
ero
0
2016 2018 2020 2022 2024 2026 2028 2030 2032 2034 2036 2038 2040 2042 2044 2046 2048 2050
Opportunities to deliver net zero emissions for UK aviation
Effect of carbon price on demand
UK Aviation Carbon Emissions (MtCO2)
Airspace and operational improvements
80
Fleet upgrades with new aircraft technology
70 Sustainable Aviation Fuels
60
MBMs (including EU ETS, CORSIA and carbon removal measure
UK aviation CO2 emissions
50
40
30
20
10
0
2016 2050 Do nothing 2050 Emission Reduction 2050 Emission once
Options reductions are
implemented
Carbon Report 4
EXECUTIVE SUMMARY

Sustainable Aviation Road Map To                                      • Reform the Renewable Transport Fuel Obligation - a
                                                                        requirement on transport fuel suppliers to ensure a
Net Zero Emissions (continued)                                          percentage of fuel is supplied from sustainable sources by a
                                                                        given period - to incorporate Recycled Carbon Fuels and other
To deliver this will require a partnership approach with                advanced fuel technologies, remove barriers to production,
Government to ensure the opportunities to cut emissions are             and apply at least a 1.2x multiplier for the right kinds of SAF
realised through smart low carbon policies, collaborative actions       developmental fuels to help suppliers prioritise SAF
from outside the aviation sector and substantial investment from
industry and Government in the next generation of sustainable         Airspace Modernisation
aviation breakthroughs.
                                                                      Delivery of airspace modernisation: Government must maintain
As a part of a global industry, with global emissions, the UK         a vital leadership role on airspace modernisation, the most
Government and industry must also take an international               significant upgrade to the Critical National Infrastructure that
approach to ensure UK actions on emissions do not create              is UK airspace since the 1950s. This role needs to ensure that
unintended carbon emissions elsewhere outside the UK or               timely progress is delivered to ensure reductions in carbon
undermine the UK’s international connectivity.                        emissions are realised.

We ask the UK Government to support this commitment in the
following ways:                                                       Effective Market Based Policy Measures
                                                                      Effective carbon market-based policy measures are vital to
Improvements in Aircraft and Engine Efficiency                        ensure aviation’s net emissions will reduce in line with climate
                                                                      goals and to establish carbon pricing. We will fully support UK
With the right support from Government our world-class                Government in working to strengthen this framework globally.
aviation and aerospace sectors are uniquely placed to
capitalise on the opportunities of green aviation technology –        • Government should work within the International Civil
such as new propulsion systems, including hybrid and electric           Aviation Organisation (ICAO), a United Nations body, to
technology, and lighter, more efficient aircraft.                       support the Carbon Offsetting & Reduction Scheme for
                                                                        International Aviation (CORSIA)
• Government should continue to support aerospace research
  and development through the Aerospace Growth Partnership,           • Through ICAO, set a clear, long term CO2 target for global
  and consider accelerating technology development through              aviation at the 2022 general assembly compatible with the
  increased investment in the Aerospace Technology Institute (ATI)      International Panel on Climate Change (IPCC) 1.5 degree
                                                                        report and 2015 Paris Climate Summit ambition, and develop
                                                                        a framework that will support delivery of the 2050 long-term
Sustainable Aviation Fuels                                              CO2 target
It is essential that the UK recognises the immediate and              • Progress United Nations Framework Convention on Climate
significant role of sustainable aviation fuels (SAF), which             Change (UNFCCC) negotiations on Article 6 of the Paris
have the potential to start reducing UK aviation emissions in the       Agreement enabling development of global carbon markets
mid-2020s and to reduce aviation emissions by at least 32%
in 2050. Actively driving a domestic SAF sector would put the         Carbon Capture and Storage (CCS)
UK at the forefront of world leading aviation climate solutions,
create thousands of clean growth jobs and provide a significant       The use of robust carbon offsets and investment in innovative
UK export opportunity as aviation decarbonises globally. We ask       carbon removal solutions will be vital to address residual UK
Government to:                                                        aviation emissions by 2050. We ask the government to:

• Provide the essential, high-level cross-departmental                • Raise ambition on carbon capture, utilisation and storage
  co-ordination necessary (e.g. through a new Office for                (CCUS) deployment and commit to supporting at least two
  Sustainable Aviation Fuels or similar body) to secure the             clusters to be operational by 2025
  policies needed to support the development and commercial
  deployment of SAF, and deliver matched public/private               • Work with industry to ensure UK carbon removal solutions are
  funding of £500m over five years (totalling £1bn) to support          eligible for airline investment through CORSIA
  flagship first-of-a-kind commercial plants, to provide an initial
  boost to the sector

5     Carbon Report
INTRODUCTION

Sustainable Aviation is an
established UK industry group
which sets out the collective
approach of UK aviation to
tackling the challenge of
ensuring a cleaner, quieter,
smarter future for our industry.
Launched in 2005, it is a
world first bringing together
of major UK airlines, airports,
manufacturers, air navigation
service providers and key
business partners1.
INTRODUCTION

    Members

    Signatories

7     Carbon Report
INTRODUCTION
1.1 Purpose and scope of this 1.2 Developments in science based
Decarbonisation Road-Map climate change targets and UK policy
This Road-Map sets out Sustainable Aviation’s view of the Since our 2016 CO2 Road-Map was published new scientific
expected growth in UK aviation activity and the contribution that evidence has been provided by the UN Intergovernmental
can be made by different measures to achieve net zero carbon Panel on Climate Change (IPCC)1 on the need to limit global
emissions over the period to 2050. It is based on the latest temperature rise to 1.5⁰C. The report found that human activities
information available to us at the time of writing. are estimated to have caused approximately 1.0°C of global
warming above pre-industrial levels, with a likely range of
The Road-Map’s purpose is to inform debate, to highlight the 0.8°C to 1.2°C. In future, global warming is likely to reach 1.5°C
efforts being taken by the aviation industry to reduce its carbon between 2030 and 2052 if it continues to increase at the current
intensity, to assess the likely effectiveness of those efforts in rate. The report assessed that significant global impacts would
the specific context of UK aviation, and to identify areas where occur if temperature rises above 1.5⁰C occurred. They assessed
Industry and Government can do more. temperature rise could be limited at 1.5⁰C if global CO2 emissions
decline by about 45% from 2010 levels by 2030, reaching net
As with our previous CO2 Road-Maps, we interpret “UK zero around 2050.
aviation” to mean “flights which depart from UK airports”.
This is consistent with the accounting convention used by the Responding to this report the UK Government sought
UK to assess emissions from UK aviation. Due to the intrinsic advice from the UK Committee on Climate Change (CCC).
global nature of aviation, the UK aviation industry knows that In May 2019 the CCC issued their advice in their ‘Net Zero’
approaches to decarbonising aviation must be done as an report2. The report recommended the UK should set a target
international endeavour to have the desired impacts; unilateral for net zero greenhouse gas emissions by 2050. It also assessed
UK policy measures with respect to aviation emissions will do that aviation is likely to be the largest carbon emitter in the UK
little to mitigate worldwide climate change impacts. Carbon by 2050.
pricing mechanisms should apply internationally to avoid
competitive distortion and carbon leakage (where emissions In June 2019 the UK Government responded to this by setting
simply move to other airlines on the same or similar routes) and legislation requiring the UK to bring all greenhouse gas
secure, real and meaningful global net CO2 reductions. emissions to net zero by 20503. Regarding aviation emissions,
the Government clarified to Parliament that the target must cover
Besides carbon dioxide, emissions from aviation also the whole economy, including international aviation and shipping
include oxides of nitrogen (NOx), water vapour, particulates, (IAS) emissions, but further advice would be sought from the
carbon monoxide, unburned hydrocarbons, soot and oxides of CCC on how this could be best achieved.
sulphur (SOx). The climate impact of many of these is discussed
in a separate paper [SA, 2014a]. This Road-Map focuses purely In September 2019 the CCC sent a letter to the Government,
on CO2. setting out their advice on how to include aviation emissions4.
Specifically, they stated that the UK planning assumption for
Finally, the impact of changes to the carbon price and level of International Aviation should be to achieve net-zero emissions
Government support on UK aviation’s decarbonisation trajectory by 2050 (domestic UK aviation emissions are already included
have been considered to aid further debate. in UK carbon targets). They recommended this is reflected in the
UK Aviation Strategy (currently under development). In addition
to ‘in sector’ emission reductions the CCC also stated that this is
likely to require some use of greenhouse gas removals (GGRs) to
offset remaining emissions.
At the time of writing the UK Government have yet to respond
to this CCC letter. A consultation on the ‘decarbonisation of
transport’ is planned5 with the expectation that this will inform
the final Aviation Strategy white paper6.
Carbon Report 8INTRODUCTION
1.3 UK aviation CO2 emissions performance
Currently UK aviation gross emissions account for 7% of total UK carbon emissions2. In 2017 the gross emissions from flights
departing the UK was 37 MtCO2, up by 20 MtCO2 since 1990. As a result of MBM’s there has been a Net reduction of emissions in
2017 of 5.2 MtCO2. Therefore the overall net emissions in 2017 for the same flights were 32 MtCO2.
1.3.1 Comparison of UK emissions by sector (2017 versus 1990)
UK 1990 CO2 emissions by sector (MtCO2) UK 2017 CO2 emissions by sector (MtCO2)
60 14 11
17 20
160 Other 82 Other
67 Road and Rail 37 Road and Rail
) Energy Supply Energy Supply
17
Business 46 Business
54 Residential Residential
113 Agriculture 116 Agriculture
Aviation (Domestic and International) Aviation (Domestic and International)
80 Waste Management 67 Waste Management
Shipping (Domestic and International) Shipping (Domestic and International)
Industrial Processes Industrial Processes
114
80
278 113
Source: UK Government greenhouse gas statistics
1.3.2 Aviation emissions in context
Since 1990 aviation gross emissions have risen significantly both at a global and UK level. More widely carbon emissions globally have
risen by 60% whilst in Europe and the UK they have been reducing due to a significant replacement and upgrading of the fleet with a
much lower increase in passenger flights compared to the global picture.
Year Global emissions Global Aviation EU Emissions EU Aviation UK Emissions UK Aviation
(All sectors) Emissions (All sectors) Emissions* (All sectors) Emissions**
1990 20,520 410 4,023 88 818 17
2017 32,840 859 3,209 171 503 37
% Chg 2017 60% 110% -20% 94% -39% 114%
vs 1990
Source IEA IATA IEA EASA UK Government UK Government
All carbon figures are reported in MtCO2
NOTES:
* Latest published data is 2016
** includes international and domestic emissions
9 Carbon ReportINTRODUCTION
1.3.3 Annual changes in UK aviation emissions
Since 1990 emissions from flights departing the UK have more than doubled. However, since 2005 UK aviation has decoupled
growth in activity from carbon emissions3 due to significant fleet upgrades. This mirrors the changes in UK aviation fuel use reported
by the Government4.
UK Aviation CO2 emissions - MTCO2e (using UK Govt figures)
50
Domestic emissions (excl. airport vehicles)
45
International emissions
2005 Baseline
40 UK airport passengers
35
30
25
20
15
10
5
0
1990
1991
1992
1993
1994
1995
1996
1997
1998
1999
2000
2001
2002
2003
2004
2005
2006
2007
2008
2009
2010
2011
2012
2013
2014
2015
2016
2017
Source: Data from UK Government Greenhouse Gas statistics (2005 used as peak emissions)
Changes in UK aviation carbon emissions and passengers since 2005
50.0 400
International emissions
UK Aviation Carbon Emissions (MtCO2e)
Passengers using UK airports
Millions
Domestic emissions
40.0
300
(excl. airport vehicles)
UK airport passengers
30.0
200
20.0
10.0
A 25% growth in passengers delivered with a 100
3% reduction in carbon emissions since 2005
0.0 -
20
20
20
20
20
20
20
20
20
20
20
20
20
05
06
07
08
09
10
11
12
13
14
15
16
17
Source: Data from UK Government Greenhouse Gas statistics
Carbon Report 10INTRODUCTION
1.3.4 Summary of significant recent Sustainable aviation fuels
industry innovations
• Publishing a UK specific Road-Map in 2014, highlighting the
Disconnecting growth in aviation activity from CO2 emissions potential for SAF
is due to a combined range of initiatives from across the • By 2018, building a SAF special interest group network of
aviation industry. over 400 in the UK
• Between 2005 and 2016 Sustainable Aviation’s member • Almost 200,000 flights worldwide have now taken place
airlines carried 26% more passengers and freight but only using SAF
grew absolute CO2 emissions by 9%5 • There are now six qualified routes to making SAF
• This has been achieved by UK airlines who, since 2005, • SAF is now included in the UK Renewable Transport Fuel
have introduced more than 470 new aircraft into service, Obligation, helping to reduce the gaps in terms of compared
representing an investment of over £37.6 billion to fossil jet fuel and incentives favouring ground transport
• The UK Aerospace Technology Institute (ATI) has funded 260 biofuels
projects with a grant value of £1.3 Billion up to October 2019.
The UK Aerospace industry itself has invested some XXbn on Effective carbon market-based measures
new technology development over the same period (MBMs)
Aircraft operations & Airspace management • 5.2 Mt CO2 reduction in net emissions as a result of
compliance with the EU Emissions Trading System in 2017
• Development of new UK policy and guidance agreed to
• Development and implementation by ICAO of the global
modernise UK airspace 2019
aviation Carbon Offset and Reduction Scheme for
• Introduction of over 425 airspace initiatives within the UK International Aviation (CORSIA) with robust sustainability
offering aircraft more direct routes and vertically efficient flight eligibility criteria for carbon emissions reduction units. Key
profiles. These arise from changes to the structure of airspace, requirements being:
improvements to the tactical delivery of flight profiles, new
• The greenhouse gas reduction or removal used as an
controller support tools and concepts of operation
offset need to be ‘additional’ to business-as-usual
activity
• Improvements to aircraft operations from higher passenger
load-factors, better optimisation of aircraft fuel-loading and • Offsets must also represent a permanent reduction of
miscellaneous measures such as maintenance of door seals and emissions that cannot be reversed
repairing of dents, regular cleaning of engines and airframes,
• An activity that generates offsets should not result in
and reducing aircraft on-board weight
unintended increases in emissions elsewhere
• Improvements to reduce emissions on the ground by replacing
the use of aircraft Auxiliary Power Units with more efficient
airport infrastructure
Aircraft technology
• Introduction of the Airbus A350, A330neo and A320neo,
Boeing 787, 737 MAX and other latest generation aircraft into
airline operations
• Development of new engine technology such as the
Rolls-Royce Trent XWB
11 Carbon Report2050 EMISSIONS: HYPOTHETICAL ‘NO-IMPROVEMENTS’ SCENARIO Summary Our hypothetical no improvement scenario sets out the ‘do nothing’ case. It is derived from the UK Government 2018 aviation forecast, assuming no carbon price, and shows a 90% growth in aviation activity to 2050 and assumes this extra activity is delivered with no improvement in the aircraft technology, fuel or the way we operated the aircraft in 2016. Based on this approach carbon emissions from UK aviation would grow with extra flights and rise from around 37 Mt of CO2 in 2016 to around 71 Mt in 2050. Progressively applying a carbon price that rises to around £220 a tonne of CO2 by 2050, to UK aviation emissions is estimated to reduce demand for flying, reducing CO2 emissions in 2050 to around 67 million tonnes. This has been built into our UK aviation demand baseline.
2050 EMISSIONS: HYPOTHETICAL
“NO-IMPROVEMENTS” SCENARIO

2.1 Introduction                                                         2. The ‘no carbon price’ scenario

This chapter sets out the hypothetical path that UK aviation’s             This modifies the base case by assuming there is no carbon
CO2 emissions would follow without any action to improve the               price. This would effectively make flying cheaper which is
carbon efficiency of flights relative to a year 2016 baseline, and         expected to increase the demand to fly. Our work has applied
in the absence of a carbon price. Specifically, this assumes a             the same change in demand assumed by the DfT 2017
locked level of aircraft and engine technology, airspace system            Aviation Forecast ‘no carbon price’ sensitivity results8 which
and operational flight efficiency plus sustainable aviation fuel           predicts an 11% increase in passenger demand to travel in
penetration as achieved in 2016. Extra flights are then added to           2050 compared to the base case scenario.
this constant performance level assuming the same load factors,
on the same types of aircraft, airspace system operational               3. The ‘realistic carbon price’ scenario
techniques and fuel used. The results provide a hypothetical
“no-improvements” trajectory for UK aviation CO2 and serves                This modifies the base case scenario by applying a carbon
as a reference against which the potential impact of anticipated           price only to UK aviation CO2 emissions for which permits
improvements, and the impact upon demand of carbon pricing,                must be paid for according to the current criteria of the
can be assessed.                                                           European Union Emissions Trading System (EU ETS) and
                                                                           the UN Carbon Offsetting and Reduction Scheme for
Clearly, this hypothetical scenario does not correspond to a               International Aviation (CORSIA) to 2035. In the initial years
“business as usual” scenario, since “business as usual” involves           to 2035 the cost of compliance with EU ETS and CORSIA
the rigorous pursuit of cost-reduction opportunities and improved          does not equate to all UK aviation carbon emissions having
fuel efficiency as set out in the introduction to this Road-Map.           the full carbon unit cost applied. By 2035 it is assumed that
                                                                           UK aviation emissions face around a third of the full carbon
2.2 Defining ‘Growth in Aviation Activity’                                 unit cost when averaged out. Between 2035 and 2050 it
                                                                           assumes an increasing proportion of the full carbon unit cost
Understanding how demand for air travel from the UK will                   is applied to UK aviation emissions reaching 100% by 2050.
change between now and 2050 is crucial before then assessing               This assumption causes demand suppression to be less
how carbon emissions will change and how they can be                       compared to the base case scenario over this period
managed. Since 2008 Sustainable Aviation has used forecasts
for aviation growth produced by the UK Government. At the
time of writing the most recent forecast was published in 2018
within the ‘Beyond the Horizon – The future of UK Aviation -
Making Best Use of Existing Runways’ document7.

This includes the opening of a third runway at Heathrow by
around 2030 as set out in the Airports National Policy Statement
(NPS), plus it allows for all UK airports to make best use of their
existing runway capacity.

We also show how applying a carbon price to aviation emissions
could change demand for flying. This is calculated using three
different scenarios.

1. The base case scenario
     This is the published UK Government 2018 ‘Making best use of
     existing runways’ forecast, also referred to in this work as ‘LHR
     NWR + MBU’ (Department for Transport (DfT) scenario for
     London Heathrow North West Runway and make best use). It
     includes built in assumptions about how carbon price affects
     demand6 and uses a carbon price trajectory which rises to
     £221 per tonne of CO2 by 2050. It assumes this cost is applied
     to every tonne of CO2 emitted by flights departing the UK.

13      Carbon Report
2050 EMISSIONS: HYPOTHETICAL
“NO-IMPROVEMENTS” SCENARIO
2.2 Defining ‘Growth in Aviation Activity’ (continued)
The output of these scenarios is anticipated to produce different passenger demand forecasts to 20507 as shown.
Forecast of UK Airport Terminal Passengers (millions) depending on carbon price
Millions
550
No Carbon Price scenario
500
491 Realistic Carbon Price scenario
In both the ‘base case’ and ‘realistic 462 Base Case
carbon price scenario’, carbon price
450 rises to £221 per tonne of CO₂ in 2050
444
400
350
Forecast
300
Historic
250
200
2005 2010 2015 2020 2025 2030 2035 2040 2045 2050
The average annual growth rates for passengers in this work The rest of this chapter sets out how this forecast has been
are in line with those assumed by the UK Government’s aviation used to define the hypothetical no improvement baseline for the
forecasts. For the three scenarios presented, the growth rates decarbonisation Road-Map.
vary from 1.5% per annum for the base case to 1.8% per annum
for the no carbon price. These are significantly lower than growth
rates anticipated in other parts of the world. Globally, growth
2.3 The Hypothetical
rates of over 4% per annum are predicted8. “No-Improvements” Scenario
To calculate the contribution from freight-only flights a range of The carbon emissions from UK aviation activity, for each carbon-
assumptions have been made. These are detailed in Appendix 2.5. cost scenario, have been calculated assuming no improvement
in the 2016 aircraft and operations efficiency level, referred to as
To best determine emissions from growth in aviation activity ‘Hypothetical no improvement’.
it is important to understand the distance flown. We have
based our emission calculation on distance information provided For the ‘base case’ scenario the ‘no improvement’ carbon
by the UK Government set out below (this includes the new emissions are calculated in three steps.
runway at Heathrow).
• First by determining the combined passenger and freight
Passenger distance flown (million km) distances flown. The passenger distance flown in kilometres
has been supplied by the UK Government for the 2018
making best use forecast (base case scenario). It is assumed
1,300,000
that passenger flights (many of which also carry some
1,200,000
freight in the belly-hold) account for 97% of UK aviation CO2
emissions. The final 3% of UK aviation’s CO2 emissions is
1,100,000 assumed to be accounted for by dedicated freight-only flights
1,000,000
• Secondly, how these figures change compared to the base
year of 2016 is then calculated
900,000
• Finally, the 2016 base year carbon emissions are multiplied
800,000 by the index change in total distance flown for each year from
2017 to 2050
700,000
600,000
2016 2018 2020 2022 2024 2026 2028 2030 2032 2034 2036 2038 2040 2042 2044 2046 2048 2050
Carbon Report 142050 EMISSIONS: HYPOTHETICAL
“NO-IMPROVEMENTS” SCENARIO
2.3 The Hypothetical “No-Improvements” Scenario (continued)
Carbon emissions for the ‘no carbon price’ and ‘realistic carbon price’ are then calculated by modifying the results of the ‘base case’
scenario. Specifically, these have been calculated as follows9:
• ‘No carbon price’ annual emissions = Base case emissions multiplied by percentage change in passenger demand forecast in Table
41 of the DfT 2017 Aviation forecast10
• ‘Realistic carbon price’ annual emissions = no-carbon-price emissions minus [proportion of CO2 emissions incurring a price *
(no-carbon-price emissions minus base-case emissions)]
An iterative procedure was employed to take account of the feedbacks between changes in aviation activity and changes in emissions,
hence in changes in the number of tonnes of CO2 regulated, the associated cost of compliance, which in turn affects demand.
2.3.1 Resultant carbon emissions for scenarios
Hypothetical no improvement UK aviation CO2 emission scenarios (million tonnes)
Millions
75
71
No Carbon Price scenario
70
Realistic Carbon Price scenario
In both the ‘base case’ and ‘realistic 67
Base Case
carbon price scenario’, carbon price
65 rises to £221 per tonne of CO₂ in 2050
64
60
55
50
45
40
35
30
2016 2018 2020 2022 2024 2026 2028 2030 2032 2034 2036 2038 2040 2042 2044 2046 2048 2050
Using the methodology set out, this chart shows how UK ‘DfT 2017 Aviation Forecast’. Therefore, such a scenario could
aviation carbon emissions to 2050 vary for the three scenarios. only be achieved if additional UK airport passenger capacity
were approved, beyond that assumed by the DfT in their 2017
The Sustainable Aviation ‘realistic carbon price’ scenario Aviation Forecast.
represents a growth in aviation activity to 462 million
passengers and 3.2 million air transport movements per year Based on these results it can be concluded that applying to
by 2050. Assuming (hypothetically) no improvement in the UK aviation CO2 emissions a carbon price which rises to £221
carbon efficiency of flights, this would be expected to produce a tonne by 2050 will reduce demand by around 30 million
67 MtCO2 from UK aviation in 2050. passengers per year and reduce carbon emissions from UK
aviation by around 4 MtCO2 per year in 2050 compared to not
The UK government 2018 ‘base case’ scenario corresponds to having a carbon price.
444 million passengers and 3 million air transport movements
per year by 2050. Assuming no improvement in the carbon Due to the high level of demand for air travel however, even
efficiency of flights, this would be expected to produce 64 MtCO2 with a carbon price applied, passenger numbers are expected
from UK aviation in 2050. to grow by 73% by 2050 relative to 2016.
Finally, in the ‘no carbon price’ scenario, passenger numbers These results are used to introduce a new, first wedge to the SA
could grow to 492 million with 3.4 million air transport CO2 Road-Map. It is called ‘Effect of carbon price on demand’
movements and, with no improvement, would produce 71 and appears prior to the industry ‘in sector’ and ‘out of sector’
MtCO2 by 2050. The passenger numbers in this scenario exceed CO2 mitigation wedges, used in previous versions of the SA CO2
the DfT modelled UK airport passenger capacity, based on the Road-Map.
15 Carbon ReportTHE SUSTAINABLE AVIATION DECARBONISATION ROAD-MAP 3.1 Introduction This CO2 Road-Map has drawn on expertise from all actors across the UK aviation industry, including and beyond governments, science and NGO’s airlines, airports, aerospace manufacturers and air navigation service providers. Starting from UK-specific aviation demand-growth forecasts which also takes account of additional runway capacity in the South East of England. The rest of this document sets out in a transparent manner the assumptions underpinning our Road-Map, the method of working used to transform our assumptions into the results of our analysis, and the distinction between those areas in which quantitative data-driven analysis has been possible and those areas where informed judgement has been necessary.
THE SUSTAINABLE AVIATION
DECARBONISATION ROAD-MAP
3.2 The 2020 Decarbonisation Road-Map
Our Road-Map is developed using the latest knowledge, data and experience from across SA members and beyond. The resulting
opportunities are considered out to 2050 and to demonstrate their decarbonisation potential they have been compared against latest
UK Government demand growth forecasts and a hypothetical scenario where no improvements in aviation emissions are achieved.
The results are split into ‘in sector’ and ‘out of sector’ decarbonisation opportunities. The ‘in sector’ opportunities show our view of
the most likely carbon reduction developments from airspace modernisation, new aircraft technology and how these are incorporated
into airline fleets and the development and use of sustainable aviation fuels. The ‘out of sector’ opportunities explore the potential
of carbon capture and storage innovations, plus carbon trading and offsetting measures. In making this distinction we are explicitly
including airlines, airports, and airframe and engine manufacturers OEMs and oil companies as ‘in sector’.
Our Road-Map uses the ‘no carbon price’ and ‘realistic carbon price’ scenarios as defined in Chapter 2. These bound the first wedge
on the chart to define the expected growth in UK aviation emissions in a ‘no carbon price’ situation from 37 MtCO2 in 2016 to 71
MtCO2 in 2050. Carbon pricing through effective carbon market-based measures affects demand by 6% and reduces emissions by 4
MtCO2 in 2050.
DecarbonisationDecarbonisation Road-Map
Road-Map for UK Aviation for UK Aviation
70
Activity Growth (without carbon price)
Effect of carbon price on demand
]
Within-sector CO2 reduction
UK Aviation Carbon Emissions (MtCO2)
60 Improved Operations / ATM using
Fleet Upgrades, with known aircraft types less
50 Fleet Upgrades, with future aircraft types fuel
Sustainable Fuels
MBMs (EUETS + CORSIA)
40
MBMs (TBD)
Additional MBMs (TBD)
30
Net Emissions
Potential
pa th to glob
20 al indust
(50% of ry goal
MBMs
Po 2005 lev
ten el)
tial
pat
ht
10 on
et z
ero
0
2016 2018 2020 2022 2024 2026 2028 2030 2032 2034 2036 2038 2040 2042 2044 2046 2048 2050
Using the assumptions provided on aircraft operational and air traffic management improvements around a 4% reduction in CO2
emissions is added as shown in the pale green wedge.
Introduction of new and future aircraft technology offer the greatest in sector opportunity to reduce CO2 emissions. Known aircraft
technology (darker green wedge) are forecast to deliver a 17% fuel efficiency improvement by 2050 and for future aircraft technology
(green dotted wedge), the figure is 24% compared to 2016. This results in a combined potential reduction in UK aviation CO2 emission
of 37% by 2050 from aircraft technology.
Developing and growing the use of sustainable aviation fuels contributes up to 32% reduction in emissions by 2050.
Combined, the in-sector CO2 reduction measures provide the opportunity to remove 41 of 71 million tonnes of CO2 per year from UK
aviation activity in 2050 compared to a no improvement situation from 2016.
To achieve the goal of net zero emissions by 2050 effective – market based measures (MBMs) developed internationally, building on
the CORSIA mechanism, will be necessary to obligate airlines to also invest in carbon reductions from outside of the aviation sector. In
2050 this will require around 26 million tonnes of CO2 to be offset or removed outside of aviation.
17 Carbon ReportTHE SUSTAINABLE AVIATION
DECARBONISATION ROAD-MAP
3.2 The 2020 Decarbonisation Road-Map (continued)
The exact level of MBMs required in 2050 will depend on the rate of take up of other technology solutions e.g. new aircraft, engines or
SAFs that can be achieved reasonably cost effectively over this period. While in-sector emission reductions are initially expected to be
more expensive that offsets in the early technology development phase, over time we expect costs to drop significantly. Higher carbon
prices will also drive investment into in-sector emission reductions. Therefore the exact dependence of the sector on MBMs is highly
dependent on both technology development and associated costs of carbon mitigation. However, SA believes there is an imperative
for the aviation sector to aim for as much carbon reduction within the sector as possible. To avoid competitive distortion and carbon
leakage (where emissions move between airlines on the same routes because of unilateral policies), and ensure effective and efficient
emissions reductions, international solutions established via UN and country-agreed policies such as CORSIA are essential as
unilateral action could simply move the carbon emissions away from the UK to another country (Carbon leakage). The aviation industry
is supporting UN and other bodies to encourage the most robust and effective policies possible.
Proposal/Timescale Sustainability benefit Short term Medium Term Long Term
(2019-2025) 2025-2040) (2040-2050 plus)
New aircraft technology Cleaner & quieter flights 360 latest generation Regional short range Increasing use of hybrid
(Purchase) aircraft joining UK hybrid electric flights electric for regional and
airlines from 2035 European flights
Sustainable Aviation SAF gives at least 70% Roll out of commercial By 2035: By 2050, c.4.5 million
Fuel (SAF) life cycle carbon saving plants. Ongoing fuel • 14 UK operational tonnes of UK SAF
compared to using testing and qualification plants creating up to produced per annum
fossil fuel 5,200 jobs delivering a reduction
in emissions of around
• C. 1.0 million tonnes
32%
of SAF produced per
annum
New aircraft technology Cleaner & quieter flights 360 latest generation Manufacturing of hybrid Increasing use of hybrid
(development and aircraft joining UK electric aircraft and next electric for regional and
deployment) airlines. Research for generation long-haul European flights
hybrid electric aircraft aircraft
and the next long-haul
aircraft
Effective Market Based Achieve net carbon • EU ETS for domestic Further development of Further development of
Measures (MBM’s) targets by reducing and European flights effective carbon MBMs Effective carbon MBMs
emissions outside of and carbon reduction and carbon reduction
• CORSIA for
the sector options such as Carbon options such as Carbon
International Flights
sinks and removal sinks and removal
from 2021
solutions solutions
• Improve natural
carbon sink solutions
• Develop carbon
removal solutions
Airspace improvements More efficient flights Delivering modernisation programme Airspace modernisation
(CO2, noise and air delivering reduction
quality improvements) in emissions and fuel
burn11
Carbon Report 18THE SUSTAINABLE AVIATION
DECARBONISATION ROAD-MAP
3.3 Recommendations to Government based on the Office for Low Emission Vehicles (OLEV) - and
by a commitment of at least £500m12 public private funding
over five years to deliver flagship plants and support nascent
To realise the potential set out in this Road-Map it is critical that
commercial UK production capability. These measures will
UK Government support industry commitments. Sustainable
help provide the essential cross-government co-ordination
Aviation recommends this is developed across four key areas:
necessary to progress the development and commercial
deployment of sustainable aviation fuels
3.3.1 Technology
• Reform the Renewable Transport Fuel Obligation: It is
With the right support from Government our world-class essential that Recycled Carbon Fuels are incorporated into
aviation and aerospace sectors are uniquely placed to The Renewable Transport Fuel Obligation (RTFO) to remove
capitalise on the opportunities of green aviation technology barriers to production, and that investment is supported
– be it more efficient gas-turbine engines, hybrid electric or through applying of at least 1.2x multiplier for SAF advanced
fully electric aircraft. These exciting technologies promise a developmental fuels. This will increase the attractiveness to
substantial reduction in CO2 emissions from UK aviation. investors giving a clear signal from HMG as to their intentions
and to the long term viability of this sector together with
• Government and industry must continue to support incentivising producers to manufacture SAF
aerospace research and development through the
Aerospace Growth Partnership. This is vitally important for
the long-term sustainability of the industry
3.3.3 Effective Carbon Market-based Measures
Sustainable Aviation recommends the Government work with
• Other measures such as effective carbon market-based
industry to address the following issues:
measures and new breakthroughs in advanced, affordable
sustainable aviation fuels (SAF) will meet the carbon
Global leadership in ICAO and UNFCCC: By 2022, work
reduction targets until future fleet technology secures
through ICAO to set a clear, long term CO2 target for aviation
further long-term solutions
compatible with the IPCC 1.5 degree report and 2015 Paris
Climate Summit ambition. Concerted, global action on aviation
3.3.2 Sustainable Aviation Fuels emissions is absolutely essential. COP26 in 2020 in Glasgow
presents an ideal opportunity for the UK to show climate change
It is essential that the UK recognises the immediate and leadership on the global stage by progressing the international
significant role of sustainable aviation fuels (SAF). SAF is framework for aviation emissions to support delivery of the 2050
the next big breakthrough for aviation carbon reductions long-term CO2 target. To support development of the wider
which desperately needs appropriate government support to carbon markets, UK government should continue to focus on a
become the mainstay of long-haul flights – necessary if UK successful outcome of UNFCCC negotiations on Article 6 of the
aviation is to get to net zero. SAFs have the potential to reduce Paris agreement.
UK emissions in 2050 by at least 30%, and offer at least 70%
lifecycle reduction in carbon emissions compared to current Align intra-European policy with CORSIA. UK government
fossil fuels. Full details are outlined in the SA partner publication, should transition from the current ETS model into a policy that is
the Sustainable Aviation Fuels Road-Map 2020. SAFs have the aligned with the CORSIA framework.
potential to bring multiple benefits to the UK, world-leading
breakthrough carbon solutions, clean growth, jobs, IP and Set a clear UK strategy to develop and implement carbon
improved fuel security. They are a fully tested and qualified removal projects and technologies across the UK. This should
technology compatible with today’s aircraft. UK airlines are include both natural carbon removal and technology-based
already investing heavily in SAF, including Virgin Atlantic and carbon removal solutions.
British Airways. But urgent government support is needed to
scale and commercialise sustainably robust and affordable SAF,
particularly given that other countries – like the Netherlands and
3.3.4 Airspace Modernisation
United States – are pulling ahead. A domestic SAF sector would
Delivery of airspace modernisation: Government must maintain
create thousands of jobs and provide a world leading export
a vital leadership role on airspace modernisation, the most
opportunity as aviation decarbonises globally.
significant upgrading of the critical national infrastructure of UK
airspace since the 1950s. This role needs to ensure that timely
To support the development of SAF:
progress is delivered to ensure reductions in carbon emissions
are realised.
• Through a new Office for Sustainable Aviation
Fuels (or something similar): Government must
recognise the importance of SAF through the creation of a
cross-departmental Office for Sustainable Aviation Fuels –
19 Carbon ReportIMPROVEMENTS
IN AIRCRAFT AND
ENGINE EFFICIENCY
Summary
1. Introduction of “known” aircraft types will improve
fleet-average fuel efficiency of UK aviation by some
17% by 2050 relative to the year 2016 baseline
fleet, with the bulk of this improvement delivered by
around 2040
2. Introduction of “future” aircraft types from 2035
onwards (including conventional and hybrid-electric
aircraft) and from 2040 onwards (pure-electric
aircraft on shorter range flights) has the potential
to further reduce fleet CO2 emissions within UK
aviation by some 24% by 2050, taking account of
likely fleet penetration by that date
3. T
his yields a combined potential reduction in CO2
from UK aviation by 2050 of some 37% relative to
the fuel-efficiency of a year 2016 baseline fleet
4. Post 2050, improvements in fleet-average fuel
efficiency will continue due to the ongoing
penetration into the fleet of “future” aircraft types.
Potentially, all-electric aircraft of progressively
greater range-capability could offer additional
substantial carbon reductions. However, those
improvements lie beyond the time-horizon of our
Road-Map
We acknowledge the significant levels of government
support to the UK aerospace industry provided
through initiatives such as the Aerospace Growth
Partnership (AGP) and Aerospace Technology
Institute (ATI). In the coming years Government must
ensure that access by UK aerospace industry to
ongoing funding for high-value collaborative R&D,
essential for delivering highly-efficient future aircraft
and propulsion systems, remains in place.IMPROVEMENTS IN AIRCRAFT
AND ENGINE EFFICIENCY
4.2.1 Fuel Price
Key features of the fleet refresh
model used in this 2019 road-map Historically, the cost of fuel has accounted for a substantial
proportion of the total cost of ownership of commercial
aircraft. Even in the brief period since our previous Road-Map
This Road-Map uses 2016 as its baseline year, while our
in 2016, fuel prices have risen significantly. The International
previous Road-Map used 2010 as its baseline year. Fleet
Air Transport Association (IATA) estimates that in 2019 the
upgrades performed in the 2010-2016 period clearly do not
global aviation sector would spend some $206 billion on fuel,
fall within scope of our current Road-Map. As a result, the
representing 25% of operating costs14.
remaining fuel-efficiency improvement opportunity due to
upgrading the year-2016 fleet with “known” aircraft types
is correspondingly smaller than if we had considered a year- Aircraft and engine manufacturers experience strong
2010 baseline fleet. demand from customers for more fuel-efficient aircraft
and have responded to this with successive generations of
aircraft offering improved fuel-efficiency over their predecessors.
Furthermore, unlike our previous Road-Maps, any remaining
Competition between manufacturers drives very significant
baseline aircraft which have not been upgraded to “known”
investment in research and development activities, often over
aircraft types by the time a corresponding “future” aircraft
very long timescales.
type becomes available are assumed in this Road-Map to
be replaced by the “future” aircraft type rather than the
“known” aircraft type. This reduces slightly further the 4.2.2 Carbon Price
percentage improvement attributable to “known” aircraft in
this Road-Map and causes a corresponding increase in the Since there is a direct link between fossil-fuel use and CO2
improvement attributable to “future” aircraft. emissions15, a carbon price applied to aviation CO2 emissions
can be viewed as a surcharge on the price of fossil-fuel, further
From 2040, a large proportion of aviation activity on short incentivising improvements in fuel efficiency.
routes (up to 400km in length) is assumed to migrate over a
ten-year period to all-electric “future” aircraft types running The EU Emissions Trading System (ETS) has for many years
on low-carbon electricity. This is a new feature which has included aviation CO2 emissions within its scope, while the
not appeared in any of our previous CO2 Road-Maps. CORSIA scheme16,17,18 agreed by the International Civil Aviation
Organization (ICAO) will commence its pilot phase in 2021.
From 2035, any aviation activity not suitable for migration
to all-electric aircraft is assumed to migrate over a 20-year Although the “price” of a tonne of CO2 is currently relatively
period to conventional or hybrid-electric “future” aircraft small in comparison to the cost of the fuel required to produce
types offering a 25% improvement in fuel efficiency relative a tonne of CO2, it is anticipated that the price of carbon will rise
to their respective predecessors. substantially over time, driven in part by demand created by
schemes such as CORSIA.
In particular, this Road-Map assumes a carbon price trajectory
4.1 Introduction and Framework which reaches £221 per tonne of CO2 by 205019, consistent with
UK government’s “central” carbon price assumptions used for
This chapter sets out our view of the potential for improvements
policy assessments.
in aircraft and engine fuel efficiency to reduce UK aviation’s
carbon intensity by 2050. We detail our assumptions concerning
the CO2-reduction potential of “known” and “future” aircraft 4.2.3 New Entrants
types relative to their respective predecessors, their likely
entry into service dates, and their resulting impact on fleet CO2 The extent to which aircraft from emerging competitors such
emissions. For the first time in one of our CO2 Road-Maps, we as Mitsubishi, UAC 20 and COMAC21 will influence UK aviation
include an initial assessment of the impact of all-electric aircraft. fuel-efficiency in the future is unclear at present. As a result,
We also provide an update concerning technology options in this Road-Map we do not explicitly model the impact on
being explored by aerospace manufacturers, which collectively fleet fuel efficiency of aircraft from those manufacturers. This
underpin our assumptions for “future” aircraft. Throughout, we approach introduces no material error to the Road-Map, since for
define “the fleet” as aircraft used to conduct flights falling within new entrants to take a material share of the market will require
the scope of “UK aviation”. products of similar fuel-efficiency to those offered by established
market participants. Furthermore, all manufacturers’ aircraft
will be subject to the same ICAO CO2 emissions standard (see
4.2 Contributing Factors section 1.1.4). Greater clarity on this issue will no doubt emerge
over time.
This section reviews some of the factors which can influence the
fuel-efficiency and CO2 emissions from the in-service fleet.
21 Carbon ReportIMPROVEMENTS IN AIRCRAFT
AND ENGINE EFFICIENCY
4.2.4 ICAO CO2 Emissions Standard initiatives such as the Faraday Battery Challenge28, the Industrial
Strategy Challenge Fund29, and the High Value Manufacturing
In March 2017, the International Civil Aviation Organization Catapult30, help to secure the long-term competitiveness of
(ICAO) adopted a CO2 emissions standard21 for aircraft. The UK aerospace and support the acquisition and development of
standard will apply to the certification and production of new transformational technologies which can help to reduce CO2
aircraft types from 2020, modified existing types from 2023, and emissions from future aircraft. It is essential that programmes
unmodified existing aircraft types from 2028. such as these continue into the future.
The aim of this certification standard is to reduce CO2 emissions 4.3 Baseline Fleet Characteristics
from aviation by encouraging the integration of fuel-efficient
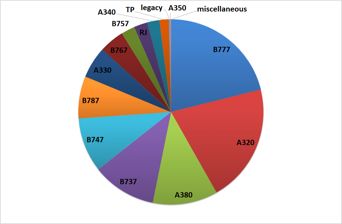
technologies into aircraft designs and developments and the Figure 1 shows, for flights departing from UK airports in year
replacement of older aircraft by newer, more efficient designs. 2016, the distribution of CO2 emissions between aircraft families.
Using data for passenger flights from OAG31 in conjunction with
The CO2 Standard is a certification standard, not an operational the fuel-burn lookup-table from ICAO’s carbon-calculator31,
standard, and as such does not impact current aircraft in use account is taken of the distance covered by each flight (including
or (until 2028) in production. However, it will impact the next a surcharge to represent non-great-circle routes) and the
generation of aircraft designs represented by the “future” aircraft efficiency of each aircraft type for the specific distance
wedge of this Road-Map. travelled. Using this methodology, total CO2 emissions
from UK passenger-flights in year 2016 are modelled as 36.7
While ICAO’s CORSIA (see above) places an obligation upon MtCO2, a figure which is slightly higher than the value of
aircraft operators, ICAO’s CO2 emissions standard represents an 35.2MtCO2 (also including freight-only flights) reported for
obligation upon aerospace manufacturers and their products. the same year in the UK’s National Atmospheric Emissions
Inventory33, but slightly smaller than the value for the same year
4.2.5 Freighters of 37.3 MtCO2 (also including freight-only flights) used by DfT in
their 2018 forecasts.34
Freight-only flights account for only a small single-digit
percentage of UK aviation CO2 emissions and we expect their
materiality to remain constant or perhaps even decline relative to
that of passenger flights. In the absence of available UK-specific
data concerning the likely usage balance within UK aviation
between passenger-conversions and new-build freighters,
we make the simplifying assumption that the efficiency of
the freighter fleet will improve at a similar rate to that of the
passenger fleet. The error this may introduce to the overall
analysis is small, due to the low materiality of freight-only flights
within UK aviation.
4.2.6 Technology Goals
In Europe, the goals of Flight Path 2050 include “In 2050
technologies and procedures available allow a 75% reduction
in CO2 emissions per passenger kilometre.... relative to the
capabilities of typical new aircraft in 2000”23. The ACARE24
organisation has established a strategic research and innovation
agenda as a route towards those goals, and significant R&D
programmes such as CleanSky as a means to deliver them.
4.2.7 Nationally Funded Initiatives and
R&D Programmes
Significant technology research programmes are required in
order to deliver future aircraft with substantially improved fuel
efficiency. Aerospace-specific initiatives, strategic alliances Figure 1 – distribution of CO2 emissions between aircraft types
and programmes such as the Aerospace Growth Partnership or categories. Year: 2016: Scope: UK aviation. SOURCE: SA
25
(AGP), the Aerospace Technology Institute26 (ATI) and the analysis of data from OAG and ICAO as described in the main
Future Flight Challenge27, in combination with other multi-sector text. RJ = regional jets; TP = turboprops.
Carbon Report 22You can also read