Understanding Tax Policy: How Do People Reason? - Harvard University
←
→
Page content transcription
If your browser does not render page correctly, please read the page content below
Understanding Tax Policy: How Do People Reason?∗

                                          Stefanie Stantcheva

                                                October 29, 2020

                                                      Abstract

         I study how people understand, reason, and learn about tax policy. The goal is to uncover the mental
      models that people use to think about income and estate taxes. To that end, I run large-scale online
      surveys and experiments on representative U.S. samples to elicit not only respondents’ factual knowledge
      about tax policy and the income or wealth distributions, but also their understanding of the mechanisms
      of tax policy and their reasoning about it. The detailed survey questions are designed to address the three
      main factors emphasized in our core tax model that can shape support for or opposition to taxes: efficiency
      effects, distributional implications, and fairness considerations. But they also elicit broader concerns
      that could influence policy views, such as misperceptions, views of government, perceived spillovers from
      taxes, and views on how tax revenues are or should be spent. I decompose policy views into the various
      underlying factors and find that support for tax policy is most strongly correlated with views on the
      benefits of redistribution and fairness, as well as with views of the government. Efficiency concerns
      play a more minor role. These correlational patterns are confirmed by the experimental approach, which
      shows people instructional videos that explain the workings and consequences of one of the aspects of tax
      policy (the “Redistribution” and the “Efficiency” treatments) or that bring the two together and focus
      on the trade-off (the “Economist” treatment). The Redistribution treatment and Economist treatments
      significantly increase support for more progressive taxes. I also find that there are partisan divergences
      not just in the final policy views, but also at every step of the reasoning about the underlying mechanisms
      of taxes, and most starkly on the fairness considerations.

         Keywords: Redistribution, Survey, Perceptions, Taxation, Online Experiment, Fairness.
         JEL Codes: D72, D91, H21, H23, H24, H41

   ∗ Stantcheva: Harvard, CEPR, and NBER (e-mail: sstantcheva@fas.harvard.edu). I thank participants at the NBER Summer

Institute in Political Economy and Public Economics, the CEPR Political Economy Webinar, and seminar attendees at UC
Berkeley, Oxford, Arizona State, Princeton, and Paris School of Economics for comments and feedback. I am grateful to
Alan Auerbach, Tim Besley, Richard Blundell, Zoe Cullen, Michael Devereux, Nathan Hendren, Ilyana Kuziemko, Camille
Landais, Ben Lockwood, Emmanuel Saez, Matthew Weinzierl, Gabriel Zucman, and most of all Larry Katz for invaluable
comments. I thank Beatrice Ferrario, Clément Herman, Pierfrancesco Mei Innoncenti, Leonardo D’Amico, Lionel Jeanrenaud,
Julia Paul-Venturine, and Yannic Rehm for exceptional research assistance.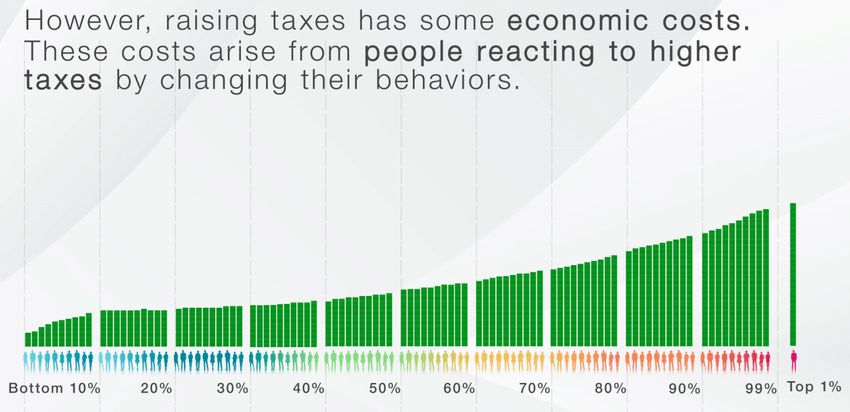
1     Introduction
People hold starkly different views on many policies, but the reason for these differing views is not always
apparent. Conflicts may be based on the perceived economic effects of these policies, as individuals may
disagree on which policy will be most effective at achieving a given goal. Alternatively, it could be that
people assess the benefits and costs to them and those they care about in contrasting ways. Yet another
reason may be divergent views on what is “fair” or “just.”
    Take the example of income taxes. Different views about the “right” level of taxes could come from
the perceived behavioral or efficiency effects of it (“Will people stop working if taxes are higher?”), from
the perceived distributional impacts (“Who benefits if taxes are cut?” or “What is the underlying income
distribution?”), and from the fairness criteria people apply when weighting winners and losers (“How much
more is a dollar of a transfer from a higher to a lower-income person worth?” or “How fair is it that
children born in wealthy families inherit more?”). It could also come from the perceived trustworthiness and
efficiency of government (“Will the government waste a lot of the tax revenue?”) or how tax revenue will be
spent (“Will revenues finance investments in infrastructure or defense, or rather an expansion of transfers to
low-income households?”). Support for reforms can also be shaped by perceptions of the current tax system.
Variation in policy views could be traced to one or more of these primary considerations, with the perception
of and weight assigned to them differing across groups of people, e.g., based on political affiliation, income,
education, or gender.
    In this paper, I explore what people know and, most importantly, how they reason about two major
tax policies in the U.S.: income taxation, and estate taxation. My goal is to explore the “mental models”
that people use when they think about tax policy and which type of tax policies to support. What are the
considerations people have in mind when thinking about taxes? These may – rightly or wrongly– not be in
line with the ones economists are thinking about. I examine the mechanisms that people think each policy
operates through and how they trade-off the different considerations. Do people focus more on policies’
distributional implications or rather on their efficiency costs? What fairness criteria do they employ? How
do the answers to these questions differ by the socio-economic and political characteristics of respondents?
I also study whether people learn about the economic policies and change their views about them if one
provides simple, but nuanced and neutral, explanations of their distributional and efficiency consequences,
perhaps the way one might do in an introductory economics class.
    There are at least three crucial reasons for understanding how people’s mental maps determine support
for or opposition to policies. First, it is akin to adding the benefits of more structural approaches to those
of the reduced form evidence we already have. Previous work reviewed below has shown that people hold
different views on policies and that various experimental pieces of information or actual economic phenomena
change their minds and voting in one way or another. But by going to the more primitive level of reasoning
about each mechanism, we can learn about people’s structural mental models and parameters. As is the
case with structural models in other settings, these can then be used to generalize, predict, and analyze
counterfactual changes. Second, identifying gaps in knowledge or incoherent reasoning about the policy
allows to pinpoint where information is needed, and which groups in particular require the information. For
citizens – perhaps especially for those from economically disadvantaged and disenfranchised groups – to be
able to identify and support policies beneficial to them, a first step is a better understanding of these policies.
Third, it is critical to disentangle different (even correct) perceptions of economic facts (efficiency costs or
distributional impacts) from different value judgements or fairness criteria. The former could possibly be

                                                        2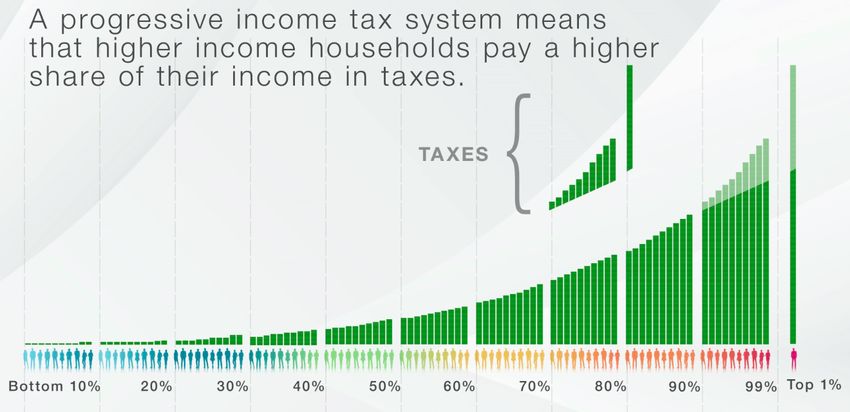
corrected or changed with better information, at least to some extent. Even though many of these facts
are still uncertain for economists, better data and progress in research are shedding light on them. Fairness
considerations, however, may be more immutable and may need to (and perhaps even should) be taken as
given and respected by policy makers. In any case, understanding the sources of disagreement or the parts
of agreement can help better manage political divergences.
   To this end, I run two large-scale Social Economics surveys and experiments on representative samples of
the U.S. population. The questions that comprise these surveys are designed to elicit not only respondents’
factual knowledge about tax policy, but also their understanding of its mechanisms, efficiency costs, and
distributional implications. I also extract people’s first-order considerations that come to mind when they
are prompted to think about income or estate taxes and their goals or shortcomings. To avoid priming
respondents about a particular effect or another, this is done primarily through open-ended questions, which
are subsequently evaluated through text analysis methods.
   The detailed set of questions asked allows me to decompose policy views into primary factors such as
perceived efficiency costs, distributional implications, fairness concerns, knowledge or misperceptions, or
views of the government. In the spirit of structural approaches, this sheds light on which aspects seem to
matter more – at least in a correlational sense – for respondents’ ultimate policy views. To then establish a
causal link between reasoning and policies, I experimentally show people instructional videos that explain the
workings and consequences of each policy from three different perspectives. The “Distributional” perspective
focuses on the distributional consequences of each policy, while the “Efficiency” perspective zeroes in on the
efficiency costs. Finally, the “Economist” perspective presents issues in light of trade-offs, combining both of
the previous perspectives. Each of these videos aims to be neutral and pedagogical, by focusing on explaining
mechanisms and reasoning, rather than just providing quantitative facts or information, or expressing views
on how policies should be.
   In addition, I test whether there are some inconsistencies or differences in how respondents think about
the effects of a policy, by randomizing the formulation of several of the questions in each survey. The same
root question is asked in three different ways: generic and impersonal (e.g.: “If the federal personal income
tax rate were to increase for the middle class, to what extent would it encourage them to work less?”). The
second formulation is focused directly on the respondent themselves (“If your federal personal income tax
rate were to increase, to what extent would it encourage you to work less?”). The third is specifically about
women (“If the federal personal income tax rate were to increase for women in the middle class, to what
extent would it encourage them to work less?”). It is important to note that the intention here is not to see
whether people accurately anticipate how they will respond, nor to predict the effects of tax policies. It is
about how people understand the economy around them and how they will make decisions to support or not
given policies. For that, it is their reasonings about the effects of these policies on themselves and on others
in the economy– including how others will react – that matter, regardless of whether those reasonings are
right or wrong.
   Before diving into this project, let us briefly consider a short answer to a question economists sometimes
ask: Why should we use surveys? Indeed, we often tend to trust more methods based on “revealed prefer-
ences” from observed behavior and these are great methods to answer a wide range of questions. Yet, there
remain things that are invisible in non-survey data – no matter how good it is – and the elicitation of which
will be highly challenging or outright infeasible using a revealed preference approach. These invisible things
are perceptions, knowledge, attitudes, views, or reasoning. In principle, one may write a fully structural

                                                       3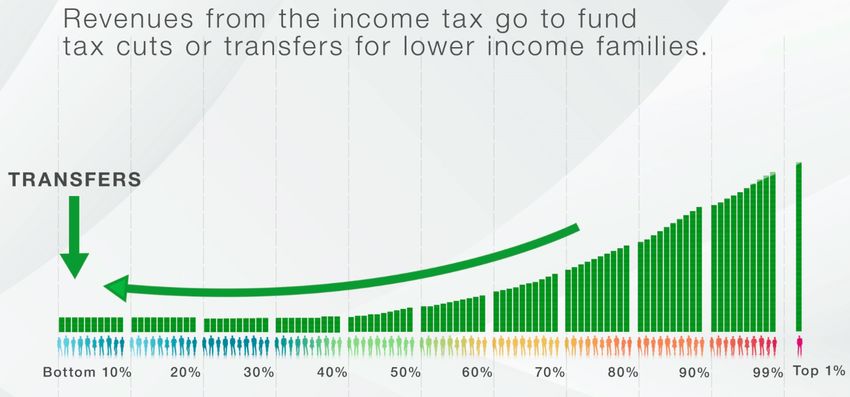
parametric model of these intangibles, use observational data on a range of behaviors, and estimate the
underlying unobservables. Yet, this not only requires a lot of structure and many difficult to justify assump-
tions, but also a large set of identifying variations in the data, which are not generally available. Imagine for
instance having to infer from observational data whether a given person believes that high-income earners
would move state or would evade taxes in response to tax increases or whether it is fair to tax the inheri-
tances of parents who have worked hard. It would be very difficult to find observed behaviors that would
allow us to get these underlying beliefs about others in a revealed preference manner. Surveys are a more
direct way of eliciting these intangibles. Of course, for the results to be reliable, it is critical that these
surveys are well-designed, carefully calibrated, and deployed on appropriate samples, as described in Section
2.1 There is always the possibility to collect more data, to change the design of the current survey (including
the treatment videos), or to ask questions in a different way, leaving the opportunity to explore more ideas,
test for robustness, or approach the question from different angles.
   Two of the main findings are as follows. First, the decomposition of policy views into factors capturing
misperceptions, perceived efficiency effects, perceived redistribution benefits, or views of the government,
shows that redistribution concerns dominate and views of government come second. Efficiency considera-
tions only play a minor role. A finer decomposition shows that it is mostly fairness considerations, rather
than simply the perceived distributional impacts of taxes, that show the largest variation and that most
strongly predict views on policies. What also matters (negatively) for support for progressive taxation is the
perception of trickle-down, i.e., the rhetoric that lower taxes on high-income earners can help everyone. The
experimental results confirm the correlational patterns from the decomposition. When the video courses
on income and estate taxes are introduced, both the Redistribution and Economist treatments increased
measured support for progressive taxation. Because the latter also shows the economic costs from taxation,
it appears that redistributive and fairness concerns tend to dominate efficiency arguments in the case of
income and estate taxes.
   Second, there are very large partisan gaps, not just in the final policy views, but at every step of the
reasoning about taxes. On the perceived efficiency effects of income tax changes, respondents generally tend
to think that high-income earners are more responsive to income taxes than middle class households, and
that the main channels of response are increased tax evasion, higher likelihood of moving to a different state,
and being less entrepreneurial. Yet, Republicans believe that taxes drive larger distortions in behavior,
particularly with regards to reduced entrepreneurship and labor supply, whereas Democrats tend toward the
opinion that income tax changes will not have as substantial of an effect. On the estate tax, respondents
across the political spectrum perceive the wealthy to be significantly responsive to changes in it. People tend
to believe that higher estate taxes drive increased tax evasion and moving across state lines, and they perceive
as the least common responses saving less, being less entrepreneurial, and having one’s spouse stop working to
decrease overall income. As the effects move from specific (i.e., the effect on individual taxpayers) to broad
(i.e., the overall effect on the economy), partisan disagreement increases sharply. Issues such as whether
income and estate tax cuts induce trickle-down effects that benefit everyone or whether they carry Laffer
effects (i.e., increase tax revenues on balance) tend to vary a lot across distinct party lines. Furthermore,
some of the most significant contrasts between political groups lie in opinions about fairness issues on income
and estate taxes, the causes and impacts of income distribution, and the mechanisms of wealth transmission.
In fact, there is even a “polarization of reality” (Alesina et al., 2020) whereby Republicans and Democrats do
   1 Two related questions are often “Why would people tell the truth?” or “Why would one trust survey answers?” I address

these concerns in Section 2.

                                                            4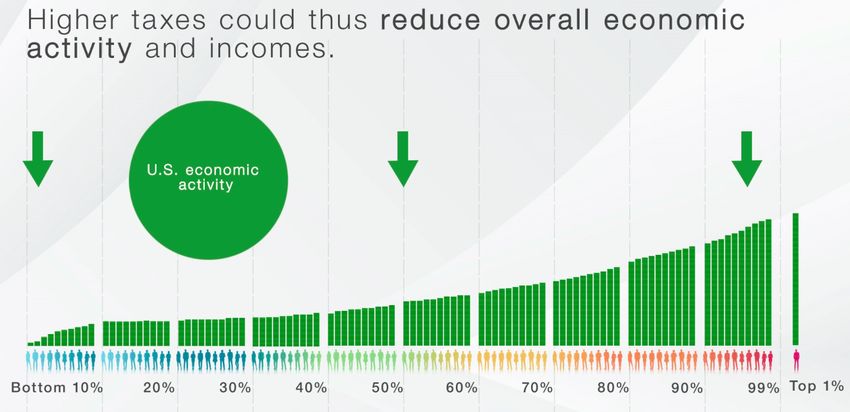
not perceive the current tax system in the same way, and left-leaning respondents tend to think actual taxes
are lower and less progressive than right-leaning ones. Because partisan gaps are present in the reasoning
about all mechanisms of tax policy, it is not surprising that they result in substantial discrepancies in the
final support for tax policy and government intervention through taxation.
   Some additional results are that, when asked about themselves, respondents consider that they are as
responsive to income taxes as a generic middle class person, but less responsive than a high-income earner.
This is true regardless of a respondent’s own income. Respondents believe that the estate tax impacts their
behavior; less so than the behavior of the wealthy, but similarly to how they perceive young people (who
may be anticipating the estate tax in the future) to react. Women consider themselves as less responsive
to income and estate taxes than a generic middle class person, and they also consider other women as less
responsive to taxes. However, respondents believe that income or estate tax cuts on “families like theirs” will
have the largest Laffer effects, i.e., the largest fiscal externalities on revenues. There are partisan differences
in how respondents perceive themselves relative to others. Regardless of their own income, Republicans tend
to think that their own gains and losses from income or estate tax cuts are more in line with those of higher
incomes and the wealthy. This is consistent with another of my findings, namely that even conditional on
income, Republicans tend to self-report a higher social class than Democrats do.
   The possibility to influence the perceived mechanisms of and support for tax policies suggests that perhaps
explanations (rather than the provision of simple facts) can be useful as at least a first step in the policy
debate. In the end, fairness views appear to be the most important factor in shaping support for tax policy.
Distributional impacts (who will benefit from tax changes?) play a role in so far as they interact with these
views of fairness (is it fair that those people give away part of their income or gain?). Efficiency costs, while
perceived very differently across the political spectrum and correlated with policy views, become second-
order once fairness views are brought into the picture. Because the latter reflect deeper-seated ethic and
social judgments, they are arguably beyond the scope of economics to try and shape. Yet, it is still critical
to study them.
   This paper is part of a broader agenda that uses Social Economics Surveys to shed light on the mental
models of people that ultimately determine their policy views. Some complementary resources are the
extensive Online Appendix which gathers many additional figures and tables and details on the methodology
and a website understandingeconomics.org. Targeted to a broader audience, this website allows to select a
given policy (health insurance, trade, income tax, or estate tax) and specific survey questions and to visualize
the answers for different types of respondents (e.g. by income bracket or political affiliation). A summary
working paper, not intended for publication is Stantcheva (2020), which contrasts and compares thinking on
four policies (income taxes, estate taxes, health insurance, and trade policy).

Related Literature: The baseline framework in this paper is inspired by the core optimal tax models, as
proposed by Saez (2001) (for good surveys of the literature, see Mankiw, Weinzierl, and Yagan (2009), Saez,
Slemrod, and Giertz (2012), and Piketty and Saez (2013)) as well as by the literature on optimal transfer
design as in Saez (2002), Besley and Coate (1992) or Besley and Coate (1995).
   People’s perceptions of their own tax rates and the widespread misunderstanding of the distinction
between marginal and average tax rates have been studied in De Bartolome (1995), Gideon (2017) and
Ballard et al. (2018). “Schmeduling”, i.e. approximation heuristics along the income tax rate schedule, has
recently been investigated in Rees-Jones and Taubinsky (2019). The literature has focused on misperceptions
and (lack of) factual knowledge, but not as much on reasoning about tax policy, i.e., the mechanisms that

                                                        5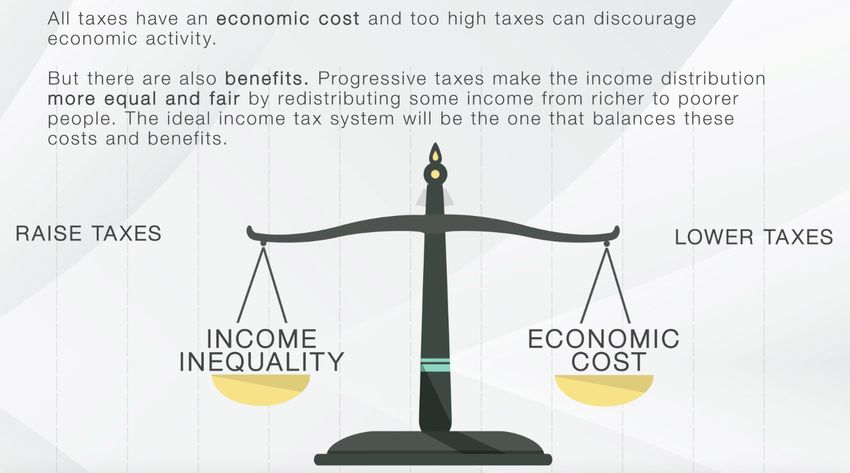
people think will play out for themselves and others, including efficiency effects, who gains and who loses,
and what is perceived as fair.2 Slemrod (2006) tries to understand why people support regressive reform and
maps it to a misunderstanding of the incidence of taxes. Misperceptions about the incidence of taxes is also
prevalent in Bartels (2005) who finds that support for the 2001 and 2003 tax cuts, which primarily benefited
very wealthy taxpayers, was mainly driven by considerations about a person’s own taxes despite widespread
opposition to increasing wealth inequality. In the current paper, I show that beliefs about the incidence of
taxes – both on others and on oneself – are very correlated with political affiliation. Not understanding one’s
taxes and transfer schedules has real economic consequences as shown by Chetty, Friedman, and Saez (2013)
and by Feldman, Katuščák, and Kawano (2016) regarding the child tax credit.
    Perceptions of the broader economy have been studied in Blinder and Krueger (2004) who show the
importance of television as a source of information. They rank the determinants of views on major policy
issues (including taxes, health insurance, or social security) by order of importance with ideology being the
most important, followed by knowledge about the economy and then self-interest.
    Some papers specifically investigate the divergence in opinions on the economy between the general public
and economists. Sapienza and Zingales (2013) compare the answers given to questions on a range of economic
issues of the “Economic Expert Panel at the University of Chicago Booth School of Business” with those
provided by a representative sample of the U.S. population and find that economists and the broader public
hold starkly different views on most issues. In Fuchs et al. (1998), who survey economists, once the authors
control for a “left values” variable that summarizes the beliefs that fairness matters more than efficiency, the
political affiliation loses its significance. This stands in contrast to my findings for a (non-economist) general
audience sample, where political affiliation remains highly significant even after controlling for detailed
channels of reasoning (see the discussion in Section 6). Blendon et al. (1997) show that the public seems
to be more pessimistic on the economy than economists are. People seem to provide different reasons for
why the economy is faring poorly and are more strongly influenced by personal experiences. In the present
paper, I explore in more depth not just the final policy views people hold, but also which reasonings about
the mechanisms of taxes are at the root of policy views about them.
    The paper is also related to the literature studying the effects of experimentally providing information
about inequality or the tax system on support for redistribution. Kuziemko et al. (2015) find only moderate
effects in the U.S. because negative information on the degree of and increase in inequality also reduces trust
in government. However, telling respondents that the estate tax is – contrary to widespread belief – paid
by very few households increases support for it starkly, echoing the results in Sides (2011). Two papers
document the misperceptions individuals have of their own ranking in the income distribution and show
that telling people their true position changes support for redistribution. In Karadja et al. (2017) those
who are told they are, in fact, richer than they thought demand less redistribution. Conversely, in Cruces,
Perez-Truglia, and Tetaz (2013), those who had overestimated their relative ranking tend to demand higher
levels of redistribution after being informed of their true position. Roth and Wohlfart (2018) shows that
people’s own past experiences shape support for redistribution.
    In online surveys and experiments, various elements that drive views on tax policies and progressivity
have been explored. On fairness considerations, which will turn out to be crucial in the current paper,
   2 Related to people’s misperceptions of their own taxes is the large literature on financial literacy, which generally finds
similarly low levels of information among the general public (see Hastings et al. (2013) for a review, as well as Lusardi and
Mitchell (2017) and Lusardi et al. (2017) among others). To draw the analogy to the tax perception literature and highlight
the difference to the current paper, this literature studies how people make their own decisions about their own financial lives,
rather than how they decide on or vote for financial markets policies.

                                                               6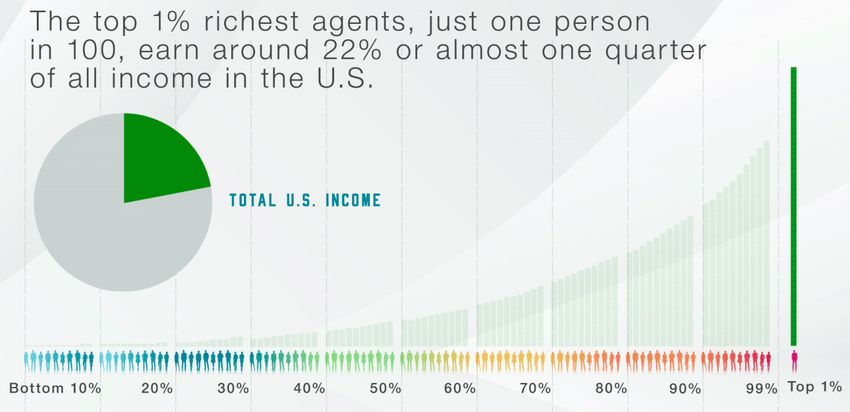
Weinzierl (2014) goes beyond utilitarianism to underline the relevance of the “equal sacrifice” principle;
Weinzierl (2017) highlights the role of classical benefit-based taxation. Kuziemko et al. (2014) emphasize
the importance of “last-place aversion” in driving people’s support for redistribution at different points of
the income distribution. The importance of the status quo and of reference points for views on fairness
of inequality is highlighted in Charité, Fisman, and Kuziemko (2015). Fisman, Kuziemko, and Vannutelli
(2020) show that individuals’ preferences seem to have aversion to “topmost” inequality (i.e., care about
the top end of the distribution), but also to inequality between themselves and those closest to them in the
distribution. Fisman, Gladstone, Kuziemko, and Naidu (2020) study the joint preferences over income and
wealth taxation using online surveys. Lockwood and Weinzierl (2016) take an interesting approach to invert
the current tax system to extract the implicit fairness views behind it.
    I will also highlight the role of trust in government in shaping support for more progressive taxes, which
is consistent with the results in Kuziemko et al. (2015) who find that experimentally reducing trust in
government reduces support for redistribution as a whole. Di Tella et al. (2016) also show that more trust in
the government, but particularly in business elites, causes a decline in desired taxes on the top 1%. In line
with my results, the recent innovative study by Almås, Cappelen, and Tungodden (2020) finds that when
comparing attitudes towards redistribution between the U.S. and Scandinavia, it is fairness views that differ,
rather than views on efficiency.
    Lab experiments using distribution games have also been used to disentangle the importance of various
factors in shaping support for redistribution (for a recent review, see Cappelen et al. (2020)). Cappelen et al.
(2007) study a dictator game to estimate the pluralism of fairness ideals; Cappelen et al. (2013) augment the
experiment to look at fairness views about risk-taking. Durante et al. (2014) try to disentangle self-interest,
insurance motives, and social concerns related to inequality and efficiency.

    The paper is organized as follows. Section 2 presents the conceptual framework that informs the design
of the building blocks of each surveys, the data collection, and the sample. Section 3 applies text analysis
methods to the answers to the open-ended questions to describe respondents’ first-order considerations
about taxes. Section 4 presents respondents’ knowledge about taxes and the income and wealth distributions.
Section 5 digs into respondents’ reasoning about the behavioral responses and distortionary effects associated
with tax policy, their distributional impacts, and their fairness implications. Section 6 first decomposes
policy views into efficiency, distributional, government-related, and knowledge issues and then describes the
experimental effects of providing information about income and estate taxes on policy views.

2     Framework, Survey Design, and Data
2.1    Conceptual Framework
The canonical tax formula. When economists think of the optimal level of taxation, they usually have in
mind the core equity efficiency trade-off. In particular, they think of balancing the efficiency costs of taxes
due to their distortions of economic behaviors and their redistributive and revenue benefits. People may or
may not have similar concerns to economists and may place different weights on them.
    The standard optimal tax formulas tell us that the optimal tax system will be a function of the i) redis-
tributive benefits of taxes or “equity” effects and ii) their efficiency costs through the behavioral distortions
entailed or “efficiency.”

                                                       7
The redistributive benefits or equity benefits of taxes are themselves a function of several factors. The
distribution of income or wealth determines the mechanical impact of raising taxes at different points of
the income distribution. There are also possible spillover effects from changing taxes at one point of the
distribution on agents at other income or wealth levels. Taken together, the mechanical impacts and spillover
effects determine the actual redistributive impacts of tax changes on different people. For instance, “trickle-
down economics” is the idea that tax cuts at the top of the income or wealth distribution could also benefit
households lower down in the distribution, through general equilibrium effects. In this narrative, top earners
are for instance be perceived as “job creators” whose economic activity benefits even those with lower
incomes through increased employment and career opportunities. To weigh these distributive impacts and
assess their social value, fairness concerns play a key role. They are reflected in the social welfare function
used to aggregate the gains and losses of different people or, alternatively, in the social marginal welfare
weights (Saez and Stantcheva, 2016).3 There are many fairness considerations that can come into play,
but some of the essential ones are whether inequality is a serious issue and whether people are ultimately
entitled to their income and wealth. For the estate tax, additional thorny fairness issues revolve around two
conflicting concerns, namely whether parents should be able to freely pass on wealth to their children, or
whether children should start from a level playing field.
The behavioral effects of income or estate taxes can occur through several possible channels, such as
reductions in productive activities (e.g.: working, saving, having one’s spouse stop working), tax avoidance
(e.g.: moving states), or outright tax evasion. In addition, there are broader aggregate effects on revenues
and on other people in the economy. Often discussed is, for instance, a “Laffer effect” whereby an income
or estate tax cut could ultimately lead to an increase in tax revenues by stimulating economic activity by so
much, that the additional revenue collected on that increased activity outweighs the direct loss in revenue
from decreasing the tax. Thus, we can heuristically write the economists’ tax formula as:4
Optimal Tax SystemEconomists = f (equity, efficiency) = f (distributional impact, fairness, efficiency) (1)
People’s own tax formula. People may think differently from economists about the right level of taxes
for several reasons. First, the relative importance of the aforementioned factors may not be the same as in
the optimal tax formula. Put differently the “optimal tax” problem that people solve in their minds may
not be the one economists solve for. Second, there may be misperceptions, lack of understanding, or poor
information on any of these elements, e.g., on the income distribution or on the behavioral responses to
taxes. Thus, the values of the factors that inform people’s preferred tax system are their perceived ones, not
necessarily the real ones. Third, fairness views may be much more complex and perhaps non-welfarist as
3 Fairness concerns naturally interact with the actual distribution of income or wealth. More technically, the spillover effects
are combined efficiency and distributional effects, since they are the result of agents adjusting to taxes and changing their
behaviors in a way that has distributional implications for others, i.e., they involve both how responsive to taxes particular
agents are (behavioral effects) and where the spillover effects land in the income distribution (distributional effects) The
difference to the behavioral effects captured in the taxable income elasticity (in the denominator of the tax formula) is that
these spillover effects have first-order welfare impacts, as they represent externalities from one agent to another. The effects on
total tax revenues (i.e., pure efficiency effects in the core tax model) are also counted, but are part of the efficiency effects.
4 Formally, if we let each agent be indexed by i, z be the total taxable income of agent i, and g the social marginal welfare
i i
weight that measures the relative social value of $1 transfer to agent i, then the optimal linear tax is given by
R R
1 − ḡ g i zi d log( i zi )
τ = where ḡ = R i R and e =
1 − ḡ + e i g i i zi d log(1 − τ )
See Saez and Stantcheva (2016).
8theoretically lined out in Saez and Stantcheva (2016). Finally, people may have other concerns that the tax
formula in its simple form does not capture, such as trust in the government to deal with the tax and transfer
system efficiently and benevolently. People may also have particular expectations about how the tax revenues
will be spent or should be spent and this concern may not be dissociable from their views on the desired
level of taxes. In addition, knowledge of the current tax system would naturally shape support for particular
tax reforms. Imagine two respondents, A and B, who have the same desired level of tax progressivity, but
A lacks knowledge on current taxes and wrongly perceives the tax system as more progressive than it is in
reality. Respondent A may not support progressive tax reform, even if they agree with respondent B about
how their ideal tax system should look like. Similarly, A and B could be in agreement on their desired
post-tax distribution of wealth and income, but have very different knowledge of the current status quo
distributions, and, hence disagree on the way to achieve their desired post-tax outcomes. It is indeed even
possible that the status quo (as it is perceived by respondents) anchors views and actually influences the
desired tax system itself.
Hence, heuristically, for each person i, the optimal tax system will be some function f i () – possibly
different from the economists’ function f () – of their perceived distributional impacts of taxes, perceived
efficiency effects, fairness criteria, trust in and views of government, knowledge of the tax system or income
and wealth distributions, and other factors such as how they think that tax revenues are spent.
Optimal Tax Systemi = f i (perceived distributional impact, own fairness criteria,
perceived efficiency, views of government, knowledge, other factors) (2)
A Roadmap: Without putting a lot of structure on f i () it is not possible to fully estimate the mental model
for each individual. In this paper, I elicit these relevant components (on the right-hand side) and relate them
to views of the tax system (on the left-hand side). The steps to achieve this are as follows and immediately
translate into the design of the survey, summarized graphically in Figure 1. I start by open ended questions
that extract the first-order thinking and considerations of respondents, without priming them to think in
one direction or another. They give a sense of whether these issues differ from economists’ concerns. Then, I
study the factual knowledge of respondents about taxes and the income and wealth distributions. After this,
a deep dive is taken into uncovering the reasoning on efficiency costs, distributional impacts, and fairness
concerns before asking about overall policy views. To address the issue that people may take into account
more factors than economists do when forming their views, I try to directly ask questions about other
dimensions that could be relevant for tax policy, such as whether a given tax increase would be supported
if the money is spent in several given ways, as well as about views of the role, competence, and efficiency
of the government. In Section 6.3, I then estimate the effect of these various components (knowledge or
misperceptions, perceived efficiency effects, distributional impacts, trust in government, fairness concerns,
etc.) on policy views. This leads to a decomposition of policy views into these various factors.
Finally, to establish causality about the way in which the main factors that enter the tax formula shape
policy views on taxes, I provide randomized video courses that explain these effects in neutral, balanced
ways, the way we may do in a introductory economics class. The “Redistribution” treatment explains the
redistribution benefits of changing income or estate taxes, the “Efficiency” treatment explains the efficiency
costs and the “Economist” treatment highlights the trade-off between the two. The reasons for focusing on
9Table 1: Factors Shaping Views on Taxes
Factor Theoretical Effect Survey Revealed
on Support for Taxes Method Importance
Redistribution benefits Increase Questions & Experiment Very large
Distributional impacts Moderate
Fairness considerations Very large
Efficiency effects Decrease Questions & Experiment Small
Trust in government Increase Questions Large
Knowledge & Misperceptions Ambiguous Questions Moderate
How is revenue spent? Ambiguous Control Large
these factors are, first, that they are the key elements in the tax formula. The Redistribution treatment does
not appeal to arguments on the fairness or unfairness of the income or wealth distributions or of the tax
system, but simply points out how progressive income or taxes will impact people with different incomes or
parental wealth levels. This treatment would thus only move respondents’ policy views if they have fairness
views that put some weight on income or wealth equality.5
Table 1 summarizes the approach and some key results that will be described later. For each factor listed
in the first column, the table lists the theoretically predicted effect on support for taxes, the method adopted
here to study it, and its revealed importance.
2.2 Data Collection and Final Sample
The core data comes from two surveys, conducted between February 2019 and May 2019 on U.S. residents
between 18 and 70 years of age. The sample sizes are 2,780 for the income tax survey and 2,360 for the estate
tax. The surveys were distributed by the commercial survey company Respondi (https://www.respondi.
com/EN/).
How were participants enrolled? The commercial survey company has different email lists of potential
survey respondents who receive the survey links via email. These respondents have initially been contacted
through various channels – including when they sign up for rewards programs online or in stores, frequent
flyer or traveler programs, or credit cards. They are typically “consumer survey” respondents, who generally
receive consumer products or experiences related surveys, and only rarely encounter academic research ones.
This is a potential advantage over long-standing social and economics survey panels, as these individuals are
not used to answering this type of questions and their answers may thus be more representative of the person-
on-the-street. Respondents come from a variety of backgrounds and are rewarded by their panels through
a range of different means, from cash to points on rewards programs. Compensation for each completed
survey is implemented by each panel company and varies based on the type of arrangement and preferences
of the respondent.
On the invitation email, respondents were only told the length of the survey, but neither the topic nor
the sender. After clicking on the link, respondents were channeled to a consent page (see Figure A-1) that
5 Fairness views are matters of social judgment that are vital for economists to study. The current paper does not attempt
to shift people’s views of what is fair, but rather to understand what those views and reasonings are. Providing information
on the distributional impacts of policies means taking fairness views as given, but would naturally shift policy views if people’s
fairness views put weight on distributional aspects.
10informed them that they were about to take an academic research survey, destined solely for research purposes
run by non-partisan researchers. They were asked to respond accurately to the best of their knowledge and
were assured that participation was entirely voluntary. Respondents were then guided through some screening
questions that ensured that the final sample was nationally representative along gender, age, and income
dimensions. Thus, if respondents decided to drop out at some point during the survey – e.g., upon learning
the topic of the survey – all their demographic and background information would be known and I could
check for differential attrition by observable characteristics such as political affiliation. Respondents were
paid only if they fully completed the survey. The median time for completion of the survey was 35 minutes.
Final Sample. The final samples for each of the two surveys are close to representative of the U.S.
population along many dimensions. Table 2 shows the characteristics of the samples and compares them to
U.S. population statistics come from the Census Bureau as described in the table notes. By construction,
the sample is almost perfectly representative along the dimensions of age, gender, income (arranged into five
brackets to mimic the way the quotas were imposed during the surveys). In addition, the sample is also
broadly representative on some non-targeted dimensions such as the share of respondents who are married
and those who are employed and unemployed. However, in both surveys, respondents were more likely
to have completed high-school and be college-educated than the general population. In addition, African-
American and Hispanic minorities are underrepresented. To address these imbalances, one can re-weight the
sample so that it is representative along the employment, education, and race dimensions as well. This was
done for all results as checks, and no result was affected in a non-negligible way. Since including all tables
with the re-weighted sample would be overwhelming, these results are available to the reader on demand.
2.3 The Survey Structure
The full questionnaires of the Income and Estate Tax surveys are in Appendix A-5, with a link which leads
to the web interfaces of the surveys. The reader will note that there are more questions in the surveys than
those I exploit in the main part; they are analyzed for completeness in the Online Appendix and leave the
potential for more future analysis using this data. Figure 1 shows the structure of the survey and its flow. I
now provide more details on the blocks composing the survey.
Background socio-economic questions I collected information on respondents’ gender, age, income,
highest level of education achieved, sector of occupation, employment status, marital status, number of
children, place of residence, and political orientation. Because it plays such an important role, I investigated
the latter category in three ways. First, I asked respondents to classify themselves in terms of their views
on economic policy, along a spectrum ranging from “very conservative” to “very liberal.”6 Second, I asked
them what they consider their political affiliation to be (Republican / Democrat / Independent / Other /
Non-Affiliated ). Third, I asked them for whom they voted in the 2016 presidential elections; and, if they
did not vote, for whom they would have voted. I also dug deeper into their political participation by asking
whether they were registered to vote, and why not, if they were not; and whether they regularly vote, or why
they do not. In some of the figures and tables, I refer to four finer political groups that are defined by the
combination of the answers to the question of which candidate the respondent voted for and where they see
themselves on economic policy issues: Clinton Liberals (those who voted for Clinton and see themselves as
6 “On economic policy matters, where do you see yourself on the liberal/conservative spectrum?” With options [Very liberal,
Liberal, Center, Conservative, Very Conservative].
11Table 2: Sample Characteristics
US Population Income Tax Survey Estate Tax Survey
Male 0.48 0.48 0.46
18-29 years old 0.26 0.23 0.23
30-39 years old 0.18 0.20 0.20
40-49 years old 0.19 0.19 0.19
50-59 years old 0.21 0.20 0.19
60-69 years old 0.16 0.18 0.19
$0-$19,999 0.15 0.15 0.16
$20,000-$39,999 0.18 0.18 0.19
$40,000-$69,999 0.21 0.23 0.25
$70,000-$109,999 0.19 0.19 0.20
$110,000+ 0.25 0.24 0.20
Four-year college degree 0.22 0.32 0.29
High-school graduate or less 0.39 0.17 0.19
Employed 0.58 0.63 0.62
Unemployed 0.08 0.07 0.06
Married 0.49 0.55 0.53
White 0.61 0.76 0.76
Black/African-American 0.13 0.05 0.06
Hispanic/Latino 0.18 0.06 0.07
Asian/Asian-American 0.06 0.07 0.07
Sample size 2784 2360
This table displays U.S. representative statistics (in the first column) from the Census Bureau and Current Population Survey
alongside summary statistics from our surveys (the following two columns).
“liberal” or “very liberal” on economic policy issues); Clinton Moderates (those who voted for Clinton and
see themselves as “moderate” on economic policy issues); Trump Moderates (those who voted for Trump
and see themselves as “moderate” on economic policy issues); and Trump Conservatives (those who voted
for Trump and see themselves as “conservative” or “very conservative” on economic policy issues). The
remaining categories (Trump Liberals and Clinton Conservatives) are very small.
In addition, I collected information on the respondent’s sector of employment and, if they are currently
unemployed, on the sector in which they last worked. I also asked respondents about their main source of
news; whether they try to stay informed; their overall media and social media consumption; and their major
field of study in college.
12Figure 1: Survey Flow
Background of respondent:
Gender, age, income, education, family situation, political views, media exposure.
Open-ended questions:
Main considerations?; Goals of ‘good’ system?; Shortcomings?
Goal: identify first order concerns.
Knowledge
Factual, quantitative questions (top tax rate, concentration of wealth...)
Goal: get an idea of how much the respondent knows about tax system
Short Econ Video Courses
Redistribution Efficiency Economist No Video
1/7 1/7 2/7 1/7 1/7 1/7
Neutral: How would “Me”: How would you “Women”: How would
high-income households react to …? How does a high-income women
Neutral: How would high-income households react to …? How does a tax cut
react to …? How does a tax cut on households react to …? How does a
on high income households ...?
tax cut on high income with income levels tax cut on high- income
households ...? similar to yours...? women …?
Reasoning about Taxes:
Efficiency effects; distributional impacts; fairness considerations. Three different formulations for the respondents who did not see the video.
Policy Views
Views of Government
Open-Ended Questions: Several free text-entry boxes were used to ask respondents about their main
considerations, perceived goals and shortcomings about the taxes, as well as the effects they anticipate (e.g.,
which groups would gain or lose from a tax increase). Open-ended questions are useful to elicit first-order,
intrinsic concerns that people have, before they are prompted to think of a particular aspect with the more
directed survey questions (that may reflect particular effects or issues that economists are used to thinking
about). I ask people about i) the immediate “main considerations” that come to their minds when they
think about the tax system; ii) what a “good” tax system might mean, including its goal; and iii) the main
shortcomings of the tax system as it currently is in the U.S.. Finally, some of the more targeted open-
ended questions ask about the effects on the U.S. economy and on different groups of people if the policy
were changed (e.g., what would be the effects on the economy if taxes on high earners were increased).
The responses to the open-ended questions are evaluated using detailed text analysis methods, described in
Section 3.
Knowledge: These questions are about factual knowledge and are carefully designed to be intuitive and
easy to understand. For instance, I ask for a number “out of 100” rather than for a percentage. I first explain
what a “share” is, and how post- and pre-tax income are related for a given tax rate with the use of a figure
and worked-out examples. The questions refer among others to the level of the top federal or top state taxes,
13the threshold for the top income tax bracket, the top tax rates in the 1950s, the share of households in the
top bracket or who pay the estate tax, the share of households paying no income tax, and the average tax
rate for the median household or the top household. Respondents are also asked about the share of total
income or wealth that goes to the top 1%, the share of wealth inherited, or the occupational composition
of the top 1% of earners. These questions are important to identify where the gap in knowledge lies: is it
rather about the policy itself or is it at a more fundamental level a lack of knowledge about this particular
aspect of the economy? Moreover, to ensure that the results are not driven by respondents’ lack of attention
or careless answers, 85% of the sample received monetary incentives for accurate answers. Misperceptions
are virtually unaffected by monetary incentives, suggesting that respondents are already responding to the
best of their knowledge.
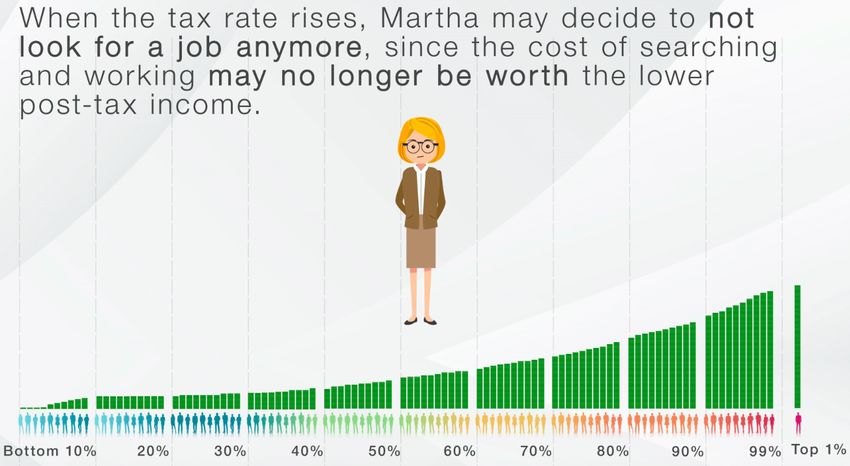
The information treatments: short “Econ 101” courses: In each survey, a randomly chosen subsample
of respondents was shown one of three versions of an instructional video that provided information about
the policy. Screenshots from these videos are in Figures 2-7 and each video can be seen by following the links
below the screenshots. Section 6.4 focuses on the design and results from these information treatments.
Reasoning about Taxes: In this section, respondents are asked to think in more detail about how each
tax policy works. What behavioral responses, efficiency effects, and impacts on the broader economy will it
trigger? What are the distributional consequences for different groups? What fairness concerns do people
have? To give a concrete example, in the income tax module, respondents are asked to what extent they
believe people will engage in the following behaviors if their taxes were to increase: save less, work less, stop
working altogether, evade taxes, etc. They are also asked which income groups will gain most or least if
income taxes on high-income earners are increased and whether taxing away the income of different groups
is fair or unfair.
Three randomized formulations: When asking about these mechanisms, respondents are randomized
into one of three branches, which feature a different formulation of these questions. The first branch sees the
formulation of the questions in a “neutral” way (e.g. “If the federal personal income tax rate were to increase
for the middle class, to what extent would it encourage them towards the following behaviors?”) with an
impersonal and gender neutral formulation. The terminology I will use in the draft will be of the “neutral”
formulation that asks about a “generic” (i.e., non-gender specified) person or people from a given income
group. Respondents in the second branch receive a personal formulation of the questions that asks them
about themselves, or about people or households similar to themselves along the relevant dimension. For
instance, on the behavioral responses to taxes, respondents may be asked “If your federal personal income
tax rate were to increase, to what extent would it encourage you towards the following behaviors?.” In cases
in which an individual-level question does not make sense, the question is asked about “households similar to
yours” or “people with similar incomes to yours.” For instance: “What effects do you think that increasing
the federal estate tax on the estates of households similar to yours would have on economic activity?” This
personalized formulations branch will be called the “Me” treatment. In the third branch, questions are
formulated to be explicitly about women. For instance, “If the federal income tax rate were to increase for
women in the middle class, to what extent would it encourage these women towards the following behaviors?”
or “Do you think that increasing income taxes that high-income women have to pay would hurt economic
activity, not have an effect on economic activity, or help economic activity in the U.S.?” The goal is to see
whether the mechanisms that people have in mind for different policies depend on the gender of the people
14considered. The survey flow chart in Figure 1 shows the share of the sample in each branch. Taken together,
the Question formulation randomizations and the Video courses will be called “Treatments.”
Policy Views: Here, respondents were asked about their views on the current tax systems (is it fair? are
they satisfied with it?) and for opinions regarding concrete policy actions, e.g., if they supported increasing
the tax to fund specific programs.
Views of Government: In this section, respondents expressed their views about the role and capacity of
the government to deal with the issue at hand. For instance, in the income tax module, they are asked to
what extent they think the government has the tools and ability to reduce income inequality. They were also
asked about their general attitudes towards government (unrelated to the specific policy) such as whether
they tend to trust the government and what the scope of government intervention should be.
Final Questions: By entering the survey, respondents were informed that they were automatically enrolled
in a lottery to win $1,000. At the end of the survey, respondents were asked whether they were willing to
forfeit part of their lottery gain in order to receive the accurate answers to all the knowledge questions. They
had to commit to forfeiting that amount before they knew whether they had won the lottery or not. The
price of information was randomized (with possible values $1, $2, $5, and $10), allowing me to extract a
willingness to pay for information.7 They were also asked whether they feel the survey was biased (left-wing
biased or right-wing biased) and to leave open-ended feedback in a text-entry box.
All variables are comprehensively defined in Appendix A-2 and more briefly in the Table and Figure
notes. Not all questions in the survey are represented in the figures or tables due to space constraints.
However, the comprehensive set of results, on all topics and questions, and with heterogeneity analysis by
types of respondents is in the Online Appendix.
2.4 Ensuring High Quality Answers
A question sometimes asked by audiences is why one should trust survey answers. Clearly, the trustworthiness
of the answers depends on the quality of the survey design. I employed several methods to ensure the highest
possible quality of answers. In the survey’s landing page – the consent page– respondents are warned that
low quality responses will be flagged and their payment possibly withheld. At the same time, I also attempt
to make them feel involved and socially responsible by emphasizing that we are non-partisan academic
researchers seeking to advance our knowledge of society and that their answers are entirely voluntary, but
that it is very important for the research that they answer as accurately as they can. Furthermore, the
questions themselves are designed so as to prevent careless answers: for instance, percentages are constrained
to add up to 100% and respondents are alerted with a pop-up message if there is an inconsistency. When
appropriate, rather than using data entry boxes, I let respondents select numbers using sliders to minimize
fatigue and typos. I also keep track of and check the time spent by the respondent on the survey as a whole,
as well as on specific pages and questions, which permits flagging respondents who spend too little time on
questions. For the benchmark sample, I drop respondents in the bottom 5% of the survey time distribution.
None of our results are affected by trimming these outliers.8
7 I do not make use of this question, but, after seeing the information, respondents were also asked whether they were
surprised by that information.
8 These results are available on demand.
15A randomized subsample of respondents was also provided with financial incentives for correct responses
to the policy knowledge questions. This is expected to encourage respondents to pay more attention.9
In addition, three screening questions are interspersed in the survey, which ask respondents to ignore the
question and select a given or several given answer options as a check for whether respondents are reading the
questions carefully. Finally, respondents are asked whether they thought the survey was left- or right-wing
biased. Around 80% of respondents believe the survey was not biased in any direction; 15% believe it was
left-wing biased and 5% believe it was right-wing biased. Reassuringly for our treatment estimates, these
shares are not different in the control and in each treatment groups.
These techniques minimize willful misreporting or simple carelessness. In addition, the questions them-
selves are formulated in the clearest possible way, without complicated terms or jargon, building on lessons
from multiple pilots. As the full questionnaire in Appendix A-5 shows, concepts such as average taxes are
first explained intuitively to respondents. The survey is readable and easy to scroll and click through, and
there is a mobile version for phones, which further lowers the hassle of participating. Finally, it is worth
noting that the setting of the survey itself minimizes incentives to misreport or express incorrect views:
the survey is entirely anonymous and respondents know it can never be matched to their identity or other
data. There is also no social image concern or pressure as respondents are alone and in their own chosen
surroundings, without any surveyor in front of them or any other respondents around (contrary to face to
face or phone surveys).
3 People’s First-Order Concerns: Text Analysis
The text analysis methods are described in greater technical detail in Section OA-2 of the Online Appendix.
In brief, to prepare the data for the text analysis, I first parse the answers by removing punctuation,
excess spaces, numbers, misspelled words and so-called “stopwords,” which are common words that carry
no intrinsic meaning such as “and,” “the,” etc. The remaining words in each answer are then lemmatized,
i.e., all inflected forms of a word are grouped together. For instance, “policies” becomes “policy,” “were”
becomes “be.” Words that appear in the question and are not informative of the respondent’s answer are
also removed, as are extra words related to the structure of the answer (e.g., “think,” “believe,” “should”).
These steps reduce the number of distinct text elements.
The topic analysis presented here is based on a keywords-count model. Topics are defined by sets of
keywords that capture a particular aspects of the policy. The complete list of keywords for each topic is
reported in each figure. The topic indicator variable is equal to one if a respondent’s answer contains at least
one of the keywords defining this topic. Answers can thus contain more than one topic if the respondent used
keywords related to several ones. The bar charts in the Figures represent within-group distribution of the
topics in a given question. In the benchmark figures in the paper, the groups are defined by political affiliation:
Clinton liberals, Clinton Moderates, Trump Liberals, and Trump Conservatives. For each group, the ratio of
the number of times a given topic is mentioned to the total number of topic mentions by the members of the
group is computed.10 Due to space constraints, the focus here is on one of the open-ended question, namely
“What are your main considerations about [policy]...?” The Online Appendix provides the topic distributions
9 In practice, the effect of financial incentives turns out to be negligible here, even for the larger ones, and is thus not explored
further in the paper. This likely signals that respondents are already answering to the best of their knowledge.
10 This permits taking into account the fact that some groups (e.g. respondents aged 50+ in the Online Appendix) systemati-
cally write longer answers and are therefore mechanically more likely to mention more topics. There is no systematic difference
in answer length by political affiliation though.
16You can also read