IEB Working Paper 2019/04 - BEHAVIOURAL RESPONSES TO THE (RE)INTRODUCTION OF WEALTH TAXES. EVIDENCE FROM SPAIN - Universitat de Barcelona
←
→
Page content transcription
If your browser does not render page correctly, please read the page content below

IEB Working Paper 2019/04

BEHAVIOURAL RESPONSES TO THE (RE)INTRODUCTION OF WEALTH TAXES.
EVIDENCE FROM SPAIN
José María Durán-Cabré, Alejandro Esteller-Moré, Mariona Mas-Montserrat

                                                                  Tax Systems Analysis
IEB Working Paper 2019/04

              BEHAVIOURAL RESPONSES TO THE (RE)INTRODUCTION OF
                            WEALTH TAXES. EVIDENCE FROM SPAIN

                  José María Durán-Cabré, Alejandro Esteller-Moré, Mariona Mas-Montserrat

The Barcelona Institute of Economics (IEB) is a research centre whose goals are to
promote and disseminate work in Applied Economics, and to contribute to debate and
the decision-making process in Economic Policy.

The IEB research program in Tax Systems Analysis aims at promoting high quality
research in the field of taxation, taking into account not only the traditional approach to
optimal taxation, but also administrative issues and the decentralization or globalization
context. The ultimate aim of the program is to generate socially useful knowledge in
this field. Special emphasis is put on empirical research, and on the analysis of the
Spanish Tax System. The program enjoys the support from the IEB-Foundation.

Postal Address:
Institut d’Economia de Barcelona
Facultat d’Economia i Empresa
Universitat de Barcelona
C/ John M. Keynes, 1-11
(08034) Barcelona, Spain
Tel.: + 34 93 403 46 46
ieb@ub.edu
http://www.ieb.ub.edu

The IEB working papers represent ongoing research that is circulated to encourage
discussion and has not undergone a peer review process. Any opinions expressed here
are those of the author(s) and not those of IEB.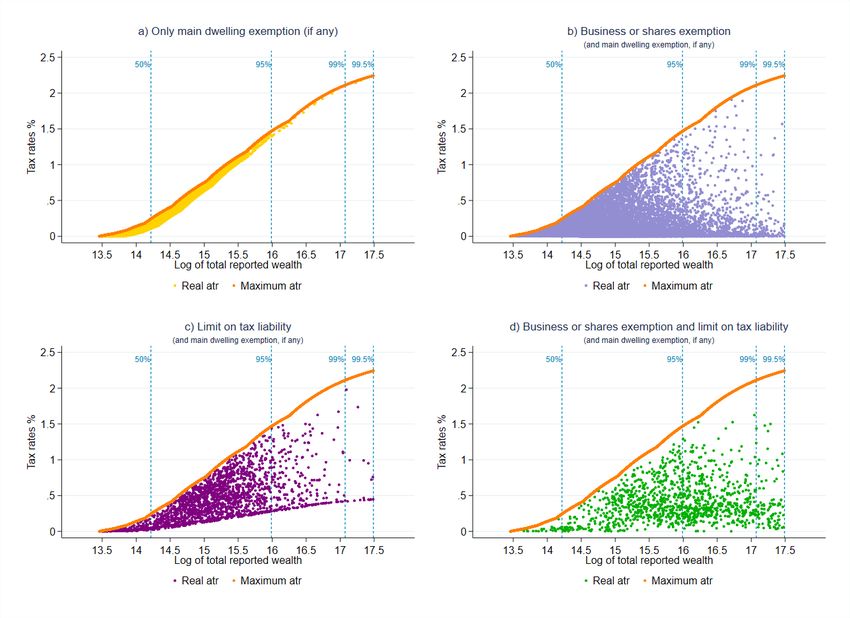
IEB Working Paper 2019/04

           BEHAVIOURAL RESPONSES TO THE (RE)INTRODUCTION OF
                   WEALTH TAXES. EVIDENCE FROM SPAIN *

          José María Durán-Cabré, Alejandro Esteller-Moré, Mariona Mas-Montserrat

ABSTRACT: In the throes of economic crisis, the Spanish government decided to reintroduce the
Wealth Tax, appealing to redistributive motives and its need for greater revenues. This paper studies
how individuals reacted to the reintroduction of this tax by drawing on the universe of wealth tax
returns submitted to the Catalan Tax Agency between 2011 and 2015. Thus, we exploit the variation
in treatment exposure to analyse taxpayers' responses, in terms not only of wealth accumulation, but
also of the potential avoidance strategies adopted. Indeed, our results reflect avoidance rather than
real responses. They show that while facing higher wealth taxes did not have a negative effect on
taxpayers' savings, it did encourage them to change their asset and income composition to take
advantage of wealth tax exemptions (mostly business-related) and the existence of a limit on wealth
tax liability. This translates into an elasticity of taxable wealth with respect to the net-of-tax rate of
return of 0.64, or, put differently, a 0.1 percentage point increase in the average wealth tax rate
leads to a reduction in taxable wealth of 3.24% over 4 years. Overall, these avoidance responses are
quite marked in terms of tax revenues: they represent a 4-year accumulated revenue loss of 2.6
times the 2011 estimated wealth tax revenues. The existence of such responses mostly related to the
design of the wealth tax has relevant policy implications not only in terms of revenues but also
insofar as it undermines the tax's redistributive role.

JEL Codes: H24, H26
Keywords: Spanish wealth tax, behavioural responses to taxation, elasticity of taxable wealth, tax
avoidance and evasion

José María Durán-Cabré                                 Alejandro Esteller-Moré
Universitat de Barcelona &                             Universitat de Barcelona &
Institut d’Economia de Barcelona (IEB)                 Institut d’Economia de Barcelona (IEB)
E-mail: jmduran@ub.edu                                 E-mail: aesteller@ub.es

Mariona Mas-Montserrat
Universitat de Barcelona &
Institut d’Economia de Barcelona (IEB)
E-mail: m.mas@ub.edu

*
   We would like to thank Nadja Dwenger, David Seim, Dirk Foremny, Andreas Peichl, Kurt
Schmidheiny, Matthias Krapf, Carina Neisser, Daniel Waldenström, Joel Slemrod and all participants at
the ZEW internal seminars, ZEW Public Finance Conference, IEB seminar, IEB Workshop on Economics
of Taxation, IIPF Annual Congress and PFFLS-OTPR seminar for their useful comments and
suggestions. Furthermore, we would like to thank the Catalan Tax Agency for providing the data used in
this paper. We acknowledge funding from the Spanish Ministry of Economy and Competitiveness
(ECO2015- 63591-R), from the government of Catalonia (2017SGR796), from the Fiscal Studies Institute
(IEF) and from the Banc Sabadell Foundation.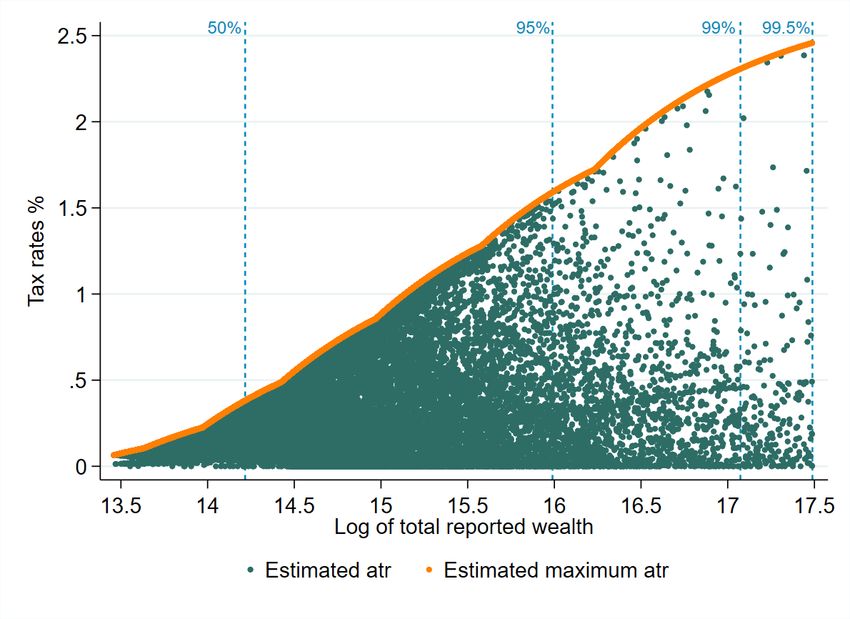
1      Introduction
In the mid-eighties, about half the OECD countries imposed an annual net wealth
tax, but today it is maintained solely by Spain, Norway and Switzerland (OECD,
2018). However, rising wealth inequality1 has revived the debate about the de-
sirability of wealth taxes, not only in academic but also in political and public
circles.2 To date, though, there is a lack of convincing empirical evidence about
the behavioural responses associated with wealth taxation that might help ana-
lysts form a well-grounded position on the need to implement such a tax (Seim,
2017; Brülhart et al., 2017; Zoutman, 2018; Londoño Vélez and Ávila-Mahecha,
2019; Jacobsen et al., 2019).

The aim of this paper, therefore, is to contribute to this literature by studying how
taxpayers reacted to the reintroduction of the Spanish Net Wealth Tax in 2011.
Spain provides a good setting in which to study this tax given that it is one of
the few countries that continues to impose it. Moreover, it is generally accepted
that tax evasion is more widespread here than in other European countries, so our
results might have relevant tax policy implications. Finally, behavioural responses
to wealth taxes in the country have not been previously examined.3

In Spain, wealth taxation has been transferred to sub-central governments, who
have the legislative power to determine certain aspects of its structure. This is
particularly relevant when we consider the reintroduction of the tax and its imple-
mentation. For this reason, in this study we have opted to focus on one of these
sub-central governments (also for questions of data availability), that of Catalonia,
which is in fact the region that collects the highest share of Spain’s overall wealth
tax revenues (about 52% in 20114 and 46% in 20155 ).

Using a panel of tax return micro-data from the universe of Catalan wealth tax-
payers between 2011 and 2015, we analyse whether wealth taxes affect wealth
    1
      Following Piketty (2014), several studies have attempted to estimate the evolution of wealth
concentration. Zucman (2019) provides a review.
    2
      Clear evidence of this is the recent wealth tax proposal made by a US senator, Elizabeth
Warren:      https://www.warren.senate.gov/newsroom/press-releases/senator-warren-
unveils-proposal-to-tax-wealth-of-ultra-rich-americans.
Evidence from the opposite camp comes from France, where the abolition of the net wealth tax in
January 2018 led to social unrest, its reinstatement being one of the key demands of yellow vest
protesters. See, for instance https://www.wsj.com/articles/france-could-keep-wealth-
tax-in-bid-to-placate-yellow-vests-1544025588;                 http://lavdn.lavoixdunord.fr/
518614/article/2019-01-09/le-ps-lance-une-plateforme-numerique-pour-pousser-
son-retablissement or http://piketty.blog.lemonde.fr/2018/12/11/yellow-vests-
and-tax-justice/.
    3
      There exist other studies analysing the Spanish Wealth Tax (e.g. Alvaredo and Saez, 2009;
Durán-Cabré and Esteller-Moré, 2010) but they focus mainly on the evolution of wealth concen-
tration. Alvaredo and Saez (2009) also assess, at an aggregate level, the effects of the introduction
of business exemption.
    4
      https://www.agenciatributaria.es/AEAT/Contenidos_Comunes/La_
Agencia_Tributaria/Estadisticas/Publicaciones/sites/patrimonio/2011/
jrubikf3a8b3676ae1f33ed00f20cdccba2a93cbf97232f.html
    5
      https://www.agenciatributaria.es/AEAT/Contenidos_Comunes/La_
Agencia_Tributaria/Estadisticas/Publicaciones/sites/patrimonio/2015/
jrubik53b6039ed4d69b32b967df1627a59aab8da95302.html

                                                 1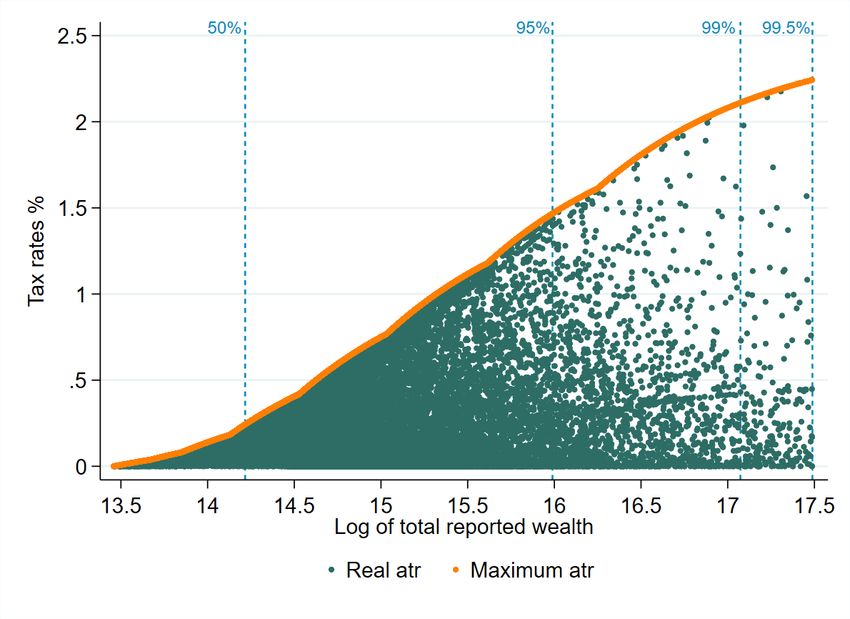
accumulation and taxable wealth. Additionally, we identify potential avoidance
strategies attributable to the design of the Wealth Tax, related primarily to tax
exemptions and the existence of a limit on wealth tax liability. Specifically, we
examine whether taxpayers reorganize their wealth composition and change the
realization of income to benefit from them. Moreover, we also look at the effect
of wealth taxes on (reported) gifts. Finally, we seek to verify whether there is a
positive relation between wealth tax rates and the probability of a taxpayer not
filing wealth tax returns in subsequent years.

As there are no data for the period when the wealth tax was not being imposed,
we take advantage of the unexpected reintroduction of the tax by the Catalan
Government at the end of 2011. This serves as our control year. We use the vari-
ation in treatment exposure, measured through the average tax rates for 2011, to
identify the effects of the wealth tax. This variation, driven mainly by different
ratios of taxable wealth over total reported wealth and different shares of realized
long-term capital gains over taxable income, occurs not only across different levels
of wealth, but also within similar levels. Hence, we control non-parametrically for
taxpayers’ 2011 wealth, income, asset portfolio, age and other relevant character-
istics.

When focusing on a balanced panel of the top 50% richest taxpayers, our results
show that the taxpayers’ response to the reintroduction of the wealth tax was
significant. This translates into an elasticity of taxable wealth with respect to the
net-of-tax rate of return of 0.64, or, put differently, a 0.1 percentage point increase
in the average wealth tax rate leads to a reduction in taxable wealth of 3.24% over
4 years. This effect reflects avoidance rather than real responses. Indeed, while
facing higher wealth taxes does not have a negative effect on savings, it does en-
courage taxpayers to change their asset and income composition to take advantage
of wealth tax exemptions (mostly business-related) and the limit on wealth tax li-
ability. The intensity of the responses varies depending on the initial importance
of taxpayers’ business shares, favouring the use of business exemptions over the
limit on tax liability if initial business shares are high, and vice versa. Overall,
these avoidance responses are high in terms of tax revenues, representing a 4-year
accumulated revenue loss that is 2.6 times the 2011 estimated wealth tax revenues.

As such, this paper provides new empirical evidence to the nascent literature study-
ing behavioural responses to wealth taxation. According to the specific methodol-
ogy applied, the existing literature can be divided into two main groups: one em-
ploys bunching strategies (Seim, 2017; Londoño Vélez and Ávila-Mahecha, 2019)
while the other undertakes difference-in-differences and cross-sectional analyses
(Brülhart et al., 2017; Zoutman, 2018; Jacobsen et al., 2019).6 The former report
much smaller taxable wealth responses to wealth taxes than the latter, primarily
reflecting tax evasion.7 The mechanisms driving such large responses in the latter
studies are unclear.
   6
      Note, however, that Brülhart et al. (2017) and Jacobsen et al. (2019) complement their
main findings with bunching evidence.
    7
      The specific magnitudes as reported in individual studies are detailed below in the Results
section.

                                               2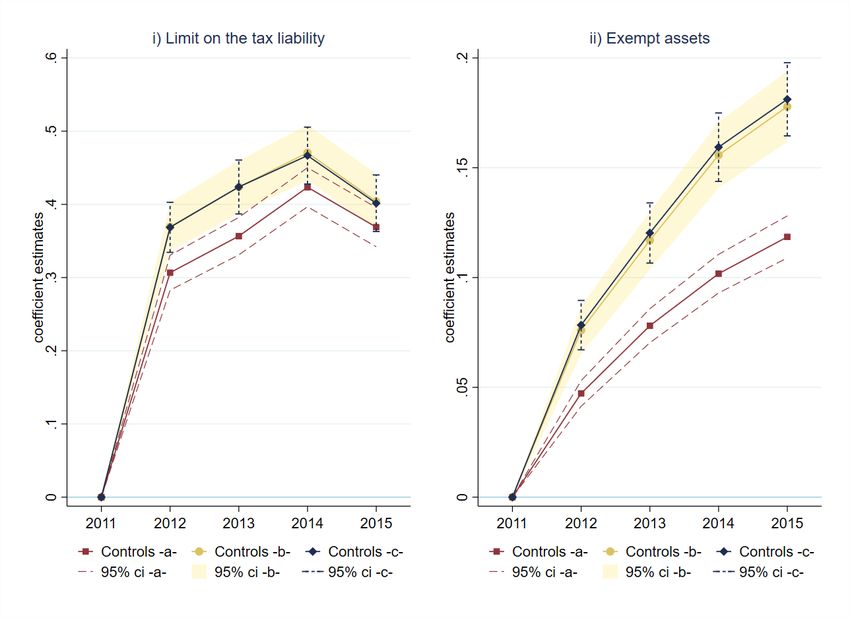
Seim (2017) uses Swedish administrative data and exploits the variation across
wealth tax brackets, while Brülhart et al. (2017) exploit the variation in wealth tax
rates across the Swiss Cantons and municipalities. Jacobsen et al. (2019) employ
Danish administrative data and consider two different sources of variation: first,
changes in the exemption threshold for couples and, second, changes in marginal
tax rates for taxpayers unbound by a tax ceiling. Zoutman (2018) uses a Dutch
capital-income and wealth tax reform that created variation in the rate-of-return
after taxation at each level of income and wealth and, finally, Londoño Vélez and
Ávila-Mahecha (2019) draw on Colombian administrative data and exploit the
time variation derived from several wealth tax reforms and discontinuities in the
wealth tax schedule.

The main contribution of our paper - which by methodology belongs to the second
group of studies identified above - is that it provides both an assessment of the
effect of wealth taxes on taxable wealth and an analysis of other types of response,
focused above all on tax avoidance strategies, which allows us to provide evidence
of the mechanisms driving the results. Thus, the paper also contributes to the lit-
erature on capital taxation and portfolio choice.8 While most earlier studies have
sought to analyse the effect of personal income taxes on investment in financial
assets9 , this paper provides evidence on asset portfolio responses to wealth taxa-
tion, not only in terms of financial assets, but also that of housing and businesses.
On the one hand, higher tax rates lead taxpayers to increase the importance of
their exempt assets - in the main their company holdings - although we also find
a statistically significant (albeit small) effect on their main dwelling exemption.
This finding is in accordance with the empirically documented use of closely-held
businesses as tax shelters (Alstadsæter, Kopczuk and Telle, 2014). On the other
hand, higher tax rates lead taxpayers to increase the importance they attach to
listed equity and investment funds, which enables them to exploit the tax liability
limit.

Likewise, in relation to the application of this limit, our paper documents that
facing higher tax rates results in taxpayers reducing their taxable income and in-
creasing the importance of their long-term capital gains within realized income.
In this regard, our study contributes to the extant literature on the responses of
taxable income to personal income taxes (see Saez, Slemrod and Giertz (2012) for
a general review and Neisser (2018) for an empirical review) and to the literature
studying the effect of taxes on capital gains realizations10 . Finally, we provide
   8
      See Schalck (2017), Bergstresser and Pontiff (2013), Desai and Dharmapala (2011), Alan
et al. (2010), Poterba and Samwick (2002). For a review of the earlier literature, see Poterba
(2002).
    9
      One exception is Bergstresser and Pontiff (2013), who also consider corporate income tax-
ation.
   10
      Some recent empirical studies include Jacob (2018, 2016, 2013), Dı́az-Caro and Crespo-
Cebada (2016) and Daunfeldt, Praski-Ståhlgren and Rudholm (2010). In general, they study
the effect of capital gains taxation on their realization (also known as the lock-in effect) with
the exception of Jacob (2016), who studies the effect of labour income taxes on capital gains
realizations. For a broad review of capital gains responses to taxes, see Hanlon and Heitzman
(2010). With a particular focus on the wealthiest individuals, Auerbach, Burman and Siegel
(2000) show that it is in fact the high-income, high-wealth and more sophisticated taxpayers

                                               3
evidence of gift responses to wealth taxes, which in turn can be related to the
literature studying the effect of gifts and estate taxation on inter-vivos transfers
(see Kopczuk, 2016, for a review)11 . Unlike the former responses, the increase in -
reported - gifts does not persist over time, only being documented during the first
two years after the reintroduction of the tax.

The main conclusion we draw from this study is that wealth taxes do not reduce
wealth accumulation, and that the taxpayers most affected by the reintroduction
of the tax manage to reduce their tax liability significantly by employing avoidance
strategies. These responses are estimated by examining the top 50% richest tax-
payers that submit wealth tax returns every year. In addition, we find a positive
relation between the 2011 wealth tax rates and subsequent non-tax filing. Thus,
in broad terms, this paper contributes to the literature on capital and estate tax-
ation (see Kopczuk, 2016, for a review) and to that on tax avoidance and evasion
(Slemrod and Yitzhaki, 2002; Slemrod, 2018).

The rest of the paper proceeds as follows. Section 2 describes the specific charac-
teristics of the Spanish Wealth Tax and the circumstances surrounding its reintro-
duction in 2011. Section 3 presents the data and descriptive statistics. Section 4
outlines the methodology employed. Section 5 shows the estimation results; and
Section 6 concludes.

2     Spanish Wealth Tax: Evolution and characteristics
The Spanish Wealth Tax was first introduced in 1977 as an extraordinary and
temporary measure, but after more than fifteen years the temporary nature of the
tax was revoked by Act 19/1991. Until that moment, the wealth tax had mainly
been used as an instrument for census and control purposes. However, four addi-
tional objectives were pursued with the wealth tax reform: taxing the additional
ability to pay derived from wealth holdings; achieving a better allocation of re-
sources; serving as a redistributive tool and complementing personal income tax
and inheritance and gift tax.12

The Wealth Tax is levied annually on December 31 and applies to all forms of
wealth: real estate, bank accounts, bonds, shares, investment funds, life insur-
ance, vehicles, boats, aircrafts, jewellery, art and antiques, intellectual or indus-
trial property rights, etc. However, the legislation has incorporated a number of
exemptions: starting in 1991 with elements of historical heritage, art treasures,
pension plans and other financial rights13 , wealth tax exemptions were extended
to business assets in 1994 and “closely-held” companies (both unlisted - in 1994 -
and listed - in 1998 -)14 . Finally, main residences have been exempt from the tax
that are most likely to avoid capital gains taxation.
   11
      In addition to studying the effect of estate and gift taxation on transfers, Joulfaian (2005)
also considers the impact of capital gains taxation.
   12
      Memorandum of Act 19/1991, June 6.
   13
      Limited up to a certain amount. For further information, see Article 4, Act 19/1991.
   14
      Certain conditions must be satisfied for business assets and companies to be exempt from
the Wealth Tax. These requirements are not related to a firm’s size, but rather to a minimum
ownership share (5% individually or 20% within the family group), a minimum remuneration for

                                                4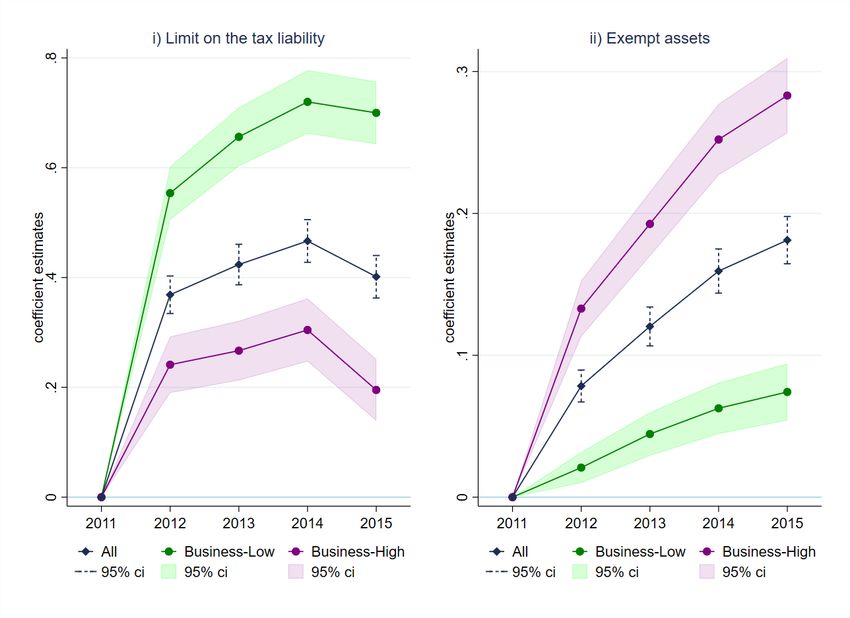
(up to a limit) since 2000.

The Spanish Wealth Tax is only levied on taxable wealth exceeding a minimum
threshold, a limit that has been modified over time. Wealth tax returns have to be
submitted in two different situations: (i) when taxpayers face a positive tax liabil-
ity, or (ii) when, although their tax liability is zero because their taxable wealth
is below the threshold, their gross wealth (including both taxable and non-taxable
assets) is above a certain level15 . Tax liability is obtained by applying progressive
tax rates16 to the net tax base, i.e. taxable wealth minus the minimum threshold.
Moreover, a limit exists on wealth tax liability; specifically, the law sets a ceiling
on wealth tax liability when taxable income is relatively low compared to taxable
wealth.17 It should be noted that, although forming part of the legal definition of
taxable income, long-term capital gains (i.e. those derived from assets owned for
longer than twelve months) are excluded from the ceiling computations.18

Although the main structure of the tax continues to be regulated by Spain’s Cen-
tral government, since the mid-1980s, wealth tax revenues have been transferred to
the regional governments. Some years later, they were also given some limited leg-
islative powers; thus, they can regulate the minimum threshold, tax rates and tax
credits. Additionally, they are also responsible for the administration and control
of the tax. This responsibility has been criticized for undermining the “control”
function of the tax, given the difficulties encountered by the central and regional
tax administrations to work together (Durán-Cabré and Esteller-Moré, 2007).

In addition to the greater fraud risk associated with low rates of tax control (Durán-
Cabré and Esteller-Moré, 2010), many experts have stressed the inefficiencies and
inequities derived from the design of this tax (i.e. assessment rules that differ
from market prices, tax exemptions, etc.).19 Apart from giving rise to horizontal
inequities among taxpayers with different asset portfolios but with similar levels
of wealth, its specific characteristics significantly distort the incidence and redis-
tributive role of the tax given that it is primarily the richest taxpayers who benefit
from them (e.g. Arcarons and Calonge, 2007; Alvaredo and Saez, 2009).

Taking into account these limitations, at the end of 2008 the Central government
the performance of managerial duties (by at least one member of the family group) and the fact
that the company carries out an economic activity. See Appendix A for further information.
   15
      Two million euros in 2011 and 601,012.10 euros in 2007.
   16
      Tax rates set by the Central government range from 0.2 to 2.5%.
   17
      This limit on wealth tax liability is not unique to the Spanish Wealth Tax. For instance, in
France, some Swiss Cantons (OECD, 2018) and Denmark (Jacobsen et al., 2019) have operated
similar ceiling provisions. Indeed, Jacobsen et al. (2019) also exploit this tax feature.
   18
      Specifically, overall wealth and income tax liabilities cannot exceed 60% of taxable income.
The excess, if any, is deducted from the initial wealth tax liability. However, this reduction cannot
exceed 80% of the initial wealth tax liability. In short: Limited wealth tax liability=MAX(60%
taxable income-income tax liability, 20% initial wealth tax liability), if [initial wealth tax liability
+ income tax liability]> 60% taxable income. Note that in these computations, the sum of long-
term capital gains and losses, if positive, is excluded from taxable income and the income tax
liability needs to be adjusted accordingly.
   19
      Enciso (2006), Durán-Cabré and Esteller-Moré (2007, 2014), Fernández de Beaumont and
Martı́n (2010), Carbajo (2015), among others.

                                                   5
decided to abolish the tax given its inability to meet the objectives that justified
its introduction in the first place.20

2.1     The chaotic reintroduction of the Spanish Wealth Tax
Surprisingly, the same Central government who suppressed the tax at the end of
2008 decided to reintroduce it in 2011. The political party in power at that time -
the PSOE, occupying the centre-left of the political spectrum - opted to implement
the reform as a means of addressing the economic crisis. Its argument was that
those with more resources should be made to contribute more to the economic
recovery, and by so doing this would reinforce equity and allow a better redistri-
bution of income and wealth.

Thus, the tax was reintroduced in mid-September of 2011 as a transitory measure
and, a priori, it was only to be imposed in 2011 and 2012. However, the Budgetary
Laws passed in subsequent years have each extended this “transitory” measure and
the Spanish wealth tax remains in force. Two main changes were made with re-
spect to the regulation applicable in 2007: (i) the minimum threshold providing
exemption from tax liability was raised from 108,182.1821 to 700,000 euros and
(ii) the main residence exemption raised from 150,253.03 to 300,000 euros. These
changes sought to exempt the middle-classes from paying the tax.

The reintroduction of the tax was characterised by the confusion to which it gave
rise right up to the very last moment. In July 2011, a prominent member of the
PSOE party - standing for election at the November polls but not a member of
the existing cabinet - proposed the introduction of a Wealth Tax on the richest
Spaniards as part of its manifesto. The proposal came under heavy criticism from
many sides, but above all from that of the centre-right opposition party (PP), who
expressed its dismay at the fact that it had been the PSOE who had originally
abolished the tax at the beginning of its mandate. However, according to the
opinion polls, the PSOE had lost support during its second term in office to the
PP22 , who adopted a clear position against the wealth tax. Thus, in summer 2011,
the proposal to reintroduce the wealth tax remained just that, a proposal.

Although the government ruled out any new tax reforms before the general elec-
tion23 , rumours about an imminent reintroduction of the Wealth Tax emerged in
August 201124 . The possibility was mentioned in various sources, even making the
  20
      Memorandum IV of Act 4/2008, December 23. Due to legal constrains, the Wealth Tax Law
remained officially in force and Act 4/2008 simply introduced a 100% tax credit to the wealth
tax liability.
   21
      Regional governments have legislative capacity to fix a different minimum threshold. Before
the abolishment of the tax, this ranged from 108,182.18 to 150,000 euros depending on the region,
where larger values were applied for specific situations.
   22
      In particular, according to voter intention surveys carried out by CIS (Centro de Investiga-
ciones Sociológicas), PP became the most preferred political party to run the central government
from mid-2010 onwards.
   23
      http://www.europapress.es/economia/noticia-campa-descarta-nuevas-reformas-
fiscales-20110811104212.html
   24
      http://www.europapress.es/economia/fiscal-00347/noticia-economia-gobierno-
estudia-subir-irpf-antes-recuperara-patrimonio-consejo-general-economistas-

                                                6
front pages of several newspapers at the end of August2526 . However, the Cen-
tral government remained equivocal on the matter27 . On September 11, PSOE’s
general election candidate called on the government to reinstate the Wealth Tax,
generating criticism across the board: Right-wing parties condemned government
inconsistency in relation to the Wealth Tax, left-wing parties and organizations
considered it an insufficient and belated measure, and various groups of experts
stressed the inefficiencies and limitations of the tax.

The government failed to provide any specific details about the “new” Wealth Tax
until one day before its reintroduction28 . On September 16, the Council of Minis-
ters agreed to its reinstatement and the legislation was modified accordingly29 .

As discussed above, the Wealth Tax had been transferred to the Autonomous Com-
munities so it was they who would have the legislative power to decide whether
to levy it or not. Thus, even though the Central government had approved its
reintroduction, in the end it fell on the regional governments to implement it or
not. And, indeed, from the very outset, some of these governments, including
those of the Madrid Community and Catalonia, expressed their disagreement with
the measure.

Thus, the centre-right regional government in Madrid gave guarantees that it would
maintain the 100% tax credit introduced with the suppression of the tax, while
the centre-right nationalist Catalan government also expressed its opposition to
reintroducing the Wealth Tax, in line with the significant cuts to the Catalan
inheritance tax made earlier in June that same year. However, with the reform
passed, the Catalan government failed to legislate on the actual implementation of
the tax. Indeed, the Catalan government saw the reform as a short-lived measure,
given that the November General Elections were close and all the indications were
that the PP, who had come out against the reintroduction of the tax, would be
swept into power. This explains why the Catalan government postponed its deci-
sion on the Wealth Tax until the new Central government was formed.30

At the end of November 2011, the Catalan government announced that it would,
after all, levy the wealth tax, if the newly elected Central government decided to
retain it31 , which turned out to be the case. It was not until mid-December that
20110819183751.html
  25
     http://www.europapress.es/nacional/noticia-primeras-paginas-diarios-
llegados-noche-redaccion-20110823001848.html
  26
     http://www.europapress.es/nacional/noticia-primeras-paginas-diarios-
llegados-noche-redaccion-20110826002711.html
  27
     http://www.europapress.es/economia/noticia-salgado-no-aclara-si-piensa-
recuperar-patrimonio-20110823150753.html
  28
     http://www.europapress.es/economia/fiscal-00347/noticia-economia-ampl-
recuperacion-patrimonio-sera-temporal-afectara-160000-contribuyentes-aportara-
1080-20110915132138.html
  29
     Real Decreto-ley 13/2011, de 16 de septiembre, por el que se restablece el Impuesto sobre el
Patrimonio, con carácter temporal.
  30
     http://www.europapress.es/catalunya/noticia-catalunya-aparca-decision-
impuesto-patrimonio-dudas-aplicacion-20110920154146.htm
  31
     http://www.europapress.es/catalunya/noticia-catalunya-no-subira-impuestos-

                                               7
the Catalan government confirmed that it would reintroduce the tax in Catalo-
nia, applying the same conditions foreseen in the state legislation32 , and it was
not until March 2012 (with effect from December 31, 2011) that it approved the
corresponding legislative changes to implement the tax. Consequently, Catalan
taxpayers did not learn that they would have to pay the wealth tax corresponding
to 2011 until the end of that year, limiting their possibilities of responding to its
reintroduction.33
Some months later, towards the end of September 2012, the Central government
announced the extension of the Wealth Tax to 2013.34 Similarly, at the end of
September 2013, the government prolonged the tax again to 2014, and so on,
down to the present day. In Catalonia, at the end of 2012, the Catalan govern-
ment actually agreed to a slight increase in the wealth tax rates and lowered the
minimum threshold to 500,000 euros from 2012 onwards.35
2.2 How to avoid the Spanish wealth tax
Given the specific characteristics of the Spanish wealth tax, we need to comment
on the mechanisms that allow the tax liability to be reduced as this helps explain
the outcomes we present in our empirical analysis.
An obvious way to overcome the tax burden attributable to the progressivity of
the tax is by decreasing wealth. This can be achieved by making gifts, although
they are subject to gift taxes36 . However, the design of the tax allows taxpayers
to adopt other strategies to reduce, or even eliminate, their tax liability without
decreasing their stock of wealth. Taxpayers do not even need to hire a tax advisor
- although many do - nor have a detailed knowledge of Tax Law to learn about
these strategies, as there are many explanations and suggestions available on the
internet.37
aplicara-patrimonio-si-pp-mantiene-20111122171408.html
32
http://www.europapress.es/economia/macroeconomia-00338/noticia-economia-
ampcataluna-estudiara-medidas-legales-reclamar-gobierno-759-millones-
disposicion-estatut-20111207103034.html
33
There is anecdotal evidence in the form of readers’ letters to one of Catalonia’s leading
newspapers complaining about the impossibility of making plans with respect to the wealth tax
due to the lack of information and time constraints (see, for instance, La Vanguardia newspaper,
November 28, 2011, p. 22, article ‘Hay que planificar’ ).
34
http://www.europapress.es/economia/macroeconomia-00338/noticia-economia-
gobierno-crea-impuesto-loterias-prorroga-patrimonio-elimina-deducciones-
sociedades-20120927175205.htm
35
Statutory wealth tax rates were increased by 5%, except for the last tax bracket (net tax
base above 10.7 million euros) were the increase was 10%.
36
Gifts taxes depend on the family relationship between donor and recipient and on the
recipient’s region of residence. In Catalonia, for instance, tax rates range between 5-9% and
11.12-64% for gifts to close and distant relatives, respectively. Additionally, in the case of giving
real estate, the donor would face two taxes on capital gains (personal income tax and a local tax
on urban land transmissions).
37
Google provides 16.5M entries (April 10, 2019) when searching Como pagar menos impuesto
patrimonio (How to pay less wealth tax). Some examples are (websites in Spanish):
https://www.consultingdms.com/impuesto-patrimonio-en-espana-10-formulas-
legales-para-evitarlo-o-reducirlo/;
https://www.impuestosparaandarporcasa.es/2011/09/cuidado-con-lo-que-haceis-
8These strategies are related to reducing taxable wealth in favour of exempt assets,
making use of the limit on wealth tax liability or changing tax residence to another
region where the wealth tax is not levied (e.g. Madrid). Examples for implement-
ing the first option include: i) changing fiscal residence to that of the dwelling with
the highest assessment so as to take advantage of the main-residence exemption38 ;
ii) saving through pension plans; iii) investing in art treasures; or iv) increasing
business exemptions. The taxpayer can achieve the latter by arranging their own
businesses/shares in such a way that they satisfy the exemption requirements fore-
seen in the Law (see Appendix A). If these conditions are already satisfied, the
exemption value can be increased by capitalizing the company, for instance. In the
case of the first three examples above, it should be stressed that their effectiveness
for reducing taxable wealth is limited as exemptions are bounded39 .
The alternatives for exploiting the limit on wealth tax liability are also diverse.
They require the taxpayer to reduce realized income and to invest in assets that
can generate long-term capital gains40 . Both options can be achieved by investing
in investment funds, since these assets do not generate regular income - such as
dividends or interest - but only capital gains (or losses) when sold. Shares are an-
other type of asset that can help the taxpayer benefit from the limit on tax liability.
Finally, the most radical strategy would be to move to Madrid, where the wealth
tax is not levied (and other taxes, such as personal income tax, are also lower).
However, if a tax audit were to be conducted the taxpayer would have to demon-
strate that this change of fiscal residence was neither fictitious nor motivated by
reasons of tax avoidance.
The most convenient strategy depends on the income-wealth ratio and the asset
portfolio of each taxpayer. For instance, for those who already own a business
it might be easier and less costly to take advantage of the business exemption.
Alternatively, those who have lower income and significant investments in financial
assets might find it easier to benefit from the limit on tax liability. Taxpayers with
high income and high job mobility might consider relocating to Madrid.
para-no-pagar-impuesto-del-patrimonio;
https://cincodias.elpais.com/cincodias/2016/10/13/abante_asesores/1476347818_
147634.html.
38
This can only be done if the taxpayer owns several housing properties. According to the
Spanish Survey of Household Finances (wave 2011), 89% of individuals in the last decile of
wealth distribution - that is, those most comparable to the population under study - own other
real estate properties besides their main dwelling (Banco de España, 2014).
39
Main residence exemption is limited up to 300,000 euros. The yearly contribution to pension
plans was limited to 10,000 euros (12,500 euros for those older than 50). The exemption on art
treasures depends on the type of asset and ranges from 2,404.05 to 90,151.82 euros.
40
As explained at the beginning of Section 2, long-term capital gains are excluded from the
computation of the limit on wealth tax liability.
93 The data
The main data source used in this paper is the universe of anonymized wealth tax
returns filed by Catalan tax residents for the years 2011 to 2015. We have com-
plemented this database with an indicator of the taxpayer’s age and information
from inheritance and gift tax returns.41 All the data have been provided by the
Catalan Tax Agency.
The main database contains, at the micro level, all the information reported in the
wealth tax returns aggregated by types of asset. That is, the total stock of wealth
classified into real estate and main residence exemption, bank accounts, business
assets, bonds, investment funds, non-exempted quoted shares and unlisted com-
panies, exempted quoted shares and unlisted companies, life insurance, vehicles,
jewellery, artwork, property rights and “other”, including all taxable wealth not
previously categorized. Unfortunately, some exempt assets such as historical her-
itage, art treasures and pension plans do not have to be reported, which might
underestimate the overall stock of taxpayers’ wealth. Nevertheless, according to
the Spanish Survey of Household Finances (SHF) - wave 2011 - conducted by
the Bank of Spain, assets of this type represent a small fraction (around 4%) of
households’ net wealth.42 Apart from wealth portfolio, tax returns also include
information on total taxable income and personal income tax liability. Regard-
ing personal characteristics, little information is reported: just marital status and
place of residence. As previously mentioned, though, we are also able to consider
age.
Table 1 provides descriptive statistics for 2011 wealth tax returns.43 Statistics are
provided by wealth deciles and total number of observations. Here, certain features
should be stressed: i) as total reported wealth increases, the difference between
taxable wealth and total wealth also increases; and ii) there is significant variation
in the average tax rate within the same wealth decile. We return to this last point
in the following section. Figure 1 shows the average asset portfolio, including all
reported assets (both taxable and exempt), by wealth deciles. The importance of
unlisted companies increases with wealth, while the reverse occurs with real estate
properties and bank accounts or bonds.
The data from the 2011 tax returns submitted to the Catalan Tax Agency show
there were 42,294 tax filers facing a positive tax liability and 1,942 tax filers with
zero tax liability but gross wealth exceeding 2 million euros. Putting the total
number of tax filers - 44,236 - in perspective, they represent about 1.27% of per-
sonal income tax filers44 and about 0.59% of individuals residing in Catalonia in
41
We are able to know whether a taxpayer dies after 2011 or has declared a gift from 2008
onwards.
42
This figure can be extracted from Table 2(cont.) and Table 4(cont.) from Banco de España
(2014). We focus on the statistics for the last decile of the wealth distribution because it is the
most comparable to the population under study.
43
All wealth tax filers are considered, that is, those who face a positive tax liability and
those who must submit the tax return because their overall gross wealth exceeds 2 million euros,
although their taxable base is below the minimum threshold.
44
Information obtained from the statistics published by the Spanish Tax Administration:
10201145 . Of these 2011 wealth tax filers, 36,373 (82.22%) continued to submit a
wealth tax return in 2015. Of the taxpayers who disappeared from the sample
(17.78%), 6.42% died and the remaining 11.36% disappeared for other reasons
(wealth losses, mobility, evasion, etc.). In our empirical analysis we exclude those
taxpayers that died. Additionally, we only consider those tax filers who submitted
the 2011 tax return, which means those taxpayers who began to submit wealth
tax returns later (from year 2012 onwards) are not included in our study. In fact,
most of our estimations use a balanced panel of tax filers from the top 50% of
the observed wealth distribution46 , according to the stock of wealth reported in
2011, who submitted wealth tax returns consecutively between 2011 and 2015. We
provide further details about this in Section 4.
Finally, when a taxpayer voluntarily submits a supplementary return to declare
additional wealth, we consider this last return in our analysis. This was a quite
common occurrence among 2011 tax returns due to a tax amnesty issued by the
Central government in November 2012.47
3.1 Some descriptive facts on outcomes of interest
Table 2 shows the evolution taken by Wealth Tax revenues between 2011 and 2015.
Values are expressed in 2011 prices. The figures shown in Table 2 only consider
those tax filers who submitted, at least, a 2011 tax return. In the case of the
2011 wealth tax revenues, two different indicators are given: a) the amount of
revenues actually collected; and b) an estimation of the revenues that would have
been collected if the tax changes approved in 2012 had already been applied to
2011 wealth48 . This estimation is provided to enable comparability across years.
A notable trend emerging from Table 2 is that wealth tax revenues decreased by
19.23% between 2011 and 2015. When considering just those taxpayers who sub-
mitted the tax return every year between 2011 and 2015, there was a fall of 3.64%.
Revenues fell by 8.37% when considering that group of taxpayers included in most
of our estimations, i.e. those placed among the top 50% of the observed wealth
distribution filing wealth tax returns every year. Another point that can be ex-
tracted from Table 2 is the importance, in terms of revenues, of taxpayers who
stop filing wealth tax returns. If we sum all collected revenues (2011.a to 2015) for
rows [1] and [2] we obtain 1,854M and 1,680M euros, respectively. This translates
into a wealth tax revenue loss of almost 174M euros (expressed in 2011 prices)
attributable to taxpayers who no longer submitted wealth tax returns during the
https://www.agenciatributaria.es/AEAT/Contenidos_Comunes/La_
Agencia_Tributaria/Estadisticas/Publicaciones/sites/irpf/2011/
jrubik6ae6ffddfab109478ffa0128999b8085fe3b9c97.html.
45
Information obtained from the Catalan Statistical Institute: https://www.idescat.cat/
pub/?id=pmh&n=446.
46
We focus on the top 50% of the wealth distribution derived from the population under study
(i.e. wealth tax filers) not from the entire population.
47
The tax amnesty offered the possibility to regularize evaded income by paying a 10% tax
rate on the gross revenues generated during the last 4 years. Regularization of income implied
the declaration of wealth generating such income, and this is why many taxpayers presented a
supplementary wealth tax return. Indeed, 15.21% of 2011 tax filers submitted a supplementary
2011 wealth tax return around November 2012.
48
See Section 2.1 for further information regarding wealth tax changes.
112012-2015 period. Recall, of these 174M euros, only 17.88% can be explained by
taxpayers who died.
Table 3 provides some descriptive figures for the evolution of reported wealth and
tax avoidance strategies described in Section 2.2. All figures refer to taxpayers
placed at the top 50% of observed wealth distribution who filed wealth tax returns
every year between 2011 and 2015. Contrary to the evolution of wealth tax rev-
enues shown in row [3] of Table 2, overall reported wealth increased during this
period and, so, the latter does not seem to explain the former. This in turn sug-
gests there might be other factors, other than a fall in the stock of wealth (such
as the adoption of avoidance strategies), that are driving the reduction in tax rev-
enues. Indeed, a comparison of the 2011-2015 figures in Table 3 shows that the
relevance of wealth exemptions, assets that allow an investor to obtain long-term
capital gains and the limit on wealth tax liability have increased substantially over
time.
In the case of the strategy of changing tax residence to another region, the only
information available to us thus far is that 11.36% of 2011 tax filers disappeared
from the sample in subsequent years for reasons other than death. If we focus on
the 50% richest, the share is similar, at 10.15%. When looking at gifts reported
to the Catalan Tax Agency, 5.92% of 2011 wealth taxpayers (7.70% for those in
the top 50%) made a gift between 2008 and 2011, when the wealth tax was not in
force. This share rose to 9.98% (14.26% for top 50%) for gifts made between 2012
and 2015.
These are, nevertheless, merely descriptive facts. In the following sections we
consider the tax planning strategies explained above and examine the effect of
wealth taxes on wealth accumulation, on asset portfolio, on the probability of
making a gift, on taxable income and on other relevant outcomes.
4 Methodology
4.1 Measuring the impact of the reintroduction of the wealth
tax
As discussed, the objective of this paper is to study how taxpayers responded to
the reintroduction of the wealth tax in terms of wealth accumulation, wealth com-
position and other outcomes we describe below. The ideal setting to carry out this
study would be that in which it was possible to compare - before and after the
reform - wealth taxpayers to similar individuals not subject to the tax. However,
this ideal control group does not exist. Therefore, instead, we use as our identifi-
cation strategy the variation in exposure to the treatment (i.e. the reintroduction
of the tax).
Figure 2, panel (a), shows the 2011 average tax rates, defined as the wealth tax
liability over total reported wealth, for different levels of wealth. Additionally,
it shows the highest average tax rate a taxpayer would face for a given level of
wealth, assuming all reported wealth is taxed (i.e. there are no exemptions other
12than the minimum threshold of 700,000 euros that applies to everyone) and the
limit on tax liability is not operative.
Note that for a given level of wealth, some taxpayers face an average tax rate
close (or equal) to the maximum, whereas others face a much lower (or even zero)
average tax rate. In other words, taxpayers with similar levels of wealth were
differently affected by the reintroduction of the wealth tax. This dispersion in
tax rates originates from different sources: differences in taxable wealth due to
main residence and business exemptions and differences in the tax liability when
the limit applies. Using the average tax rate as a measure of exposure to the
treatment allows us to compile all these factors into a single indicator. Figure A1
in Appendix B shows 2011 average tax rates for different types of taxpayer: a)
those for whom only the main-dwelling exemption is applied, if any; b) those who
also report business exemptions (including both listed and unlisted companies);
c) those who qualify for the limit on tax liability and d) those who satisfy both
b) and c). Most of the variation in the tax rates originated from situations b),
c) and d), given that the main-dwelling exemption is bounded up to 300,000 euros.
Figure 2, panel (b), shows an estimation of the average tax rates that taxpayers
would have faced in 2011 if the wealth tax changes approved in 2012 had been
applied in the previous year. The picture does not change greatly from panel (a).
This is the case because, again, tax changes would differently affect taxpayers with
similar levels of wealth due to the existence of wealth tax exemptions and the limit
on wealth tax liability. Therefore, both indicators (real and estimated average tax
rates) provide very similar measures of taxpayers’ exposure to the wealth tax.
Most of the literature uses marginal tax rates to analyse responses to tax rate
increases (or decreases)49 , usually in the last tax bracket. However, it is not
the aim of this paper to study responses to a tax change but rather to a tax
(re)introduction. It seeks as such to examine how exposure to this reform affected
the evolution of wealth and its components. In this context, we believe marginal
tax rates to be a poorer measure of treatment intensity, especially for the wealth-
iest. This is the case because tax brackets are wide50 and, thus, taxpayers with
different tax liabilities may face the same marginal tax rate. Therefore, for the case
under study we consider it more appropriate to use average rather than marginal
tax rates as our explanatory variable.51
Returning to Figure 2, it is evident that the variation in tax rates increases with
wealth and that it is quite low for the bottom 50% of the observed wealth dis-
tribution. Precisely because our identification strategy relies on the variation in
treatment exposure, henceforth we focus our analysis on the top 50% of the ob-
49
See, for instance, Saez, Slemrod and Giertz (2012) for a review on the elasticity of taxable
income.
50
Table A2 in Appendix C shows the statutory tax rates in Catalonia for 2011.
51
An alternative explanatory variable could be an average tax rate expressed in terms of
income rather than wealth. However, we believe the average tax rate expressed over wealth to be
more accurate. Some taxpayers in our data misreport information on income and, additionally,
wealth is a stock whereas income is a flow, which is more likely to fluctuate and, so, provide a
distorted indicator.
13served wealth distribution. In fact, according to the figures provided in Table 2,
the bottom 50% only accounts for a small part of the 2011 collected wealth tax
revenues, so the potential responses we fail to estimate should have little impact
in terms of revenues.
Using the 2011 average tax rates as our explanatory variable has, therefore, the
advantage of providing an accurate indicator of the treatment exposure, but it also
has a drawback: it depends on taxpayers’ 2011 wealth, income and asset portfolio.
To deal with this issue, we control non-parametrically for taxpayers’ 2011 wealth,
income, asset portfolio, age and other characteristics that might influence our
dependent variables (see the following section for further details).
4.2 Measuring behavioural responses to the reintroduction
of the wealth tax
Unfortunately, we have no information on taxpayers’ wealth for the period when
the wealth tax was not in force, as it was simply not being collected. However,
taking into account the largely unexpected and belated reintroduction of the tax
in Catalonia (see Section 2.1), we argue that 2011 can serve as a control year.
This assumption is further reinforced by the fact that wealth is a stock, which is
not easily adjusted instantaneously, and in any case, such adjustments are costly.
The initial short-term duration of the measure (just 2 years) increased these ad-
justment costs. Moreover, as discussed in Section 2, the assessment rules do not
always coincide with the market value, but depend on specific criteria, a situation
that complicates the asset valuation adjustment. For instance, wealth deposited
in bank accounts is valued at the highest of the 4th quarter average balance or
the balance at December 31. For quoted shares and quoted bonds, the 4th term
average value is also used. Banks and investment entities do not provide their
customers with all this information until the first quarter of the following year
when they have to file their income and wealth tax returns. Unlisted companies
are assessed according to the book value obtained from their last audited balance
sheet, i.e. 2010 balance sheets for the 2011 wealth tax returns. In the case of real
estate, this is not assessed according to its market price either, but by the highest
between its administrative and acquisition values.
The tax administration does not automatically receive information on wealth ex-
cept for real estate values. However, it does automatically receive information on
capital income, which can be easily related to wealth. In this sense, it is difficult
for taxpayers to hide wealth that generates income directly reported to the tax
administration. The situation is obviously different for unproductive assets, such
as antiques or jewellery, and indeed very few tax filers report wealth of this kind.
In any case, according to survey evidence, this wealth represents a very small frac-
tion of taxpayers’ total worth.52
52
According to the Spanish Survey of Household Finances (wave 2011), jewellery, works of art
and antiques represent around 0.9% of net wealth for the last decile of the wealth distribution,
i.e. the one most comparable to the taxpayers under study here.
14While we cannot directly test the assumption that taxpayers were largely unable
to react to the reintroduction of the wealth tax in 2011, we can inspect related
indicators such as gifts. This is a rapid and effective manner of reducing wealth.
Thus, if taxpayers had made a concerted effort to rapidly reduce their wealth at
the end of 2011, we should observe a spike in the number of gifts declared during
that period. However, gifts data suggest this not to be the case. Figure A2 in
Appendix B shows the frequency of gifts declared in Catalonia during the last 8
weeks of every year between 2009 and 2014. Gifts declared during the last 8 weeks
of year 2011 are no higher than in previous years, when the wealth tax was not in
force.
In any case, we do not need a complete lack of response in 2011 for our identifica-
tion strategy. What we, in fact, require is that, after controlling for 2011 reported
wealth, income, asset portfolio, age and other personal characteristics (see below),
taxpayers are comparable and would behave in the same way in the absence of
the wealth tax. This requires a similar reporting (and under-reporting) behaviour
among similar taxpayers based on their 2011 tax returns. In the case of significant
under-reporting behaviour in 2011 due to the reintroduction of the wealth tax
(which we consider implausible for the reasons outlined above)53 , the responses we
estimate would be a lower bound.
The empirical specification we implement is the following:
X X
Dep.vari,t = αy · Yy=t · atri11 + γt + δi + λy · Yy=t · Xi11 + νi,t (1)
y6=2011 y6=2011
where Dep.vari,t are the different dependent variables that we explain below, Yy=t
is a year dummy that takes a value of 1 when the year equals t, atri11 is 2011
average tax rates, αy is our parameter of interest54 , γt captures year fixed effects,
δi is an individual fixed effect and Xi11 is a set of non-parametric controls detailed
below and based on the reference year, 2011. In the case of atri11 , we use both the
real and the “estimated” 2011 average tax rates shown in Figure 2.
The dependent variables we examine are: log of taxable wealth, log of total re-
ported wealth, log of taxable income, the probability of making (and declaring) a
gift55 , the probability of facing the limit on tax liability56 , the share of long-term
capital gains over taxable income, the share of exempt assets over total reported as-
sets and different components of taxpayers’ asset portfolio; specifically, the share
of (i) real estate; (ii) business assets and unlisted companies; (iii) listed equity
and investment funds; and (iv) bank accounts and bonds, distinguishing between
exempt and taxable assets. Indeed, we are interested in the evolution of these
variables with respect to the base year; hence, the estimates are normalized to
zero in 2011. Given that the type and magnitude of the responses might vary
53
Here, we do not consider offshore evaded wealth, which would not have been reported either
in the absence of the wealth tax due to the existence of income taxes.
54
We later relate this coefficient with elasticities with respect to the net-of-tax rate of return.
55
We define a dummy which takes a value of 1 if a taxpayer makes a gift in year t (and it is
reported to the Catalan tax authorities), and 0 otherwise.
56
We define a dummy which takes a value of 1 if a taxpayer faces the limit on tax liability in
year t, and 0 otherwise.
15depending on the initial wealth composition, we examine heterogeneous effects ac-
cording to the relative importance of unlisted companies and business assets over
total reported assets in 2011.
We also show the estimation results from specification (1) without including the
set of non-parametric controls Xi11 interacted with year dummies Yy=t . To be able
to talk about causal effects, the underlying assumption behind this specification
would require that wealth components evolved in the same way for all taxpayers
in the absence of the wealth tax, once time and individual fixed effects have been
taken into consideration. However, we consider this a strong assumption to make,
especially because we cannot test it, given the absence of data for the period when
the wealth tax was not in force. For this reason, we include the control variables
defined below.
To capture non-tax trends driven by changes in asset prices and asset-specific re-
turns57 , we create deciles of the following asset shares: i) housing; ii) listed equity
and investment funds; iii) unlisted companies and business assets; and iv) bank
accounts and bonds. Since we only have information on overall taxable income,
but not on capital income specifically, we control both for taxable income58 and
wealth deciles to further address differences in returns, given that there is evidence
of a positive correlation between returns and the level of wealth (Fagereng et al.,
2018). Additionally, controlling for income and wealth levels avoids mean reversion
issues. To deal with differences in saving rates and attitudes towards inheritance
and gift tax we control for age groups with the following cut-offs: 45, 65 and 75
years.59 To further control for differences in saving rates we also include deciles of
the share of debt over total assets. All these control variables are defined accord-
ing to the information reported in 2011 wealth tax returns and interacted with
year dummies Yy=t . Finally, as the tax amnesty mentioned in Section 3 took place
during the period under study, this might have affected the reporting behaviour
from 2012 onwards. Thus, we also include a dummy indicating tax amnesty par-
ticipation interacted with year dummies.60 For reference purposes, we define this
set of controls as “decile controls”.
Constrained by the fact that we cannot test the parallel trends assumption, we
also use an alternative set of non-parametric controls including the same variables
detailed above, but defined more narrowly to dissipate the correlation between
2011 average tax rates and 2011 taxpayers’ wealth, income and asset portfolio. In
57
Considering the specific assessment rules provided in the Wealth Tax Law, changes in asset
prices might not necessarily be reflected in tax returns (for instance, those related to real estate).
However, changes in asset returns might affect taxpayers’ investment and saving behaviour.
58
We define an extra category for those taxpayers who do not report information on income
(representing 10% of the observations used in the main estimations). We also checked that our
results do not substantially change when excluding these observations.
59
We define an extra category for those taxpayers whose age is non-available (representing
just 0.06% of the observations used in the main estimations).
60
We do not know exactly whether a taxpayer participated in the tax amnesty or not, but
we can identify those taxpayers who submitted a supplementary 2011 wealth tax form when
the tax amnesty took place (October-November 2012). Therefore, we consider as tax amnesty
participants those taxpayers who filed an additional 2011 wealth tax form during, or later than,
October 2012.
16You can also read