Opinions as Facts Leonardo Bursztyn Christopher Roth Aakaash Rao David Yanagizawa-Drott July 1, 2021
←
→
Page content transcription
If your browser does not render page correctly, please read the page content below
Opinions as Facts∗
                                           Leonardo Bursztyn†
                                              Aakaash Rao‡
                                            Christopher Roth§
                                         David Yanagizawa-Drott¶

                                                 July 1, 2021

                                                   Abstract
      The rise of opinion programs has transformed television news. Because they present anchors’
      subjective commentary and analysis, opinion programs often convey conflicting narratives about
      reality. We first document that people turn to opinion programs over “straight news” even when
      provided large incentives to learn objective facts. We then examine the consequences of diverging
      narratives between opinion programs in a high-stakes setting: the early stages of the coronavirus
      pandemic in the US. We document stark differences in the adoption of preventative behaviors
      among viewers of the two most popular opinion programs, both on the same network, which
      adopted opposing narratives about the threat posed by the coronavirus pandemic. We then show
      that areas with greater relative viewership of the program downplaying the threat experienced
      a greater number of COVID-19 cases and deaths. Our evidence suggests that opinion programs
      may distort important beliefs and behaviors.

      JEL Codes: C90, D83, D91, Z13
      Keywords: Opinion programs, Media, Narratives

   ∗
     This draft supersedes a previous draft circulated under the title “Misinformation During a Pandemic.” We
thank Alberto Alesina, Davide Cantoni, Bruno Caprettini, Ruben Durante, Eliana La Ferrara, Nicola Gennaioli,
Ed Glaeser, Nathan Nunn, Ricardo Perez-Truglia, Andrei Shleifer, David Yang, Noam Yuchtman, and numerous
seminar participants for very helpful comments and suggestions. We thank Silvia Barbareschi, Aditi Chitkara,
Jasurbek Berdikobilov, Hrishikesh Iyengar, Rebecca Wu, Alison Zhao, and especially Vanessa Sticher for outstanding
research assistance. We are grateful to the Becker Friedman Institute for financial support. The experiment was
pre-registered on the AEA RCT registry under ID AEARCTR-0006958.
   †
     University of Chicago and NBER, bursztyn@uchicago.edu
   ‡
     Harvard University, arao@g.harvard.edu
   §
     University of Cologne, Econtribute, CAGE Warwick, CESifo, CEPR, briq, roth@wiso.uni-koeln.de
   ¶
     University of Zurich and CEPR, david.yanagizawa-drott@econ.uzh.ch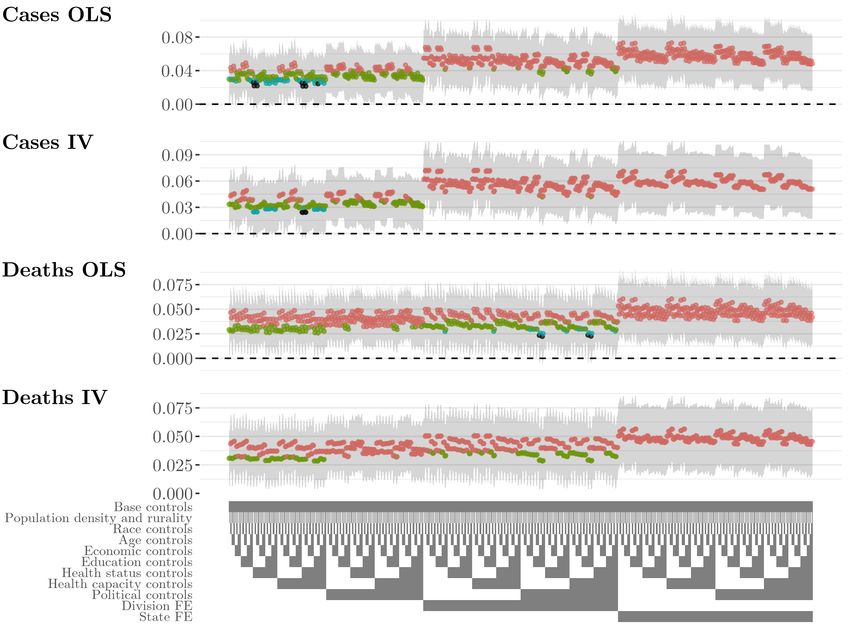
1        Introduction
Over the past two decades, opinion programs have come to dominate cable television news. Unlike
“straight news,” which professes to impartially report “just the facts,” opinion programs convey
their anchor’s perspective on the news of the day. They typically feature little original reporting;
instead, they focus on story-telling, entertainment, and subjective commentary (Kavanagh et al.,
2019), at the expense of objective factual reporting (Kavanagh and Rich, 2018). Consequently,
different opinion programs often present distinct, and often conflicting, narratives about reality.
        Cable networks themselves distinguish their “hard” or “straight” news reporting from their
opinion content. For example, when defending a leading anchor from defamation claims, Fox
News successfully argued that “the ‘general tenor’ of the show should then inform a viewer that
the host is not ‘stating actual facts’ about the topics he discusses and is instead engaging in
‘exaggeration’ and ‘non-literal commentary’.”1 MSNBC successfully adopted the same approach:
“For her to exaggerate the facts. . . was consistent with her tone up to that point, and the court finds
a reasonable viewer would not take the statement as factual given this context”.2 Emphasizing the
difference between straight news and opinion, Fox News’ president wrote:

          “We’ve always said that we have strong opinion and strong news. And, again, I think
          that’s part of the success. You know what you’re getting.”3

Do viewers know what they’re getting? If viewers interpret opinion programs appropriately, then
these shows may make valuable contributions to political discourse: they are generally more en-
gaging than straight news programs and they can distill complex issues into easy-to-understand
narratives (Jacobs and Townsley, 2011). On the other hand, if viewers trust the literal statements
made on opinion programs just as they would those made on straight news, failing to distinguish
between opinion and fact and to appropriately discount hyperbole and speculation, then diverging
narratives across programs can lead different segments of the population to hold dramatically dif-
ferent views of reality. Commenting on this phenomenon in 2010, veteran journalist Ted Koppel
wrote:

          “Daniel Patrick Moynihan’s oft-quoted observation that ‘everyone is entitled to his own
          opinion, but not his own facts,’ seems almost quaint in an environment that flaunts
          opinions as though they were facts.”4

In this paper, we examine the extent to which viewers turn to opinion programs for information
about objective facts and the consequences of this trust for high-stakes outcomes.
    1
    See “McDougal v. Fox News Network.” JUSTIA US Law, 2020.
    2
    See “Herring Networks, Inc. v. Maddow.” Casetext: Smarter Legal Research, May 22, 2020.
  3
    See “Fox News Exec Jay Wallace Gets Candid About Ratings, White House Access (Q&A).” The Hollywood
Reporter, January 2, 2018.
  4
    See “Ted Koppel: Olbermann, O’Reilly and the death of real news.” The Washington Post, November 14, 2010.

                                                     1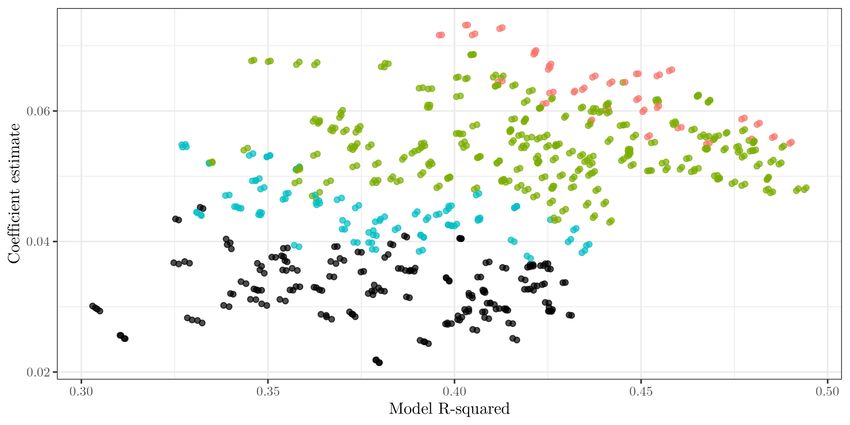
We begin with a pre-registered motivating experiment conducted with a sample of regular
viewers of the two most popular cable news networks, Fox News and MSNBC. We tell participants
that they will provide their best guess about an objective statistic relating either to the spread of
the COVID-19 pandemic or to one of four dimensions of the country’s economic performance, all
as of a randomly-selected recent date. In order to inform their guess, respondents can choose one
of four TV clips, which were all excerpted from shows broadcast on the same week as the date
pertinent to their guess. These four clips comprise the two most popular straight news programs
and the two most popular opinion programs on their network. 75% of Fox News viewers choose
opinion programs over straight news programs, as do 60% of MSNBC viewers. Varying the reward
for a correct answer from $10 to $100 has a precisely estimated zero effect, suggesting that viewers
trust opinion programs to reveal factual information even when making choices with relatively
higher stakes.
    Precisely because they are less constrained by the need to report objective content, opinion
programs often diverge not only from “straight news” but also from one another. This is particu-
larly important given the dominant — and growing — role of opinion content in primetime cable
news: different anchors, each drawing weekly audiences of several million, can present dramatically
different narratives about reality.5 Do these different narratives have consequences for real-world
outcomes? Identifying the causal effect of such diverging narratives on behavior is challenging for
several reasons: most importantly, ruling out alternative explanations for behavioral differences
among consumers of different opinion programs — such as different prior beliefs, different ideolo-
gies, or different preferences — generally requires a setting in which two opinion programs that
are ex ante similar, both in their content and in the characteristics of their viewers, suddenly and
sharply diverge in their coverage of a given topic, and moreover that this topic can be linked to
naturally-occurring outcomes.
    To overcome these empirical challenges, we examine the two most popular opinion programs in
the United States: Hannity and Tucker Carlson Tonight. These shows are aired back-to-back on the
same network (Fox News) and had relatively similar content prior to January 2020. Yet as we show
through qualitative evidence, text analysis methods, and human coding of the programs’ scripts,
the programs differed sharply in the narratives they adopted about the COVID-19 pandemic.
While both narratives were consistent with the anchors’ right-wing slant, they had very different
implications for viewers’ beliefs and behavior. Carlson emphasized the severity of the threat as
early as January while placing blame on China for its lack of transparency with the international
community, later hosting a Chinese virologist who alleged that COVID-19 is a bio-weapon created
by the Chinese Communist Party.6 In contrast, Hannity largely ignored or downplayed the threat
   5
     See “Fox News Changes Up Daytime Lineup, Adds New Opinion Show at 7 p.m.” The Hollywood Reporter,
January 11, 2021.
   6
     See “Tucker Carlson: Racist for Saying ‘Chinese Coronavirus’ ? Now’s Not the Time for the Dumbest Identity
Politics.” Fox News, March 12, 2020. “Tucker Carlson Blames Media for Coronavirus Spread: ’Wokeness Is A Cult.

                                                      2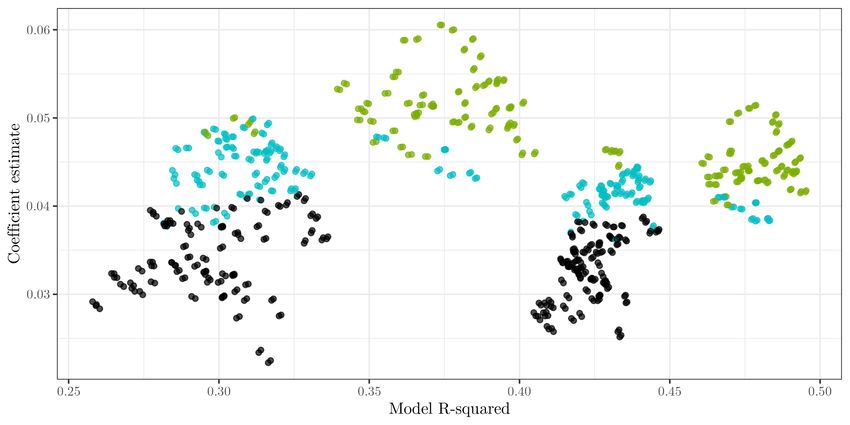
posed by the virus through February and early March, blaming Democrats for using it as a political
weapon to undermine the administration.7 In the narratives they presented about the dangers of
COVID-19, Carlson and Hannity were largely outliers (in opposite directions), not only on Fox
News, but on broadcast and cable television as a whole — a striking divergence given the two
programs’ similarities prior to January 2020. Focusing on these two opinion programs within the
same network enables us to compare two ex ante similar viewer populations, allowing us to examine
how exposure to diverging narratives broadcast on opinion programs drives beliefs, behavior, and
downstream health outcomes.
    To shed light on the timing of common behavioral adjustments at the early stages of the
pandemic (such as washing hands more often, cancelling travel plans, and avoiding large events), we
fielded a survey among 1,045 Fox News viewers aged 55 or older. Consistent with a persuasive effect
of content on behavior, we find that viewership of Hannity is associated with changing behavior four
days later than other Fox News viewers, while viewership of Tucker Carlson Tonight is associated
with changing behavior three days earlier (controlling for demographics and viewership of other
programs and networks). Given the critical importance of early preventive measures (Bootsma and
Ferguson, 2007; Markel et al., 2007), these differences in the timing of adoption of cautious behavior
may have significant consequences for health outcomes.8
    Motivated by our survey evidence, we examine disease trajectories in the broader population
using county-level data on COVID-19 cases and deaths. We first show that, controlling for a rich
set of county-level demographics (including the local market share of Fox News), greater local
viewership of Hannity relative to Tucker Carlson Tonight is associated with a greater number of
COVID-19 cases starting in early March and a greater number of deaths resulting from COVID-
19 starting in mid-March. We then employ an instrumental variable approach that shifts relative
viewership of the two programs, yet is plausibly orthogonal to local preferences for the two programs
and to any other county-level characteristics that might affect the virus’ spread. In particular, we
predict this difference in viewership using the product of (i) the fraction of TVs on during the start
time of Hannity (leaving out TVs watching Hannity) and (ii) the local market share of Fox News
(leaving out Hannity and Tucker Carlson Tonight). The logic of our instrument is simple: if people
like to turn on their TVs to watch something when Hannity happens to be on instead of Tucker
Carlson Tonight, the likelihood that viewers are shifted to watch Hannity is disproportionately large
in areas where Fox News is popular in general. We show that the interaction term is conditionally
They’d Let You Die’ Over Identity Politics.” Newsweek, February 24, 2020. Yan et al. (2020).
    7
      See “Hannity Claims He’s ‘Never Called the Virus a Hoax’ 9 Days After Decrying Democrats ‘New Hoax’.” Vox,
March 20, 2020.
    8
      For example, Pei et al. (2020) estimate that approximately half of all COVID-19 deaths in the United States
at the early stages of the pandemic could have been prevented had non-pharmaceutical interventions (NPIs) such
as mandated social distancing and stay-at-home orders been implemented one week earlier. While the behavioral
changes our survey respondents report are likely not as extreme, and our survey is representative only of Fox News
viewers over the age of 55, this evidence nonetheless suggests that these differences in timing may have directly
affected the spread of the pandemic.

                                                        3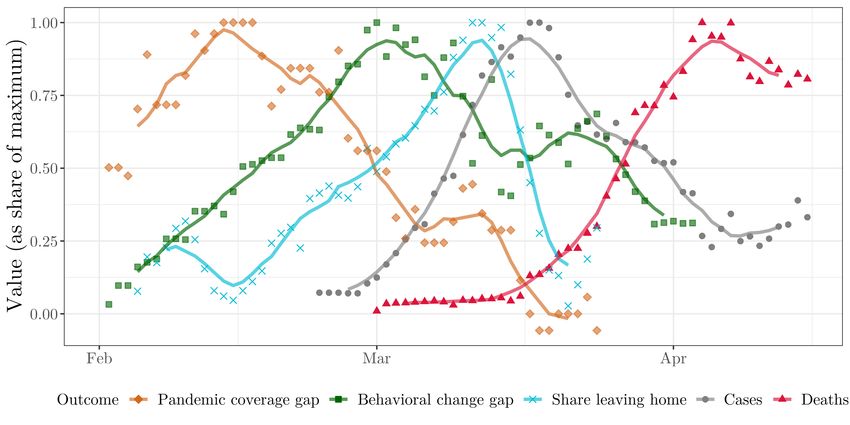
uncorrelated with any among a larger number of variables that might independently affect the local
spread of the coronavirus, and we show that it strongly predicts viewership in the hypothesized
direction. Using this instrument, we confirm the OLS findings that greater exposure to Hannity
relative to Tucker Carlson Tonight is associated with a greater number of COVID-19 cases and
deaths. Consistent with the gradual convergence in scripts between the two shows beginning in late
February, the effects on cases plateau and begin to decline in mid-March, while effects on deaths
follow two weeks later.
       Turning to the underlying mechanisms, we find that differential viewership affects stay-at-home
behavior (as measured by cell phone GPS data from two different sources), although this is unlikely
to be the primary mechanism driving our effects. The sequential timing of differences in coverage,
followed by differences in behavioral change, followed by differences in COVID-19 outcomes is
inconsistent with several alternative potential drivers of our estimated treatment effects, such as
time-invariant unobservables correlated with our instrument and differential effects of exposure to
the programs that are unrelated to their reporting about COVID-19. Instead, the timing strongly
suggests a causal chain from content differences to behavioral differences to COVID-19 outcomes.
Taken together, our results suggest that viewers indeed trust opinion programs as sources of facts,
beyond these programs’ entertainment value.9 Indeed, our findings indicate that this trust shapes
important beliefs and behaviors.
       Our work contributes to a large literature on the economic and social effects of the media
(DellaVigna and La Ferrara, 2016). This literature has examined a wide range of political, be-
havioral, and health outcomes (Durante and Zhuravskaya, 2018; Eisensee and Strömberg, 2007;
La Ferrara, 2016; Bursztyn et al., 2019; Muller and Schwarz, 2018; Martinez-Bravo and Stegmann,
2021; Yanagizawa-Drott, 2014; Levy, 2021), including the effect of Fox News on voting behavior
(DellaVigna and Kaplan, 2007; Martin and Yurukoglu, 2017). Insofar as opinion shows are more
entertaining than straight news shows (Berry and Sobieraj, 2013), our paper also relates to work
on the effects of entertainment media on social and political outcomes (La Ferrara et al., 2012; Du-
rante et al., 2019), particularly work examining the effects of specific television shows (Kearney and
Levine, 2015; Banerjee et al., 2019). Methodologically, our work relates to a literature analyzing
media content (Gentzkow and Shapiro, 2010; Djourelova, 2020).10
       We provide the first direct evidence on the importance of opinion shows in driving high-stakes
behaviors. Our approach holds fixed important mechanisms that may operate through exposure to
biased media, such as increased partisanship or lower trust in science, which allows us to identify
   9
     Consistent with this interpretation, as we discuss in Section 2, viewers in our experiment believe that opinion
programs are more informative than straight news programs.
  10
     Related to our study is work (Simonov et al., 2020; Ash et al., 2020; Ananyev et al., 2020) using the channel
numbers instrument developed by Martin and Yurukoglu (2017) to establish a causal effect of exposure to Fox News
as a whole on mobility outcomes. We complement their findings through our analysis of COVID-19 cases and deaths.
More importantly, our work differs in its focus on a specific mechanism: the role of diverging narratives on opinion
shows in driving differences in behavior and health outcomes.

                                                         4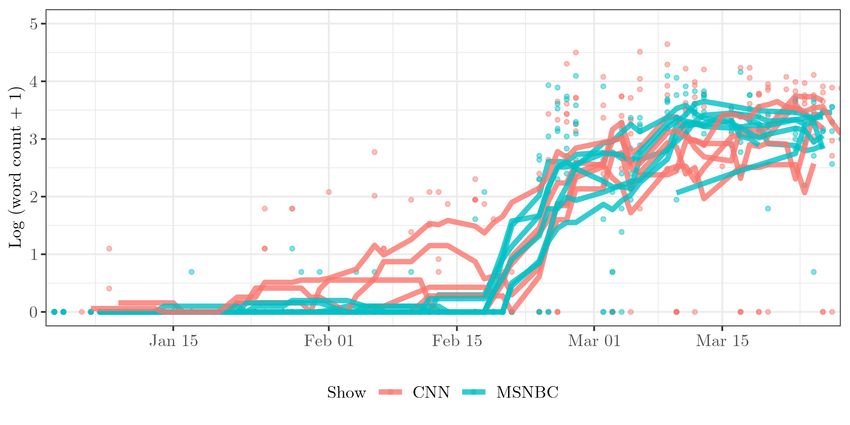
the effect of contemporaneous exposure to diverging narratives on behavior. Our incentivized
experiments demonstrate that people seek out opinion programs when given incentives to get the
facts right.
    The remainder of this paper proceeds as follows. In Section 2, we show that viewers across the
ideological spectrum turn to opinion programs over straight news even in the presence of incentives
to learn objective facts. In Section 3, we examine the role of diverging narratives on opinion
programs in shaping beliefs and behavior during the early stages of the COVID-19 pandemic.
Section 4 discusses implications and concludes.

2    Trust in Opinion Shows
In this section, we examine trust in opinion and “straight news” programs. Viewers might seek out
opinion programs for several reasons: opinion programs tend to be more emotional and engaging
than straight news (Kavanagh et al., 2019), and they can distill complex issues into easy-to-grasp
summaries, expose viewers to partisan perspectives, and provide a frame through which to interpret
the news of the day. Both a cause and consequence of their popularity is that they dominate “prime
time,” the window between 8pm and 11pm when TV viewership as a whole is highest. But to the
extent that viewers seek objective facts about the world, we would expect this tendency to depress
opinion program viewership: by their very nature, these programs are centered around conveying
anchors’ commentary on and interpretation of the news of the day rather than “just the facts”.
Indeed, Kavanagh and Rich (2018) summarize the growing dominance of opinions over factual
reporting during prime-time between 2000 and 2017 as follows:

      We found a starker contrast between broadcast news presentation and prime-time cable
      programming in the post-2000 period. Compared with news presentation on broadcast
      television, programming on cable outlets exhibited a dramatic and quantifiable shift
      toward subjective, abstract, directive, and argumentative language and content based
      more on the expression of opinion than on reporting of events.

Do consumers understand that prime-time opinion programs are less likely to cover facts compared
to straight news programs? We conduct a preregistered motivating experiment examining via
revealed preference (1) the extent to which viewers turn to opinion programs rather than straight
news in order to learn objective facts, and (2) how this preference is affected by substantial incentives
for accuracy.11

Sample and Design In December 2020, we targeted a sample of 1,000 US-based respondents
— 500 Republican Fox News viewers and 500 Democrat MSNBC viewers — in cooperation with
  11
     The preregistration is available on the AEA RCT registry under ID AEARCTR-0006958, available at https:
//www.socialscienceregistry.org/trials/6958.

                                                    5
Luc.id, a survey provider widely used in social science research (Bursztyn et al., 2020).12 We
inform respondents that at the end of the survey, they will provide a guess about a historical
statistic relating to a particular domain. The domain varies by treatment group: respondents
are told that they will guess either about (i) a general fact relating to the US economy, (ii) the
unemployment rate in the US, (iii) annualized GDP growth in the US, (iv) median weekly earnings
in the US, or (v) the number of COVID-19 cases, all as of a specific, randomly-selected date from
recent years. We further inform respondents that if their guess lies within 5 percent of the official
value, they will win an Amazon gift card. Respondents are told that the date about which they are
guessing will be revealed only a few seconds before they need to make their guess, ensuring that
they do not expect they will be able to find the answer by web search. We cross-randomize the
value of the gift card: half of the respondents are offered a $10 gift card and half a $100 gift card.
Respondents are further told that in order to inform their choice, they can choose one of four TV
clips, which were all excerpted from shows broadcast on the same week as the randomly-selected
date pertinent to their guess.
Fox News viewers are offered segments from the two most popular straight news programs on
the network — The Story with Martha MacCallum and Special Report with Bret Baier — and from
the two most popular opinion programs on the network — Hannity and Tucker Carlson Tonight.
MSNBC viewers are similarly offered segments from the two most popular straight news programs
and the two most popular opinion programs on the network: MSNBC Live and The Beat with Ari
Melber, and The Rachel Maddow Show and The Last Word with Lawrence O’Donnell, respectively.
Our key outcome of interest is whether the viewer chooses an opinion show or a news show.
Two aspects of the design merit further discussion. First, we deliberately ask respondents to
make guesses about historical statistics rather than to make predictions about future statistics.
Since opinion programs focus relatively more than straight news on prediction about the future
and relatively less on reporting about the current state of the world (Jacobs and Townsley, 2011),
this design choice pushes us towards identifying a lower bound on trust in opinion shows. Moreover,
this design choice allows us to deliver gift cards to respondents immediately if they guess correctly,
avoiding the possibility that respondents believe researchers will fail to deliver a gift card in the
future. Second, we deliberately choose objective economic statistics that are often covered in the
news media (or, in the case of the COVID-19 statistic, were extensively covered during the period
of interest). In contrast, there are far fewer political, cultural, or social statistics that are frequently
covered. Moreover, economic statistics about the past are a domain in which we would expect to
see the lowest selection of opinion shows, given that these shows generally favor political or cultural
issues over economic issues (Berry and Sobieraj, 2013).
12
The survey instrument is reproduced in Appendix E.
6Results Figure 1 presents the fraction of respondents in each treatment choosing an opinion show,
separately for Fox News and MSNBC viewers. The levels are relatively similar across all domains
and reveal a substantial preference for opinion programs: roughly 75% of Fox News viewers and
60% of MSNBC viewers choose one of the two opinion shows. For none of the five outcomes in
either of the two populations does the $100 incentive significantly reduce the fraction choosing an
opinion show. Indeed, for the COVID-19 condition — the condition most directly relevant to the
empirical application of our paper — the higher incentive increases the fraction choosing an opinion
show, though the effect is not statistically significant. Table 1 replicates this analysis in regression
table form and confirms that controlling for a range of individual demographics, including age, a
set of race indicators, a Hispanic indicator, a male indicator, a set of education indicators, a set of
household income indicators, and a set of employment indicators does not significantly affect the
estimates.13
Our results indicate that respondents do not internalize the differences in informativeness be-
tween news and opinion shows when making their choice of program. Thus, whatever other factors
may influence their choice (for example, preferences for popular programs, entertainment value, or
habit formation), the vast majority of respondents end up choosing opinion programs over straight
news programs even in the presence of substantial incentives to learn objective facts — despite the
fact that both Fox News and MSNBC have argued in court that viewers should not interpret their
opinion programs as factual.
One alternative, if related, interpretation is that respondents believe that neither straight news
nor opinion programs are at all informative for their guess, and that they consequently choose
opinion programs simply because they are more entertaining. We view this contingency as unlikely
given that the patterns are highly robust across the five domains, and thus respondents would have
to believe that none of the programs convey useful information across any of the dimensions we
study. Nonetheless, as an additional benchmark, we directly elicit respondents’ beliefs about the
likelihood that each program contained the information necessary for the guess. We find that 70%
of Fox News viewers and 57% of MSNBC viewers believed that an opinion program was weakly
more informative than either of the straight news shows, confirming the hypothesis that viewers
indeed see opinion programs as more informative for objective facts.
3 Opinion Programs and High-Stakes Behavior in the Field
What are the consequences of this trust in opinion programming? In this section, we examine how
opinion programs shaped beliefs and behavior during the early stages of the COVID-19 pandemic
13
Through manual coding of episode scripts during the week relevant to the experiment, we find that straight
news programs are indeed substantially more likely to cover the statistics of interest than opinion programs. In turn,
viewers who choose a straight news program also make more accurate guesses than viewers who choose an opinion
program, though this may reflect selection into the shows.
7in the United States. This setting is ideally suited to exploring the role of opinion programs for two
reasons: first, because the stakes involved in acquiring accurate information were relatively high;
and second, because there was substantial disagreement about the threat posed by COVID-19
across different opinion programs.
3.1 Diverging Narratives about COVID-19
Media coverage of COVID-19 on Fox News We focus on media coverage of COVID-19 on
Fox News during the early stages of the coronavirus pandemic. Fox News is the most watched cable
network in the United States, with an average of 3.4 million total primetime viewers in the first
quarter of 2020, compared to 1.9 million for MSNBC and 1.4 million for CNN (the other two of the
“Big Three” US cable news networks).14 Moreover, the median age of primetime Fox News viewers
is 68, substantially higher than that of CNN and MSNBC viewers.15 Both due to its reach and the
fact that more than half of its audience is over the age of 65 — a group that the CDC warns is at
elevated risk from COVID-19 — Fox News may exert substantial influence on COVID-19 outcomes.
This is particularly true given that the elderly both watch more TV in general than the average
US citizen and because they disproportionately rely on television for news and information (Pew,
2019).
Narratives adopted by Carlson vs. Hannity Our paper focuses on the two most widely-
viewed cable news programs in the United States, both of which are opinion programs: Hannity
and Tucker Carlson Tonight. These shows had an average of 4.2 million and 4 million daily viewers,
respectively, during the first quarter of 2020.16 Before COVID-19 began to spread in the United
States in January 2020, Hannity and Tucker Carlson Tonight were relatively similar in content and
viewership: both covered the news from a conservative perspective and were broadly supportive
of President Trump’s policy agenda. Yet as we document using qualitative evidence, text-analysis
methods, and human coding of the shows’ scripts, the two shows adopted very different narratives
about COVID-19.
News outlets and politicians across the ideological spectrum, and even experts such as National
Institute of Allergy and Infectious Diseases director Anthony Fauci, suggested throughout much
of February that COVID-19 would likely be safely contained.17 Many observers have identified
Sean Hannity of Fox News as advancing a particularly dismissive narrative toward the virus.18
Tucker Carlson, on the other hand, stood out not only among his colleagues at Fox News, but more
14
“Fox News Channel Ratings for First Quarter of 2020 Are the Highest in Network History.” Fox News, March
31, 2020.
15
“Half of Fox News’ Viewers Are 68 and Older.” The Atlantic, January 27, 2014.
16
Authors’ calculations based upon Nielsen data.
17
See “What Went Wrong with the Media’s Coronavirus Coverage?” Vox, April 13, 2020.
18
See, for example, “Fox News Has Succeeded – in Misinforming Millions of Americans.” The Washington Post,
April 1, 2020; “Fox’s Fake News Contagion.” The New York Times, March 31, 2020.
8broadly among both broadcast and cable news anchors, for his insistence as early as late January
that COVID-19 posed a serious threat to the United States.19 For example, on January 28 — more
than a month before the first COVID-19-related death in the US — Tucker Carlson spent a large
portion of his show discussing the subject, and continued to do so throughout February.
In contrast, Hannity covered the coronavirus and its consequences substantially less than Carl-
son and other Fox shows, particularly during February, when the virus was first beginning to spread
in the United States. Even after he began discussing it more prominently in February, he down-
played the threat the virus posed and emphasized that Democrats were politicizing the virus. By
mid-March, after President Trump declared a national emergency in response to the coronavirus,
Hannity’s coverage had converged to that of Carlson and other Fox News shows, emphasizing the
seriousness of the situation and broadcasting CDC guidelines.
Extensive margin of COVID-19 coverage To more systematically evaluate differences in
the extensive margin of coverage between primetime Fox News shows, we turn to a simple word-
counting procedure. For each of the seven shows on Fox News airing between 5pm and 11pm local
time across the four major time zones, we download episode transcripts from LexisNexis. We count
the number of times any of a small list of coronavirus-related terms are mentioned on each day and
plot the results in Panel A of Figure 2.20 In particular, the y-axis of the panel displays the log of
one plus the word count on each day.
Compared to the other three primetime shows, both Hannity and Tucker Carlson Tonight
stand out. Both anchors first discussed the coronavirus in late January when the first US case was
reported, but Carlson continued to discuss the subject extensively throughout February whereas
Hannity did not again mention it on his show until the end of the month. The other three shows
fell somewhere between these two extremes. By early March, the word counts of all shows had
converged.21
However, this simple procedure does not entirely capture differences in how shows discussed the
coronavirus. The qualitative evidence above suggests that while Hannity discussed the coronavirus
as frequently as Carlson during early March, he downplayed its seriousness and accused Democrats
of using it as a partisan tool to undermine the administration. To capture these differences in the
intensive margin of coverage, we turn to human coding of the scripts.
Human coding of scripts Between April 2 and April 6, we recruited workers on Amazon
Mechanical Turk to assess how seriously each of the seven shows portrayed the threat of the
19
See, for example, “His Colleagues at Fox News Called Coronavirus a ‘Hoax’ and ‘Scam.’ Why Tucker Carlson
Saw It Differently.” The LA Times, March 23.
20
The words are “coronavirus”, “virus,” “covid,” “influenza”, and “flu.”
21
We also conduct a similar content analysis of all major primetime shows on CNN and MSNBC and find little
variation across shows in terms of the coverage of the coronavirus (see Appendix Figure A1).
9coronavirus between early February and mid-March. For each episode that contained at least one
coronavirus-related term, five MTurk workers read the entire episode script and answered “Yes”
or “No” to the following question: “Did [the show] indicate that the virus is likely to infect many
people in the US, causing many deaths or serious illnesses, or that many have already become
infected and have died or become seriously ill?” We explicitly asked respondents to answer the
question based only on the scripts, not their own views on the subject. We impute “No” for each
script that does not mention any coronavirus-related terms, and we code “Yes” as 1 and “No” as
0.22
Panel B of Figure 2 displays one-week rolling means of this variable for Carlson, Hannity, and the
other four shows. Throughout almost the entire period, MTurk workers rate Carlson as portraying
the threat of the coronavirus more seriously than the other three shows, and in turn rate the other
shows as portraying the threat more seriously than Hannity. In line with the qualitative evidence
highlighted above, Hannity converges to Carlson in early to mid-March.
Together, our evidence suggests that the two largest opinion shows in the United States adopted
strikingly different narratives about the threat posed by the coronavirus. We next present survey
evidence that these differences may have affected viewers’ behavior during the period of initial
spread of the coronavirus in the United States.
3.2 Timing of Behavioral Adjustment
Radical behavioral changes, such as stay-at-home behavior, did not become widespread until mid-
to-late March, when the pandemic narrative gap between Hannity and Tucker Carlson Tonight had
already closed.23 To capture more subtle behavioral changes that may have occurred in February
and March, and to shed light on which types of behavioral change were most common, we fielded
a survey on April 3, 2020. Our survey targeted a representative sample of approximately 1500
Republicans aged 55 or older both because this population is more likely to watch Fox News and
because the elderly are at increased risk from COVID-19.24 As we show in Appendix Table A1,
our sample is broadly representative of Republicans aged 55 and older. All survey materials are
available in Appendix E.
Survey design After eliciting demographics, we ask respondents which, if any, of the “Big Three”
TV news stations (CNN, MSNBC, and Fox News) they watch at least once a week. 1045 individuals
reported that they watch any show on Fox News at least once a week; this is the sample we use in
22
We calculate Fleiss’ Kappa of inter-rater agreement, a commonly used measure to assess the reliability of agree-
ment among more than two sets of binary or non-ordinal ratings, as κ = 0.629 (p < 0.001), suggesting “substantial
agreement” (Landis and Koch, 1977).
23
See, e.g. “Social Distancing, but Mostly During the Workweek?” Federal Reserve Bank of St. Louis, May 26,
2020.
24
The median age among Fox News viewers is 68. See, e.g. “Half of Fox News’ Viewers Are 68 and Older.” The
Atlantic, January 27, 2014.
10our analysis, given our focus on Fox News viewers. We ask respondents to indicate the frequency
with which they watch the major prime-time shows on each network on a three-point scale (“never”;
“occasionally”; “every day or most days”).
We then ask our respondents about any changes in their behavior in response to the coronavirus
outbreak. First, we ask whether they have changed any of their behaviors (e.g., cancelling travel
plans, practicing social distancing, or washing hands more often) in response to the coronavirus.
For those respondents who answer that they have changed behavior, we elicit the date on which
they did so. Finally, we ask an open-ended question asking respondents to describe which behaviors
they changed.
Sample characteristics In Appendix Table A2, we plot demographic characteristics of exclusive
Tucker Carlson Tonight and Hannity viewers. Hannity viewers are somewhat more likely to be
white, somewhat more likely to be male, somewhat more likely to be working full-time, and more
likely to watch CNN and MSNBC. However, taken together, the observable differences between the
two groups appear to be modest.
Results To examine the correlation between viewership of different news shows and the timing
of behavioral change, we estimate the following simple specification:
TimingChangei = α0 + βSi + ΠXi + εi ,
where TimingChangei is the number of days after February 1, 2020 on which the respondent
reported having significantly changed any of their behaviors in response to the coronavirus, Si is
a vector of indicators for whether the respondent occasionally or regularly watches each of the
seven shows, and Xi is a vector of demographic controls.25 The dependent variable for respondents
who report that they have not changed any of their behaviors at the time of the survey is recoded
to the date on which the survey was administered (April 3). We employ robust standard errors
throughout our analysis.
Panel A of Figure 3 plots the smoothed density function of the reported date of behavioral
change separately for viewers of Carlson, Hannity, and other Fox News shows. (The majority of
viewers watch more than one show and thus appear in multiple panels.) We also display these
results in regression table form in Table 2. Column 1 shows that viewers of Hannity changed their
behavior four to five days later than viewers of other shows (p < 0.001), while viewers of Tucker
Carlson Tonight changed their behavior three to four days earlier than viewers of other shows
(p < 0.01); the difference in coefficients is also highly statistically significant (p < 0.01).26 Column
25
The elements of Si are neither mutually exclusive nor jointly exhaustive; viewers who watch multiple shows will
have multiple indicators set to one, while viewers that watch none of the five shows will have none of the indicators
set to one.
26
Ash et al. (2020) also find survey evidence that Republican Hannity viewers adopt social distancing measures
112 reports a linear probability model in which the dependent variable is an indicator for whether the
respondent reported changing behavior before March 1; Carlson viewers were 11.7 percentage points
more likely and Hannity viewers 11.2 percentage points less likely to have changed their behavior
before March 1 than viewers of other Fox shows.27 We estimate identical linear probability models
for each day between February 1 and April 3 (the date on which we administered the survey) and
report the coefficients on both Hannity viewership and Tucker Carlson Tonight viewership for each
day in Panel B of Figure 3. By this measure, the difference between the two anchors peaks around
March 1, then declines.
We also examine the timing of specific margins of behavioral adjustment by manually coding the
open-ended responses to the question of which behaviors respondents changed. Appendix Figure A2
highlights that increased hand washing and physical distancing, including avoiding large events,
are the most frequently mentioned behavioral changes, particularly in February, the period during
which the differences in show content were largest. Cancelling travel plans and staying at home are
also frequently mentioned, though primarily in mid and late March.28
Our survey suggests that show content may have affected individual behaviors relevant for the
spread of COVID-19. However, the correlations might be driven by omitted variable bias or reverse
causality: viewers who did not want to believe that the COVID-19 was a serious problem or viewers
less inclined to changing their behavior may have selected into watching Hannity. Moreover, our
outcome is self-reported, which may bias our estimates if respondents systematically misremember
that they changed their behavior earlier or later than they actually did (and this tendency differs
between Hannity and Tucker Carlson Tonight viewers). To address these issues, we turn to data
on county-level COVID-19 cases and deaths, and later to an instrumental variable strategy shifting
relative viewership of the two shows.
significantly later than Republicans who do not watch Hannity, while Republican Tucker Carlson Tonight viewers
adopt social distancing measures significantly earlier than Republicans who do not watch Tucker Carlson Tonight.
27
To benchmark the plausibility of the estimated effects, we calculate the persuasion rate of viewership on the
outcome of changing behavior by March 1, following the approach proposed by DellaVigna and Gentzkow (2010).
The implied persuasion rate of Hannity viewership relative to Tucker Carlson Tonight viewership is 24.1 percent, well
within the range of comparable estimates; for example, Martin and Yurukoglu (2017) find a Fox News persuasion
rate on voting behavior of 58 percent in 2000, 27 percent in 2004, and 28 percent in 2008; Adena et al. (2015) finds
a persuasion rate of up to 36.8 percent; and Enikolopov et al. (2011) finds persuasion rates rating from 7 to 66
percent. On one hand, we might expect a lower persuasion rate in our context because exposure is over a much
shorter period; on the other hand, we might expect a higher persuasion rate (1) because the outcomes we study
are arguably lower-stakes than the outcomes in other settings, (2) because viewers likely hold weak priors about the
seriousness of the pandemic during the period under consideration, and (3) because regular viewers of a show likely
place significant weight on the anchors’ opinions.
28
The responses highlight the importance of distinguishing between two types of social distancing. Following the
Federal Reserve, we distinguish stay-at-home behavior — remaining at home for all or a substantial part of the day
— from physical distancing — continuing with day-to-day activities, but keeping a distance (e.g. of six feet) from
others and avoiding large, potentially “superspreader” events such as sports games or concerts. While stay-at-home
behavior becomes widespread only in mid-to-late March (see, e.g. Allcott et al. 2020b), our survey responses suggest
that physical distancing and avoiding large events was widespread even in February among the population we survey.
123.3 OLS Estimates on Health Outcomes
In this section, we discuss the empirical challenge in identifying causal effects. We then present
OLS evidence on the effects of differential viewership of Hannity and Tucker Carlson Tonight on
COVID-19 cases and deaths.
Data We employ several primary categories of data in our observational analysis, which we de-
scribe in detail in Appendix B. Our TV viewership data is provided by Nielsen at the Designated
Market Area (DMA) level, of which there are 210 in the US. We focus on the continental United
States, excluding the two DMAs in Alaska (Anchorage and Fairbanks) and the single DMA in
Hawaii (Honolulu). Our dataset contains viewership data between 5pm and 11pm (local time) at
the DMA-by-timeslot-by-day level (i.e. hourly ratings). In addition to the fraction of TVs watch-
ing Fox News, we observe the fraction of TVs turned on during each timeslot. We supplement
this dataset with 2018 data, previously acquired, on the local market share of each of the “Big
Three” networks: CNN, MSNBC, and Fox News.29 Our key outcome variables on county-level
confirmed COVID-19 cases and deaths are drawn from Johns Hopkins University (Dong et al.,
2020). Throughout our main analyses, we take the logarithm of one plus the cumulative number of
cases and deaths, both to prevent outliers with a large number of cases from skewing the estimates
and because the exponential nature by which a virus spreads makes the logarithm normalization
natural. Finally, we compile a rich set of data on county level characteristics, including local vote
shares, educational attainment, incomes, and the demographic age structure.
Empirical challenge Obviously, show viewership is not randomly assigned: people self-select
into television shows that they like to watch. For example, it is well known that Fox News viewers
are over-represented among older individuals and that age is a determinant of COVID-19 mortality.
Our object of interest, though, is not to understand the effect of watching Fox News per se, but
to understand the role of differential information spread by the different shows. Since selection
into viewership of Hannity and Tucker Carlson Tonight is less well known, we begin by examining
county-level correlates of their relative popularity. As Appendix Figure A3 displays, counties with
a relative preference for Hannity differ from counties with a relative preference for Tucker Carlson
Tonight on a number of observable dimensions, including racial composition and education. In
contrast, the relative popularity of the two shows is not strongly associated with the share of
people over the age of sixty five.30
29
Our primary analysis uses January and February viewership data; however, given the high degree of persistence
in show viewership, our results are quantitatively extremely similar and qualitatively identical if we instead use only
January data (to rule out concerns about reverse causality in our OLS estimates) or if we use data from January
1 through March 8 (the beginning of Daylight Savings Time, a natural stopping point given the structure of our
identification strategy).
30
Differences are reduced, though not eliminated entirely, when we include state fixed effects (our preferred empirical
specification, as described below).
13Together, these patterns suggest that a simple OLS estimate may be biased. The direction
of this bias, however, is unclear. For example, COVID-19 has severely affected African-American
communities, for many reasons beyond Hannity’s relative popularity, which would positively bias
our coefficient. On the other hand, Hannity is also more popular in areas with greater local health
capacity, suggesting a negative bias.
OLS specification Our explanatory variable of interest is the DMA-level average difference
between viewership of Hannity and viewership of Tucker Carlson Tonight across all days in January
and February 2020 when both shows are aired. We scale this variable to take mean zero and
standard deviation one for ease of interpretation. In our primary analysis, we estimate the following
specification separately for each day between February 24 and April 15 (for cases) and between
March 1 and April 15 (for deaths):
Ymct = αt + βt Dmc + Πt Xmc + εmct (1)
where Ymct is an outcome (log one plus cases or log one plus deaths) in media market m, county
c on day t, Dmc is the standardized difference between viewership shares of Hannity and Tucker
Carlson Tonight, and Xmc is a vector of county-level controls.
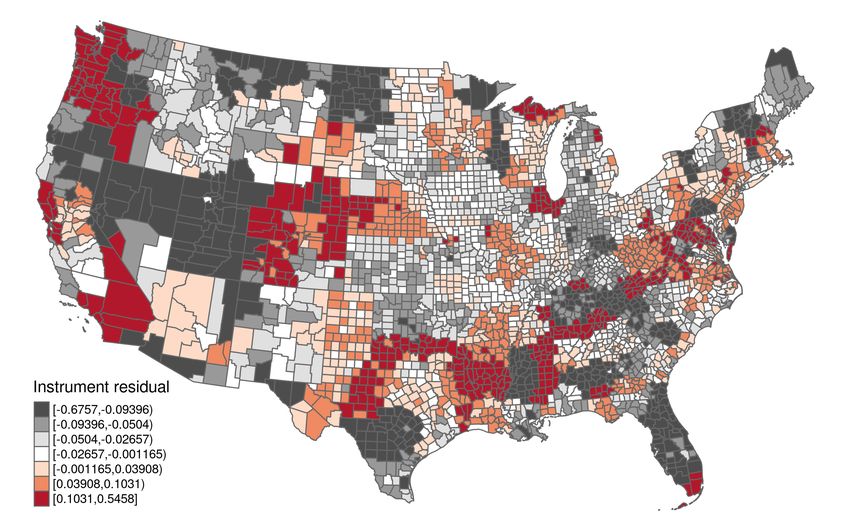
Identifying variation and potential confounders To see the potential threats to identifying
causal effects, it is useful to understand where the variation in the main exposure variable, Dmc ,
comes from. By definition, it is the difference between the share of households that regularly watch
Hannity (vmc,H ) and the share that regularly watch Tucker Carlson Tonight (vmc,T ). More broadly,
for any show that airs at a certain hour-long time slot h in the evening, we can define the share of
households that watch any channel on TV as smc,h and, among those, the share at that moment
that tunes in to Fox News as fmc,h .
Thus, Dmc is driven by four factors:
Dmc = (smc,H × fmc,H ) − (smc,T × fmc,T )
This means that the OLS specification effectively exploits variation arising from differences in timing
preferences and channel preferences:
Ymct = αt + βt (smc,H × fmc,H − smc,T × fmc,T ) + Πt Xmc + εmct (2)
Since we are interested in examining the effects of differential exposure to two major shows on Fox
News, Equation (2) makes it clear that if areas where Fox News is relatively popular experience
more COVID-19 cases for any other (unobservable) reason — for example if populations in these
14areas live further away from high quality hospitals, tend to trust science less, or have certain life
styles which make them more or less vulnerable to the virus — our estimate will be biased. To
deal with this issue, we always control for the average evening TV market share of Fox News:
f mc,h , where h denotes 8pm to 11pm Eastern Time. Moreover, since there may be selection into
competing cable news networks specifically, rather than TV watching per se, we analogously always
control for the “Big Three” cable TV market shares of Fox News and MSNBC (with CNN omitted
since it is collinear with the other two). The inclusion of these controls hold fixed many potential
confounders related to channel preferences.
Equation (2) also makes clear that if localities which have a tendency to watch evening TV per
se around the time of Hannity, rather than Tucker Carlson Tonight, consist of populations which
differ in their vulnerability to the virus, the OLS estimate could easily be biased. (Again, ex ante
it is unclear which way the bias would go, given that we are comparing differential exposure to
two shows on the same network.) To address concerns about local preferences for watching TV at
certain times in the evening correlating with other determinants of COVID-19 trajectories — such
as the extent to which people like to socialize in restaurants and bars (in ways which spread the
virus) instead of staying home watching TV — we always include the average share of households
with TVs turned on during each hourly slot between 8pm and 11pm Eastern Time (three variables,
each capturing one hour): smc,8−9pm , smc,9−10pm , smc,10−11pm . These controls hold fixed many
potential confounders related to timing preferences.
Given this approach, the remaining (residual) variation in exposure effectively comes from
the difference in the two interaction terms of Equation (2), holding constant local preferences for
watching TV in general and watching Fox News in general. We also include additional observable
characteristics as controls. For example, since we study the early stages of the COVID-19 pandemic
and initial outbreaks occurred around metropolitan hotspots, one concern may be that viewership
patterns across the two shows correlate with such hot spot locations. For this reason, we show
results with and without controls for rurality and population density and transparently show how
much the estimate fluctuates as a result. More broadly, in addition to population controls, we
show results with and without county-level controls for a range of observable characteristics: race
(the share of the population white, Hispanic, and black); education (the share lacking high school
degrees and the share lacking college degrees, for women and men separately); age (the share
over the age of sixty-five); economic factors (the share under the federal poverty line, log median
household income, and the unemployment rate); health factors (the share lacking health insurance
and an age-adjusted measure of the average physical health in the county from 2018); health capacity
(the number of different types of health personnel per capita); and political factors (Republican
vote share and the log total number of votes cast in the 2016 Presidential election). To account
for additional unobservable determinants of health outcomes that differ across localities, we show
results using (1) no geographical fixed effects, (2) Census division (nine in total) fixed effects, and
15(3) state fixed effects. Since time zones are absorbed by the geographical indicator variables in the
latter two cases, the fixed effects imply that we hold constant what time the two shows air locally.
Our most extensive OLS specification – which is our preferred in that it helps rule out a host of
concerns beyond the ones explicitly outlined above – includes state fixed effects and a full set of
control variables.
To capture the effects in a transparent manner over time, we run separate cross-sectional regres-
sions each day; in specifications including state fixed effects, this implicitly controls for state-level
policies varying at the day level, such as shelter-in-place orders and closures of nonessential busi-
nesses. Because our viewership data is at the DMA level and to allow for within-market correlation
in the error term, we cluster standard errors at the DMA level (m), resulting in a total of 204
clusters.31
Results We report day-by-day results for cases and deaths in Figure 4, including all controls and
state fixed effects. The association between relative viewership and both cases and deaths becomes
stronger over time until the coefficient on cases peaks in late March and then begins to decline; the
coefficient on deaths follows with a two-week lag, consistent with the approximately two-to-three
week lag between the appearance of COVID-19 symptoms and deaths (Wu et al., 2020). Effects
on cases are statistically significant at the 5 percent level throughout the majority of the period,
while effects on deaths are only statistically significant at the 5 percent level in late March and
April. Effects on cases start to rise in late February and peak in mid-to-late March before starting
to decline, consistent with the convergence in coronavirus coverage between Hannity and Carlson.
A one standard deviation greater viewership difference is associated with 2 percent more deaths on
March 21, 4 percent more deaths on March 28, and 9 percent more deaths on April 11. We report
these results at weekly intervals in regression table form in Table 3.
Robustness To probe the robustness of our estimates, we choose a single day for cases — March
14, two weeks into March — and a single day for deaths — March 28, two weeks after our chosen
date for cases (given the lag between cases and deaths). We then run our specifications under every
possible combination of our eight sets of county-level controls (population density and rurality,
race, age, economic, education, health, health capacity, politics) and our three levels of fixed effects
(no fixed effects, census division fixed effects, and state fixed effects). Appendix Figure A5 reports
coefficient estimates for each of these 768 models for cases as of March 14 as well as deaths as of
March 28. The majority of coefficient estimates on cases and deaths are statistically significant at
the 1 percent level. Almost all coefficient estimates from specifications including state fixed effects,
our most demanding and most precisely estimated specifications, are significant at the 1 percent
31
Our results are also statistically significant if we instead cluster at the state level, as we show in Appendix
Figure A4.
16level. Moreover, our coefficient estimates are relatively stable.32 Appendix Figure A6 shows a
generally positive correlation between the R2 of each model and the coefficient estimate, suggestive
evidence that omitted variables downward bias our estimates. Indeed, a simple exercise to estimate
omitted variables bias, following best practice recommendations from Oster (2019), suggests that
the true effect may be several times larger.33
3.4 Instrumental Variables Estimates on Health Outcomes
We may remain concerned about factors driving both viewership preferences for Hannity over
Tucker Carlson Tonight and COVID-19 outcomes. In this section, we describe our approach to gen-
erate plausibly exogenous variation in relative viewership of Hannity over Tucker Carlson Tonight.
As Equation (2) makes clear, the underlying variation in Dmc is driven by the combination of
timing preferences and channel preferences. A lingering concern may be that these preferences are
correlated with other unobservable determinants of COVID-19 outcomes. In particular, while the
political slant of different shows on Fox News are similar and arguably cater the content towards
viewers with similar beliefs and political viewpoints, the shows are not identical. Therefore, it could
be that counties that favor Hannity over Tucker Carlson Tonight are somehow fundamentally dif-
ferent along dimensions that matter for health outcomes. Here, we alleviate some of these concerns
by employing a leave-out approach, isolating cleaner variation that is less subject to confounders.
Leave-out IV The logic of the instrument is as follows. The OLS specification already flexibly
controls for the tendency to watch TV at certain hours in the evening. If timing preferences are
homogeneous across Fox and non-Fox viewers, timing preferences that determine health outcomes
do not bias the OLS estimates. However, if timing preferences are heterogeneous across people
that regularly watch Fox compared to those that prefer other channels, estimates may be biased.
For example, if during the time Hannity airs, regular Fox viewers tend to prefer to stay home and
watch TV while non-Fox viewers like to socialize in restaurants and bars (facilitating the spread of
the virus), the OLS estimates would be (negatively) biased. To purge the treatment variable Dmc
from any such variation, we isolate variation in timing preferences among only non-Fox viewers:
s̃mc,H , the average share of households that watch TV when Hannity airs, leaving out households
that watch Fox News.
32
We repeat this exercise for every date between February 24 and April 15 for cases and between March 1
and April 15 for deaths. The resulting coefficient stability plots for each day are accessible at https://raw.
githubusercontent.com/AakaashRao/aakaashrao.github.io/master/files/ols-cases.gif (cases) and https://
raw.githubusercontent.com/AakaashRao/aakaashrao.github.io/master/files/ols-deaths.gif (deaths).
33
The method requires assuming a maximum amount of variation that a hypothetical regression including all
observable and unobservable covariates could explain; we follow the recommendation provided in Oster (2019) of
using 1.3 times the R2 value of the most extensive specification. The method also requires specifying the relative
importance of observables and unobservables in explaining variation in the outcome variable; we again follow the
guidance in Oster (2019) and assume observables and unobservables are equally important.
17You can also read