Global Estimates of Modern Slavery - FORCED LABOUR AND FORCED MARRIAGE - ILO
←
→
Page content transcription
If your browser does not render page correctly, please read the page content below
Global Estimates
of Modern Slavery

FORCED LABOUR AND FORCED MARRIAGE

In partnership with
Global estimates
of modern slavery:
forced labour
and forced marriage

GENEVA, 2017
Copyright © International Labour Organization and Walk Free Foundation, 2017

First published 2017

This is an open access work distributed under the Creative Commons Attribution 3.0 IGO License (http://
creativecommons.org/licenses/by/3.0/igo). Users can reuse, share, adapt and build upon the original work,
even for commercial purposes, as detailed in the License. The International Labour Office (ILO), Walk Free
Foundation and International Organization for Migration (IOM) must be clearly credited as the joint owners
of the original work. The use of the emblem of the ILO, Walk Free Foundation and IOM is not permitted in
connection with users’ work.

Translations – In case of a translation of this work, the following disclaimer must be added along with the
attribution: This translation was not created by the International Labour Office (ILO), Walk Free Foundation or
International Organization for Migration (IOM) and should not be considered an official ILO translation. The ILO,
Walk Free Foundation and IOM are not responsible for the content or accuracy of this translation.

Adaptations – In case of an adaptation of this work, the following disclaimer must be added along with the
attribution: This is an adaptation of an original work by the International Labour Office (ILO), Walk Free
Foundation and International Organization for Migration (IOM). Responsibility for the views and opinions
expressed in the adaptation rests solely with the author or authors of the adaptation and are not endorsed by
the ILO, Walk Free Foundation or IOM.

All queries on rights and licensing should be addressed to ILO Publications (Rights and Licensing), CH-1211
Geneva 22, Switzerland, or by email to rights@ilo.org.

Global estimates of modern slavery: Forced labour and forced marriage
International Labour Office (ILO), Geneva, 2017

ISBN: 978-92-2-130131-8 (print)
ISBN: 978-92-2-130132-5 (web pdf)

Also available in French: Estimations mondiales de l’esclavage moderne: travail forcé et mariage forcé,
ISBN 978-92-2-230932-0 (print); ISBN 978-92-2-230933-7 (web pdf), ILO, Geneva, 2017; and in Spanish:
Estimaciones mundiales sobre la esclavitud moderna: Trabajo forzoso y matrimonio forzoso, ISBN
978-92-2-331038-7 (print); ISBN 978-92-2-331039-4 (web pdf), ILO, Geneva, 2017.

The designations employed in this publication, which are in conformity with United Nations practice, and the
presentation of material therein do not imply the expression of any opinion whatsoever on the part of the
International Labour Office or the International Organization for Migration concerning the legal status of any
country, area or territory or of its authorities, or concerning the delimitation of its frontiers.

The responsibility for opinions expressed in signed articles, studies and other contributions rests solely with
their authors, and publication does not constitute an endorsement by the International Labour Office or the
International Organization for Migration of the opinions expressed in them.

Reference to names of firms and commercial products and processes does not imply their endorsement by
the International Labour Office or the International Organization for Migration, and any failure to mention a
particular firm, commercial product or process is not a sign of disapproval.

Information on ILO publications and digital products can be found at: www.ilo.org/publns.

Funding for ILO’s work on the 2016 Global Estimates of Modern Slavery leading to this reportwas provided
by the United States Department of Labor under Cooperative Agreement numbers GLO/10/55/USA and
GLO/11/11/USA. This report does not necessarily reflect the views or policies of the United States Department
of Labor, nor does mention of trade names, commercial products, or organizations imply endorsement by the
United States Government.

4                                                            Global estimates of modern slavery: forced labour and forced marriage
On any given day in 2016

                                                    METRICS
                                     40
                                    million         40 million people were victims of modern
                                                    slavery. This includes:

                                                    ▪▪ 25 million people in forced labour
                                                    ▪▪ 15 million people in forced marriage

PREVALENCE

There were 5.4 victims of modern slavery for
every thousand people in the world in 2016.

There were 5.9 adult victims of modern slavery
for every 1,000 adults in the world and 4.4 child
victims for every 1,000 children in the world.           5.4
                                                       per 1,000

                                                    GENDER

                                                    Women and girls accounted for 71 per cent of
                                     71%            modern slavery victims.

                                    50%                                                25%
DEBT BONDAGE                                        CHILDREN

Debt bondage affected half of all victims           One in four victims of modern slavery were
of forced labour imposed by private actors.         children.

IN THE PAST FIVE YEARS, 89 MILLION PEOPLE EXPERIENCED SOME FORM OF MODERN
SLAVERY FOR PERIODS OF TIME RANGING FROM A FEW DAYS TO THE WHOLE FIVE YEARS.

                                                                                               5
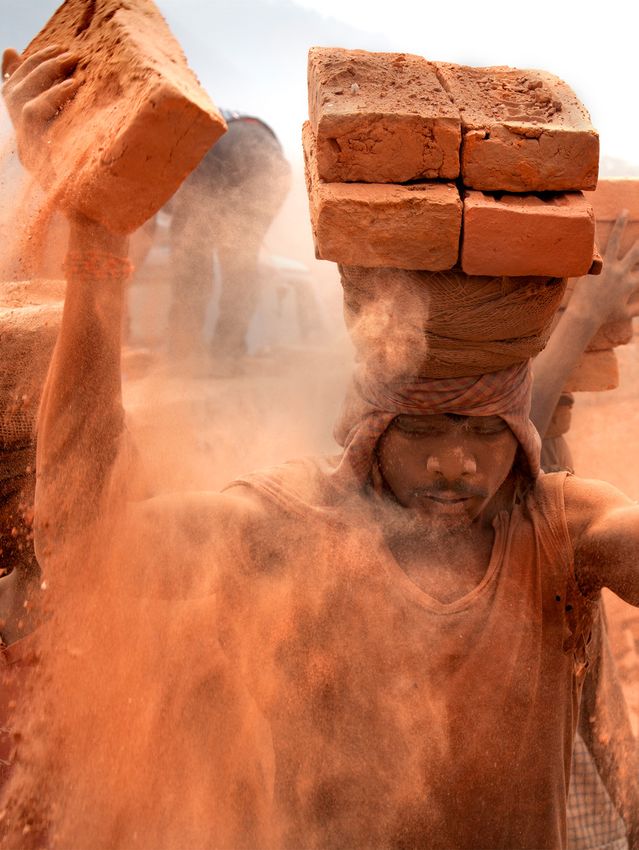
© Lisa Kristine
Table of contents
Executive summary                                                          9

Introduction                                                              15

Part 1. The scale and manifestations of modern slavery                    21
  1.1     Main results                                                    21
  1.2     Forced labour                                                   28
         1.2.1      Forced labour exploitation                            32
         1.2.2      Forced sexual exploitation of adults and commercial   39
                    sexual exploitation of children
         1.2.3      State-imposed forced labour                           41
  1.3 Forced marriage                                                     44

Part 2. Ending modern slavery: road forward to 2030                       49
  2.1     Building a policy response: prevention and protection           50
  2.2 Building the evidence base                                          53
  2.3 International cooperation and partnership                           54

Annex: Note on methodology                                                57

Endnotes                                                                  63

Table of contents                                                          7
© Lisa Kristine
Executive
                summary
                    The 2017 Global Estimates of Modern           it refers to situations of exploitation that
                    Slavery are presented as a contribution       a person cannot refuse or leave because
                    to the Sustainable Development Goals          of threats, violence, coercion, deception,
                    (SDGs), in particular to Target 8.7, which    and/or abuse of power.
                    calls for effective measures to end forced
                    labour, modern slavery, and human             The Global Estimates of Modern Slavery
                    trafficking, as well as child labour in all   focus on two main issues: forced labour
                    its forms. It is intended to inform policy    and forced marriage. The estimate of
                    making and implementation of target 8.7       forced labour comprises forced labour
                    and related SDG Targets. These include        in the private economy (forms of forced
                    eliminating all forms of violence against     labour imposed by private individuals,
                    all women and girls in public and private     groups, or companies in all sectors
                    spheres, including trafficking and sexual     except the commercial sex industry),
                    and other types of exploitation (SDG          forced sexual exploitation of adults
                    5.2), eliminating all harmful practices,      and commercial sexual exploitation
                    such as child, early, and forced marriage     of children, and state-imposed forced
                    and female genital mutilations (SDG           labour.
                    5.3), ending abuse, exploitation, and
                                                                  Due to limitations of the data, as detailed
                    trafficking of children (SDG 16.2), and
                                                                  in this report, these estimates are consid-
                    facilitating orderly, safe, and responsible
                                                                  ered to be conservative.
                    migration and mobility of people,
                    including      through      implementation
                    of      planned      and      well-managed
                    migration policies (SDG 10.7).
                                                                  The global figures
                    The estimates herein are the result
                    of a collaborative effort between the
                    International    Labour    Organization       An estimated 40.3 million people were
                    (ILO) and the Walk Free Foundation,           victims of modern slavery in 2016.
                    in partnership with the International         In other words, on any given day in
                    Organization for Migration (IOM). They        2016, there were likely to be more than
                    benefited from inputs provided by             40 million men, women, and children
                    other UN agencies, in particular the          who were being forced to work against
                    Office of the High Commissioner for           their will under threat or who were living
                    Human Rights (OHCHR). In the context          in a forced marriage that they had not
                    of this report, modern slavery covers a       agreed to.
                    set of specific legal concepts including
                                                                  Of these 40.3 million victims:
                    forced labour, debt bondage, forced
                    marriage, other slavery and slavery           ▪▪ 24.9 million people were in forced
                    like practices, and human trafficking.           labour. That is, they were being forced
                    Although modern slavery is not defined           to work under threat or coercion as
                    in law, it is used as an umbrella term           domestic workers, on construction
                    that focuses attention on commonalities          sites, in clandestine factories, on farms
                    across these legal concepts. Essentially,

Executive summary                                                                                           9
and fishing boats, in other sectors,
and in the sex industry. They were
The regional
forced to work by private individuals figures
and groups or by state authorities. In
many cases, the products they made
and the services they provided ended Modern slavery occurred in every re-
up in seemingly legitimate commercial gion of the world. Modern slavery was
channels. Forced labourers produced most prevalent in Africa (7.6 per 1,000
some of the food we eat and the people), followed by Asia and the Pacific
clothes we wear, and they have cleaned (6.1 per 1,000) then Europe and Central
the buildings in which many of us live Asia (3.9 per 1,000). These results should
or work. be interpreted cautiously due to lack of
available data in some regions, notably
▪▪ 15.4 million people were living in a the Arab States and the Americas.
forced marriage to which they had
not consented. That is, they were en- For forced labour specifically, the
during a situation that involved having prevalence is highest in Asia and the
lost their sexual autonomy and often Pacific, where four out of every 1,000
involved providing labour under the people were victims, followed by Europe
guise of “marriage”. and Central Asia (3.6 per 1,000), Africa
(2.8 per 1,000), the Arab States (2.2 per
Women and girls are disproportionately 1,000) and the Americas (1.3 per 1,000).
affected by modern slavery, account-
ing for 28.7 million, or 71 per cent of the While noting limits of the data in key
overall total. More precisely, women and regions, particularly the Arab States,
girls represent 99 per cent of victims of the data suggests prevalence of
forced labour in the commercial sex in- forced marriage is highest in Africa
dustry and 58 per cent in other sectors, (4.8 per 1,000), followed by Asia and the
40 per cent of victims of forced labour Pacific (2.0 per 1,000).
imposed by state authorities, and 84 per
cent of victims of forced marriages.
One in four victims of modern slavery
were children. Some 37 per cent Forced labour
(5.7 million) of those forced to marry
were children. Children represented
This study examined different forms of
18 per cent of those subjected to
forced labour, distinguishing between
forced labour exploitation and 7 per
forced labour imposed by private actors
cent of people forced to work by
(such as employers in private businesses)
state authorities. Children who were
and that which was imposed by states.
in commercial sexual exploitation
Of the 24.9 million victims of forced
(where the victim is a child, there is
labour, 16 million were in the private
no requirement of force) represented
economy, another 4.8 million were in
21 per cent of total victims in this
forced sexual exploitation, and 4.1 million
category of abuse.
were in forced labour imposed by state
In the past five years, 89 million people authorities.
experienced some form of modern
FORCED LABOUR EXPLOITATION
slavery for periods of time ranging
from a few days to the whole five years. An estimated 16 million people were in
The average length of time victims were forced labour in the private economy in
in forced labour varied from a few days 2016. More women than men are affected
or weeks in some forms imposed by by privately imposed forced labour, with
state authorities to nearly two years for 9.2 million (57.6 per cent) female and
forced sexual exploitation. 6.8 million (42.4 per cent) male. Half
of these men and women (51 per cent)
were in debt bondage, in which personal
10 Global estimates of modern slavery: forced labour and forced marriagedebt is used to forcibly obtain labour. and do not benefit them, or prisoners
This proportion rises above 70 per cent forced to work against their will outside]
for adults who were forced to work in the exceptions established by the ILO
agriculture, domestic work, or manufac- supervisory bodies.
turing.
Among cases where the type of work
was known, the largest share of adults
who were in forced labour were domestic Forced marriage
workers (24 per cent). This was followed
by the construction (18 per cent), man-
In 2016, an estimated 15.4 million people
ufacturing (15 per cent), and agriculture
were living in a forced marriage. Of this
and fishing (11 per cent) sectors.
total, 6.5 million cases had occurred in
Most victims of forced labour suffered the previous five years (2012-2016) and
multiple forms of coercion from the remainder had taken place prior to
employers or recruiters as a way of this period but had continued into it.
preventing them from being able to
While men and boys can also be victims
leave the situation. Nearly one-quarter
of forced marriage, most victims
of victims (24 per cent) had their wages
(88 per cent) were women and girls, with
withheld or were prevented from leaving
more than a third (37 per cent) of victims
by threats of non-payment of due wages.
under 18 years of age at the time of the
This was followed by threats of violence
marriage. Among child victims, 44 per
(17 per cent), acts of physical violence
cent were forced to marry before the
(16 per cent), and threats against family
age of 15 years. While noting limits of the
(12 per cent). For women, 7 per cent of
data in key regions, particularly the Arab
victims reported acts of sexual violence.
States, the data suggests prevalence
FORCED SEXUAL EXPLOITATION OF of forced marriage per 1,000 people is
ADULTS AND COMMERCIAL SEXUAL highest in Africa (4.8 per 1,000), followed
EXPLOITATION OF CHILDREN by Asia and the Pacific (2.0 victims per
1,000).
An estimated 3.8 million adults were
victims of forced sexual exploitation
and 1.0 million children were victims
of commercial sexual exploitation in
2016. The vast majority of victims (99
Data sources and
per cent) were women and girls. More methodology
than seven in ten victims were exploited
in the Asia and the Pacific region. This
was followed by Europe and Central As no single source provides suitable
Asia (14 per cent), Africa (8 per cent), and reliable data for all forms of modern
the Americas (4 per cent), and the Arab slavery, a combined methodology has
States (1 per cent). been adopted, drawing on a variety of
data sources as required. The central
STATE-IMPOSED FORCED LABOUR
element is the use of 54 specially
There were an estimated 4.1 million designed, national probabilistic surveys
people in state-imposed forced labour involving interviews with more than
on average in 2016. They included citizens 71,000 respondents across 48 countries.
recruited by their state authorities to Administrative data from IOM databases
participate in agriculture or construction of assisted victims of trafficking were
work for purposes of economic used, in combination with the 54 datasets,
development, young military conscripts to estimate forced sexual exploitation
forced to perform work that was not of and forced labour of children, as
military nature, those forced to perform well as the duration of forced labour
communal services that were not exploitation. Forced labour imposed
decided upon at the community level by state authorities was derived from
Executive summary 11validated sources and systematic review of forced labour prevention, while
of comments from the ILO supervisory improved victim identification is critical
bodies with regard to ILO Conventions to extending protection to the vast
on forced labour. majority of modern slavery victims who
are currently unidentified or unattended.
The methodology used to build these Finally, we know that much of modern
Global Estimates combined this data, slavery today occurs in contexts of state
which covers a five-year reference period fragility, conflict, and crisis, pointing to
from 2012 to 2016. All the data on cases the need to address the risk of modern
of forced labour and forced marriage slavery as part of humanitarian actions in
that took place between 2012 and 2016, these situations.
representing a total of nearly 89 million
people, was analysed and processed Further efforts are needed to improve
to build the main estimates of modern the evidence base on modern slavery
slavery presented in this report. in order to inform and guide policy
responses in all of these areas. Key
measurement priorities identified through
the preparation of the Global Estimates
Conclusions include the improved measurement of
modern slavery affecting children and
and way forward specifically cases of commercial sexual
exploitation involving children and
child marriage. There is also a need to
Ending modern slavery will require a more effectively capture specific sub-
multi-faceted response that addresses populations such as adult victims of
the array of forces – economic, social, forced sexual exploitation and victims
cultural, and legal – that contribute to in conflict contexts. The ability to track
vulnerability and enable abuses. There changes in modern slavery over time
can be no one-size-fits-all solution; will be critical for monitoring progress
responses need to be adapted to the in the lead-up to 2030. But perhaps the
diverse environments in which modern most important priority is to strengthen
slavery still occurs. But it is nonetheless and extend national research and data
possible to identify some overarching collection efforts on modern slavery to
policy priorities in the lead-up to 2030 guide national policy responses.
from the Global Estimates and from
experience to date. International cooperation in addressing
modern slavery is essential given its global
Stronger social protection floors are and cross-border dimensions. Alliance
necessary to offset the vulnerabilities 8.7, a multi-stakeholder partnership
that can push people into modern committed to achieving Target 8.7 of
slavery. Extending labour rights in the the Sustainable Development Goals, has
informal economy – where modern an important role to play in this regard.
slavery is most likely to occur – is needed The Global Estimates indicate that the
to protect workers from exploitation. majority of forced labour today exists in
Given that a large share of modern the private economy. This underscores
slavery can be traced to migration, the importance of partnering with
improved migration governance is vitally the business community – alongside
important to preventing forced labour employers’ and workers’ organisations,
and protecting victims. and civil society organisations – to
eradicate forced labour in supply chains
Additionally, the risk and typology of
and in the private economy more broadly.
modern slavery is strongly influenced
Cooperation should be strengthened
by gender, and this must also be taken
between and among governments and
into account in developing policy
with relevant international and regional
responses. Addressing the root causes
organizations in areas such as labour law
of debt bondage, a widespread means of
enforcement, criminal law enforcement,
coercion, is another necessary element
and the management of migration in
12 Global estimates of modern slavery: forced labour and forced marriageorder to prevent trafficking and to
address forced labour across borders.
Executive summary 13© ILO
Introduction
               The new Global Estimates presented            in partnership with the International
               in this report indicate that more than        Organization for Migration (IOM).2 They
               40 million people were caught up in           benefited from inputs provided by other
               the grip of modern slavery in 2016. This      UN agencies, in particular the Office of
               alarming figure is a wake-up call to the      the High Commissioner for Human Rights
               global community, which, through the          (OHCHR). The estimates are based
               adoption of the 2030 Sustainable Devel-       on a jointly developed methodology
               opment Goals (SDGs), has committed to         summarised in the annex and described
               the target of ending modern slavery and       in detail in the methodology report
               human trafficking by the year 2030.           produced along with this Global
                                                             Estimates report.3 They are derived from
               Thirteen years is but a moment in hu-         various data sources, as no one source
               man history, and doing away with co-          was considered sufficiently suitable
               ercive systems that in some cases have        or reliable. The principal sources are
               been around for centuries – and that in       the Walk Free Foundation’s survey
               other cases are emerging from new and         data for 2014 and 2015, as well as data
               illegitimate business models, large-scale     from an additional 26 national surveys
               migration, crisis, and conflict – will be a   jointly conducted by ILO and Walk Free
               monumental challenge. Meeting the am-         Foundation in 2016 and data drawn from
               bitious 2030 target to end modern slav-       the IOM’s database of human trafficking
               ery will require renewed political will,      cases since 2012. The terminology utilised
               matched by the commitment of suffi-           in the report is described in Panel 1.
               cient resources, and a major acceleration
               of national and international efforts.        The report, and the global estimation
                                                             exercise that underpins it, forms part
               To be effective, policies and programmes      of a broader multi-partner effort to
               must be grounded in the best possible         measure and monitor progress towards
               understanding of the root causes of           Target 8.7 of the Sustainable Develop-
               modern slavery at both the national           ment Goals. This effort is taking place
               and global levels. This requires not only     within the framework of Alliance 8.7, a
               more and better information on the            multi-stakeholder partnership commit-
               numbers of people affected by modern          ted to ending forced labour, modern
               slavery, but also on its various forms and    slavery, human trafficking, and child la-
               manifestations, and the ways in which         bour in accordance with SDG Target 8.7.
               people are caught up in it. This report is
               aimed at informing global efforts towards     The report charts how far we must still
               the 2030 target by helping to fulfil these    travel to honour our commitment to
               information requirements. It is also hoped    ending modern slavery by 2030. Part 1
               that the findings presented in the report     presents the most complete possible
               will encourage further research and           profile of modern slavery in today’s
               data collection efforts by governments,       world: the main forms of forced labour
               focused on the national and local             and forced marriage, their extent and
               dimensions of modern slavery.                 characteristics, the means by which per-
                                                             sons are trapped in them, and the dura-
               The global and regional estimates             tion of the abuse. Part 2 discusses key
               presented in this report were developed       policy priorities emerging from the Glob-
               by the International Labour Organization      al Estimates in the drive to rid the world
               (ILO) and the Walk Free Foundation            of modern slavery.

Introduction                                                                                         15
Panel 1
Statistical concepts and definitions used in this report
In the context of this report, example, a woman forced her parent or parents being
modern slavery covers a set into commercial sexual engaged in forced labour.
of specific legal concepts in- exploitation is in a forced The coercion may take place
cluding forced labour, debt situation because of its during the child’s recruitment
bondage, forced marriage, involuntary nature and to force the child or his or her
slavery and slavery-like prac- the menace she is facing, parents to accept the job or,
tices, and human trafficking. regardless of the dangers once the child is working, to
Although modern slavery is and hazards she faces in force him or her to do tasks
not defined in law, it is used as this work or whether it is that were not part of what
an umbrella term that focuses permitted by law. In recent was agreed to at the time of
attention on commonalities years, the ILO has focused on recruitment or to prevent the
across these legal concepts. the two criteria embedded child from leaving the work.
Essentially, it refers to situ- in the Convention No. 29,
ations of exploitation that a namely, “involuntariness” and
person cannot refuse or leave “menace of penalty” with
because of threats, violence, regard to determining forced
coercion, deception, and/or labour of adults and forced
abuse of power. labour of children.”5
In order to make this set Forced labour of adults is de-
of complex legal concepts fined, for purposes of meas-
measurable, the Global urement, as work for which
Estimates focus on two key a person has not offered him
forms of modern slavery: or herself voluntarily (criteri-
forced labour and forced on of “involuntariness”) and
marriage. which is performed under
coercion (criterion of “men-
Forced labour is defined ace of penalty”) applied by
by ILO Forced Labour an employer or a third party.
Convention, 1930 (No. 29) The coercion may take place
as “all work or service that during the worker’s recruit-
is exacted from any person ment process to force him or
under the menace of any her to accept the job or, once
penalty and for which the the person is working, to
said person has not offered force him or her to do tasks
himself voluntarily.”4 While that were not part of what
forced labour may be was agreed to at the time of
particularly widespread recruitment or to prevent him
in certain economic or her from leaving the job.
activities or industries, a
forced labour situation is Forced labour of children
determined by the nature is defined, for purposes
of the relationship between of measurement, as work
a person and an “employer” performed by a child under
and not by the type of coercion applied by a third
activity performed, however party (other than his or her
arduous or hazardous the parents) either to the child or
conditions of work may be, to the child’s parents, or work
nor by its legality or illegality performed by a child as a
under national law. For direct consequence of his or
16 Global estimates of modern slavery: forced labour and forced marriageModern slavery
Forced labour Forced marriage
Forced sexual exploitation
State-imposed forced labour Forced labour exploitation of adults and commercial
sexual exploitation of children
TYPOLOGY OF military, compulsory partic- That is, forced marriage in
FORCED LABOUR ipation in public works, and these estimates includes all
forced prison labour. marriages of both adults and
Forced labour can be found children that were reported
in its various forms in practi- Forced marriage refers to by the survey respondent to
cally all countries and all eco- situations where persons, have been forced and with-
nomic activities. The typology regardless of their age, have out consent, regardless of
depicted above, which was been forced to marry without the age of the respondent.
developed for the global es- their consent. A person might Accordingly, the estimates
timates of forced labour, is be forced to marry through do not include every instance
based on three main catego- physical, emotional, or fi- of child marriage, as child
ries of forced labour defined nancial duress, deception by marriage is not currently
as follows: family members, the spouse, measured adequately at the
or others, or the use of force, scale or specificity required
▪▪ Forced labour exploita- threats, or severe pressure. for a global estimate.8
tion, imposed by private Forced marriage is prohibited
agents for labour exploita- through the prohibitions OTHER RELATED
tion, including bonded on slavery and slavery-like CONCEPTS
labour, forced domestic practices, including servile
work, and work imposed marriage.6 Child marriage is The other main concepts
in the context of slavery or generally considered to be of modern slavery are slav-
vestiges of slavery. forced marriage, given that ery, institutions and prac-
one and/or both parties by tices similar to slavery, and
▪▪ Forced sexual exploita- trafficking in persons (often
definition has not expressed
tion of adults, imposed by referred to as human traffick-
full, free, and informed con-
private agents for com- ing). These are not included
sent. However, there are
mercial sexual exploitation, explicitly in the estimates but
exceptions. For example,
and all forms of commer- are closely linked to them.
in many countries 16 and 17
cial sexual exploitation of Slavery was first defined in a
year-olds who wish to marry
children. This encompasses Convention adopted by the
are legally able to do so fol-
the use, procuring, or offer- League of Nations in 1926
lowing a judicial ruling or pa-
ing of children for prostitu- as “the status or conditions
rental consent.7 It is impor-
tion or pornography. of a person over whom any
tant to be clear that for the
or all of the powers attach-
▪▪ State-imposed forced purposes of these estimates,
the measurement of forced ing to the right of ownership
labour, including work
marriage is limited to what are exercised”. It thus refers
exacted by the public au-
was captured by the surveys. to control of one person or
thorities, military, or para-
Introduction 17persons over others, and is isation, it is also accepted Organized Crime, adopted in
also considered a serious that the eradication of these 2000. The definition specifies
criminal offence. The concept slavery-like practices can that the crime of trafficking
of slavery-like practices was be achieved only over time is a process constituted by
first addressed in internation- through the necessary leg- three distinct elements – act,
al law in 1956 by means of a islative and other program- means, and purpose (ex-
United Nations instrument, matic measures. ploitation). Coercion is one of
supplementing the earlier the means enumerated in the
Slavery Convention, covering While the concept of traffick- Protocol, which states that
a range of institutions and ing in persons was addressed when coercion (or any other
practices similar to slavery, in a number of earlier instru- means) is used to get victims
including debt bondage, serf- ments, the most recent and into an exploitative situation,
dom, and forced marriage.9 widely accepted definition is actual exploitation need not
While the instrument places that contained in a Protocol happen for a trafficking crime
some emphasis on criminal- to the United Nations Con- to have taken place.
vention against Transnational
Table 1
Modern slavery: global results
Number and prevalence of persons in modern slavery, by category, sex and age
Forced labour sub-categories
Total
Forced sexual Forced Modern
forced
Forced labour exploitation of adults State-imposed marriage slavery
labour
exploitation and commercial sexual forced labour
exploitation of children
No. (thousands) 15 975 4 816 4 060 24 850 15 442 40 293
World
Prevalence
2.2 0.7 0.5 3.4. 2.1 5.4
(per thousand)
No. (thousands) 6 766 29 2 411 9 206 2 442 11 648
Male Prevalence
1.8 0 0.6 2.4 0.6 3.0
(per thousand)
Sex
No. (thousands) 9 209 4 787 1 650 15 646 13 000 28 645
Female Prevalence
2.5 1.3 0.4 4.2 3.5 7.7
(per thousand)
No. (thousands) 12 995 3 791 3 778 20 564 9 762 30 327
Adults Prevalence
2.5 0.7 0.7 3.9 1.9 5.8
(per thousand)
Age
No. (thousands) 2 980 1 024 282 4 286 5 679 9 965
Children Prevalence
1.3 0.4 0.1 1.9 2.5 4.4
(per thousand)
18 Global estimates of modern slavery: forced labour and forced marriageTable 2
Modern slavery: global results
Number and prevalence of persons in modern slavery, by category, sex and age
Total forced labour Forced marriage Modern slavery
No. (thousands) 24 850 15 442 40 293
World
Prevalence
3.4 2.1 5.4
(per thousand)
No. (thousands) 3 420 5 820 9 240
Africa Prevalence
2.8 4.8 7.6
(per thousand)
No. (thousands) 1 280 670 1 950
Americas Prevalence
1.3 0.7 1.9
(per thousand)
No. (thousands) 350 170 520
Region Arab States Prevalence
2.2 1.1 3.3
(per thousand)
No. (thousands) 16 550 8 440 24 990
Asia and
Prevalence
the Pacific 4.0 2.0 6.1
(per thousand)
No. (thousands) 3 250 340 3 590
Europe and
Prevalence
Central Asia 3.6 0.4 3.9
(per thousand)
Introduction 19© Lisa Kristine
Part 1.
                   The scale and
                   manifestations
                   of modern slavery

        1.1         Main results                                           who were being forced to work against
                                                                           their will under threat, or who were living
                                                                           in a forced marriage that they had not
                                                                           agreed to. In terms of the prevalence of
                    AN ESTIMATED 40.3 MILLION PEOPLE
                                                                           modern slavery, there were 5.4 victims
                    WERE VICTIMS OF MODERN SLAVERY
                                                                           for every thousand people in the world
                    IN 2016
                                                                           in 2016. Due to limitations of the meth-
                    In other words, on any given day in                    odology and data,10 these estimates are
                    2016, there were likely to be more than                considered to be conservative.
                    40 million men, women, and children

                    Figure 1

                    Modern slavery

                    Number and percentage distribution of victims of modern slavery, by category

                                                                                            Forced labour

                                                                                            Forced marriage

                                                     15,400,000
                                                         38%

                           24,900,000
                               62%

Part 1. The scale and manifestations of modern slavery                                                              21
OF THE TOTAL NUMBER OF VICTIMS This reflects highly gendered patterns
OF MODERN SLAVERY, 24.9 MILLION of employment and migration and helps
PEOPLE WERE IN FORCED LABOUR shed light on where prevention and victim
AND 15.4 MILLION PEOPLE WERE identification efforts should be focused.
LIVING IN A FORCED MARRIAGE But the data also suggests the relevance
of broader patterns of human rights
It is worth reflecting on what these fig- abuses that disproportionately affect
ures mean: women and girls, including domestic and
▪▪ 24.9 million people were being forced sexual violence and discriminatory beliefs
to work under threat or coercion as and practices around access to property,
domestic workers, on construction education, and even citizenship.
sites, in factories, on farms and fishing
boats, in other sectors, and in the sex
industry. They were forced to work by
private individuals and groups or by
state authorities. In many cases, the
products they made and the servic-
es they provided ended up in seem-
ingly legitimate commercial channels.
Forced labourers produced some of
the food we eat and the clothes we
wear, and they have cleaned the build-
ings in which we live or work.
▪▪ 15.4 million people were living in a
forced marriage to which they had
not consented. That is, they were en-
during a situation that involved having
lost their sexual autonomy and often
involved providing labour under the
guise of “marriage”.
WOMEN AND GIRLS ARE
DISPROPORTIONATELY AFFECTED
BY MODERN SLAVERY, ACCOUNTING
FOR 71 PER CENT OF TOTAL VICTIMS
The estimates suggest that far more fe-
males than males are affected by modern
slavery (71 per cent versus 29 per cent).
This varies across forms. Women and
girls are disproportionately victimised
above all for forced labour in the private
economy (including domestic work and
the sex industry) and forced marriage.
Women and girls represented 99 per
cent of victims of forced sexual exploita-
tion and 84 per cent of victims of forced
marriages.
22 Global estimates of modern slavery: forced labour and forced marriageFigure 2
Modern slavery and sex of victim
Percentage distribution of victims of modern slavery, by sex and category
100% Female
Male
80% 40.6%
57.6%
71.1%
60% 84.2%
99.4%
40%
59.4%
20% 42.4%
28.9%
15.8%
0.6%
0%
Modern Forced labour Forced sexual State-imposed Forced marriage
slavery exploitation exploitation forced labour
Forced labour
The Global Estimates indicate that ONE IN FOUR VICTIMS OF MODERN
men are disproportionately subject to SLAVERY IN 2016 WERE CHILDREN
state-imposed forms of forced labour, BELOW THE AGE OF 18 YEARS
reflecting the impact on men of abusive
conscription and imprisonment, and to One of the most alarming findings of the
forced labour in sectors that traditionally modern slavery estimates is the extent
involve manual labour (construction, to which children are victims. One-quar-
manufacturing, and agriculture/fishing). ter of all modern slavery victims –
They also confirm that men and boys 10 million persons in all – were children.
can be victims in all aspects of modern Children were especially likely to fall
slavery, including forced sexual exploita- victim to forced marriage. Some 37 per
tion and forced marriage. Accordingly, it cent, or 5.7 million, of those forced to
is critical that preventative efforts reflect marry were children. Children represent-
this risk profile and also that national laws ed 21 per cent of the victims of forced
and responses to victimisation make al- sexual exploitation, 18 per cent of those
lowance for male victims. subjected to forced labour exploitation,
and 7 per cent of people forced to work
by state authorities.
Part 1. The scale and manifestations of modern slavery 23Figure 3
Modern slavery and age of victim
Percentage distribution of victims of modern slavery, by age and category
100% Children
6.9%
18.7% 21.3% Adults
24.7%
80% 36.8%
60%
93.1%
40% 81.3% 78.7%
75.3%
63.2%
20%
0%
Modern Forced labour Forced sexual State-imposed Forced marriage
slavery exploitation exploitation forced labour
Forced labour
There is in fact only a small difference
between children and adults in terms
of prevalence of modern slavery. There
were 5.9 adult victims of modern slavery
for every 1,000 adults in the world and
4.4 child victims for every 1,000 chil-
dren in the world. When examining the
rates of prevalence by form of modern
slavery, adults were more likely than chil-
dren to be victims of all three forms of
forced labour; however, children were
more likely than adults to be victims of
forced marriage. For every 1,000 chil-
dren, there were 2.5 victims of forced
marriage, while for every 1,000 adults
there were 1.9 victims of forced marriage.
24 Global estimates of modern slavery: forced labour and forced marriageFigure 4
Modern slavery and age of victim
Prevalence (per 1,000 persons) of modern slavery, by age and category
Children
Adults
5.9
4.4
2.5 2.5
1.9
1.3
0.4
0.7 0.1 0.7
Modern Forced labour Forced sexual State-imposed Forced marriage
slavery exploitation exploitation forced labour
Forced labour
Forced labour of children takes two pre- days or entered into a forced marriage.
dominant forms. It can result from their Of these, 82.7 million were victims of
guardians themselves being in forced forced labour and 6.5 million had been
labour, in which case the children work forced to marry against their will. There
with their parents or at least for the is wide variation in how long victims of
same employer. Or the children may be modern slavery remain in their situation.
in forced labour on their own as a result While some manage to escape after a
of trafficking, deceptive recruitment, or few days or weeks, others are trapped
coercive means used by their direct em- for years, as is the case for those in tradi-
ployer. In the former case, parents are tional forms of hereditary bonded labour
more likely to be aware of their children’s and some forced marriages. For victims
situation and working conditions. In the registered by IOM after 2012, the average
latter case, parents are less likely to be duration in forced labour exploitation was
aware, as with children who migrate slightly over 20 months and for the vic-
alone or are trafficked into forced labour, tims of sexual exploitation it was 23
particularly domestic work. months. Victims of forced labour im-
posed by state authorities were exploit-
THERE WAS A TOTAL OF 89 MILLION ed for a duration that varied from a few
VICTIMS OF MODERN SLAVERY OVER days per month (for example, when au-
THE PERIOD FROM 2012 TO 2016; thorities force people to participate in
THE TIME DURATION VARIED WIDELY illegal communal services) to several
Over the five-year period from 2012 to years for some cases of prison labour or
2016, 89 million people were either in forced labour in the context of military
forced labour for a minimum number of service.
Part 1. The scale and manifestations of modern slavery 25Figure 5
Regional prevalence of modern slavery
Prevalence of modern slavery (per 1,000 population), by region and category
7.6
Forced labour
Forced marriages
6.1
5.4 2.8
3.9
3.4 4.0 3.3
4.8 1.9
3.6 2.2
1.3
2.1 2.0
1.1
0.4 0.7
World Africa Asia and Europe and Arab States Americas
the Pacific Central Asia
THE PREVALENCE OF MODERN bearing in mind critical gaps and limita-
SLAVERY IS HIGHEST IN AFRICA tions of the data.11 This is especially the
case in Central Asia and the Arab States,
There were 7.6 victims for every where few surveys have been conduct-
thousand people in the Africa region. This ed despite numerous reports of forced
was followed by the Asia and the Pacific labour and forced marriages occurring.12
region (6.1 per 1,000), Europe and Cen- Far more research and survey work is re-
tral Asia (3.9 per 1,000), the Arab States quired at the national level to provide a
(3.3 per 1,000) and finally the Americas more comprehensive picture.
(1.9 per 1,000). Regional prevalence rank-
ings differed for the two main categories
of modern slavery – forced labour and
forced marriage. Asia and the Pacific had
the highest prevalence of forced labour
(4.0 per 1,000) and Africa the highest
prevalence of forced marriage (4.8 per
1,000). The regional figures are impor-
tant but should be interpreted with care,
26 Global estimates of modern slavery: forced labour and forced marriageFigure 6
Regional distribution of modern slavery
Number (in thousands) and percentage distribution of victims of modern slavery, by region
Asia and the Pacific
Europe and Central Asia
Africa
3,600
Americas
9%
Arab States
25,000
62%
9,230
23%
1,950
5%
520
1%
THE POPULOUS ASIA AND PACIFIC
REGION IS HOST TO BY FAR
THE LARGEST ABSOLUTE NUMBER
OF VICTIMS OF MODERN SLAVERY
Figures for the absolute numbers of
persons in modern slavery underscored
the importance of the Asia and Pacific
region, where 62 per cent of all victims
of modern slavery worldwide were locat-
ed. This was followed by the Africa re-
gion (23 per cent), Europe and Central
Asia (9 per cent), the Americas (5 per-
cent), and finally the Arab States (1 per
cent). The Asia and the Pacific region has
the highest share of victims across all
forms of modern slavery, accounting for
73 per cent of victims of forced sexual
exploitation, 68 per cent of those forced
to work by state authorities, 64 per cent
of those in forced labour exploitation,
and 42 per cent of all those in forced
marriages.
Part 1. The scale and manifestations of modern slavery 271.2 Forced labour
Table 3
Forced labour
Number and prevalence of persons in forced labour, by category, sex and age
Forced labour sub-categories
Total
Forced sexual exploitation of adults forced
Forced labour State-imposed
and commercial sexual exploitation of labour
exploitation forced labour
children
No. (thousands) 15 975 4 816 4 060 24 850
World
Prevalence
2.2 0.7 0.5 3.4.
(per thousand)
No. (thousands) 6 766 29 2 411 9 206
Male Prevalence
1.8 0 0.6 2.4
(per thousand)
Sex
No. (thousands) 9 209 4 787 1 650 15 646
Female Prevalence
2.5 1.3 0.4 4.2
(per thousand)
No. (thousands) 12 995 3 791 3 778 20 564
Adults Prevalence
2.5 0.7 0.7 3.9
(per thousand)
Age
No. (thousands) 2 980 1 024 282 4 286
Children Prevalence
1.3 0.4 0.1 1.9
(per thousand)
This section of the report presents the on farms in Latin America, begging in
main findings related to forced labour European cities, and constructing high
using three broad categories: forced rise buildings in the Gulf States, among
labour exploitation,13 forced sexual other sectors and geographic areas.
exploitation,14 and state-imposed forced Regardless of the setting, an identifying
labour.15 feature of situations of forced labour is
lack of voluntariness in taking the job or
Forced labour, as set out in ILO Forced accepting the working conditions, and
Labour Convention, 1930 (No.29),16 refers the application of a penalty or a threat
to “all work or service which is exacted of a penalty to prevent an individual
from any person under the menace of from leaving a situation or otherwise
any penalty and for which the said person to compel work. Coercion can take
has not offered himself voluntarily”. many forms, ranging from physical and
Men, women, and children are forced sexual violence or threats against family
to work in various settings across the members to more subtle means such as
globe, with examples of forced labour withholding of wages, retaining identity
found in garment making in South Asian documents, threats of dismissal, and
factories, digging for minerals in African threats of denunciation to authorities.
mines, harvesting tomatoes on North
American farms, working as domestic
workers in East Asian homes, working
28 Global estimates of modern slavery: forced labour and forced marriagevictims of forced labour exploitation in
economic activities such as agriculture,
AN ESTIMATED 24.9 MILLION construction, domestic work, and man-
PERSONS WERE VICTIMS ufacturing, 4.8 million were victims of
OF FORCED LABOUR IN 2016 forced sexual exploitation, and 4.1 million
were victims of forced labour imposed
Among the 24.9 million people in any
by state authorities.
form of forced labour, 16 million were
Figure 7
Forced labour
Number and percentage distribution of victims of forced labour, by sub-category
Forced labour exploitation
Forced sexual exploitation
4,100,000 State-imposed forced labour
17%
4,800,000
19%
16,000,000
64%
A SIGNIFICANT SHARE OF VICTIMS
OF FORCED LABOUR WERE
EXPLOITED OUTSIDE
THEIR COUNTRY OF RESIDENCE17
Almost one of every four victims of forced
labour were exploited outside their
country of residence. As illustrated
in Figure 8, victims of forced sexual
exploitation appear most likely to have
been exploited outside their country of
residence, while, not surprisingly, almost
all forced labour imposed by state
authorities took place within the borders
of their own countries. It should be
noted, however, that these differences
by typology were driven in part by the
differences in the data sources used for
measuring them.18
Part 1. The scale and manifestations of modern slavery 29Figure 8
Forced labour and migration
Percentage of victims of forced labour living outside their country residence, by form of forced labour
100%
80%
60%
40%
74%
20%
23%
14% 1%
0%
Forced labour (total) Forced sexual Forced labour State-imposed
exploitation exploitation forced labour
The large share of victims exploited This point is taken up further in Panel 2.
outside their country of residence points The fight against modern slavery is thus
to the high degree of risk associated with integrally related to global initiatives
migration in the modern world, particu- to promote orderly, safe, and regular
larly for migrant women and children, migration, such as the global compact
who are likely to be the most vulnerable. for safe, orderly and regular migration.
Panel 2
Migration and the risk of exploitation
Although most migration is smugglers and become traf- reduced bargaining power.
voluntary and has a positive ficked along the way. Once Large-scale displacement
impact on individuals and so- they reach their destination, caused by humanitarian crises
cieties, migration can increase migrants who have travelled such as armed conflicts, nat-
vulnerability to human traffick- through regular and irregular ural disasters, and protracted
ing and exploitation. Irregular channels remain vulnerable to unrest can also create vul-
migrants, for instance, trafficking in persons and oth- nerable populations who can
may be subjected to kidnap er forms of exploitation due to become victims of traffick-
and ransom demands, extor- language barriers, challeng- ing.19
tion, physical violence, sex- es of social integration, and
ual abuse, and trafficking in unscrupulous employers and Migrant workers and job seek-
persons. They may start their landlords who take advan- ers, who constitute the major-
journeys by willingly placing tage of their limited knowl- ity of international migrants,
themselves in the hands of edge of local conditions and are vulnerable to human
trafficking throughout their
30 Global estimates of modern slavery: forced labour and forced marriagemigration process. Labour documented the clear links among children and youth on
migration is an increasingly between human trafficking the move through the Medi-
complex and dynamic phe- and migration. The United terranean Sea.23
nomenon taking place within Nations Office on Drugs and
and between all regions of Crime (UNODC) reports that Opportunities for exploita-
the world. In certain migration approximately 60 per cent of tion of migrant workers can
corridors, such as between victims of trafficking in per- include charging recruitment
Asia and the Arab States and sons detected between 2012 fees, providing false promis-
within South-East Asia, the and 2014 were from outside es about salaries or working
number of international mi- the country where they were conditions, or even the na-
grants, the large majority of exploited.21 IOM also docu- ture of the job itself. Migrant
whom are migrant workers, mented the predatory behav- workers may find themselves
has tripled since 1990. Tem- iour and the kinds of enabling employed under substand-
porary labour migration, par- environments in which human ard working conditions, be-
ticularly of low-skilled work- trafficking and associated ing paid at wage levels be-
ers, is exceeding permanent forms of abuse and exploita- low national standards and
flows, and this presents a sig- tion flourish along key mi- counterparts, and sometimes
nificant governance challenge gration routes. For example, kept under these conditions
in terms of ensuring decent approximately three-quarters due to their immigration sta-
work and reducing migration of respondents in IOM’s Flow tus, difficulties in changing
costs for this category of mi- Monitoring Surveys conduct- employment linked to re-
grant workers.20 Many migrant ed on the Central Mediterra- strictive visa regimes, and/
workers are concentrated in nean route to Europe from or debt bondage. While pro-
specific economic sectors North Africa (primarily Libya) tections for migrant workers
such as domestic work, man- reported direct experiences are increasing in some areas,
ufacturing, construction, and of abuse, exploitation, coer- particularly through bilateral
agriculture. Special attention cion and practices that may agreements, there is a con-
is required for domestic work- amount to human traffick- tinued need to reform the
ers, who are among the most ing.22 Findings from a recent recruiting and contracting
vulnerable groups of workers. report by UNICEF and IOM systems that place migrant
also shed light on the risks of workers at risk of forced la-
Several recent reports have trafficking and exploitation bour and human trafficking.
NINETY-FOUR PER CENT OF MODERN cal data providing insight into the connec-
SLAVERY VICTIMS WERE EXPLOITED tion between income levels and forced
IN A COUNTRY IN THE SAME labour movements. To explore this issue,
INCOME-BASED REGIONAL GROUPING the estimates of victims of forced labour
AS THEIR COUNTRY OF RESIDENCE were examined according to the income
levels of the victims’ country of residence
Poverty is often cited as an important risk and of the country where the exploitation
factor for modern slavery, and relative took place. The results suggest very lit-
wealth disparities between countries are tle movement across income groupings.
often cited as a pull factor. While poverty Ninety-four per cent of victims of forced
can drive a decision to migrate for labour, labour were exploited in a country that
it can also act as a barrier to migration, was in the same income-based regional
as members of the poorest groups are of- grouping as their country of residence.
ten unable to raise the money required to People who were exploited in the low-
reach their destination, whether through and lower-middle-income groupings were
accessing loans in their local communities almost exclusively residents of countries
or from others in the migration industry. that were in the same income grouping.
But to date there has been limited empiri-
Part 1. The scale and manifestations of modern slavery 311.2.1 Forced labour Females accounted for a significant-
ly larger share of total victims (57 per
exploitation cent) than males (43 per cent). Nearly
20 per cent of the victims of forced la-
bour exploitation were children, who
This sub-section refers to persons in may have worked alone, far from their
forced labour exploitation imposed by families, or together with their parents.
private actors other than for commercial Among cases of forced labour exploita-
sexual exploitation. tion where the type of work was known,24
the largest share – almost a quarter – was
AN ESTIMATED 16 MILLION PEOPLE in domestic work. This was followed by
WERE VICTIMS OF FORCED the construction (18 per cent), manufac-
LABOUR EXPLOITATION IMPOSED turing (15 per cent), and agriculture and
BY PRIVATE ACTORS IN 2016 fishing (11 per cent) sectors.
Figure 9
Sector of forced labour exploitation
(a) Sectoral distribution of victims of forced labour (b) Sex distribution of victims of forced labour
exploitation(a), (b) exploitation, by sector of economic activity(a), (b)
Female Male
1%
100% 4% Begging
10
7% 18 18
Mining and quarrying
9% 32
80% Personal services
10% 48 48
Wholesale and trade 61
11%
Accommodation and
60%
food service activities
92
15% Agriculture, forestries, 100
and fishing 90
40% 82 82
18% Manufacturing 68
Construction 52 52
20% 39
Domestic work
24%
8
0%
Accommodation and
food service activities
Domestic work
Personal services
Agriculture, forestries,
and fishing
Wholesale and trade
Manufacturing
Construction
Begging
Mining and quarrying
Note: (a) These figures are based on cases of forced labour exploitation where industry was reported. Informa-
tion on the industry was available for 65 per cent of total cases of forced labour exploitation; and (b) with the
exception of begging, categories are based on the International Standard Industrial Classification of All Eco-
nomic Activities, Rev.4 (1-digit level). For further detail and explanation see United Nations Statistics Division
(https://unstats.un.org/unsd/cr/registry/regcst.asp?Cl=27).
32 Global estimates of modern slavery: forced labour and forced marriageDIFFERENCES BY SEX IN THE Within each of these broader economic
TYPOLOGY OF FORCED LABOUR activity areas, forced labour exploita-
EXPLOITATION WERE CONSIDERABLE tion can take on a number of forms.
They range from the servile practices
Male victims were much more likely than still found in parts of the world’s poorer
female victims to be in the mining, man- countries, often the vestiges of slavery
ufacturing, construction, and agriculture or longstanding practices of ethnic and
sectors. Nine out of every 10 victims in- social discrimination, to the abuses in the
volved in begging were also male. Fe- supply chains of major modern compa-
male victims of forced labour exploita- nies. Some of these issues by sector are
tion were much more likely to be in the reviewed Panel 3.
accommodation and food services in-
dustry and in domestic work.
Panel 3
Forms of forced labour exploitation in the private economy
DOMESTIC WORK 19 per cent. Moreover, umented, the fragmented
high-income countries ac- nature of recruitment can
The domestic work sec- count for 9.1 million domestic lead to “excessive fees, work-
tor, which accounted for workers globally, amounting ing conditions akin to forced
24 per cent of identified to about 80 per cent of the labour, contract substitu-
forced labour exploitation total. tion, visa trading, and inef-
cases, is now receiving more fective complaint and griev-
attention for its employment With a few exceptions, ance procedures”. Excessive
potential but also for the domestic workers are exclud- recruitment fees are often
abuses occurring within it, ed from the protections in transferred to workers in
including extreme violence. national labour laws. Com- the form of direct payments,
There has been a steady in- mon grievances have includ- large loans requiring repay-
crease in the overall number ed unpaid wages, the with- ment at extremely high inter-
of persons, mainly migrant holding of wages, lack of est rates, or salary deduction
women, seeking employment overtime pay, long hours and schemes.26
in this sector. Significantly, heavy workloads, inadequacy
the ILO’s most recent global of rest days, absence of health The situation can be ex-
estimate of migrant workers care and maternity leave, acerbated when migrant
has a special focus on mi- poor living conditions, and is- domestic workers are tied
grant domestic workers.25 sues related to contracts and for a lengthy period of time
Worldwide, there are cur- their termination. There has to one employer by visa ar-
rently an estimated 67 million however been some progress rangements. In such situ-
domestic workers, of whom in recent years, notably since ations, they may suffer re-
some 11.5 million are migrant the ILO’s Domestic Workers strictions on their freedom
domestic workers and almost Convention, 2011 (No. 189) of movement, leaving them
three-quarters are women. was adopted. isolated and alone and with
The Asia and the Pacific no effective remedy against
region hosts the largest The coercion domestic work- abusive treatment.
share, with almost a quarter ers often face, and which in
of the world’s female migrant many cases leads to forced CONSTRUCTION
domestic workers, followed labour situations, typically
stems from recruitment and In the construction industry,
by Europe with 22.1 per cent
job placement mechanisms. which is estimated to employ
and the Arab States with
As has been widely doc- 7 per cent of the global work-
Part 1. The scale and manifestations of modern slavery 33You can also read