EDTECH IN INDONESIA-READY FOR TAKE-OFF? May 2020 - World Bank Document
←
→
Page content transcription
If your browser does not render page correctly, please read the page content below
Public Disclosure Authorized            Public Disclosure Authorized   Public Disclosure Authorized   Public Disclosure Authorized

           May 2020
                      READY FOR TAKE-OFF?
                      EDTECH IN INDONESIA –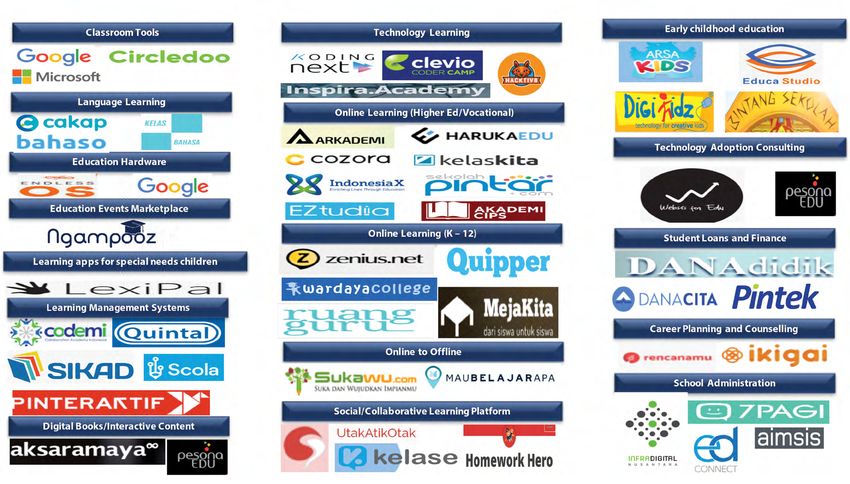
This report is a product of the staff of the World Bank, supported by funding from the
Australian government. The findings, interpretations, and conclusions expressed
in this report do not necessarily reflect the views of the Executive Directors of the
World Bank or the governments they represent, or the Australian government.
The World Bank does not guarantee the accuracy of the data included in this
work. The boundaries, colors, denominations, and other information shown on
any map in this work do not imply any judgment on the part of the World Bank
concerning the legal status of any territory or the endorsement or acceptance of
such boundaries.

© 2020 The World Bank
1818 H Street NW, Washington DC 20433
Telephone: 202-473-1000
www.worldbank.org

The material in this publication is copyrighted. Copying and/or transmitting
portions or all of this work without permission may be a violation of applicable
law. The World Bank encourages dissemination of its work and will normally
grant permission to reproduce portions of this work promptly.

For permission to photocopy or reprint any part of this work, please send a
request with complete information to the Copyright Clearance Center, Inc., 222
Rosewood Drive, Danvers, MA 01923, USA, telephone 978-750-8400, fax 978-750-
4470, http://www.copyright.com/.

All queries on rights and licenses, including subsidiary rights, should be addressed
to World Bank Publications, The World Bank Group, 1818 H Street NW, Washington,
DC 20433, USA; fax: 202-5222625; e-mail: pubrights@worldbank.org.

Cover photo: Sahlan/Shutterstock.com
EDTECH IN INDONESIA –
READY FOR TAKE-OFF?
 May 2020
CONTENTS

    CONTENTS

    Acknowledgements                                                                               5
    Executive Summary                                                                              6
    THE INDONESIAN ICT4E LANDSCAPE                                                                 9
    1.     Introduction                                                                            9
    2.     Methodology                                                                            15
    3.     The Global EdTech Sector Context                                                       17
    4.     A Brief Overview of the Governance of Indonesia’s Education System                     21
    5.     Indonesia’s Private EdTech Sector Landscape                                            25
     5.1 Key product and service offerings                                                        26
     5.2 Target market                                                                            30
     5.3 Business models                                                                          34
     5.4 Founders’ characteristics                                                                37
    6.     Investors’ Perspective on Indonesia’s EdTech Sector                                    39
     6.1 Challenges investors identified as major hurdles                                         44
    7.     Challenges and Opportunities Facing the EdTech Sector in Indonesia                     45
     7.1 Demand-side challenges                                                                   48
     7.2 Regulatory challenges                                                                    53
     7.3 Impacts of the coronavirus crisis: An opportunity for some                               56
    8.     Recommendations and Policy Options                                                     61
     8.1 Set standards and ensure data security                                                   62
     8.2 Measure the impact and cost-effectiveness of EdTech products                             62
     8.3 Digital infrastructure and connectivity                                                  63
     8.4 Support the development of EdTech startups                                               64
     8.5 Support engagement of the private sector with interested public schools and vice-versa   64
     8.6 EdTech can be a bridge to education for the economy of the future, but support and       65
         planning are required
    References                                                                                    67
    Appendix                                                                                      73
    Appendix A: List of Interview and Survey Candidates                                           74
    Appendix B: List of EdTech Companies Identified                                               76
    Appendix C: Description of Product and Services with Selected Examples                        78

2   EDTECH IN INDONESIA - READY FOR TAKE-OFF?
CONTENTS
Figures
Figure 1: Room for improvement in government spending and learning outcomes 10
Figure 2: Indonesia’s relatively low expenditure on education 11
Figure 3: Lack of the right skills bites, particularly for managers 12
Figure 4: Indonesia lags behinds peers on digitization and labor productivity 13
Figure 5: Global investment in EdTech companies has skyrocketed in recent years 18
Figure 6: Consumer companies and corporates attracted the most investment 19
Figure 7: Government expenditure on education 22
Figure 8: Spending on IT lags other sectors and peer countries 23
Figure 9: The private Indonesian EdTech sector has sprung to life over the past six years 26
Figure 10: Indonesia’s EdTech sector landscape offers a wide range of products and services 27
Figure 11: Diversity in product and services offered by the EdTech companies in Indonesia 28
Figure 12: Almost half Indonesian EdTech firms cover multiple topics 29
Figure 13: Delivery mode of the different products offered by EdTech firms 29
Figure 14: EdTech market coverage is concentrated in the Jakarta region 30
Figure 15: EdTech firms targeted several user groups 32
Figure 16: EdTech firms tend to target older students 32
Figure 17: Only 49 percent of EdTech users paid full fees for the products 32
Figure 18: EdTech firms’ engagement with government 33
Figure 19: Reasons for business model changes and pivots 35
Figure 20: Funding is sought from a variety of sources 36
Figure 21: Many EdTech founders are serial entrepreneurs 37
Figure 22: VC activity in Indonesia is growing 40
Figure 23: E-commerce and transport attract the most interest from VCs 41
Figure 24: The investment outlook is most positive for the FinTech and health-care sectors 41
Figure 25: Supply-side challenges 46
Figure 26: Multiple business models 47
Figure 27: Demand-side challenges 49
Figure 28: Digital infrastructure quality is poor in Indonesia 52
Figure 29: Indonesia lags behind in fixed broadband connection 53
Figure 30: Six-month Google Trends report for keywords “Rumah Belajar” 57
Figure 31: Six-month Google Trends report for keywords “Belajar dari Rumah” 57
Figure 32: Six-month Google Trends report for keywords “belajar di tvri” 58
Figure 33: Web traffic overview for some EdTech platforms 58
EDTECH IN INDONESIA - READY FOR TAKE-OFF? 3CONTENTS
Boxes
Box 1: EdTech is a large market globally, but what do these investments actually buy in 19
terms of learning?
Box 2: Pustekkom’s five main areas of responsibility 24
Box 3: Example of acquiring accreditation for online courses 33
Box 4: Main challenges identified by EdTech investors in Indonesia 44
Box 5: Resistance to change by consumers and providers 50
Box 6: High discount rates 51
Box 7: Chile’s EdTech marketplace 54
Box 8: China’s EdTech rise 55
Box 9: Two examples of assessing EdTech efficacy 63
4 EDTECH IN INDONESIA - READY FOR TAKE-OFF?ACKNOWLEDGEMENTS
ACKNOWLEDGEMENTS
This document has been prepared by Riaz Bhardwaj (Consultant, World Bank Group)
and Noah Yarrow (Senior Education Specialist, World Bank), together with Massimiliano
Calì (Senior Economist, World Bank). It is a joint product of the Education (EDU) and
the Macroeconomics, Trade and Investment (MTI) Global Practices of the World Bank
Group. The team would like to thank Toby Linden (Practice Manager, HEAED), Tomio
Komatsu (Sr. Investment Officer, IFC), Gerald Ariff (Co-founder, HarukaEdu), Paul Sabda
(Chairman of INETA and Founder, Zenius Education), Tigran Adiwirya (Co-founder,
Websis), Aditya Kamath (Executive Director, Northstar), Hary Candra (Founder,
PesonaEdu) and Ronald Ishak (Managing Partner, Hactiv8) for useful comments and
sharing their experiences with us, as well as Alexander Michael Tjahjadi for analytical
support. We would also like to thank all the EdTech founders who shared their valuable
insights with us (see Appendix A). This report contributes to the Indonesia Country
Private Sector Diagnostic (CPSD) led by the MTI Global Practice and is funded by the IFC
Indonesia Investment Climate, as well as by the Australian Government. The opinions
and conclusions shared in this document are the sole responsibility of the authors. We
endorse no company or product or service mentioned in this report, nor do we imply any
judgement about those not mentioned.
Suggested citation: Bhardwaj, R., and Yarrow, N. with Calì, M. 2020. EdTech in Indonesia:
Ready for Take-off? Jakarta: World Bank Group.
EDTECH IN INDONESIA - READY FOR TAKE-OFF? 5EXECUTIVE SUMMARY
Executive Summary
While Indonesia has made significant progress on increasing access to education over the past few
decades, learning outcomes remain low. In addition to key reforms in the public education system in terms
of increased quality of spending, the use of information, communications and technology for education
(EdTech) provision holds considerable promise in improving educational outcomes. This is particularly
the case in Indonesia, where the newly appointed Minister of Education has indicated strong interest in
leveraging technology for learning.1 Globally, this trend is driven largely by the private sector, which has
higher incentives to innovate than the public sector. For instance, in India, MindSpark products individually
customize educational content to match the level and rate of progress of each student; in the United States,
Coursera provides an online platform for acquiring bachelor’s or master’s degrees; in China, VIPKid connects
learners with English-speaking tutors from the United States and Canada. The COVID-19 crisis has forced a
very fast and broad increase in the use of EdTech, which is expected to have lasting effects on the market.
This EdTech landscape survey provides an overview of the Indonesian startup ecosystem in EdTech,
drawing upon three main sources of information: publicly available data, information collected
via an online-questionnaire sent to 60 EdTech players—representing the vast majority of the main
players—and 18 structured, in-depth face-to-face interviews from December 2018 through February
2019, as well as a group consultation with preliminary findings and recommendations. The findings
reveal that the Indonesian EdTech sector is starting to catch up with the global frontier, and with growth
of similar platforms, such as Harukaedu (a platform offering online university degrees), Ruangguru (an
interactive e-learning platform for K-12 students in Indonesia) and Cakap by Squline (a tutoring platform
for language learning), but overall the sector is still in its infancy. This early stage of development applies
to evidence as well; there is almost no rigorous information available about the quality or effectiveness of
the products and services offered in the Indonesian EdTech market, something that is true of many EdTech
markets globally.
Indonesian EdTech products generally aim at helping students with learning and upskilling, helping
educators with student management, communication and teaching, and helping educational
institutions with administration. For example, companies such as Ruangguru, Zenius and Quipper
provide self-directed e-learning content, interactive learning platforms, and study tools that help students
to expedite the learning process, along with interactive online services that help students with their
assignments and test preparation. Companies such as Arsa Kids, Digikids and Educa Studio develop game-
based and blended learning experiences, including interactive storybooks and educational mobile apps, to
help improve early childhood educators’ effectiveness.
The sector is still in its infancy, with almost all the main EdTech startups engaged in a high level of
product/market experimentation. Ninety percent of EdTech firms surveyed have changed their original
business models after identifying new gaps in the sector and/or to achieve greater cost-efficiency. In addition,
most Indonesian EdTech firms initially offer some features or content for free, or provide full-feature/content
1 https://tekno.tempo.co/read/1269241/klarifikasi-nadiem-makarim-soal-penggunaan-aplikasi-pendidikan
6 EDTECH IN INDONESIA - READY FOR TAKE-OFF?EXECUTIVE SUMMARY
for free for a limited time before they start charging fees. However, most free users do not upgrade to paid
accounts after the trial period ends, and this helps to explain why most firms are not yet profit-generating.
Most EdTech firms directly target students, while less than one-third of the survey respondents
target parents and only a handful target teachers. This is at odds with the fact that parents and teachers
play a significant role in dissemination of EdTech products, and may add to the firms’ challenge of becoming
profitable. Products and services offered in the Indonesian EdTech sector typically target junior high schools,
senior high schools and higher education, as well as professionals, with few products in the primary or pre-
primary sectors or in technical/vocational education. This focus on later school years is a missed opportunity,
in part because returns to learning decrease with age (Heckman, 2006). More importantly, it is part of the
inequality of the current EdTech ecosystem, which is pitched toward older, wealthier, more urban clients
over younger, poorer, more rural ones. Some of this is predictable, as markets follow clients and required
minimum levels of connectivity and data speeds, but there are large opportunities to improve equality.
Another challenge for Indonesia’s EdTech sector, likely connected to the current low profitability
of the sector, is funding. The majority of the firms surveyed have acquired funding from more than one
source, with the most common source being angel investors. Interviews with venture capital firms (VCs)
and other capital investors suggest that the EdTech sector has not yet gathered significant attention from
VCs. This is at least partly because Indonesian EdTech firms are perceived as low-yielding social enterprises
compared with other high profit-generating technology startups.
Despite this, the general perception among investors we interviewed is that the EdTech sector
in Indonesia has great market potential—assuming that the current major bottlenecks can be
addressed—as it still lags far behind other emerging countries, such as China and India. For example,
in 2017, around half of all EdTech companies in the world that raised more than US$100 million in capital
were in China (Adkins, 2018). By some estimates, China’s EdTech sector is projected to grow by 20 percent
annually over the next few years (Liu, 2018). The Indian online education sector is expected to grow around
eightfold between 2016 and 2021 (KPMG, 2017).
The Indonesian EdTech sector faces major bottlenecks that prevent it from replicating a similar level
of success seen in other technology sectors and in other countries. These bottlenecks can be broadly
categorized in two groups. Supply-side constraints include: (i) difficult access to funding; (ii) high marginal
costs particularly to acquire and retain new customers; and (iii) a shortage of qualified talent to develop
and maintain products. These are coupled by demand-side constraints including: (iv) a low willingness to
pay on the side of customers, schools and parents in particular; (v) a lack of digital literacy particularly on
the side of education providers; and (vi) poor digital infrastructure, which limits connectivity in remote
regions and download speeds across the country. The overlapping responsibilities between local and
central governments on new education tools, along with the public education system’s limited capacity
and limited incentives to value the potential of EdTech products, further complicate these constraints. In
addition, Indonesia’s underdeveloped consumer protection regulations, particularly on data security and
privacy, mean that student and school data may be at risk.
EDTECH IN INDONESIA - READY FOR TAKE-OFF? 7EXECUTIVE SUMMARY
A number of options could help to address these constraints.
1. The Government of Indonesia (GoI) should set standards for data privacy and security related to EdTech
products. This has been a major issue in other markets, particularly the United States, and has contributed
to a backlash against EdTech in some school districts internationally.
2. EdTech firms could partner with academia and government to establish clear standards for performance
and cost-effectiveness, and to transparently and rigorously evaluate some of the current leading
products.
3. The GoI should continue to invest in improving digital infrastructure and connectivity, particularly in
underdeveloped areas and for underserved communities. The inequalities in access to online learning
mean that children without connectivity have fewer opportunities to learn while schools are closed as
part of the COVID-19 crisis response.
4. One key step will be to help increase potential customers’ trust toward these new learning and teaching
tools and, as a result, also their willingness to pay. This will require increased support for the development
of EdTech startups, making use of startup assistance organizations (SAOs).
5. Both the public and private sectors need to engage with each other more effectively. Private firms
need to better understand the needs of teachers, schools and parents, while the public sector needs
to become more effective at engaging with the private sector, clarifying its governance structure and
promoting public-private partnerships (PPPs) for product development.
6. The public education system could partner with EdTech firms to improve teachers’ ability to deliver
technology-focused content. An effective partnership with EdTech firms could also help public education
to update the content of the national curriculum, not just in terms of, but also beyond, technology-
related topics. This partnership could also support student learning in the event of another crisis that
restricts student access to schools, increasing the overall resilience of the education system.
8 EDTECH IN INDONESIA - READY FOR TAKE-OFF?01
THE INDONESIAN
ICT4E LANDSCAPE
INTRODUCTION
EDTECH IN INDONESIA - READY FOR TAKE-OFF? 9INTRODUCTION
Indonesia has made significant improvements in its education sector over the past 15 years through
major reforms. In particular, gains have been made in terms of improving access to education, as well as
educational attainment (World Bank, 2018a). Despite these gains, however, Indonesia still lags behind many
regional peers in terms of student learning— based on PISA 2018 scores, only 30 percent of students met the
most basic level of literacy proficiency (OECD, 2018). Indonesia lags behind many emerging market peers in
terms of spending and learning outcomes as measured by global benchmarks such as PISA scores (Figure
1). Such low levels of sector productivity are concerning, especially when the Government of Indonesia
(GoI) has a legal mandate to spend 20 percent of its budget on the education sector. While the Indonesian
mandate may appear to be a very large amount, when expressed in terms of share of GDP, Indonesia lags
behinds its regional peers in public education spending (Figure 2). This an effect primarily of low levels of
tax collection, which is expected to worsen during the COVID crisis.
Figure 1: Room for improvement in government spending and learning outcomes
600
550 Singapore
Average PISA 2018 Reading Score
Hong Kong
Estonia
Korea Finland United Kingdom
Ireland
New Zealand Poland Japan United States Denmark
Vietnam France Germany Australia
500 Sweden Norway
Portugal
Czech Republic Netherlands
Lithuania Latvia Belgium Austria
Italy Switzerland
Hungary
Israel Slovenia Iceland
Chile
450 Slovak Republic Malta
Romania
Moldova Costa Rica
Jordan Mexico Bulgaria
Brazil
Peru Colombia Albania
400
Thailand
Indonesia
350
0 2.000 4.000 6.000 8.000 10.000 12.000 14.000 16.000
Public expenditure per student (constant 2015 PPP$)
Source: Calculated from PISA and UNESCO UIS (2020).
10 EDTECH IN INDONESIA - READY FOR TAKE-OFF?Figure 2: Indonesia’s relatively low expenditure on education
GDP Per capita
Country Government Spending on Education as a % of GDP
(US$)
2000 2005 2010 2013 2018
Singapore 3.3 3.2 3.1 2.9 64,582
Japan 3.5 3.4 3.6 3.7 39,290
Rep. of Korea 4.3 3.9 4.9 4.6 31,363
China 2.8 3.6 3.9 9,771
Vietnam 5.1 5.7 2,567
Thailand 5.3 3.9 3.5 4.1 7,274
Malaysia 6.0 5.0 5.5 11,373
Indonesia 2.9 2.8 3.4 3,894
Philippines 3.3 2.4 2.2 2.6 2,730
Mongolia 5.6 4.6 4.9 4,122
PNG 3.3 2.4 4.8 3,103
Lao PDR 1.5 2.4 1.7 3.2 2,542
Timor-Leste 2.4 1.4 2,036
Myanmar 0.7 2.0 1,326
Cambodia 1.7 1.5 2.1 1,510
Source: World Bank (2018a).
This learning gap is particularly salient in light of the increased automation and sophistication of
production technology, which has raised the importance of skills quality for firms, particularly high-
skilled labor. The labor force’s quality of skills, particularly that of high-skilled professionals and managers,
is a key concern. The share of firms in Indonesia that report adequacy of skills as the top constraint when
hiring managers and professionals is the highest in the region (Figure 3; Gomez-Mera and Hollweg [2018]
based on WBES data). On the other hand, firms searching for unskilled production workers appear to
complain less than their regional comparators about the inadequacy of available skills. This is consistent
with a recent joint GoI–World Bank (2018a) assessment, which highlights critical shortages of skills in
dozens of managerial and professional positions (GoI and World Bank, 2018a). These skills constraints
matter for productivity. Firms reporting difficulties in hiring managers and high-level employees experience
50 percent lower employment growth, while difficulties in finding employees with foreign languages,
or technical, leadership and management skills are correlated with weaker firm performance and lower
productivity among Indonesian firms (Gomez Mera and Hollweg, 2018). And poor management quality is
typically associated with low innovation (Cirera and Maloney, 2017), which may help explain the low share
of firms generating product or process innovation in Indonesia. Despite these skills shortages, the share
of Indonesian firms that employ on-the-job training is one of the lowest among middle-income countries
(Gomez Mera and Hollweg, 2018).
EDTECH IN INDONESIA - READY FOR TAKE-OFF? 11INTRODUCTION
Figure 3: Lack of the right skills bites, particularly for managers
Share of firms that cited inadequate skills as the key barrier in trying to hire each type of worker, percentage
80
70
60
50
40
30
20
10
0
Managers Unskilled prodution worker
Indonesia Thailand Malaysia Philippines
Source: Gomez-Mera and Hollweg (2018) based on WBES data.
The World Development Report 2016 noted that, while digital technologies have spread rapidly, digital
dividends—the broader development benefits from using these technologies—have lagged behind
and are unevenly distributed (World Bank, 2016). This is especially true in education—and particularly
in Indonesia. While technology in general, and EdTech in particular, can be a part of addressing the major
inequalities in learning outcomes for Indonesian students, it is unlikely to be able to fill the gap on its own.
Access to technology does not guarantee its use, which in turn does not guarantee learning, unless the
technology is effective in increasing student learning outcomes.
The use of information, communications and technology (ICT) for education (EdTech) provision
holds considerable promise in improving educational outcomes and is driven largely by the private
sector. The rapid digitization of key services is expanding the opportunities to use ICT to aid the learning
of students; for example, Coursera (United States) provides an online platform for acquiring bachelor’s or
master’s degrees online; Byju’s (India) provides an e-learning platform for primary to high school students
and coaching classes for competitive examinations through a mobile application; and VIPKid (China)
connects learners with English-speaking tutors from the United States and Canada. Alongside the success
of such platforms globally, Indonesia’s startup ecosystem has witnessed growth of similar platforms, such
as Harukaedu (a platform offering online university degrees), Ruangguru (an interactive e-learning platform
for K-12 students in Indonesia) and Cakap by Squline (a tutoring platform language learning). Indeed, an
examination of the nexus between education and technology is critical, especially as evidence suggests that
digitization is closely correlated with increased labor productivity (Figure 4). The private sector is uniquely
placed in mainstreaming the use of ICT products and services in the education sector due to two factors.
First, its incentives to introduce new solutions to existing problems are typically greater than those in the
public sector if such solutions hold commercial potential. Second, such ICT products are often commercially
viable, as much of the returns to their use are private (the individual benefiting from improved learning
12 EDTECH IN INDONESIA - READY FOR TAKE-OFF?outcomes). In certain instances, the public sector may also be willing to pay for such products to the extent
that the improvement in learning outcomes can be demonstrated and applies across a broad range of
students.
This paper maps out the Indonesian ICT for education (ICT4E) landscape, focusing on commercial EdTech
startups. It provides an overview of some of the main players, the main products/services, and some of
the main challenges faced by EdTech firms and users. For the purposes of this report, we define EdTech as
software designed to enhance teacher-facilitated learning in classrooms, or to improve students’ education
outcomes, as well as software or hardware products designed specifically for schools and education systems.
Under this conception, a projector for showing images in a classroom or other such generic hardware
devices are not considered EdTech, but an adaptive student assessment that children take online, as well as
school budgeting software, are considered a part of EdTech.
Figure 4: Indonesia lags behinds peers on digitization and labor productivity
Labor productivity
PPP, USD per worker
110,000
Asia and rest of world pioneers
100,000 United States
90,000 Hong Kong
80,000 Canada
France Australia United Kingdom
Span
70,000 Italy
Germany Singapore
Japan
60,000
Korea
50,000
Asia and rest of world peers
40,000 Malaysia
Russian
30,000
Brazil
20,000 Thailand China
Philippines Indonesia
10,000
India
0
0 0.1 0.2 0.3 0.4 0.5 0.6 0.7 0.8 0.9 1.0
Relative score, rank
Asian peers Asian pioneers Rest of world peers Rest of world pioneers
Source: McKinsey (2016).
Note: Relative score refers to the level of digitization ranked against the group of countries in the figure.
EDTECH IN INDONESIA - READY FOR TAKE-OFF? 1314 EDTECH IN INDONESIA - READY FOR TAKE-OFF?
02

METHODOLOGY

              EDTECH IN INDONESIA - READY FOR TAKE-OFF?   15
METHODOLOGY
We drew upon three main sources of information, namely publicly available data, information collected
via an online questionnaire sent to 60 EdTech players (Appendix B), and 18 structured, in-depth face-
to-face interviews (F2F), as well as a consultation on preliminary findings and recommendations. Our
interviews and data collected via surveys suggest that these 60 players represent the vast majority of
the EdTech sector in Indonesia.2 Out of the 60 online questionnaires sent to EdTech players, we received
29 valid responses. Of the 18 F2F interviews, six interviewees did not fill out the survey. Therefore, this
report draws on a total of 35 unique EdTech respondents3 (Appendix A) from surveys and interviews. F2F
interviews helped with gathering more qualitative information about the EdTech sector in general, the
challenges faced by the EdTech players and other relevant information about firms’ growth trajectories. The
interviews were followed up with a detailed online questionnaire to gather more quantitative information
about the scale of the firms and to obtain inputs to the questions that could not be covered during face-to-
face interviews. In addition to the EdTech firms, eight investors (individuals and institutions) were surveyed
and two in-depth face-to-face interviews were also conducted. Finally, we also conducted a face-to-face
interview with one of the chairmen of the Indonesian EdTech Association (INETA) to understand the various
challenges faced by EdTech firms in Indonesia.
A mix of different types of investors, including a family office, VC firms and social impact investment
funds,4 were surveyed.5 Two F2F interviews were also conducted. The survey responses contain a mix of
Indonesia-based and regional investors based in Singapore. Five of the eight respondents have invested in
at least one EdTech firm in Indonesia. The surveys and interviews were limited to EdTech firms (and investors)
and we leave it for another study to expand the scope to EdTech users.
2 According to an online analytics portal (https://tracxn.com), there are about 115 EdTech startups in Indonesia. There were
significant difficulties in obtaining data via open sources: a total of 71 EdTech companies were identified and only 60 EdTech
players could be reached. The operational status of the ones that could not be reached out remains questionable. Although these
data cover the majority, there still might be smaller players that could not be identified from primary or secondary sources. We
note the data was collected from December 2018 through February 2019, and so may miss some more recent entrants.
3 The remaining 25 companies were not analyzed in detail as they failed to respond to the survey and there were not enough data
available from other sources.
4 Impact investments are investments made with the intention to generate positive, measurable social and environmental impact
alongside a financial return. Impact investments can be made in both emerging and developed markets, and target a range of
returns from below market to market rate, depending on investors’ strategic goals (GIIN, 2019).
5 A total of eight responses were received.
16 EDTECH IN INDONESIA - READY FOR TAKE-OFF?03 THE GLOBAL EDTECH SECTOR CONTEXT
THE GLOBAL EDTECH SECTOR CONTEXT

     Global private investment in EdTech companies has grown significantly over the past three years
     (Figure 5). The value of investment deals6 soared to more than US$9 billion in 2017, compared with less
     than US$3 billion in 2014. The value in 2017 is higher than the cumulative value of investment in EdTech
     companies since 1997, estimated at about US$38 billion (Adkins, 2018).

     Figure 5: Global investment in EdTech companies has skyrocketed in recent years
         Deal Totals in
         US$ Millions
          $10.000
           $9.500                                                                                $9 Billion Threshold
           $9.000
           $8.500
                                                                                           $8 Billion Threshold
           $8.000
           $7.500
                                                                                   $7 Billion Threshold
           $7.000
           $6.500                                                             $6 Billion Threshold
           $6.000
           $5.500
                                                                        $5 Billion Threshold
           $5.000
           $4.500
                                                                  $4 Billion Threshold
           $4.000
           $3.500
                                                           $3 Billion Threshold
           $3.000
           $2.500
           $2.000                                  $2 Billion Threshold
           $1.500
                                           $1 Billion Threshold
           $1.000
            $500
               $0
                     1997 1998 1999 2000 2001 2002 2003 2004 2005 2006 2007 2008 2009 2010 2011 2012 2013 2014 2015 2016 2017
     Source: Adkins (2018).

     The vast majority of investment has flowed into three countries: (i) the United States, (ii) China, and (iii)
     India (Adkins, 2018). In terms of categories, investment has tended to flow into EdTech companies that
     directly target consumer-facing and corporate-facing EdTech companies. These are companies that directly
     target individual consumers (e.g., self-paced e-learning products) and those that directly target corporate
     consumers (e.g., EdTech products that are designed for internal employee trainings) (Figure 6). Investment
     in EdTech firms that target academic institutions (in primary and secondary schools and tertiary education)
     was significantly lower than the aforementioned categories.

     6    Investment deals include any institutional (such as venture capitalists (VC) or non-institutional (such as angel investment) private
          sector investment into the startups.

18   EDTECH IN INDONESIA - READY FOR TAKE-OFF?
Figure 6: Consumer companies and corporates attracted the most investment
Pre K-12
13%
Higher
education
7%
Consumer
41%
Corporate
39%
Source: Adkins (2018).
Box 1: EdTech is a large market globally, but what do these investments actually buy in
terms of learning?
Spending on EdTech in Indonesia is expected to increase dramatically, in line with the sector’s development in other
countries. How the sector grows will be dependent on consumer demand and preferences, as well as the actions
of government and the private sector. Whether Indonesia ends up with an EdTech sector focused on improving
student learning for all, or only for those with connectivity and the ability to pay, will depend on choices made
in the coming years. Not all EdTech investments will necessarily improve student learning. A recent review by the
J-PAL of 126 experimental evaluations (February 2019) found that:
i. Initiatives that expand access to computers and Internet alone generally do not improve kindergarten to grade
12 students’ grades and test scores, but do increase computer usage and improve computer proficiency.
ii. Educational software designed to help students develop particular skills at their own rate of progress have
shown enormous promise in improving learning outcomes, particularly in math.
iii. Technology-based nudges that encourage specific, one-time actions—such as text message reminders to
complete college course registrations—can have meaningful, albeit modest, impacts on a variety of education-
related outcomes, often at low costs.
iv. Combining online and in-person instruction can work, as well as traditional in-person-only classes, which
suggests blended learning may be a cost-effective approach for delivering instruction. Students studying
through online-only courses, however, tend to perform worse than students in in-person-only courses.
v. Many novel applications of technology to education, such as the use of interactive whiteboards or virtual reality,
attract wide interest from school administrators but have not yet been rigorously evaluated for their efficacy.
Source: https://www.povertyactionlab.org/sites/default/files/documents/education-technology-evidence-review.pdf
A BRIEF OVERVIEW OF THE 4.
EDTECH IN INDONESIA - READY FOR TAKE-OFF? 19THE GLOBAL EDTECH SECTOR CONTEXT 20 EDTECH IN INDONESIA - READY FOR TAKE-OFF?
04

A BRIEF OVERVIEW OF THE
GOVERNANCE OF INDONESIA’S
EDUCATION SYSTEM

               EDTECH IN INDONESIA - READY FOR TAKE-OFF?   21
A BRIEF OVERVIEW OF THE GOVERNANCE OF INDONESIA’S EDUCATION SYSTEM
As part of the fiscal decentralization process introduced in the early 2000s, education sector
management shifted from the central to the subnational level (Rosser, 2018; World Bank, 2018a). The
Ministry of Education and Culture (MoEC) has retained responsibility for overseeing public and private pre-
tertiary education institutions, along with the Ministry of Religious Affairs (MoRA), while responsibility and
financing for actual service delivery have shifted to the subnational level.
Despite committing 20 percent of budget resources to education, Indonesia still underspends as a
percentage of GDP compared with regional peers such as Malaysia, Thailand, Vietnam and Mongolia
(Figure 7). Spending on IT in the education sector is also low compared with other sectors, as well as peer
countries (Figure 8). One undesirable outcome of this low level of spending has been an expansion of low-
quality vocational and tertiary institutions that have cropped up to absorb the demand for education that
is not being met by the GoI (Rosser, 2018). On the other hand, the gap in the supply of education has also
seen a nascent EdTech sector develop over the past 10 years. According to our survey, around 80 percent of
all EdTech firms have come into existence since 2013.7 Growth of the EdTech sector follows the pattern seen
across the startup ecosystem in Indonesia and growth of startup assistance organizations (SAO) since 2013
(Bhardwaj and Ruslim, 2018). Similar to many governments around the world, the GoI has acknowledged
the importance of incorporating ICT in its education system. As such, in 2006 the National ICT Council
was formed, the role of which was to advance e-education (Butcher and Bodrogini, 2016). However, the
verbal commitment to incorporating digital technology into the education system has not translated into
effective financial commitments. Spending on ICT even within the education sector is significantly lower
than spending on ICT in other sectors (Figure 8).
Figure 7: Government expenditure on education
Percent of GDP
10
9
Mongolia
8
7 Indonesia
6 Vietnam
5 Thailand
4 Malaysia
3 Philippines
2
Cambodia
1
0 Lao PDR
2000
2001
2002
2003
2004
2005
2006
2007
2008
2009
2010
2011
2012
2013
2014
2015
2016
2017
1997
1998
1999
Source: World Development Indicators, World Bank (2020).
7 Globally, the EdTech sector saw a boom in the number of EdTech companies being formed from 2010 to 2013. However, the EdTech
investment space has only seen consistent and strong growth since 2013 (Wan and McNally, 2015). Indonesia’s EdTech sector
growth seems to follow the patterns seen in the EdTech funding space globally. Although, Indonesia’s startup ecosystem is lagging
behind the global pattern by 2-3 years but it has caught up to the global frontier at a much faster rate (Google TEMASEK, 2018).
22 EDTECH IN INDONESIA - READY FOR TAKE-OFF?Figure 8: Spending on IT lags other sectors and peer countries
Indonesia
Sector contributon in Indonesia, Peer countries
IT spend per GDP,2 % Bottom Top Developed countries
USD billion, 2015
0 5 10 15 20 25 30 35 40 45 50 55 60
Industrials
436 Hong
n Kong
g
Indonessia
Wholesale United
d Statess
117 Indonesia
and retail
Government 48 Indonesiaa United
n Ki
Kingdom
m
Transportation 37 Russia United K
U Kingdom
o
Business
35 Russia Malaysia
a
services
Financial 31 Chiina United
t Kingdom
g
services
United
e Kingdom
g
Media and
23 Indo
onesia
communication
Healthcare 10 Russia Malaysia
s
Education 7 Russia Malaysia
a
Utilities 6 China United K
Kingdom
m
1 Major sectors. 2 Philippines data is not available. 3 Including agriculture, mining, manufacturing, and construction. Agriculture IT spend
is not available. 4 IT-related activities and orther business activities. 5 Banking, securities, and insurance.
Source: McKinsey (2016).
The MoEC, the MoRTHE and the MoRA have governance responsibility to provide oversight to the
EdTech sector. The MoEC was given implementation responsibility of the National ICT Council’s flagship
project focusing on ICT in education in 2006 (Butcher and Bodrogini, 2016). Within the MoEC, management
duties for ICT for the education agenda are primarily with the Center for Information and Communication
Technology for Education (Pusat Teknologi Informasi dan Komunikasi untuk Pendidikan, Pustekkom).
Pustekkom was given five key duties as part of its central mandate (Butcher and Bodrogini, 2016).8 Analyzing
these activities (see Box 2), Pustekkom’s original mandate was to develop content via various mediums,
8 The Pustekkom budget in 2018 was Rp 197,753,183,000 as per the Ministry of Finance’s (MoF) budget document (RKKL DIPA
Kemdikbud, 2018) for the MoEC. This allocation covers multiple areas, e.g., enhancing school connectivity, development of digital
learning resources, improvement of educators’ ICT skills, and improvement of ICT use for teaching and learning.
EDTECH IN INDONESIA - READY FOR TAKE-OFF? 23including radio, television and computer-based multimedia (Butcher and Bodrogini, 2016). It appears to
have faced challenges in adapting to the new mandate of incorporating ICT into education, given that it
previously had a content development role. These areas of responsibility overlap closely with the product
and service offerings of EdTech firms.9
Box 2: Pustekkom’s five main areas of responsibility
• The provision of ICT infrastructure and facilities and ICT-based learning content for the strengthening and
expansion of e-learning at all levels of education.
• Development of e-management, e-reporting, and e-services to enhance the effectiveness of governance and
public service.
• Development of knowledge management systems to facilitate the sharing of information and knowledge
among learners and educators.
• Development of ICT-based learning resource centers in elementary and secondary education.
• Increasing human resource capacity to support the efficient use of ICT at the central and local levels.
Source: Adapted from Butcher and Bodrogini (2016).
9 See discussion later in this report about the main products and services offered by EdTech firms.
24 EDTECH IN INDONESIA - READY FOR TAKE-OFF?05
INDONESIA’S PRIVATE EDTECH
SECTOR LANDSCAPE
EDTECH IN INDONESIA - READY FOR TAKE-OFF? 25INDONESIA’S PRIVATE EDTECH SECTOR LANDSCAPE
Growth of the Indonesian EdTech sector follows a similar trajectory to that seen in the global EdTech
investment sphere. The majority of EdTech firms were founded in the past six years (Figure 9). The rapid
increase in firm establishment also coincides with a steep trajectory in the internet penetration rate in
Indonesia. The survey data also reveal that the median number of years of operation is around four years
and the number of years a firm has been operational does appear to have a mildly positive correlation10 with
profitability. The firms that indicated they were profitable had been operating for around five years. This
makes intuitive sense, since our survey has ‘survivor bias’ (we did not include firms that failed and went out
of business), and because capital for EdTech startups is scarce in the Indonesian context, so firms that are
not profitable are not likely to be able to sustain themselves for long.
Figure 9: The private Indonesian EdTech sector has sprung to life over the past six years
16 45
14 40
35
12
30
10
25
8
20
6
15
4
10
2 5
0 0
1986 2001 2002 2003 2004 2005 2006 2007 2008 2009 2010 20112012 2013 2014 2015 2016 2017 2018
Internet penetration ratio (%) (RHS)
Source: World Bank staff calculations from survey, interviews and desktop research, World Development Indicators (World Bank, 2018b).
5.1 Key product and service offerings
EdTech firms in Indonesia offer a wide variety of products and services, targeting different users,
including parents, educators, students, educational institutions’ managements and corporations.
These exist and may overlap with free products produced by the MoEC, for example, as well as open
education resources (OER) provided by Universitas Terbuka, among others. For the most part, Indonesian
EdTech products aim to help students with learning and upskilling, educators with student management,
communication and teaching and educational institutions with administration (Figure 10). For example,
companies such as Ruangguru, Zenius and Quipper develop and provide self e-learning content, interactive
learning platforms and study tools that help K-12 students expedite the learning process, along with
interactive online services that help students with their assignments and test preparation. Companies
such as Arsa Kids, Digikids and Educa Studio develop game-based and blended learning experiences,
10 Correlation coefficient of 0.38.
26 EDTECH IN INDONESIA - READY FOR TAKE-OFF?including interactive storybooks and educational mobile apps, to help improve early childhood educators’
effectiveness. Appendix C provides more details on the type of products and services offered by the main
Indonesian EdTech companies. These products and services are typically disseminated using several
approaches, such as web-based and mobile-based applications. The heterogeneity in Indonesia’s EdTech
sector is potentially indicative of the breadth of the gaps in Indonesia’s education system. On the upside, it
also points to the number of opportunities available for the private sector to contribute to bridging those
gaps.
Figure 10: Indonesia’s EdTech sector landscape11 offers a wide range of products
and services
Source: Surveys, interviews and desktop research.
Most Indonesian EdTech firms offer more than one product or service, so that they can offer more
comprehensive support to their target groups (Figure 11). Many of the EdTech firms surveyed offered
administration and management products targeted for educators or institutions, such as learning
management systems (LMS) (30 percent), online learning courses (27 percent), and career development or
vocational online learning (25 percent). The survey results reveal that product offerings can be categorized
into two broad groups: those aimed at students and those aimed at education providers. The products and
services offered to education providers were clustered around administration and management-related
offerings. The products and services offered to students tended to be for online learning, test preparation,
upskilling and career development/planning style support. While over 40 percent of companies do not
11 In total, the 60 identified EdTech firms offer 28 different types of products and services (Figure 11), which were bucketed into 16
categories based on their core functionalities (Figure 10).
EDTECH IN INDONESIA - READY FOR TAKE-OFF? 27INDONESIA’S PRIVATE EDTECH SECTOR LANDSCAPE
emphasize one type of content over another, they tend to focus more on technology-related skills such as
programming and coding, rather than on traditional subjects such as social sciences, science and languages
(Figure 12). This is interesting, as it once again points to the fact that gaps in the education system are not
concentrated in one particular subject space.
Figure 11: Diversity in product and services offered by the EdTech companies in Indonesia
Distribution of firms by products offering (percent of survey respondents)
Education Events Marketplace
Learning application for special needs
School and Course Directory
School Communication
Technology Adoption Consultancy
Fee Management and Online Payment
Online Program Management (OPM)
Education hardware
Enrollment and Admissions
Language Learning
Student Loans and Finance
Digital Books / Interactive Content
Online Test Preparation
Learning Analytics
Classroom Tools
Career planning or counseling
Online Learning (K-12)
Edugames
Online to Offline
Early Childhood Education
Online Tutoring
Career Development or Vocational Online Learning
School administration and management
Technology learning
Student Information System (SIS)
Broad Online Learning (Moocs)
Social/Collaborative Learning Platform
Learning Management System (LMS)
0 5 10 15 20 25 30 35
Source: Survey and World Bank staff calculations.
Note: Survey respondents were given the opportunity to select more than one option, hence percentages sum to more than 100.
EdTech firms do not appear to be targeting critical gaps in mathematics, science and reading. Less
than 15 percent of the surveyed firms offered specific content focus on mathematics, science and reading.
Indonesia performs poorly across these three categories (which are the three categories that the PISA
international tests focus on). Indonesia ranks 70 out of 78 countries on PISA in science, 71 for mathematics
and 72 for reading. These three subjects (with ‘language literacy’ being used as a proxy for reading) are
not ranked highly in terms of exclusive content focus of EdTech firms. For example, in terms of exclusive
subject offering, mathematics was offered by 13 percent of companies, science was offered by 15 percent,
and reading was offered by 12 percent. It also indicates that the majority of EdTech firms in Indonesia are
targeting a breadth of product and service offerings rather than offering fewer products and services with
greater depth. If only core products and services offerings are considered, then the EdTech sector can be
decomposed into 16 main product categories (Figure 11).
28 EDTECH IN INDONESIA - READY FOR TAKE-OFF?Figure 12: Almost half Indonesian EdTech firms cover multiple topics
Distribution of firms by topics (percent of survey respondents)
Multiple topics
Technology and Engineering
Vocational skills
Career development and Life skills
Science
Maths
Language Literacy
Other
Social Sciences
0% 10% 20% 30% 40% 50%
Source: Surveys and interviews.
Figure 13: Delivery mode of the different products offered by EdTech firms
Other (including hardware,
third party applications etc)
Android mobile application
IOS mobile application
Web application or accessible
from a browser
10% 20% 30% 40% 50% 60% 70% 80% 90% 100%
The majority (Figure 13) of the EdTech firms offer product and service offerings that are accessible via a
simple web browser. Mobile-based EdTech applications are a rising trend among EdTech firms but because
of the lack of IOS and Android engineers in the market, creating and maintaining a mobile application is
cost intensive.
Unsurprisingly, the Jakarta market has the highest penetration by EdTech firms (Figure 14). The vast majority
of EdTech firm products focus on markets on the island of Java—Indonesia’s most populous island. Smaller
populations (and thus smaller markets), as well as lower incomes and poor digital infrastructure deter
EDTECH IN INDONESIA - READY FOR TAKE-OFF? 29INDONESIA’S PRIVATE EDTECH SECTOR LANDSCAPE
EdTech firms from disbursing their products into other locations. This means that Indonesia’s EdTech market
is currently inequitable, a situation that is likely to persist and possibly worsen in the absence of concerted
action.
Figure 14: EdTech market coverage is concentrated in the Jakarta region
Distribution of firms by geographic penetration of their products (percent of survey respondents)
60%
50%
40%
30%
20%
10%
Nusa Tenggara Barat
D.K.I. Jakarta
All of Indonesia
Jawa Barat
Jawa Tengah
Jawa Timur
Sumatera Barat
D.I. Yogyakarta
Sumatera Selatan
Sumatera Utara
Sulawesi Utara
Sulawesi Selatan
Sulawesi Tengah
Kalimantan Timur
Sulawesi Barat
Kalimantan Barat
Nusa Tenggara Timur
Kalimantan Tengah
Kalimantan Utara
Bali
Banten
Lampung
Riau
Papua
Jambi
Maluku
Overseas
Other
D.I. Aceh
Gorontalo
Bengkulu
Source: Surveys and interviews.
Note: Respondents were allowed to pick more than one response.
5.2 Target market
Products and services offered in the EdTech sector typically target junior high schools, senior high
schools, higher education institutions and professionals (Figures 15 and 16), with few or no products
in the primary or pre-primary sectors, or technical/vocational education. The reason for targeting higher
levels of education is that the barriers to getting through to consumers are slightly lower than trying to
target more junior students. For example, for high school students, the interviews conducted for this study
revealed that high school teachers cared about learning outcomes (more so than primary school teachers)
and therefore many firms’ marketing strategies focused on persuading these teachers to purchase products
and services. In the case of senior high school students, the targeting strategy was based on the assumption
that these students cared about obtaining good grades in university entrance exams. In fact, more than 80
percent of (student) consumers were actually students in grades 11 and 12, and students preparing for university
and college entrance exams (often referred to as grade 13). This parallels the markets in other countries, for
example China, where the college entrance exam (Gaokao) is seen as a major driver of the EdTech sector.
Many Indonesian EdTech firms also offer administration and learning management systems for education
providers or educators. These typically fall into three main categories: school administrators, university
management and corporates. In terms of how widespread these products are, the 35 EdTech startups
30 EDTECH IN INDONESIA - READY FOR TAKE-OFF?studied in depth currently support more than 2,160 educational institutions and serve more than 9.7 million
students/individual users across Indonesia.
While product/service offerings are quite heterogeneous, most EdTech firms directly target students
as end-users. Almost 90 percent of EdTech firms targeted their products and services to students and
around 85 percent had more than one target (Figure 15). Interestingly, less than one-third of the survey
respondents indicated that they targeted12 parents. Parents play a significant role in dissemination of
EdTech products, especially for primary school and junior high school students. Furthermore, many school
administration and student finance products may be linked to parents as decision-makers, as they may be
expected to support the school to cover the costs of new products. Given that a significant proportion of
EdTech users are school-aged students, this lack of targeting of parents was an interesting result. It could
explain one of the reasons why many EdTech firms were finding it difficult to generate profits,13 and to even
persuade users to move to paying for products and services.
Within formal education institutions (such as schools, universities and training institutes) EdTech firms
typically targeted senior students, especially those in their final years of schooling (grades 10 to 12) and those
in university (Figure 16). One striking outcome was that only a single EdTech firm targeted public education
providers (schools or universities) exclusively. In contrast, around one in four EdTech firms exclusively targeted
private sector education providers.14 The majority (about 60 percent) targeted both public and private sector
institutions. Given that two-thirds of survey respondents were generating revenues but not profits, it is not
surprising that, on average, only 49 percent of EdTech users were paying for the products and services they
were consuming (Figure 17). The survey data also suggest that the number of free users tends to decrease
as the startup matures. Many EdTech firms in Indonesia have adopted a “freemium” pricing15 model as a
means of attracting more users by providing a teaser for users to first try the product. This has served as an
efficient method to attract new users but has been detrimental to the financial health of the EdTech firms,
as less than 3 percent16 of those using the free versions of the products actually ended up upgrading to the
paid versions. The business models in the EdTech sector (e.g., freemium, subscription, ad-based, purchase,
educational licenses) are expected to continue to evolve as EdTech companies explore different pricing
strategies to attract and retain more users, and to achieve financial sustainability.
12 The term ‘target’ used to indicate the group on whom firm marketing strategies were focused on.
13 Further details later in the report.
14 Many interviewees indicated that targeting private sector educational institutions is a better dissemination strategy because
private schools have higher capacity and are more willing to pay for products compared with public sector schools.
15 Freemium pricing is the strategy where a company offers basic services for free and charges a fee for enhanced features or content.
16 Authors’ own estimation derived from interview and survey data.
EDTECH IN INDONESIA - READY FOR TAKE-OFF? 31INDONESIA’S PRIVATE EDTECH SECTOR LANDSCAPE
Figure 15: EdTech firms targeted several Figure 16: EdTech firms tend to target
user groups older students
Percent of survey respondents Percent of survey respondents
Students Senior High School
(grade 10-12):
Teachers/Trainers/Lecturers Tertiary Education
(College or University):
Corporates
Vocational Education:
School administrators Junior High School
Other educational institutions (grade 7-9):
(e.g. training institutions, Primary Education
vocational schools,etc) (grade 1-6)
University Management Others (please specify and
Parents provide percentage):
Pre-school
Other (Kindergarten and below)
01 02 03 0
0 20 40 60 80 100
Source: Survey and World Bank staff calculations.
Note: Survey respondents were given the opportunity to select more than one option.
Figure 17: Only 49 percent of EdTech users paid full fees for the products17
Paid Users: Free Users: Discounted/Subsidized Users:
8%
49%
43%
Source: Survey and F2F interviews.
The majority of EdTech firms engaged with the government at multiple stages of their operations.
Almost half of those firms that did engage with the government did so at the ideation or product
development stage (Figure 18). A similar proportion of EdTech firms indicated that their involvement with
the government was more from a customer and partnership perspective. Acquiring government licenses
was another channel through which some EdTech firms engaged with the government.
17 The survey respondents were asked to provide percentage distribution of their paid, subsidized/discounted and fee users.
The question that was asked was: What percentage (approximate) of your current customer base would be considered the
following:(The sum of all entries should be 100). Then, the aggregate sum of each categorical distribution was divided against the
total sum (100 x number of responses) to get the percentage.
32 EDTECH IN INDONESIA - READY FOR TAKE-OFF?You can also read