Cardiff Capital Region Employment & Skills Plan 2017 - www.lskip.wales
←
→
Page content transcription
If your browser does not render page correctly, please read the page content below

Cardiff Capital Region
Employment & Skills Plan 2017

         www.lskip.wales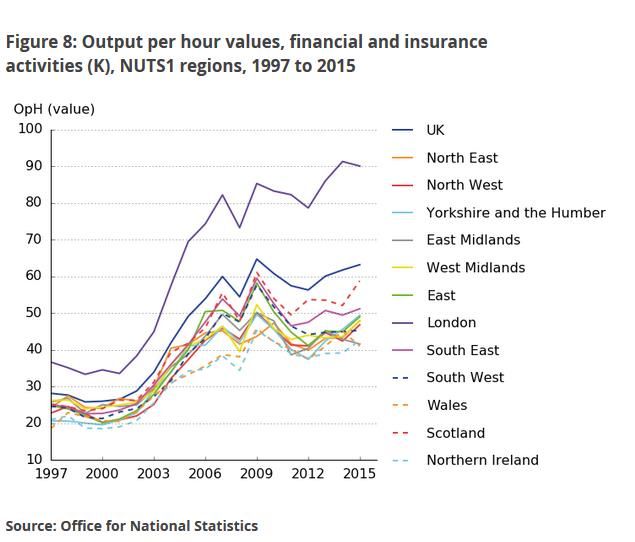
Contents
Foreword................................................................................................................................................. 1
Executive Summary................................................................................................................................. 3
       Our Region ...................................................................................................................................... 3
       Key Challenges ................................................................................................................................ 3
       Regional Priorities for Employment and Skills ................................................................................ 4
Introduction and methodology ............................................................................................................... 7
Section 1 - Regional Overview ................................................................................................................ 9
   Investment .......................................................................................................................................... 9
       Cardiff Capital Region City Deal ...................................................................................................... 9
       Major Investment Demands ......................................................................................................... 10
       Local Authority Capital Programme .............................................................................................. 11
       Rail including the Metro................................................................................................................ 11
       Social Housing and 21st Century Schools and Education Programme .......................................... 12
       Valleys Taskforce........................................................................................................................... 12
       Cardiff-Newport Tidal Lagoon ....................................................................................................... 12
       Superfast Cymru - ICT/Digital........................................................................................................ 12
       Enterprise Zones ........................................................................................................................... 12
   Regional Economic Profile ................................................................................................................ 14
   Labour demand including Growth and Replacement jobs ............................................................... 17
   Labour Supply ................................................................................................................................... 19
       Skills Gaps and Shortages.............................................................................................................. 19
       Qualifications levels ...................................................................................................................... 21
       Apprenticeships ............................................................................................................................ 22
       Careers Mismatch ......................................................................................................................... 23
       Learner outcomes ......................................................................................................................... 24
       Higher Education Destination Data and Retention of Welsh Domiciled Students ....................... 24
       Unemployment and Economic Inactivity ...................................................................................... 25
       Brexit and European Union Funding ............................................................................................. 26
       European Union Funding .............................................................................................................. 27
   Priority Sectors for Employment and Skills Investment ................................................................... 30
Section 2: Priority Sector Analysis......................................................................................................... 32
   Advanced Materials and Manufacturing .......................................................................................... 33
   Construction...................................................................................................................................... 41
   Financial and Professional Services .................................................................................................. 51
   ICT/Digital.......................................................................................................................................... 59
   Human Foundational Economy – Health, Social Care and Education .............................................. 68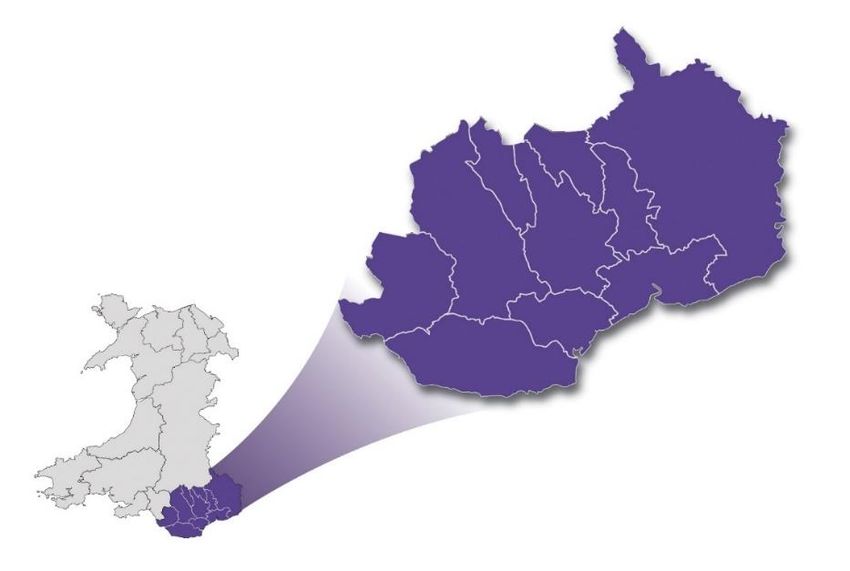
List of Figures

Figure 1 Cardiff Capital Region Workplace employment by Broad Industry 2015 ............................... 15
Figure 2 LSkIP Priority Sectors by Establishment number in Local Authorities .................................... 31
Figure 3 Wales GVA compared to UK by Advanced Materials and Manufacturing Sub-sector 2014 .. 33
Figure 4 Output per hour Values 1997-2015 ........................................................................................ 51
Figure 5 Education Workforce Council Registered Teachers Subject Taught -v- Subject Trained ....... 75
Figure 6 Core Education Subjects ......................................................................................................... 75

List of Tables

Table 1 South East Wales Local Authority - Capital Programme 2016/17-2019 .................................. 11
Table 2 Gross Value Added by Measure, Welsh Economic Region and Year ....................................... 14
Table 3 Company Size Workforce and Value (November 2016) ........................................................... 16
Table 4 Total Projected Employment Demand by Expansion and Replacement Jobs in the Cardiff
Capital Region 2014-24 ......................................................................................................................... 17
Table 5 Density of Skill Shortage Vacancies by Occupation and Region .............................................. 19
Table 6 Incidence and Density of Skills Gaps by Region ....................................................................... 20
Table 7 Unemployment Levels.............................................................................................................. 25
Table 8 Not in Education, Employment or Training .............................................................................. 26
Table 9 Cardiff Capital Region by Priority Sector – GVA ....................................................................... 30
Table 10 Cardiff Capital Region by Priority Sector – Skills Shortage Vacancies .................................... 30
Table 11 NESA – Nuclear Energy Skills Alliance .................................................................................... 37
Table 12 Apprenticeships by Age and Level across Construction ......................................................... 48
Table 13 ICT/Digital Sector Skills ........................................................................................................... 61
Table 14 Health Service Workforce in Wales ........................................................................................ 68
Table 15 Higher Education Academic/Support Staff Ratios.................................................................. 68
Table 16 LSkIP Priority Sector Higher Education Figures ......................... Error! Bookmark not defined.

                                                                                                                                 Page 1 of 81
FOREWORD
A key driver for the Employment and Skills Board of the Learning, Skills and Innovation Partnership
(LSKIP) is to be responsive and create change driven by stakeholder engagement. Identifying
employment and skills priorities over short, medium and longer term periods that align with economic
drivers and indicators to support the South East Wales regional economy.
Developing the right skills is fundamental to increasing productivity and efficiency. It provides more
opportunities for all ages, genders and abilities, helping to address social and physical exclusion by
improving access to employment.
We need to accept that no one person or organisation can solve the employability and skills demands
of the region and there is a need for us to break down the ‘silos of self-interest’ to deliver a strong
baseline of education, training and skills for businesses to grow, confident that their workforce is
equipped with the right skills to meet and respond to their sector needs.
There is a need to create economic partnerships, by continuing to build on growing relationships
between industry, education providers and Welsh Government, to develop future skills that will
ensure the South East Wales economy thrives and grows. Aligning delivery with the aspirations of the
Cardiff Capital Region City Deal, Enterprise Zones, Valleys Taskforce, Welsh Government, local
authorities, educators, the business community, the existing workforce and those about to enter it.
Central to the development of this cohesive Employment and Skills Plan for 2017 has been the
recognition that skills and economic growth are intrinsically linked and LSkIP has over the last twelve
months further established itself to respond to this.
To address the need to fully understand the changing economic landscape, we have over the last year
enhanced our evidence base through research and increased our employer and stakeholder
engagement. We have established sector cluster groups, each led by industry and connecting with
representatives from the supply side. Cluster groups have identified strengths, weaknesses,
opportunities and threats impacting their sectors, before agreeing a number of key priorities and
recommendations.
During our extensive employer engagement and particularly across the five cluster groups, LSkIP has
identified that there are a number of common themes emerging; employability and soft skills,
engagement between schools and industry and digital competency. Throughout the Employment
and Skills Plan we recognise that the world of work is evolving and changing at a demanding pace
through digital developments across all sectors, creating increased demand for higher level skills in
the workforce to meet these changing environments.
Business manages itself through the two Ps, Process and People, and with people being recognised as
the greatest asset of any business organisation, it is therefore critical that we provide the right
employability and skills provision to maximise the potential of the regional economy and its growth
aspirations. As businesses we have a key role in working in partnership with LSklP and through our
sector groups to further inform business trends, and identify value chain opportunities and skills
requirements to meet these opportunities.
I urge businesses of all sizes to take a leading role and get involved with LSkIP and support the sector
groups. Your input and value will help shape a skills investment strategy that meets your needs,
Page 1 of 81delivers on innovation and enterprise and equips you with the workforce to meet the ever-changing
landscape of business.
We need to unite as one and build upon the strengths of the region through positive partnership and
collaboration to deliver a wide, knowledgeable, diversified and skilled workforce that allows us to
grow and prosper.
Leigh Hughes, Business Development & CSR Director, Bouygues UK
Chair of the South East Wales Employment and Skills Board
Learning, Skills and Innovation Partnership
Page 2 of 81EXECUTIVE SUMMARY
Our vision is to develop the social and economic potential of the Cardiff Capital Region, supporting
people and businesses to deliver a high performing and prosperous region that stimulates and
supports local and inward investment.
To achieve this the Cardiff Capital Region needs to develop a demand-led skills system that is driven
by the needs of industry and which delivers employment and skills support in response to
infrastructure and other investments to achieve growth within the regional economy.
Our Region
The Cardiff Capital Region (CCR) has a population of 1.53m, just under half the total for Wales. It
generates more than half the total gross value added (GVA) in Wales and generates 80% of the UK
average GVA per head. The region employs almost half of the workforce but there is a disparity
between Cardiff and a more prosperous southern, coastal belt and areas in the Heads of the Valleys
to the north.
Infrastructure and other investments through the £1.2bn Cardiff Capital Region City Deal, local
authority and other sector’s capital programmes, Enterprise Zones and others, are key drivers of
economic growth. Creating employment and skills opportunities by investing in, for example, road
and rail infrastructure, delivering the South Wales Metro and a UK Catapult for next generation
compound semi-conductor applications to build an international cluster of supply chain companies in
and around the region.
An analysis of the regional economy based on value by productivity (GVA), and size of the sector1 has
prioritised five sectors in the Cardiff Capital Region which are considered to have greatest demand for
labour and skills in the next five years: advanced materials and manufacturing (AMM), construction
(CON), financial, legal and professional services (FPS), digital (ICT/digital) and the human foundational
economy including education, health and social Care (HFE).
Key Challenges
Raising GVA – the need to develop employment and skills in the regional labour market that support
investment strategies and achieve economic growth. Infrastructure investment in the region (and
competition from major infrastructure jobs within commuting distance) will have a substantial impact
on demand for current employment and skills. For example, skills shortages are forecast in a range of
construction trades and more senior roles.
Skills gaps and shortages – projected labour demands exceed the expected numbers of entrants to
the labour market creating skills shortages whilst skills gaps increase as the demand for skills evolves
in response to changing working methods, utilising new technology and introducing automation.
The supply of labour to meet these demands is dependent on a number of factors including:
i) appropriate training provision in the region for all ages, taking into account the need to train
the trainers in current and changing skills needs;
ii) retention of a workforce who may be lured away by higher salaries elsewhere in the UK and
1
Welsh Government, Regional LMI Report, Table 2.3 & 3.7
Page 3 of 81iii) provision for the upskilling of adults already in the workforce to meet the changing skills
requirements of replacement jobs, particularly with the adoption of digital skills and Industry
4.0.2
Qualification levels – qualifications levels in the Cardiff Capital Region exceed Wales’ average but still
do not meet forecast higher-level skills demand, which continues to increase. 54% of those in
employment are forecast to hold qualifications at Level 4 or above by 2024, with an overall decline in
those with no or low qualifications predicted. The exception is for caring, personal service and
administrative occupations which predicts increases in demand for Level 2 and Level 3 qualifications,
driven in part by mandatory requirements.
Apprenticeships – only 13% of employers utilise apprenticeships and just 1.5% of year 11 school
children went directly into apprenticeships last year. Challenges remain regarding perceptions,
including parity with academic routes, promotion and marketing of opportunities, increasing the
number and range of apprenticeship opportunities, including higher and degree apprenticeships.
Careers advice and guidance – mismatch between subject areas chosen by learners and those
occupations within the economy that offer the greatest prospect for employment, earnings and career
development. Forecasts suggest significant numbers of local job vacancies across prioritised sectors,
particularly amongst SMEs which employ a large percentage of the workforce. Certain skills subject
areas are under-subscribed at all levels despite excellent long-term career opportunities. Forecast
skills shortages may be reduced if careers advisors, teachers and industry representatives can
collaborate to effectively market opportunities to parents and students.
Improving learner outcomes – limited measures of progression to education and employment due to
poor destination data.
Unemployment and economic inactivity – high unemployment costs and projected skills shortages
due to demographic trends, an ageing population and ageing workforce require pro-active plans to
support the unemployed and economically inactive into work.
Brexit and European Union funding – consideration is needed of the significant impact the UK’s
departure from the European Union (Brexit) could have on labour supply and skills availability if
restrictions are placed on the free movement of labour from other European countries. Succession
plans are needed for European Union funded programmes.
Regional Priorities for Employment and Skills
1. Delivering employment and skills support for industry, infrastructure and other investments to
enable growth - creating tailored and flexible solutions through regional academies or centres of
excellence that can respond to the needs identified and utilising social clauses to maximise the
skills engagement and employment potential of any investment, including employment and skills
support to build local supply chains/value chains and developing the capacity and capability
within the education system to respond.
2. Supporting industry through priority sectors to address skills gaps and shortages –
a. Digital skills are in increasing demand in all sectors and include skills for advanced
production such as compound semi-conductors, automation, Industry 4.0, artificial
intelligence and robotics and for service support and information such as data analytics,
2
Industry 4.0 is a name for the emerging trend of automation and data exchange in manufacturing
technologies. It includes cyber-physical systems, the Internet of Things, cloud computing and cognitive
computing.
Page 4 of 81cyber security, programming and software engineering. Increasing the supply of digitally
skilled labour to meet rapidly growing demand is a priority for the region as there are
currently half the number of technology specialists in the workforce as expected.
Reversing the falling numbers taking science, technology, engineering and mathematics
(STEM) and computer-related subjects at school is critical. Support for degree
programmes and initiatives such as the National Cyber Security Academy and National
Software Academy will improve numbers but retention will be an issue with higher
salaries elsewhere. Introducing degree apprenticeships and other work based learning
routes could both meet the demand for digital skills which tend to require higher levels
of qualifications and address increasing skills gaps by keeping pace with rapid change.
b. Leadership and management is needed in all sectors. High level strategic leadership and
management skills will be required by managers to deliver transformation and succession
plans.
c. Train the trainer programmes are needed to develop the capacity and capability of
education providers to deliver specialist skills and/or ensure currency and relevance of
learning, including digital competence. Initial training and continuous professional
development for teachers, tutors and lecturers in schools, colleges and universities needs
to develop and/or refresh skills to keep pace with changing demands within industry.
Increasing collaboration between employers and education providers should provide
opportunities to upskill trainers and enable the development of labour supply that that
is aligned with demand.
d. ‘People and personal skills’, often described as soft skills, are a requirement for
employability and should be integrated and feature within learning programmes as is the
case for ‘essential skills’, (numeracy, literacy and ICT). 16% of employers reported having
skills gaps, with 86% of skills gaps being related to people and personal skills and 96%
being related to technical and practical skills.3
e. Adult skills programmes are needed to address skills gaps and shortages, developing the
capacity of the existing workforce to meet labour demands, support progression and
develop higher level skills.
3. Developing higher level skills to future-proof the workforce – increase the range of higher-level
qualifications in technical subjects and to meet the demand for managers, professionals and
associate professionals in ICT/digital, professional services and manufacturing at Level 4 and
beyond. Innovate learning to encourage and support learner aspirations to achieve higher level
skills, providing accelerated learning and pathways to encourage progression beyond levels 2 and
3. Improve learner attainment across the region to meet forecasted higher level skills demand.
4. Increasing the number and range of apprenticeships – increase the number and range of
apprenticeships offered and maximise the demand from employers in response to the
Apprenticeship Levy. Extend the range of higher level apprenticeships and introduce degree
apprenticeships as an alternative, and cost effective, route to higher level qualifications, with
greater opportunity to progress into employment. Support shared apprenticeships in response
to demand from industry and particularly SMEs.
5. Improving industry engagement with education and marketing of career opportunities and
pathways – develop sustained engagement by industry with schools and colleges to foster
education/industry links. Support continuous professional development of teachers and tutors
3
Welsh Government Regional LMI Report Figure 6.3: People and personal skills that need improving and
Employer Skills Survey 2015
Page 5 of 81in industry relevant skills. Improve information/intelligence and marketing of career options
linked to employment opportunities, use industry engagement to challenge perceptions and
promote parity between vocational pathways, apprenticeships and academic qualifications.
6. Improving destination data for better learner outcomes – destination data needs to be
improved. Quality data in higher education is able to demonstrate learner outcomes and the
impact and value of skills investment; this needs to be extended across further education and
work-based learning. Longer term measures could identify pathways to employment, relevance
of learning and movement within and across different occupations to measure learner outcomes
over time.
7. Developing a regional employability plan to get more people into work – develop a regional
plan to engage economically inactive and unemployed people, including ex-offenders and
encourage them back into work with appropriate training and pre- and post-employment
support. Utilise social clauses in contracts to create employment and placement opportunities
for those seeking work.
8. Developing succession plans for European Union funded programmes post-Brexit – risk assess
and impact assess European Union funded support services offered through local and regional
ESF operations. Determine priorities for succession plans post Brexit.
Page 6 of 81INTRODUCTION AND METHODOLOGY
The South East Wales Learning, Skills and Innovation Partnership (LSkIP) is one of three Regional Skills
Partnerships (RSPs) across Wales, responsible for the production of an annual Employment and Skills
Plan for Welsh Government which determines regional priorities and recommendations for skills
investment.
LSkIP is led by the South East Wales Employment and Skills Board, whose membership is balanced
between stakeholders representing demand, supply and those (catalysts) responsible for skills
planning and funding. This includes Welsh Government, education, regeneration and industry,
including the Cardiff Capital Region City Deal and Enterprise Zones. LSkIP and the Cardiff Capital
Region are working in partnership to deliver the City Deal skills agenda and the LSkIP Employment and
Skills Board acts in an advisory capacity.
The vision is to create a strategic partnership to develop the social and economic potential of the
Cardiff Capital Region, supporting people and businesses to deliver a high performing and prosperous
region that stimulates and supports local and inward investment. This employment and skills plan is
a key component in delivering this aspiration and working towards a demand-led skills system, by
identifying priorities to meet the needs of those sectors, infrastructure and other investments that are
driving economic growth across the Cardiff Capital Region. Five priority sectors have been identified
for the Employment and Skills Plan (2017) based on value by productivity (GVA) and size of the sector.4
Stakeholder engagement and in particular the involvement of industry is considered essential in
shaping the development of this regional plan for employment and skills. LSkIP has developed industry
engagement through its Board membership and partner organisations across the five prioritised
sectors: advanced materials and manufacturing, construction, financial and professional services,
human foundational economy (health, social care and education) and ICT/digital.
In addition to employer engagement across priority sector networks, cluster groups, workshops,
meetings and consultation events, LSkIP has undertaken both a large and small companies research
exercise and online survey to determine industry skills needs and key challenges.
This document therefore articulates the needs of employers from across the five identified sectors
and their agreed priorities and recommendations for employment and skills investment and support.
Each sector has adopted the three horizon rule, determining priorities and recommendations across
the short, medium and long term which are considered essential for their development and growth.
Furthermore, sector priorities have been used to inform a number of confidential planning and
funding recommendations, developed through regional meetings with further education
principals/chief executives, work-based learning providers (through the National Training Federation
for Wales) and at the LSkIP Employment and Skills Board. These recommendations are submitted for
Welsh Government consideration and will contribute to the post-16 planning and funding process for
skills.
Supporting data for the LSkIP Employment and Skills Plan can be referenced (in both Welsh and
English) through the South East Wales Skills Observatory unless otherwise indicated.5 This includes
4
Welsh Government, Regional LMI Report Table 2.3 & 3.7
5
http://sewso.infobasecymru.net/IAS/themes/databyregionalpriorities
Page 7 of 81the Welsh Government Regional Labour Market Intelligence Data Report6 including data from the
Employer Skills Survey and Working Futures.7
The employment and skills plan will be developed within the Welsh Government policy context and
align with the Well-being of Future Generations (Wales) Act (2015)8 and the five ways of working in
accordance with the sustainable development principle: long term, integration, involvement,
collaboration and prevention.
6
Welsh Government, Regional LMI Report
7
Working Futures data: ‘As with all projections and forecasts, the results presented in Working Futures should
be regarded as indicative of likely trends and orders of magnitude given a continuation of past behaviour and
performance, rather than precise forecasts of the future.’ Welsh Government, Regional LMI Report 7.2 What
is Working Futures? pp72
8
https://futuregenerations.wales/about-us/future-generations-act/
Page 8 of 81SECTION 1 - REGIONAL OVERVIEW
The Cardiff Capital Region comprises ten local authorities in South East Wales with a population of
1.53m, just under half the total for Wales. Population growth is concentrated along the M4 corridor
area and there are clear variances across the region from Cardiff and a more prosperous southern,
coastal belt and the Heads of the Valleys to the north. There are three Enterprise Zones within Cardiff
Capital Region where the Welsh Government is prioritising investment in business infrastructure.
Blaenau Gwent
Caerphilly
Merthyr Tydfil
Rhondda Cynon Taf
Torfaen
Bridgend
Cardiff
Monmouthshire
Newport
The Vale of Glamorgan
INVESTMENT
Cardiff Capital Region City Deal
The Cardiff Capital Region has secured a £1.2bn City Deal with the UK and Welsh Governments. The
City Deal includes the following elements:
• investment in the region’s infrastructure, including delivery of the South East Wales Metro
system of integrated bus and rail transport;
• support for innovation and improvement of the digital network;
• developing the skills of the workforce and tackling unemployment;
• supporting enterprise and business growth;
• housing development and regeneration.
Over its lifetime, the City Deal is expected to deliver up to 25,000 new jobs and leverage an additional
£4bn of private sector investment. The nature of this investment, along with other sources (such as
the replacement for European Union funding in the region) will help to shape the future economy of
the region. In turn, this will influence the types of skills that will be required.
Page 9 of 81The Cardiff Capital Region Business Plan acknowledges that innovations such as artificial intelligence,
drones, driverless vehicles, 3D printing, robotics and automation will radically change the future
infrastructure and skills needed by the region to compete effectively. It states that, working
together with partners in the business and other sectors, “We will therefore make sure our plans are
flexible enough to cope with changes in the economic environment” with a system of governance
that “allows, and fosters, innovation without trying to predict the future”.9
The four strategic objectives of the Cardiff Capital Region are to:
• have more and better jobs;
• help business climb the value-added chain at all levels;
• have a workforce equipped for the future;
• ensure the proceeds of growth are shared.
The Cardiff Capital Region Business Plan also sets out spatial priorities which will impact on where
employment and skills are demanded in the region. The planned improvements in connectivity
through the South Wales Metro will play a vital role in ensuring that places of labour demand are
accessible to sources of labour supply, whilst investment in a UK Catapult for next generation
compound semi-conductor applications will develop high level skills to build an international cluster
of supply chain companies in and around the region. Cardiff Capital Region, through the City Deal, is
investing £38m (on a commercial basis) towards a state-of-the-art, globally competitive
manufacturing foundry.
In the same way, the education and skills sector needs to ensure that it is equipping people with the
generic and specialist skills and abilities that will be needed in the jobs to be created. These will be a
mixture of new jobs associated with emerging demands or innovation and jobs to replace those who
leave their jobs or leave the labour market (e.g. move away or retire). The latter jobs are unlikely to
be like-for-like replacements. They will be influenced by societal trends and technological
developments.
Major Investment Demands
The largest single influence on labour force and skills demand in the Cardiff Capital Region economy
is from substantial investments planned in the region and other commutable projects e.g. Hinkley
Point C Nuclear Power Station. In future infrastructure investment will be co-ordinated by the
National Infrastructure Commission for Wales,10 which it is hoped will address the need for effective
intervention and early dissemination of labour demand information, key to forward planning of
training delivery.
Skills support for infrastructure and other investments should include ‘train the trainer’, with
continuing professional development for trainers/teachers needed to ensure there is both the
capacity and capability to deliver new skills demanded by industry e.g. coded welding and inspection
for nuclear construction.
Welsh Government forecast £5.5bn of public procurement per annum with £1.1bn of Mutual
Investment Model (MIM) project funding contributing to an overall Wales Infrastructure Investment
Programme (WIIP).11 Procurement contracts have the potential to secure demand for a local labour
9
Report: Cardiff Capital Region – Powering the Welsh Economy
http://gov.wales/docs/det/publications/150212-powering-the-welsh-economy-en.pdf
10
https://consultations.gov.wales/consultations/national-infrastructure-commission-wales
11
http://gov.wales/funding/wales-infrastructure-investment-plan/mutual-investment-model/technical-
documents/?lang=en
Page 10 of 81force through effective use of social clauses, which can also increase industry engagement with
education, to promote careers and support shared investment in training capacity and facilities.
The following publicly funded projects and programmes have been identified as having potential to
create very local workforce skills demand. The Code of Practice for Ethical Supply and ‘Better Jobs
Closer to Home’ will offer strong levers driving contractors to employ local people. Therefore training
a local employment pool and raising qualification levels to meet forecast demand is a key regional
priority. This should help to ensure that increases in gross value added (GVA) are, where possible,
facilitated through the employment and training of a local workforce.
Local Authority Capital Programme
All local authorities wish to grow and retain skilled jobs and increase local prosperity (Table 1).
Table 1 South East Wales Local Authority - Capital Programme 2016/17-2019
South-East Wales £’000 2016/17 2017/18 2018/19
Blaenau Gwent 10,908 10,467 3,043
Bridgend 34,467 54,166 10,129
Caerphilly 55,690 50,870 52,062
Cardiff 98,014 136,859 113,670
Merthyr Tydfil 10,421 7,541 8,273
Monmouthshire 47,957 42,373 15,401
Newport 36,638 29,013 13,426
Rhondda Cynon Taf 116,164 68,842 37,358
Torfaen 27,709 15,612 40,635
Vale of Glamorgan 67,351 52,834 22,231
Cardiff Capital Region Total 505,319 468,577 316,228
Rail including the Metro
Transport for Wales (TfW)12 is progressing procurement for the South Wales Metro and Wales and
Borders Rail franchise (supported by an ethical procurement panel including the Wales Council for
Voluntary Action). Initial skills needs are:
• rail engineering e.g. signalling, electrification, track and rolling stock engineers;
• ICT/digital systems and software engineers, data analysts and cyber security;
• project management skills – cost planning, risk analysts, managers;
• financial, commercial and procurement specialists;
• train operational staff, on-board, customer, station and planning staff.
Some existing staff can meet these demands; however, a paper produced for Transport for Wales
indicates that an ageing workforce will result in 800-1,000 replacement staff being needed within the
rail sector across South Wales, with about half in infrastructure and half in train operational staff.
Other transport infrastructure investment creating skills demand:
• South Wales M4 corridor relief road;13
• A465 dualling (see LSkIP’s 2016 Employment and Skills Plan)14 Heads of the Valleys to M50,
M5 and Midlands;
• electrification of the railway from London, Swindon and Bristol.
12
http://gov.wales/topics/transport/transport-for-wales/?lang=en
13
http://gov.wales/topics/transport/roads/schemes/m4/corridor-around-newport/?lang=en
14
http://www.lskip.wales/downloads/160731_LSkIP_EandS_Plan_with_cover_English.pdf
Page 11 of 81Social Housing and 21st Century Schools and Education Programme
The Welsh Government has committed to 20,000 new houses across Wales to meet social housing
need. Skills training is needed for improved efficiencies, quality and accelerated delivery. The
Government is looking at potential off-site construction and utilisation of Building Information
Modelling (BIM).
Valleys Taskforce15
Led by the Minister for Lifelong Learning and Welsh Language, the Taskforce remit is to maximise
investment across valleys areas looking at improving delivery of public services and creating better
jobs closer to home, to increase employment.
Cardiff-Newport Tidal Lagoon
The Swansea Bay Tidal Lagoon Power project is still awaiting a decision from Westminster, despite the
favourable Hendry report.16 The initial impact is considered as limited for the Cardiff Capital Region.
However, aspirations for a second project, if agreed, “With the potential to invest around £8bn of
private capital… between the cities of Cardiff and Newport…” could offer opportunities for
construction and supply chain jobs.17
Superfast Cymru - ICT/Digital
ICT/digital connectivity delivered through the Superfast Cymru broadband network has the potential
to drive ICT, digital creativity and technology skills for the wider digital economy. These will have a
cross-sector impact on skills demand, key to economic development.
Enterprise Zones18
Targeted investment to stimulate growth across three Enterprise Zones:
Cardiff Airport and St Athan Enterprise Zone focuses on aerospace, automotive, defence, engineering
and manufacturing:
• Cardiff International Airport has a major British Airways presence;
• development of the former defence establishment of St Athan with Aston Martin is a high-
profile inward investment;
• involvement of Cardiff and Vale College with an on-site campus offering bespoke training and
support for apprenticeships;
• transport infrastructure is a priority.
Central Cardiff Enterprise Zone’s main driver is business and financial services (FPS) and digital:
• new office accommodation is being constructed for the BBC and financial, business and legal
firms.
• Central Square has Cardiff Central Railway Station and Cardiff Bus Station (under
construction).
• the Enterprise Zone has excellent broadband connectivity and is developing a skills base
around fintech and digital services.
15
http://gov.wales/topics/people-and-communities/communities/taskforce-for-the-valleys/?lang=en
16
https://hendryreview.wordpress.com/
17
http://www.tidallagoonpower.com/projects/cardiff/
18
https://businesswales.gov.wales/enterprisezones/zones
Page 12 of 81Ebbw Vale Enterprise Zone is a centre for manufacturing and engineering enterprise:
• improving connections to the Midlands automotive industry by dualling the A465;
• a number of key supply chain automotive manufacturing organisations;
• strong life science presence in pharmaceutical manufacturing;
• local State-of-the-art further education college facilities and access to university research.
Page 13 of 81REGIONAL ECONOMIC PROFILE
The Cardiff Capital Region generates more than half the total gross value added (GVA) in Wales but it
still lags behind the UK average, generating only 73% of UK average GVA per head. Although above
the Welsh average, over the last 10 years productivity has fallen across all of the Cardiff Capital Region
sub-regions with the exception of Merthyr Tydfil and Rhondda Cynon Taf. Latest figures from the
Office for National Statistics (ONS) (pre-Brexit) indicate there is little difference between GVA in urban
or rural locations, suggesting that economic growth potential exists across the region.
Table 2 Gross Value Added by Measure, Welsh Economic Region and Year19
Gross Value Gross Value
NUTS3 areas within Cardiff Capital Gross Value Added
Added (GVA) Added per head
Region Index (UK=100)
(£ million) (£ million)
2015 2015 2015
Central Valleys 4,578 15,429 60.9
Gwent Valleys 4,673 13,681 54.0
Monmouthshire and Newport 4,969 20,684 81.6
Cardiff and Vale of Glamorgan 11,044 22,783 89.9
Cardiff Capital Region20 25,264 18,532 73.1
Wales 55,788 18,002 71.0
UK 150,622 25,351 100.0
Data Source: Regional Accounts, Office for National Statistics Next update: December 2017
Gross value added (GVA) is a key target and measurement of growth for the Cardiff Capital Region;
however, a drive for higher GVA alone does not guarantee an increase in employment, for example,
real estate activity is the largest sector by GVA across the region but employs the least number of
people. Similarly, construction and professional, scientific and technical activities are the second and
third largest sectors by GVA in the Cardiff Capital Region, but public administration, defence,
education and health and wholesale, retail, transport, hotels and food are the most significant in terms
of numbers employed (Figure 1).
19
Welsh Government, Regional LMI Report Table 2.2
20
The Cardiff Capital Region figure is an approximation and excludes Bridgend.
Page 14 of 81Figure 1 Cardiff Capital Region Workplace employment by Broad Industry 201521
Other service activities
Professional, scientific and technical…
Finance and insurance activities
Wholesale, retail, transport, hotels…
Production
0 100,000 200,000 300,000 400,000
Professi
onal,
scientific
and Public
Wholesa Finance technica aministr
Informat
le, retail, and Real l ation, Other
Producti Construc ion and
transpor insuranc estate activities defence, service
on tion commun
t, hotels e activities ; educatio activities
ication
and food activities administ n and
rative health
and
support
service…
Wales 172,500 92,700 357,800 23,900 30,800 19,100 167,300 423,500 77,300
South East Wales 84,800 41,600 168,000 14,000 21,100 10,200 92,600 208,200 36,600
Wales South East Wales
Therefore, to achieve growth, a balanced assessment is required of both the value and volume of
labour demand, as well as associated skills gaps and shortages, to determine priority sectors for skills
investment that secure the greatest economic return.
Large enterprises (250+ employees) are an important focus of demand for skills and training and often
have high skills demands internally, although they may be less innovative than SMEs, which can tend
to react more quickly to changes in the marketplace. Training may be delivered internally or by a
range of suppliers at all levels, ranging from institutions to work-based learning and independent
specialist providers.
Large companies with internal training may benefit from gaining formal recognition for in-house
programmes that are not accredited. Equally, greater awareness is needed amongst employers of the
range of existing learning that is already recognised through the Credit and Qualifications Framework
for Wales (CQFW). There is also the potential to encourage large companies to collaborate and share
training with others, including their supply chain. This would help to build the critical mass needed to
develop and sustain provision and make it more accessible to micro and SME businesses.
Of the 140 large companies headquartered in Wales (n.b. excludes central and local government
authorities), 30% are in manufacturing, 13% in wholesale, the retail trade and motor vehicles/cycles;
10% in education, 10% in health and social work and 8% in administrative and support services. Other
sectors together represent the remaining 30% (individual sector numbers considered disclosive and
supressed).
21
Welsh Government, Regional LMI Report, Table 3.6: Workplace employment by Welsh local areas and broad
industry
Page 15 of 81Table 3 Company Size Workforce and Value (November 2016)
Wales Businesses % All-Wales Workforce % All-Wales £m CCR £% Wales
Businesses Workforce Turnover Turnover
All 105,690 42% 537,300 48% 50,846 43.5%
CCR Businesses % CCR Workforce % CCR £m CCR £% CCR
Businesses Workforce Turnover Turnover
Micro 0–9 99,170 94% 160,700 30% 7,732 15%
Small 10–49 4,025 4% 74,500 14% 5,527 11%
Medium 50-249 1,215 1% 67,500 13% 6772 13%
Large 250+ 1,280 1% 234,400 44% 30,815 61%
Micro and SME companies are key to future prosperity in the Cardiff Capital Region, comprising about
95% of companies and over 50% of the economy. SME lending in the Cardiff postcode (CF) area is
reported to be £1.032 trillion and for Newport (NP) £0.526 trillion. 22 The Federation of Small
Businesses (FSB)23 is a key contact point for small businesses through which skills opportunities can
be promoted. The FSB identify the crucial importance of Wales’ digital infrastructure and the superfast
broadband connectivity to its members, self-employed, micro and SME companies.
Investment in skills is low in micro companies and smaller SMEs. Cost is a significant factor for micro
and smaller companies, but so too is time for workers off the shop floor or needing cover. Many
companies run lean processes and are reluctant to take on more staff. An expectation that companies
will automatically train if offered a subsidy or an apprentice can be misplaced.
Business models are changing for the self-employed (part of the gig economy) and micro companies.
They are using digital connectivity in on-line collaboration, practicing as Virtual SMEs.24 The Virtual
SME is defined by an agile workforce operating online without a physical office and associated
overheads. Best examples of the Virtual SME model are in the construction sector where
complementary trades e.g. brickwork, plastering, electrics, plumbing skills are used to undertake small
(local) shared contracts.
On average, over 20% of business births are in business administration and support, and transport and
storage with around 16% in ICT and professional, scientific and technical. Many start-up/spin-out
companies arise in universities, led by highly qualified individual entrepreneurs having identified an
opportunity in the (local) supply chain. The rate in Wales of business births (12%) and deaths (10%) is
above the South West of England25 and Northern Ireland. Just over 40% of new companies remain in
business over five years. Training and business support for entrepreneurs and new businesses is key
to improving sustainability. Further research is needed into zero and micro companies as in 2015
recorded births are the largest number since 2000 (when records began).26
22
British Banking Association SME lending http://bit.ly/2mdpRaD 2016
23
https://www.fsb.org.uk/regions/south-wales/branches/south-east-wales
24
Draws on CRESC research and the concept of precarity
25
https://www.slideshare.net/statisticsONS/business-demography-in-the-uk
26
Office for National Statistics Business Demography, 2015
https://www.slideshare.net/statisticsONS/business-demography-in-the-uk
Page 16 of 81LABOUR DEMAND INCLUDING GROWTH AND REPLACEMENT JOBS
The requirement for jobs in the region over the next ten years is forecast to be between 25,000 and
30,000 per annum – which exceeds the expected numbers of entrants to the labour market.
• 80% are expected to be ‘replacement’ jobs, with only 2,000 to 3,000 per annum being ‘new
jobs’.
• It is also forecast that 54% of all jobs will be at Level 4+ by 2024.
• Significant increases in jobs for managers, professionals and associate professionals focused
on ICT, professional services and manufacturing.
• A large increase in Level 2 and Level 3 qualifications is forecast for social care and other service
roles in response to mandatory qualification and registration requirements.
• Significant growth in skills shortage vacancies is forecast in construction, human foundational
economy, advanced materials and manufacturing and financial and professional services,
many occurring in digital and technology skills.
Employment in the Cardiff Capital Region economy shows growth in employment in construction,
health and social work, finance and insurance, ICT/digital, professional and support services. The
manufacturing, engineering, media and education workforces are shrinking.
When replacement jobs are included (80%) there is a forecast demand for jobs in all sector
occupations of 292,800 jobs to 2024,27 a higher number than education leavers alone. The forecast
net requirement for jobs over a ten year period between 25,000 and 30,000 jobs per annum across all
sectors. 2,000-3,000 jobs per annum are forecast to be created through growth.28
Table 4 Total Projected Employment Demand by Expansion and Replacement Jobs in the Cardiff
Capital Region 2014-2429
2014 2024 Exp. % Exp. Rep. Total
Food drink and tobacco 10,900 11,100 200 1.5 4,000 4,200
Engineering 9,300 6,700 -2,600 -27.6 2,900 400
Rest of manufacturing 52,400 47,400 -5,000 -9.5 17,200 12,200
Construction 43,200 46,900 3,700 8.6 15,300 19,000
Wholesale and retail trade 99,700 109,700 10,000 10.0 40,300 50,300
Transport and storage 22,400 23,100 700 2.9 8,800 9,400
Accommodation and food 36,700 41,000 4,300 11.8 15,900 20,200
Media 4,400 4,100 -300 -6.1 1,700 1,400
Information technology 9,500 10,500 1,000 10.8 3,500 4,500
Finance and insurance 19,500 23,400 3,800 19.6 7,900 11,700
Real estate 11,900 12,900 1,000 8.6 5,100 6,100
Professional services 34,500 39,400 4,900 14.2 14,400 19,400
Support services 48,900 53,300 4,500 9.1 19,600 24,100
Education 67,600 66,900 -800 -1.1 27,600 26,900
Health and social work 102,200 105,800 3,600 3.5 40,900 44,500
Arts and entertainment 15,100 16,100 1,000 6.8 6,300 7,300
27
Office for National Statistics Business Demography: 2015
28
Working Futures 2014-2024 Regional LMI report: Figure 7.1
https://www.gov.uk/government/publications/uk-labour-market-projections-2014-to-2024
29
Working Futures Regional LMI Report Table 7.2 2014-24 https://www.gov.uk/government/publications/uk-
labour-market-projections-2014-to-2024
Page 17 of 81Other services 20,200 20,700 500 2.5 8,500 9,000
All industries 671,700 701,000 29,300 4.4 263,400 292,800
Source: Working Futures 2014-2024 Notes: figures rounded to the nearest hundred, percentages are unrounded.
The term ‘replacement jobs’ can lead to the misconception that they are ‘skills neutral’ but the skills
required for these ‘replacement’ jobs are evolving with the business and in response to digital
technology. For perspective, 20 years ago cable/digital connectivity in the home was a year away
(1998), wi-fi wasn’t available (2000) and nor were Facebook/social media (2007). Digital technology
has created a rapid period of change over 20 years and Industry 4.0 will accelerate change for the next
20 years.
Older employees need new (digital) skills to work in a modern workplace. For an employee aged 45,
formal education ended at least 20 years ago and the expectation is for a further 20 years of valuable
work both for the benefit of the individual and gross value added (GVA) in the economy. Therefore,
upskilling the adult workforce is a priority. Currently 10% of the workforce are aged over 6530 (up 4%
over ten years) and 5% of further education teaching staff are over 65.31
Cross Sector skills for Digital Futures
• Demand 3D printing, automation, robotics, automated vehicles, drones.
• Compound semi-conductor manufacture, nano technology, personalised medicine.
• Open data, LiDAR, building information modelling (BIM).
• Fintech, blockchain, legal technology, security.
• Digital analytics, NHS Wales Informatics Service patient information, online
learning.
• Artificial intelligence, augmented reality (AR), virtual reality (VR), 5G, big data,
Internet of Things, wearables.
• Prototyping, digital creatives, gaming, programming.
30
Office for National Statistics May-June 2016
https://www.ons.gov.uk/employmentandlabourmarket/peopleinwork
https://www.ons.gov.uk/employmentandlabourmarket/peopleinwork
31
http://www.ewc.wales/site/index.php/en/research-statistics/education-workforce-statistics
http://www.ewc.wales/site/index.php/cy/ymchwil-ac-ystadegau/ystadegau-r-gweithlu-addysg
Page 18 of 81LABOUR SUPPLY
Skills Gaps and Shortages
Skills shortage vacancies (SSVs) in the labour market are problems employers encounter recruiting
individuals with particular skills considered essential for a job. The range of skills is reflected in Table
5. This considers related figures in Wales but consideration should also be given to the impact of
workforce skills demand in the West of England that runs along the Eastern edge of the region.
Table 5 Density of Skill Shortage Vacancies by Occupation and Region32
North Mid South West South East
Wales %
Wales % Wales % Wales % Wales %
Managers 15 - - - (10)
Professionals 26 (25) - (32) 20
Associate professionals 24 (42) (29) (27) 15
Administrative/clerical 16 (17) - (7) 22
Skilled trades occupations 43 43 (66) 33 47
Caring, leisure and other services 30 (28) - (19) 34
Sales and customer services 15 (21) - (5) 19
Machine operatives 40 (20) - (56) (36)
Nearly a quarter of all vacancies (density) reported in the Cardiff Capital Region were considered Skills
shortage vacancies (SSVs), the same level as 2013.33 The overall incidence of skills shortage vacancies
(employers surveyed reporting SSVs) was 5% and has doubled over four years.34 Vacancies and skill
shortage vacancies by sector data indicates the highest levels of skills shortage vacancies are in
manufacturing and construction.
In the context of UK figures the Cardiff Capital Region is likely to be pressured on retention of new
recruits with increased importance training and upskilling the local workforce. UK figures rank
demand for permanent jobs highest accounting/financial and IT and computing. Part-time demand is
highest in hotel and catering, nursing/medical/care. In engineering, both full and part-time jobs are
showing increased demand.35 Availability of candidates is falling, starting salaries are increasing.
Skills Gaps represents skills deficiencies employers experience in their existing staff. A skills gap exists
where an employee lacks full proficiency in their job role. The number of people with skills gaps is
likely to expand rapidly with the introduction of digital technology and Industry 4.0. Skills gaps often
disproportionately affect the adult/older workforce in businesses impacted by changes in technology.
Skills gaps affect more employers than skills shortage vacancies do, with 16% of employers in South
East Wales experiencing skills gaps, compared to 6% with skills shortage vacancies. The highest
32
http://sewso.infobasecymru.net/IAS/themes/lmi/labourmarketintelligence/employerviewsonskillsandtraining-
esssurvey/tabular?viewId=2026&geoId=116&subsetId=128 (-) denotes that the base is under 25 and the
figure has been supressed. Figures in parenthesis are from a base between 25 and 49 and should be
interpreted with care.
33
http://sewso.infobasecymru.net/IAS/themes/databyregionalpriorities/labourmarketintelligence/employervi
ewsonskillsandtraining-esssurvey/tabular?viewId=2024&geoId=116&subsetId=128
34
http://sewso.infobasecymru.net/IAS/dataviews/tabular?viewId=2025&geoId=116&subsetId=128
35
IHS Markit Recruitment and Employment Confederation, July 2017
https://www.markiteconomics.com/Survey/.../af7980eece364234a2b7900a9ff0a1d6
Page 19 of 81incidence of skills gaps occurs in South East Wales, there were 28,100 staff, just under 5%, reported
as having a skills gap in 2015 (Table 6).
Table 6 Incidence and Density of Skills Gaps by Region
Establishments (incidence) Staff with skills gaps (density)
Unweighted 2011 2013 2015 2011 2013 2015
base, 2015 % % % % % %
UK 91,210 17 15 14 5.5 5.2 5.0
Wales 6,027 16 16 14 4.6 5.8 4.5
South East Wales 2,395 18 17 16 4.5 5.3 4.9
North Wales 1,528 15 17 13 5.0 7.6 4.4
South West Wales 1,362 14 15 13 4.2 5.0 4.5
1% of employers in South East Wales required specific Welsh language qualifications36 whilst 2% of
students in Cardiff Capital Region universities are partially taught through the medium of Welsh.37
36
Welsh Government, Regional LMI Report, section 5.5 qualifications and training via the medium of Welsh
37
Cardiff University 2.6%, Cardiff Metropolitan University 1.75%, University of South Wales 1.4% of all
enrolments (compared to Bangor University at 10%)
Page 20 of 81You can also read