Townsville Environmental Scan - Informing the region's workforce development needs - Jobs Queensland
←
→
Page content transcription
If your browser does not render page correctly, please read the page content below

Townsville
Environmental Scan
Informing the region’s
workforce development needs
Acknowledgement of the Traditional Owners of Country
Jobs Queensland, on behalf of the community, pays respect to Elders past, present and
emerging. Jobs Queensland recognises that the land, water and seascapes of the North
Queensland region form traditional landscapes that were managed for thousands of years by
Traditional Owners to provide the resources required for life.
Although these landscapes have changed and are now shared, Traditional Owners have an
ongoing and unique connection to their ancestral lands and have responsibilities to the land
under their traditional law and customs.
Jobs Queensland also recognises Traditional Owners who have been granted native title over
land and sea country and their active role in the ongoing management of cultural resources
for the important role they play in the social, spiritual and economic future of these
communities.

Copyright

This publication is protected by the Copyright Act 1968.

Licence

Unless otherwise indicated this work is licensed by Jobs Queensland under a Creative
Commons Attribution (CC BY) 4.0 licence. To view a copy of this licence, visit
http://www.creativecommons.org/licenses/by/4.0

You are free to copy, communicate and adapt this publication, as long as you attribute it as
follows:

© The State of Queensland, Jobs Queensland, February 2019.

The Queensland Government is committed to providing accessible services to Queenslanders
of all cultural and linguistic backgrounds. If you have difficulty understanding this publication
and need a translator, please call the Translating and Interpreting Services (TIS National) on
telephone 131 450 and ask them to contact Jobs Queensland on (07) 3294 4706.

Disclaimer

While every care has been taken in preparing this publication, the State of Queensland
accepts no responsibility for decisions or actions taken as a result of any data, information,
statement or advice, expressed or implied, contained within. To the best of our knowledge, the
content was correct at the time of publishing.

Copies of this publication are available on our website at jobsqueensland.qld.gov.au.

To make an enquiry, contact Jobs Queensland:

Email:                 info@jobsqueensland.qld.gov.au
Telephone:             (07) 3294 4706
Mailing address:       PO Box 80, Ipswich, Queensland 4305
Head office:           Level 6, Icon Building, 117 Brisbane Street, Ipswich, Queensland 4305

2    Jobs Queensland                                         Townsville Environmental Scan | February 2019

Contents

Introduction................................................................................................................................. 4

Methodology .............................................................................................................................. 5

Regional profile ........................................................................................................................... 7

Education and Training ............................................................................................................. 23

Health Care and Social Assistance ............................................................................................ 34

Manufacturing .......................................................................................................................... 45

Mining and Resources ................................................................................................................ 55

Transport, Postal and Warehousing ........................................................................................... 77

Conclusion ................................................................................................................................ 86

Acronyms .................................................................................................................................. 89

Glossary..................................................................................................................................... 90

Informing the region’s workforce development needs                                                                                            3
Introduction
Signed on 9 December 2016, the Townsville City Deal is a 15-year commitment between the
Commonwealth of Australia, the Queensland Government and the Townsville City Council to
a collective program of planning, reform and investment for Townsville City. It outlines a series
of commitments that all three tiers of government will work together, as well as a series of
future opportunities for further collaboration, to deliver a transformational impact for
Townsville.
As part of the Queensland Government’s commitment to the Townsville City Deal, Jobs
Queensland has been tasked with delivery of a Workforce Development Plan for the Townsville
region, with the intent to build the local industry capability and workforce development
opportunities.
Jobs Queensland provides strategic advice on anticipated skill needs, future workforce
planning, apprenticeships and traineeships, and Vocational Education and Training (VET)
investment. We do this through research and market intelligence, engagement, partnerships
and relationship management.
Meetings with the Townsville City Council in August 2018 confirmed the Workforce
Development Plan would be delivered in two phases. The first would be an Environmental
Scan, delivered by December 2018; the second, the Workforce Development Plan, delivered
by June 2019.
This Environmental Scan is a formal and systematic exploration of the Townsville region’s
environment to identify potential opportunities, challenges and likely relevant future
developments that may impact the Townsville region.
This future-focused analysis has been built on qualitative and quantitative research conducted
from Jobs Queensland Anticipating Future Skills (AFS) modelling, using three future scenarios to
depict plausible futures, when contrasted with a baseline or ‘business as usual’ scenario.
The scenarios covering the period 2017 to 2022 includes:
    •    Technological change: increasing labour productivity of all industries in Queensland so
         that the productivity of each is 0.25 per cent higher than the baseline each year
         between 2017-18 and 2021-22
    •    Changing workforce: increasing interstate migration with a decreasing proportion of
         working aged population (15-64 years)
    •    External impact: halving the price of coal and iron ore.

Developed in partnership with the Townsville City Council and the Commonwealth and State
Governments, the research focused on Townsville City’s economic development vision to
support traditional industries and skill base to transition to a future industries and skill base that
will support regional growth and development. It does not purport to be the ‘one source of
truth’ on the workforce and skills environment within the region, but rather is designed to
complement existing activity in the region and provide a base of evidence to inform future
workforce development activities. The intent is to stimulate thinking and provide direction on
how the region might best capitalise on its existing and future strengths, capabilities and
opportunities, which will in turn deliver maximum benefit to the local region.

4       Jobs Queensland                                         Townsville Environmental Scan | February 2019
Methodology
The findings within this report are built on qualitative and quantitative research as outlined
below.

In March 2018 and again in August 2018, Jobs Queensland carried out broad analytic desktop
research for the Townsville Local Government Area (LGA) and Statistical Area Level 4 (SA4).
The research investigated the population demographics (estimated resident population; age
structure; selected subpopulation categories; place of birth etc.), as well as projected
population growth. A further analysis of the local education and training, labour market and
industry profiles was also conducted.

The purpose of this initial research and analysis was to inform the industry focus and
subsequently the development of this environmental scan and future Workforce Development
Plan for the Townsville region; a key deliverable for the Townsville City Deal.

In developing this environmental scan, and to ensure Jobs Queensland delivered value to the
city of Townsville, a series of engagement activities was undertaken to ensure we understood
local challenges. We also identified any current workforce planning activities that were
already underway to avoid duplication. These included:
    •   August 2017: Jobs Queensland had initial consultations with Townsville City Council and
        the Department of Infrastructure, Local Government and Planning.
    •   September 2017: A co-hosted breakfast and workshop with Townsville City Council and
        the Local Partnership Forum that discussed the path and priorities in the development
        of a Townsville Workforce Development Plan.
    •   December 2017 to January 2018: Local engagement with the Chamber of Commerce,
        the Commonwealth Government and industry.
    •   February 2018: Jobs Queensland partnered with the Chamber of Commerce and the
        Commonwealth Government in the delivery of a small business expo. This included a
        presentation from the Commonwealth Department of Jobs and Small Business on the
        latest trends in the Townsville labour market, the impact on local employers and how to
        maximise long-term benefits for the region.
    •   April 2018: The Jobs Queensland Board hosted an industry breakfast with a focus on
        building stakeholder relationships and generating discussion as input into creation of a
        strong project scope.
    •   September to November 2018: Ongoing consultation with regional stakeholders
        including Townsville City Council and various Commonwealth and State Government
        agencies.

From September to November 2018, a more extensive and in-depth desktop analysis of various
sources was conducted by Jobs Queensland. Dependent on available data source/s, key
learnings were identified at either the LGA or SA4 region. An overview of the quantitative
research sources is outlined below and includes:
    •   Jobs Queensland Anticipating Future Skills (AFS)data
    •   National Centre for Vocational Education Research (NCVER) four-year training trend
        data
    •   Department of Employment, Small Business and Training (DESBT) apprenticeship and
        traineeship data
    •   Australian Bureau of Statistics (ABS) data
    •   Labour Market Information Portal (LMIP) data
    •   VET Industry Advisory Organisation (VETIAO) reports – published and unpublished
    •   Economy.id data incorporating National Institute of Economic and Industry Research
        (NIEIR) modelling.

Informing the region’s workforce development needs                                               5
Jobs Queensland has worked with the Townsville City Council and key industry representatives
to identify existing workforce planning activities to avoid duplication. Industries experiencing
growth within the region that have recently completed or have workforce planning activity
underway include:
• Tourism: Jobs Queensland worked extensively with industry stakeholders to develop the
Townsville North Queensland Regional Tourism Workforce Plan 2018-2020. Released in
October 2018 to address the workforce needs of the region’s tourism industry, the plan
is now available on the Jobs Queensland website www.jobsqueensland.qld.gov.au.
• Construction: Construction Skills Queensland (CSQ) is an independent industry-funded
body supporting employers, workers, apprentices and career seekers in the building
and construction industry, including workforce planning activities.
• Energy: Energy Skills Queensland (ESQ) is the leading, independent, not-for-profit
organisation. ESQ provides innovative solutions to enable a skilled and safe energy
industry by supporting the electricity, oil and gas, mining, renewable and
telecommunications sectors. ESQ engages, researches and develops products and
services that align to the current and future needs of its stakeholders.
• Government: Local Government, the Queensland Government’s Public Services
Commission and the Commonwealth Government take carriage of all internal
workforce planning activity for relevant agencies, including the Department of
Defence.
The Queensland Government introduced the Regional Skills Investment Strategy (RSIS) in 2018;
a $9 million initiative funded over four years that supports selected regional communities to
identify current and emerging jobs in key industries and ensure there is a supply of skilled local
people to meet this demand.
RSIS aims to bridge the gap between existing training opportunities provided through the
Queensland Government's Annual VET Investment Plan and current workforce skill needs in
targeted regions.
Townsville City Council has been approved $350,000 under the Queensland Government’s
Regional Skills Investment Strategy to employ a project co-ordinator to engage with employers
in the Mining, Construction and Community Services industries regarding workforce issues
related to training and skilling. It is expected that the project will commence in early 2019.
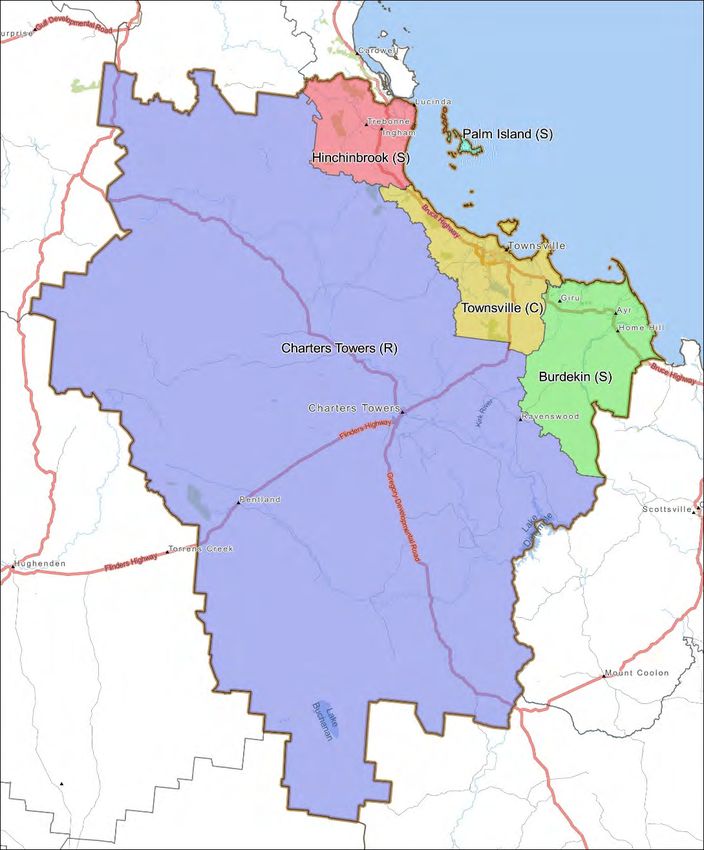
6 Jobs Queensland Townsville Environmental Scan | February 2019Regional profile
The Townsville City Local Government Area (LGA code 37010) falls within the borders of the
broader Townsville SA4 (Figure 1), which also incorporates:
• Burdekin Shire (LGA code 31900)
• Hinchinbrook Shire (LGA code 33800)
• Charters Towers Region (LGA code 32310)
• Palm Island Shire (LGA code 35790).
The SA4 region covers an area of 80,036 square kilometres and includes the major regional
centres of Townsville, Ayr, Home Hill, Ingham and Charters Towers. Townsville LGA alone covers
an area of 3,742 square kilometres and encompasses the densely populated metropolitan
centre and surrounding suburbs; Magnetic Island; and the surrounding rural communities of
Alligator Creek, Woodstock and Reid River to the south; and the Northern Beaches and
Paluma communities to the north.
Figure 1: Townsville SA4
Map provided by Queensland Government Statisticians Office. Source: ABS 1270.0.55.001
Informing the region’s workforce development needs 7Population demographic
The Townsville SA4 region’s population is growing slower than the Queensland average.
The estimated resident population (ERP) for Townsville SA4 was 235,683 persons at 30 June
2017, with an average annual growth rate of 0.6 per cent over five years. Comparatively,
Queensland’s ERP at 30 June 2017 was 4,929,152 persons, with an annual average growth rate
of 1.5 per cent over the five years. 1
As at 30 June 2016, 18,008 persons (7.9 per cent) identified as Aboriginal peoples and Torres
Strait Islander peoples, higher than the Queensland average of 4 per cent. 2
Figure 2 shows that of the regions within the Townsville SA4, the largest contributor to
population at 30 June 2017 was Townsville (C) with an ERP of 192,988 persons, followed by
Burdekin (17,235); Charters Towers (11,968); Hinchinbrook (10,879) and Palm Island (2,613). 3
Figure 2 – Townsville SA4 ERP by LGA regions, 30 June 2017
250000 235,683
200000 192,988
150000
100000
50000
17,235
10,879 11,968
2613
0
Palm Island (S) Hinchinbrook (S) Charters Towers Burdekin (S) Townsville (C) Total
(R)
Source: ABS, 3218.0 – Regional Population Growth, Regions of Australia
According to the ABS 2016 Census, Townsville has a higher percentage of youth (0-14 years),
and a lower percentage of older persons (65 years and over) compared with Queensland.
Table 1 shows that as at 30 June 2016, 35.5 per cent of people in the Townsville LGA were
aged under 25, compared with the Queensland average of 32.9 percent, and 11.9 per cent
aged 65 years or more compared with the Queensland average of 15 per cent. 4
1 Australian Bureau of Statistics (ABS) 3218.0, Regional Population Growth, Australia, various editions http://www.abs.gov.au/AUSSTATS/abs@.nsf/DetailsPage/32 18. 02 016 -17? OpenDo cument
2 ABS 2016 Census Community Profiles, Aboriginal Peoples and Torres Strait Islander Peoples Profile, various editions
http://www.abs.gov.au/websitedbs/censushome.nsf/home/communityprofiles?opendocument&navpos=2 30
3 ABS 3218.0, Regional Population Growth, Australia, various editions http://www.abs.gov.au/AUSSTATS/abs@.nsf/DetailsPage/3 21 8.02 01 6-1 7?Open Document
4 ABS 3235, Population by Age and Sex, Regions of Australia, various additions http://www.abs.gov.au/AUSSTATS/abs@.nsf/DetailsPage/3 23 5.02 01 6?OpenDocument
8 Jobs Queensland Townsville Environmental Scan | February 2019Table 1: Estimated resident population by age, Townsville SA4, LGA and Queensland
SA4/LGA/State 0-14 years 15-24 years 25-44 years 45-64 years 65 + years
Number % Number % Number % Number % Number %
Townsville SA4 47539 20.1 35655 15.1 63575 27.0 57205 24.3 31889 13.5
Townsville LGA 39152 20.3 30545 15.8 54679 28.3 45618 23.6 22994 11.9
Queensland 967,026 19.6 654,532 13.3 1,349,993 27.4 1,216,179 24.7 741,422 15.0
Source: ABS 3235, Population by Age and Sex, Regions of Australia, various additions
As illustrated in Table 2, the median age for persons in Townsville LGA was 34.0 years in June
2017. This is somewhat lower than that of Queensland overall, with a median age of 37.1 years
as well as the median age of people in Townsville SA4 at 35.4 years.
Of note is the higher percentage of working age people (15–64 years) in Townsville LGA at 68
per cent, compared with Queensland as a whole with 64.7 percent, as well as a proportionally
lower percentage of mature age persons over the age of 65 compared with Queensland
overall.
With an ageing population being experienced in other regional areas and more broadly
nationally, the younger population demographic in Townsville LGA provides opportunities for
future workforce supply; in particular, a more youthful entrepreneurial mindset with the
potential to adapt more readily to transformative technologies. However, to take advantage
of the opportunities this younger cohort can bring, jobs will need to be accessible in the region
along with the right skills.
Table 2: Median age by gender, Townsville SA4, LGA and Queensland
SA4/LGA/State Persons % 0-14 years % 15-64 years % 65+ years
Townsville SA4 35.4 21.9 62.5 15.7
Townsville LGA 34.0 20.5 68.0 11.5
Queensland 37.1 22.3 64.7 13.0
Source: ABS 3235, Population by Age and Sex, Regions of Australia
Table 3 illustrates that the population for Townsville LGA is projected to grow to 282,281 by
2041, at an increase of 1.6 per cent per year over 25 years. This growth rate is comparative to
Queensland overall, where the population is also projected to increase by 1.6 per cent per
year over the same period. 5
According to economy.id, between 2011 and 2016 the highest in-migration for Townsville LGA
came from Mount Isa (C) with 1,105 persons, while the highest out-migration was 3,601 persons
leaving the region to relocate to Brisbane (C). 6
Table 3: Projected population growth, 2011 to 2036, Townsville SA4, LGA and Queensland
SA4/LGA/State 2016 2021 2026 2031 2036 2041
Townsville SA4 235,037 247,156 265,124 284,733 304,494 324,317
Townsville 192,058 240,262 222,284 242,032 262,105 282,281
Queensland 4,848,877 5,261,567 5,722,780 6,206,566 6,686,604 7,161,661
Source: QGSO, Queensland Government Population Projections, 2018 edition (medium series)
5 QGSO, Regional Profiles, various editions
6 id community, demographic resources, Townsville City Council, migration profile
Informing the region’s workforce development needs 9Table 4 illustrates that Townsville LGA has a median income of $36,556 per year, comparatively
higher than Queensland overall with $34,320 per year.
Modelling compiled by economy.id and derived from ABS, Census of Population and Housing
2016, data highlighted that 27.9 per cent of local workers in Townsville LGA are in the medium-
highest income quartile ($978 to $1508 per week), which is 2.9 per cent higher than
Queensland overall with 25 per cent in the same quartile. 7
Table 4: Total personal income by Townsville SA4, LGA and Queensland, 2016
SA4/LGA/State Less than $20,800-$51,999 $52,000-$103,999 $104,000 or Median
$20,800 more ($/year)
Number % Number % Number % Number %
Townsville SA4 51,063 27.9 59,052 32.2 43,678 23.8 10,662 5.8 34,944
Townsville 40,505 27.2 46,896 31.5 37,393 25.1 9,236 6.2 36,556
Queensland 1,074,683 28.4 1,249,382 33.0 841,717 22.2 269,288 7.1 34,320
NB – percentage is of total residents which includes personal income note stated
Source: ABS, Census of Population and Housing, 2016, General Community Profile – G02 and G17, various editions
Socio-Economic Indexes for Areas (SEIFA) is a summary measure of the social and economic
conditions of geographic areas across Australia. The index focuses on low income earners,
relatively lower education attainment, high unemployment and dwellings without motor
vehicles. Low index values (Quintile 1) represent areas of most disadvantage, and high values
(Quintile 5) represent areas of least disadvantage. This is based on ABS 2016 Census of
Population and Housing, persons by place of usual residence.
Table 5 illustrates the ranking for Townsville SA4 and LGA compared with Queensland.
Table 5: Population (%) by Index of Relative Socio-Economic Disadvantage quintiles, Townsville SA4, LGA and Queensland
SA4/LGA/State Quintile 1 Quintile Quintile Quintile Quintile 5
(most 2 3 4 (least
disadvantaged) disadvantaged)
Townsville SA4 24.4 28.0 19.8 14.1 13.7
Townsville 21.2 26.0 20.7 15.7 16.5
Queensland 20.0 20.0 20.0 20.0 20.0
Source: ABS 2033.0.55.001 Census of Population and Housing: Socio-Economic Indexes for Areas (SEIFA), Australia, 2016,
(Queensland Treasury derived)
Labour force profile
NB: Labour force statistics for LGA are updated quarterly (Small Area Labour Markets), while labour force statistics for SA4
level and Queensland are updated monthly (ABS Labour Force).
As at September 2018, there were 108,700 people employed in the Townsville SA4 region, with
a total labour force of 119,600. Total unemployed for September 2018 was 10,900 people with
an unemployment rate of 9.1 per cent, and a participation rate of 64.9 percent 8, compared
with Queensland’s unemployment rate of 6 per cent and participation rate of 65.8 per cent. 9
According to data from the Department of Jobs and Small Business, there were 10,339 people
registered with job active providers in the Townsville SA4 as at October 2018. Of these, 36 per
cent were Aboriginal peoples and Torres Strait Islander peoples.
7 id community, demographic resources, Townsville City Council, local workers individual income quartiles
8 ABS 6291.0.55.001, released 25 October 2018, 10:30am (AEST)
9 ABS 6202.0, released 18 October 2018, 10:30am (AEST)
10 Jobs Queensland Townsville Environmental Scan | February 2019As at October 2018, Townsville SA4 had a youth unemployment rate of 10.7 per cent 10 and job
active data indicates that 22 per cent of the caseload in Townsville is aged between 15 and
24 years of age. An additional 21 per cent of the job active caseload is aged 50 and over 11
suggesting that attraction and retention strategies may need to be targeted at both older
and younger cohorts.
Table 6 shows the labour force statistics for the Townsville LGA region over the five-year period,
June 2013 to 2018. From a low unemployment rate of 4.5 per cent in 2013, Townsville’s
unemployment rate increased to a high of 10.8 per cent in March 2017. 12 Since then, there
have been positive signs of labour force recovery with a 2 per cent decline in the
unemployment rate to 8.8 per cent in June 2018.
Table 6: Unemployment and labour force (a) LGA, five-year time series, June 2013 to 2018
Townsville LGA Labour force Employed Unemployed Unemployment rate
(number) (number) (number) (%)
June 2018 99,549 90,814 8,735 8.8
June 2017 91,519 83,032 8,487 9.3
June 2016 91,574 83,199 8,375 9.1
June 2015 100,777 92,583 8,194 8.1
June 2014 95,283 89,163 6,120 6.4
June 2013 101,340 96,822 4,518 4.5
Source: Australian Government Department of Jobs and Small Business, Small Area Labour Markets (SALM) Australia, various
editions
(a) Based on 4-quarter smoothed series.
The sharp rise in unemployment in Townsville from 2013 to 2017 can be attributed, in part, to
the flow-on impacts of the Resources sector slowdown on Townsville’s minerals processing,
Engineering and Support Services sector industries, as evidenced by the high profile closure of
the nickel refinery at Yabulu, just north of Townsville.
The 2 per cent decline in unemployment from the 10.8 per cent high in March 2017 could be
attributed to significant investment in infrastructure projects with flow-on benefits in positive
business sentiment and improved consumer confidence.
Disengaged youth and unemployment
Disengaged youth are defined as those who are 15-24-year-olds whose labour force status is
either ‘Unemployed’ or ‘Not in the labour force’, and who are not attending any form of
educational institution, either full or part-time.
People in this age group are generally expected to be starting out in life, either in employment
or looking for work, in full-time study, or a combination of both. However, in 2016, 12 per cent
(4,062 persons) of the Townsville SA4 population aged 15-24 years were unemployed or
attending an educational institution compared with11.5 per cent for Queensland. 13
At the time of the ABS 2016 Census, youth engagement in the Townsville SA4 region was
highest for those in the Employment Only category (33.2 per cent), followed by the Education
Only category (25.2 per cent) and the Education and Employment category (21.3 per cent). 14
As at October 2018, the youth unemployment rate for Townsville SA4 was 17.2 per cent, which
is a decline of 3.5 per cent for the 12 months October 2017 to October 2018. 15 This is the third
highest youth unemployment rate of the 19 SA4’s in Queensland and is 4.2 per cent higher
than the Queensland youth unemployment rate of 13 per cent in October 2018.
10 ABS, 6291.0.55.001 - RM1 - Labour force status by Age, Labour market region (ASGS) and Sex, October 1998 onwards
11 Department of Jobs and Small Business, Employment Regions Data, Townsville – Summary
12 Australian Government Department of Jobs and Small Business, Small Area Labour Markets (SALM) – June 2018
13 Department of Education and Training, 2017 School and Labour Market Profiles – Townsville SA4
14 Ibid
15 ABS 6291.0.55.001, released 22 November 2018
Informing the region’s workforce development needs 11While it is concerning that many 20.8in the Townsville SA4 are currently not engaged in either
education, training or employment, the creation of alternative programs that will support
transition to employment and/or further education will be crucial for the Townsville youth.
Employment by industry
Table 7 shows the employment by industry as at May 2018 (over a 5-year time series) for the
Townsville SA4 region. The statistics are sourced from LIMP, which are updated quarterly.
With the number of jobs in each industry changing over time, the structure of the local
economy is changing.
Table 7: Employment by industry, Townsville SA4, August 2018
Industry Aug Aug Aug Trend %
2013 2017 2018 change
Health Care and Social Assistance 15,400 15,800 20,900 35.7
Education and Training 8,300 8,000 12,600 51.8
Retail Trade 9,600 11,000 11,200 16.7
Public Administration and Safety 8,000 10,800 8,400 5.0
Construction 11,500 8,700 8,200 -28.7
Manufacturing 8,100 5,000 6,900 -14.8
Transport, Postal and Warehousing 7,100 6,800 6,800 -4.2
Accommodation and Food Services 7,900 9,800 6,500 -17.7
Other Services 4,800 3,900 5,100 6.3
Mining 6,200 2,200 4,100 33.9
Administrative and Support Services 4,100 3,300 3,100 24.4
Professional, Scientific and Technical Services 5,000 4,700 2,900 42.0
Agriculture, Forestry and Fishing 8,100 1,700 2,400 70.4
Wholesale Trade 3,300 2,900 2,200 -33.3
Arts and Recreation Services 1,500 2,000 2,200 46.7
Rental, Hiring and Real Estate Services 2,800 1,500 1,400 -50.0
Electricity, Gas, Water and Waste Services 1,300 1,000 1,300 0.0
Financial and Insurance Services 1,700 400 1,000 -41.2
Information Media and Telecommunications 1,600 2,000 900 -43.8
Source: LMIP, Employment by Industry Data, Time Series, August 2018
The top four industries by employment over the period August 2013 to 2018 are Health Care
and Social Assistance; Education and Training; Retail Trade; and Public Administration and
Safety with all showing employment growth over the 5-year period.
Of note is the decrease of 500 jobs in Construction and 1800 jobs in Professional, Scientific and
Technical jobs over the 12-month period, August 2017 to 2018. Conversely, Manufacturing had
an increase of 1900 jobs over the same period which may be attributed to a rebounding
resources sector and significant infrastructure projects in the region.
12 Jobs Queensland Townsville Environmental Scan | February 2019Employment by occupation
Employment by occupation is a key component for evaluating the socio-economic status of
the local workers and the skills required to work in each industry sector.
The occupations of the local workers in the Townsville SA4 region can be influenced by factors
including:
• economic base and employment opportunities available in the region
• age of the workforce
• skill and qualification level required to enter an industry
• working and social aspirations of the population.
Table 8 shows the employment by occupation for the Townsville SA4 region as at August 2018
Table 8: Employment by occupation, Townsville SA4, August 2018
Occupation Employed Employed Employed Employed Townsville Townsville
full-time part-time male female employment employment
by distribution
occupation (%)
total
Professionals 12,800 5,400 5,700 12,500 18,200 16.8
Technicians and 16,900 1,000 15,700 2,200 17,900 16.6
Trades Workers
Labourers 7,000 8,900 8,800 7,200 15,900 14.7
Community and 6,600 7,900 4,700 9,800 14,500 13.4
Personal Service
Workers
Clerical and 9,000 3,800 3,000 9,700 12,800 11.8
Administrative
Workers
Managers 9,100 900 6,100 3,800 9,900 9.2
Machinery Operators 7,700 1,800 8,400 1,100 9,500 8.8
and Drivers
Sales Workers 3,600 5,800 3,100 6,300 9,400 8.7
Source: LMIP, Employment by Occupation Data, August 2018
Key highlights that can be drawn from an analysis of employment by occupation include:
• Managers, Technicians and Trades Workers, and Machinery Operators and Drivers are
predominately full-time, and a higher proportion of the workforce is male.
• Community and Personal Service Workers, Clerical and Administrative Workers, and
Sales Workers are female dominant occupations.
Indigenous employment by occupation and industry
• At the time of the ABS 2016 Census, there were 3121 Aboriginal peoples and Torres Strait
Islander peoples employed in the Townsville LGA. Figure 3 illustrates that the five largest
occupations for Aboriginal peoples and Torres Strait Islander peoples in the Townsville
LGA workforce were Community and Personal Service Workers; Labourers; Clerical and
Administrative Workers; Professionals; and Technicians and Trades Workers, representing
75 per cent of the Indigenous workforce. 16
• Of all industries in the Townsville LGA, Figure 4 illustrates that in 2016 the top five
employing industries of Aboriginal peoples and Torres Strait Islander peoples were Public
Administration and Safety; Health Care and Social Assistance; Education and Training;
Accommodation and Food Services; and Retail, representing 62 per cent of the
Indigenous workforce in Townsville.
16 ABS, 2016 Census of Population and Housing, Place of Work (POW)
Informing the region’s workforce development needs 13Figure 3: Five largest Indigenous occupations, Townsville LGA, 2016
Top Indigenous occupations
800 721
700
600
500 448 445
397
400 352
300
200
100
0
Community and Labourers Clerical and Professionals Technicians and
Personal Service Administrative Trades Workers
Workers Workers
Figure 4: Largest industries employing Aboriginal peoples and Torres Strait Islander peoples, Townsville LGA, 2016
Top employing industries
539
1191
524
253 334
280
Public Administration and Safety Health Care and Social Assistance
Education and Training Accommodation and Food Services
Retail Trade Other
Source: ABS, 2016 Census of Population and Housing, Place of Work (POW)
Employment projections to May 2022
Anticipating Future Skills (AFS) modelling conducted by Jobs Queensland projected
employment in Townsville is forecast to expand by 7500 jobs over the forecast period 2017-22.
The two main determinants of regional forecasts are industry composition and regional
population growth. The population of Townsville is forecast to grow at an average annual rate
of 1.6 per cent, a similar growth rate to the state average. Consistent with this, at 1.5 per cent
per annum, employment growth in Townsville is similar to the state average of 1.5 per cent per
annum (Figure 5).
14 Jobs Queensland Townsville Environmental Scan | February 2019Figure 5: Average annual growth rate, 2017- 2022, Townsville SA4
1.80% 1.63% 1.63%
average annual growth rate,
1.54% 1.55%
1.60%
1.40%
1.20%
2017-2022
1.00%
0.80%
0.60%
0.40%
0.20%
0.00%
R39 Qld Townsville Queensland average
Population Employment
Source: Jobs Queensland, Anticipating Future Skills, Employment forecasts for Townsville SA4, June 2018
The majority of net growth in jobs in Townsville will be in Health Care and Social Assistance,
accounting for 40 per cent of growth, well in excess of the state average. This reflects the
relatively high concentration of employment in the sector in Townsville. Other significant
contributors to growth at the state level, including Professional, Scientific and Technical
Services, and Education and Training, are also significant contributors to growth in Townsville.
Vacancies
The vacancy statistics (Table 9) refer to the Far North Queensland region as defined by the
Department of Jobs and Small Business and are derived from online job advertisements newly
lodged on SEEK, CareerOne and Australian JobSearch each month. 17
For the 12 months July 2017 to 2018 there was on average of 4336 vacancies per month. The
top six vacancy occupational groups by Australian and New Zealand Standard Classification
of Occupations (ANZCO) title for the period (monthly averages) were:
Table 9: Online Job Advertisements, Far North Queensland, July 2017-2018
ANZCO Title Monthly average Total
July 2017-18 July 2017-18
Technicians and Trades Workers 915 88,340
Professionals 878 86,201
Clerical and Administrative Workers 515 53,707
Labourers 436 50,490
Machinery Operators and Drivers 412 38,641
Automotive and Engineering Trades Workers 375 31,615
Far North Queensland Total 4,336 429,216
Source: LMIP, Vacancy report, IVI Regional Data, May 2010 onwards
NB: The Far North Queensland region as defined by the Commonwealth Department of Jobs and Small Business
encompasses the Townsville SA4 north to Cape York and the Torres Strait Islands. Regional IVI data should therefore be
treated as indicative and not definitive of labour demand for the Townsville region.
17 LMIP, Vacancy report, IVI Regional Data, May 2010 onwards http://lmip.gov.au/default.aspx?LMIP/GainInsights/VacancyReport
Informing the region’s workforce development needs 15Business and industry profile
Registered businesses by industry
Registered businesses by industry show how many businesses are in the Townsville SA4 and LGA
compared with Queensland by percentage. The number of businesses in the region should be
viewed in conjunction with employment by industry to get a better understanding of the
relative size of businesses within the industry.
Table10 illustrates the number of registered businesses by industry in the Townsville SA4 and
LGA, as well as the proportion when compared with Queensland.
The industries in bold font are those industries where the Townsville LGA or SA4 has a greater
proportion of businesses than Queensland as a whole. Construction has the greatest number
of businesses within the region. However, Health Care and Social Assistance is the largest
employing industry, employing 20,900 people. 18
Table 10: Registered businesses by industry, Townsville SA4, LGA and Queensland, 2016-17
Industry Townsville SA4 Townsville LGA QLD
No. % No. % % only
Construction 2,933 18 2,477 21 17.2
Agriculture, Forestry and Fishing 2,772 17 473 3.9 9.4
Rental, Hiring and Real Estate Services 1,653 9.9 1,344 11 11.6
Professional, Scientific and Technical Services 1,280 7.7 1,153 9.6 11
Health Care and Social Assistance 1,123 6.7 936 8.2 5.7
Transport, Postal and Warehousing 1,050 6.3 859 7.2 6.3
Other Services 1,009 6.1 809 6.7 4.7
Financial and Insurance Services 973 5.8 791 6.6 8.3
Retail Trade 955 5.7 731 6.1 5.7
Accommodation and Food Services 734 4.4 590 4.9 4
Administrative and Support Services 537 3.2 467 3.9 3.9
Manufacturing 536 3.2 406 3.4 3.7
Wholesale Trade 320 1.9 265 2.2 3
Education and Training 225 1.4 179 1.5 1.4
Not Classified 175 1.1 146 1.2 1.2
Arts and Recreation Services 132 0.8 122 1 1.1
Mining 107 0.6 69 0.6 0.4
Electricity, Gas, Water and Waste Services 35 0.2 33 0.3 0.3
Public Administration and Safety 31 0.2 39 0.3 0.3
Information Media and Telecommunications 81 0.1 66 0.5 0.7
Source: ABS 8165.0, Counts of Australian Businesses, including Entries and Exits, various editions
18 LMIP, Employment by Industry Data, Time Series, August 2018
16 Jobs Queensland Townsville Environmental Scan | February 2019Registered businesses by employment size
There were 12,009 businesses in the Townsville LGA, and 16,661 businesses in Townsville SA4 at
the end of June 2017 (Table 11). Townsville SA4 and LGA have a larger proportion of
employing businesses than across Queensland as a whole. Small and medium businesses
make up 41.4 and 43 percent of employers in the region respectively.
Table 11: Registered businesses by employment size, Townsville SA4, LGA and Queensland, 2016-17
SA4/LGA/State Sole Trader 1–4 employees 5–19 20–199 200+ Total
employees employees employees
No. % No. % No. % No. % No. %
Townsville SA4 9,741 58.5 4,446 26.7 2,019 12.1 437 2.6 9 0.1 16,661
Townsville 6,839 56.9 3,275 27.3 1,541 12.8 346 2.9 6 0 12,009
Queensland 270,595 61.8 114,500 26.2 41,478 9.5 10,442 2.4 626 0.1 437,640
Source: ABS 8165.0, Counts of Australian Businesses, including Entries and Exits, various editions
Education and training profile
The following section looks at the educational and qualification attainment for Townsville.
Highest level of schooling
At the time of the ABS 2016 Census, Townsville’s LGA of 4.8 per cent had a smaller proportion
of people that Did not go to school, or Year 8 or below, compared with Queensland’s 5.4 per
cent (Table 12). Additionally, 55.3 per cent of people in Townsville SA4 completed Years 11 or
12 or equivalent level of schooling in 2016, compared with 58.9 per cent in Queensland.
Table 12: Highest level of schooling completed, Townsville SA4, LGA and Queensland, 2016
SA4/LGA/State Did not go to school, Year 9 or 10 or Year 11 or 12 or Total(a)
or Year 8 or below equivalent equivalent
Number % Number % Number % Number
Townsville SA4 10,556 6.0 50,527 28.6 97,173 55.3 175,740
Townsville 6,902 4.8 38,442 26.9 83,455 58.4 143,006
Queensland 196,488 5.4 964,903 26.5 2,146,809 58.9 3,643,834
(a) Includes highest year of schooling not stated
Source: ABS, Census of Population and Housing, 2016, General Community Profile - G16
Non-school qualification
Table 13 shows that with 56 per cent, Townsville LGA has a lower percentage of people with a
non-school qualification than Queensland overall with 59.1 per cent. Of note is that Townsville
has a lower percentage of people with a Bachelor degree or higher, however, it has a higher
percentage of people with a Certificate level qualification than Queensland overall.
Table 13: Non-school qualifications (a), Townsville SA4, LGA and Queensland, 2016
SA4/LGA/State Level of education Persons with a Total
Bachelor degree Advanced Certificate (c) qualification (d) persons
or higher (b) Diploma or
Diploma
Number % Number % Number % number % number
Townsville SA4 26,053 14.2 13,339 7.3 42,356 23.1 102,558 56.0 183,253
Townsville 23,419 15.7 11,677 7.8 37,767 23.3 86,453 58.0 149,046
Queensland 693,410 18.3 330,619 8.7 807,105 21.3 2,241,124 59.1 3,790,497
Source: ABS, Census of Population and Housing, 2016, General Community Profile - G40 and G46En
(a) Includes persons aged 15 years and over with a qualification within the scope of the Australian Standard Classification of
Education.
(b) Includes bachelor degree, graduate diploma, graduate certificate and postgraduate degree.
(c) Includes Certificate, I, II, III and IV and Certificates not further defined responses.
(d) Includes inadequately described and not stated level of education responses.
Informing the region’s workforce development needs 17Apprenticeships and traineeships
Apprenticeship commencements fell from 714 to 538 in the four years 2013 to 2016 while
traineeship commencements fell from 1001 to 522 for the same period. However, traineeship
commencements increased by 164 between 2016 and 2017, while apprenticeships grew by
151 over this period (Figure 6).
Figure 6: Apprenticeship and traineeship commencements, Townsville LGA, 2013-17
Commencements, Apprenticeships and
1200
Traineeships, 2013-17
1000
800
600
400
200
0
2013 2014 2015 2016 2017
Apprenticeships Traineeships
Source: Department of Small Business and Training 2017, Direct Entry-Level Training Administration (DELTA) database,
Queensland
Of all apprenticeship commencements, 199 were Automotive and Engineering Trades
Workers, while Construction Trades Workers made up 140 commencements. Electrotechnology
and Telecommunications Trades Workers had the third highest commencement rate with 127,
followed by Other Technicians and Trades Workers with 68, and Food Trades Workers with 60
(Figure 7).
Figure 7: Apprenticeship commencements by occupation, Townsville LGA, 2017
Top 5 apprenticeship commencements by
occupation, Townsville LGA, 2017
60
Food Trades Workers
68
Other Technicians and Trades Workers
Electrotechnology and Telecommunications 127
Trades Workers
140
Construction Trades Workers
199
Automotive and Engineering Trades Workers
0 50 100 150 200 250
Source: Department of Small Business and Training 2017, Direct Entry-Level Training Administration (DELTA) database,
Queensland
18 Jobs Queensland Townsville Environmental Scan | February 2019Of all traineeship commencements, General Clerical Workers had the highest
commencement rate with 167, while Sales Assistants and Sales Workers made up over 100
commencements. Carers and Aides together with Hospitality Workers were equal third highest
with 81, followed by Mobile Plant Operators with the least number of commencements of 39
(Figure 8).
Figure 8: Traineeship commencements by occupation, Townsville LGA, 2017
Top 5 traineeship commencements by occupation,
Townsville LGA, 2017
Mobile Plant Operators 39
Hospitatlity Workers 81
Carers and Aides 81
Sales Assistants and Sales Workers 103
General Clerical Workers 167
0 50 100 150 200
Source: Department of Small Business and Training 2017, Direct Entry-Level Training Administration (DELTA) database,
Queensland
Vocational education and training investment/participation 19
In 2016-17, a total of 12,633 students enrolled in a publicly funded VET qualification in the
Townsville region, while 5551 students completed a qualification during this period.
Total funds expended under the User Choice program in 2016-17 was $6,773,668, while under
Certificate 3 Guarantee (C3G) $13,625,998 was expended, giving total expenditure of
$20,399,666 in the Townsville region.
A breakdown of enrolments and completions in the Townsville region over the 2014-15, 2015-16
and 2016-17 financial years is provided in Table 14.
Table 14: Enrolment and Completions, Townsville SA4
LGA 2014-15 2015-16 2016-17 Total Total Total
Enrols Completions Investment
Enrols Completions Enrols Completions Enrols Completions
Townsville 12,528 5,424 12,576 6,303 12,633 5,551 37,737 17,278 $62,465,871
Source: Department of Employment, Small Business and Training, Regional Skills Investment Strategy – Region Overview:
Townsville
Vocational education and training supply 20
Analysis of Department of Employment, Small Business and Training (DESBT) data identified in
2016-17 the top five Industry Training Groups for student enrolments in the Townsville region
were General Education & Training (Foundation); Hospitality (General); Community Services
(General); Business (General); and Health (General).
19 Department of Employment, Small Business and Training, Regional Skills Investment Strategy – Region Overview: Townsville
20 Ibid
Informing the region’s workforce development needs 19Of note is an increase in enrolments over the past three financial years in Health (General),
Mining (General) and Tourism (General), with a significant increase in enrolments in
Community Services (General) with enrolments doubling since 2014-15.
A decline in enrolments occurred in Business (General) and Construction (General). There was
a significant decline in Community Services (Aged Care), however, this may be attributed to
the superseding of the Certificate III in Aged Care qualification by Certificate III in Individual
Support.
Also of note is a significant decline in enrolments in Transport & Distribution (General, Road and
Warehousing).
Table 15 provides a breakdown of all enrolments and completions by Industry Training Group
for the 2014-15, 2015-16 and 2016-17 financial years:
Table 15: Enrolment and Completions by Industry Training Groups
Industry Training Group 2014-2015 2015-2016 2016-2017
Enrolments Awards Enrolments Awards Enrolments Awards
Arts & Entertainment – 73 21 43 25 47 18
Creative
Arts & Entertainment – 12 8 7 2 3 2
Entertainment
Arts & Entertainment – 14 7 11 8 4 4
General
Arts & Entertainment – 3 2 0 0 0 0
Graphic
Automotive – General 529 169 544 263 421 168
Business – Finance 34 10 63 16 92 18
Business – General 1,192 637 1,068 683 991 438
Business – Property 13 9 67 28 70 68
Services
Business – Security 243 197 338 187 316 193
Communications – 28 45 0 1 0 0
General
Communications – 141 25 178 88 149 82
Information Technology
Community Services – 433 278 446 365 66 55
Aged Care
Community Services – 543 236 496 158 634 107
Childcare
Community Services – 510 268 634 293 1,069 448
General
Construction – Civil 313 188 222 84 169 63
Construction – General 762 179 890 312 645 185
Construction – Off Site 6 3 4 1 9 1
Engineering –Aviation 4 2 1 1 1 0
Engineering – General 725 216 590 243 727 282
Food Processing – 19 4 29 9 20 4
Baking
Food Processing – 64 64 4 4 13 12
General
Food Processing – Meat 76 25 69 29 46 14
Furnishing – Floor 3 2 2 0 2 0
Furnishing – General 53 22 142 18 133 10
Furnishing – Glass 21 5 19 8 9 2
General Education & 1,141 117 1,113 292 1,177 421
Training – Foundation
General Education & 476 112 412 144 774 112
Training – General
Government – General 74 60 80 35 35 20
Health – General 563 221 604 576 803 596
Hospitality – General 1,148 331 1,390 460 1,137 471
20 Jobs Queensland Townsville Environmental Scan | February 2019Industry Training Group 2014-2015 2015-2016 2016-2017
Enrolments Awards Enrolments Awards Enrolments Awards
Laboratory Operations – 27 22 12 6 17 8
General
Mining – General 347 152 597 598 611 463
Primary Industry – 106 56 151 39 199 87
Agriculture
Primary Industry – 2 0 2 2 0 0
Forestry
Primary Industry – 72 45 87 54 122 96
Horticulture
Primary Industry – Land 45 28 48 15 55 30
Management
Process Manufacturing – 38 25 39 42 85 71
General
Process Manufacturing – 42 6 25 0 4 0
Plastics
Retail – General 206 91 216 91 234 85
Retail – Personal 301 114 312 94 345 106
Services
Sports & Recreation – 40 14 74 38 65 13
Fitness
Sports & Recreation – 5 6 2 2 75 43
General
Sports & Recreation – 1 1 0 0 0 0
Racing
Sports & Recreation – 1 0 4 4 1 0
Sport
Textile, Clothing & 2 0 10 1 10 7
Footwear – General
Tourism – General 63 24 161 94 184 122
Transport & Distribution – 0 0 5 0 23 8
Aviation
Transport & Distribution – 146 107 126 105 37 34
General
Transport & Distribution – 36 47 23 22 86 94
Marine
Transport & Distribution – 67 3 46 4 50 1
Rail
Transport & Distribution – 498 361 332 342 151 133
Road
Transport & Distribution – 621 608 172 156 43 17
Warehousing
Utilities – 609 242 625 231 593 245
Electrotechnology
Utilities – Gas 3 0 3 2 3 0
Utilities – General 11 6 23 27 29 80
Utilities – Water 20 3 15 1 15 14
12,525 5,424 12,576 6,303 12,599 5,551
Legend: BOLD = Top 5 Industry Training Increased Decreased
Groups enrolments
Source: Department of Employment, Small Business and Training, Regional Skills Investment Strategy – Region Overview:
Townsville
Informing the region’s workforce development needs 21Regional skills profiles by industry
Leveraging from the Townsville City Deal and incorporating Townsville City Council’s Economic
Development Plan and demand for higher skill sets to build industry and workforce
development opportunities, this environmental scan will inform the regional Workforce
Development Plan in the Townsville LGA. Following consultation with Townsville City Council,
the focus industries for this report are:
• Education and Training
• Health and Social Assistance
• Manufacturing
• Mining
• Professional, Scientific and Technical Services
• Transport, Postal and Warehousing.
The research and analysis used to compile this environmental scan will identify those industries
which present the biggest need in relation to workforce planning and development and be
used to inform the Townsville Workforce Development Plan. The Workforce Development Plan
will include an in-depth profile of featured industries. A set of clear, realistic and actionable
recommendations and possible actions will be provided for Government, Industry and/or other
relevant stakeholders in the region to address identified current and future workforce issues of
the featured industries.
22 Jobs Queensland Townsville Environmental Scan | February 2019Education and Training The Education and Training division includes units mainly engaged in the provision and support of education and training. Education and Training services are provided by specialised units such as preschools, schools, technical colleges, training centres and universities. 21 The Education and Training sector is the fourth largest employer and the second fastest growing industry in Queensland. For Townsville SA4, Education and Training is the second largest employer making 11.7 per cent of the total regional workforce. 22 Townsville has a world-class concentration of education, training and research facilities. Key capabilities are based on James Cook University (JCU), Central Queensland University (CQU), the Townsville Hospital and Health Service (THHS), Technical and Further Education (TAFE) Queensland and numerous private Registered Training Organisation’s (RTO’s), Tec-NQ, the Australian Institute of Marine Science (AIMS) and the Commonwealth Scientific and Industrial Research Organisation (CSIRO). As at February 2018, there were 102 primary and secondary state and non-state schools in Townsville SA4. Of these, 66 per cent are state schools with just over one-third (34 per cent) of state schools within Townsville SA4 based in the Townsville LGA. Table 16 shows that the average class size for Townsville SA4 is similar to that of Queensland overall. 23 Table 16: Average class size by geographic region, 2018 SA4/State Prep – year 3 Years 4 – 6 Years 7 – 10 Years 11 and 12 Townsville SA4 21.0 24.4 22.0 17.0 Queensland 22.2 24.9 22.5 17.0 Source: Department of Education, Strategy and Performance JCU which ranked in the top 15 of Australia’s tertiary institutions in 2018 24, is the second oldest university in Queensland and Australia’s leading university in the tropics. Total student enrolments are more than 22,000 including over 7500 international students from more than 100 nationalities. Bachelor, Master and PhD courses are available in addition to English language and academic pathways. 25 CQU offers flexible study options including VET and tertiary studies, practical learning experiences and pathway options. CQU is ranked in the top 150 universities for under 50-year- olds by the Times Higher Education World University Rankings. 26 TAFE Queensland has campuses located in Townsville (Aitkenvale, Pimlico and Bohle); Palm Island; Burdekin; Charters Towers; and Ingham, offering courses ranging from entry-level skill sets and certificates through to high-level diplomas. The range of study areas offered include automotive; beauty and hairdressing; building and construction; business; child care; community services; electrotechnology and utilities; engineering; general education and training; horticulture; hospitality and cookery; information technology; nursing and health; tourism; resources and infrastructure; and visual arts. As the state’s fourth largest export sector (and second largest services export), international education and training is a major contributor to the Queensland economy. The most readily measurable component of the sector’s economic contribution to the Queensland economy is the activity generated by international students on student visas studying in Queensland. 21 Description of industry compiled using information from ABS, 1292.0 - Australian and New Zealand Standard Industrial Classification (ANZSIC), 2006 (Revision 2.0) 22 ABS, 6291.0.55.003 - Labour Force, Australia, Detailed, Quarterly, Aug 2018 23 Department of Education, Strategy and Performance, School Statistics 24 Academic Ranking of World Universities (ARWU), Australia, 2018 25 Study Townsville http://www.studytownsville.com.au/study-page/university 26 Ibid Informing the region’s workforce development needs 23
Modelling by Deloitte Access Economics indicates that, in 2015, the combined $2.9 billion of
expenditure by these students contributed $2.3 billion in total value added to the Queensland
economy, supporting around 18,651 full-time equivalent (FTE) jobs. 27
The number of onshore international enrolments in Queensland is projected to increase by 33
per cent by 2026, which would see an estimated 150,600 students enrolled across the state.
This growth is estimated to result in international student expenditure rising to $4.6 billion in
2026. 28 Townsville is attracting increasing numbers of international students with revenue
increasing by 30 per cent between 2016 and 2017; the region's export revenue growing to $84
million in 2017; and employment increasing by 31 per cent to 353 jobs. 29
Significant projects and initiatives either proposed, planned or underway in Townsville include:
          •    CBD educational precinct
          •    JCU Masterplan (Discovery Rise)
          •    North Queensland Academic Health Hub.

These initiatives will increase the capability for international education and training enrolments,
which will in turn, further increase this sector’s direct contribution to the regional economy, as
well as in other industry sectors such as Tourism.
Townsville is ideally suited as an Edu-tourism destination with the diversity for experimental
learning in the tropics. Environmentally the region is a gateway to the World Heritage listed
Great Barrier Reef; tropical islands; wet tropics rainforests; national parks; Ramsar wetlands of
international importance; and Australian outback experiences. There is also a rich Indigenous
culture with connections to both land and sea country. 30
Through a combination of international education and tourism representation, the Townsville
North Queensland Edu-Tourism Consortium is made up of members from research institutions
(JCU and AIMS), a natural resource management agency (The Great Barrier Reef Marine Park
Authority) and high standard, nature based, experimental learning facilitators. Additionally,
Townsville is home to Reef HQ Aquarium, which is the Australian Government’s National
Education Centre for the Great Barrier Reef and the world’s largest living coral reef aquarium.
Members of the North Queensland Edu-Tourism Consortium work together to develop
specialised programs to meet teaching, learning and experience requirements. Examples of
previous programs can be found at http://www.studytownsville.com.au/wp-
content/uploads/1748-5432-Edutourism-Brochure_V3.pdf.

Registered businesses
Table 17 illustrates that at 30 June 2017, 1.4 per cent (225) of registered businesses in Townsville
SA4 were in Education and Training. Between 2014-15 and 2016-17 the share of Education and
Training businesses decreased by 3 per cent (7 businesses) compared with a 7.3 per cent
increase (411) for Queensland. 31
Table 17: Registered businesses by industry, Townsville SA4, LGA and Queensland

  SA4/LGA/State                                                          Number                           %
  Townsville SA4                                                         225                              1.4
  Townsville                                                             179                              1.5
  Queensland                                                             6,006                            1.4
Source: ABS 8165.0, Counts of Australian Businesses, including Entries and Exits, various editions

27 Deloitte Access Economics, Queensland Business Outlook, Targeting our advantage, December 2016

28 Ibid

29 Queensland Parliament, Record of Proceedings, International Education, 4 September 2018

30 Study Townsville, Edutourism http://www.studytownsville.com.au/study_category/edutourism

31 ABS 8165.0, Counts of Australian Businesses, including Entries and Exits, various editions

24            Jobs Queensland                                                                       Townsville Environmental Scan | February 2019
You can also read