Local Workforce Development Board Plan Program Years 2021-2024
←
→
Page content transcription
If your browser does not render page correctly, please read the page content below

Local Workforce Development Board Plan
         Program Years 2021–2024

Workforce Solutions for North Central Texas is an equal opportunity employer/program. Auxiliary aids and services are available
upon request to individuals with disabilities. For the hearing impaired, call TDD 1-800-735-2989 or VOICE 1-800-735-2988. For more
                                                  information, visit www.dfwjobs.com.

This workforce product was funded by a grant awarded by the U.S. Department of Labor’s Employment and Training Administration.
The product was created by the recipient and does not necessarily reflect the official position of the U.S. Department of Labor. The
Department of Labor makes no guarantees, warranties, or assurances of any kind, express or implied, with respect to such information,
including any information on linked sites and including, but not limited to, accuracy of the information or its completeness, timeliness,
       usefulness, adequacy, continued availability, or ownership. This product is copyrighted by the institution that created it.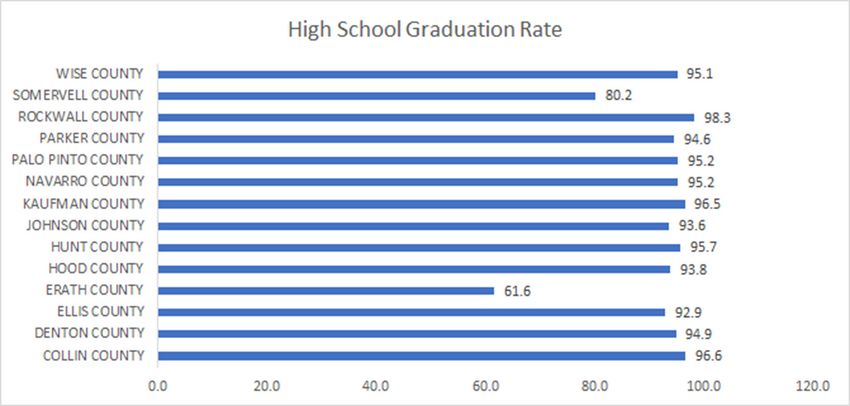
Local Workforce Development Board
  Plan Program Years 2021–2024

Table of Contents
Introduction................................................................................................... 1
Instructions for Completing the Board Plan Template.................................... 1
Part 1: Board Vision and Strategies............................................................... 1
  A. Vision and Goals...................................................................................................................... 1
  B. Board Strategies....................................................................................................................... 3
  C. High-Performing Board........................................................................................................... 5
Part 2: Economic and Workforce Analysis...................................................... 6
  A. Regional Economic and Employment Needs Analysis..................................................... 6
  B. Knowledge and Skills Analysis............................................................................................ 20
  C. Labor Force Analysis and Trends....................................................................................... 23
  D. Workforce Development Analysis....................................................................................... 29
Part 3: Core Programs................................................................................. 34
  B. Core Programs—Expand Access, Facilitate Development, and Improve Access...... 39
Part 4: One-Stop Service Delivery................................................................ 41
  A. One-Stop Service Delivery System...................................................................................... 41
  B. Cooperative Agreements...................................................................................................... 44
  C. Employer Engagement, Economic Development, and Unemployment Insurance
  Program Coordination............................................................................................................... 44
  D. Coordination of Wagner-Peyser Services......................................................................... 47
  E. Integrated, Technology-Enabled Intake and Case Management.................................. 48
Part 5: Workforce Investment Activities....................................................... 48
  A. Economic Development and Entrepreneurial/Microenterprise Activities................... 48
  B. Rapid Response Activity Coordination............................................................................... 49
  C. Youth Activities and Services.............................................................................................. 50
  D. Coordination with Secondary and Postsecondary Education Programs................... 52
  E. Child Care and Early Learning.............................................................................................. 52
  F. Transportation and Other Support Services...................................................................... 53
  G. Coordination of Adult Education and Literacy (AEL)...................................................... 54
Part 6: Adult, Dislocated Workers, and Youth Services................................. 55
  A. Adult and Dislocated Worker Employment and Training............................................... 55
  B. Priority to Recipients of Public Assistance and Low-Income Individuals................... 57
Part 7: Fiscal Agent, Grants, and Contracts.................................................. 58
  A. Fiscal Agent............................................................................................................................. 58
  B. Sub-Grants and Contracts.................................................................................................... 59
Part 8: Performance.................................................................................... 60
  A. Board Performance Targets................................................................................................ 60
Part 9: Training and Services....................................................................... 61
  A. Individual Training Accounts (ITAs).................................................................................... 61
  B. ITA Limitations........................................................................................................................ 61
Part 10: Apprenticeship............................................................................... 62
  A. Registered Apprenticeship Programs................................................................................ 62
  B. ApprenticeshipTexas............................................................................................................. 62
Part 11: Public Comment............................................................................. 63
Appendix: Texas Workforce Investment Council Requirements ................... 64
Local Workforce Development Board Strategic Planning.............................. 64
  Focus on Employers.................................................................................................................. 64
  Engage in Partnerships............................................................................................................. 65
  Align System Elements.............................................................................................................. 67
  Improve and Integrate Programs............................................................................................ 67
Introduction
Under the Workforce Innovation and Opportunity Act (WIOA) §108 (20 Code of Federal Regulations
§679.500–580), each Local Workforce Development Board (Board) is required to develop and
submit to the state a comprehensive four-year plan (Board Plan) that identifies and describes
policies and procedures as well as local activities that are in line with the State Plan. This Board
Plan must be developed openly and be available to the public for comment for at least 15 days,
but no more than 30 days, particularly to members of the business and educational communities
as well as various other labor organizations. Along with submission of the Board Plan to the Texas
Workforce Commission (TWC), the Board must submit all public comments of disagreement with
the plan to TWC.

At the end of the first two-year period, the appropriate chief elected officials (CEOs) and the Board
will review the local plan and prepare and submit modifications to reflect changes in the labor
market and economic conditions, factors affecting the implementation of the plan, changes in
financing, changes to the structure of the Board, and/or the need to revise strategies to meet local
performance goals.

Instructions for Completing the Board Plan Template
Answer each part and section separately and do not combine sections. If the same response is
used for multiple sections, please repeat the response. For example, do not state “See Section
2.B.” as the response.

When developing the Board Plan, use the checklist and elements provided in Attachment 2 to
ensure that the questions are thoroughly addressed.

Do not provide separate additional attachments.

For example: If it is important that additional data, map, or some other attachment, appendix,
or additional content be submitted with your plan, please attach it to the plan and reference the
attachment in the appropriate places in the plan.

Part 1: Board Vision and Strategies
The strategic elements of the Local Workforce Development Board Planning Guidelines
(Guidelines) are as follows:

A. Vision and Goals

(WIOA §108(b)(1)(E); 20 CFR §679.560(a)(5))

Boards must include a description of the Board’s strategic vision to support regional economic
growth and economic self-sufficiency. The description must include:

•   goals for preparing an educated and skilled workforce, including early education services,
    and services for youth and individuals with barriers to employment; and

WD Letter 18-20, Attachment 2                   •1•
The mission of Workforce Solutions for North Central Texas (WSNCT) is “to advance
business driven solutions that promote economic growth, opportunity, and a skilled
workforce,” leading to our vision of being “the recognized leader in building tomorrow’s
workforce.” Every building block of our organization is constructed upon our values:
■ Inclusion
Leverage our collective genius.
We value diversity and believe inclusion drives innovation and connects us closer to
the communities we serve. We are building a culture where difference is valued and
respected.
■ Community
We’re in this together.
We create positive opportunities by collaborating with our partners to transform the
social and economic vitality of those we serve.
■ Leadership
Courage to shape a better future.
We lead by example because everyone has ability to pursue excellence and make a
positive impact.
■ Trust
Operate with integrity and respect.
We say what we mean, keep our promises and stay open minded to new ideas.
The North Central Texas Workforce Development Board is the governing body for the North
Central Texas Workforce Development Area (WDA), providing mission-based leadership
and strategic governance. The Board has identified the following key priorities in support
of preparing an educated and skilled workforce, including early education services, and
services for youth and individuals with barriers to employment:
■ Community Partnerships: Achieving ambitious workforce and economic goals will
require cross-sector partnerships that create innovative solutions for workers and break
down silos between organizations. WSNCT will cultivate partnerships at both strategic
and operational levels in order to build awareness of programs, share information, and
leverage public and private resources to meet goals.
■ Career Exploration: Opportunities to broaden career awareness and exploration
can better connect youth and adults to in-demand jobs as well as fulfill the needs of
employers. WSNCT will support career exploration opportunities that equip workers
with the skills and knowledge required for success in a rapidly changing and digitally
driven economy.
■ Child Care Quality: Improving the quality of child care in the 14-county North Central
Texas Workforce Development Area is critical to preparing children for school and
supporting their parents in their own learning and development. WSNCT believes
that high-quality child care leads to greater school readiness, long-term educational
attainment, and 2-generation economic prosperity.
• goals relating to the performance accountability measures based on performance
indicators described in WIOA §116(b)(2)(A).
WD Letter 18-20, Attachment 2 •2•Performance improvement continues to be a priority for WSNCT. Our workforce system
incorporates strategies and processes which closely monitor service delivery and
performance (including the mandated performance measures) to identify areas needing
improvement. We deploy a systematic approach to review data/performance indicators,
provide program oversight and technical assistance, as well as monitor activities based on
elements outlined in our Quality Assurance risk assessment.
B. Board Strategies
(WIOA §108(b)(1)(F); 20 CFR §679.560(a)(6))
Boards must include a description of the Board’s strategy to work with the entities carrying
out the core programs and with the required partners to align resources available to the local
workforce development area (workforce area) to achieve the vision and goals.
The Board administers and provides oversight to a competitively procured Workforce
Subrecipient that is responsible for direct service delivery of core programs and the
coordination of related, and possibly co-located, programs not administered by the Board.
Services provided by the Subrecipient include service delivery strategies to employers
and career seekers who are able to access a continuum of services through 12 workforce
centers located throughout the WDA. Our Workforce Subrecipient is capable of delivering
fully integrated and leveraged workforce services, including WIOA Adult, Youth and
Dislocated Worker services, TANF/Choices, Non-Custodial Parent Choices (NCP Choices),
Supplemental Nutrition Assistance Program Employment and Training (SNAP E&T), Child
Care Assistance, Employer Services, Vocational Rehabilitation Services, Veteran Services,
and Trade Adjustment Assistance.
WSNCT ensures that multiple levels of services are offered to employers and career seekers,
and Wagner-Peyser Employment Services (ES) is among the services available. In 2003,
the Texas Workforce Commission (TWC) implemented the Texas Model for the delivery
of ES services. Under the Texas Model, TWC maintains administrative responsibility while
the Workforce Subrecipient has responsibility for day-to-day guidance of state ES staff.
The Workforce Subrecipient shares responsibility for directing daily work assignments,
assigning individual performance goals, coordinating hiring, initiating disciplinary action
and evaluating staff performance. All direction and guidance given to ES employees is
consistent with the provisions of state and federal laws, rules and regulations governing
the administration and delivery of the ES program. TWC provides technical support and
quality assurance to the WSNCT Workforce Subrecipient through local Integrated Service
Area Managers. The WSNCT Workforce Subrecipient coordinates with ES staff to provide
universal access to job search and placement assistance, job referrals, labor market
information and an array of other services to both career seekers and employers.
WSNCT recognizes the correlation between economic development, employment
opportunity and sustainability. WSNCT actively engages with the regional economic
developers to devise and implement strategies that meet the specific skill demands of
local employers and equipping career seekers with the necessary skill sets to meet that
demand. Our primary objective is to enhance and sustain economic vitality and employment
opportunities in our region. WSNCT’s regional partnerships allow us to develop, implement,
and refine programs and services that more closely align with the employment and skills
WD Letter 18-20, Attachment 2 •3•training needs of the North Central Texas region. We will maintain our strategic alliances
with workforce/economic development organizations to keep pace with the evolving
economy, identify job growth, and develop a well-trained and prepared workforce to meet
local employer needs.
The development and expansion of apprenticeship programs is embedded into one
of the Board’s key priorities and will remain a focus for WSNCT going forward. The
Apprenticeship Navigator and WSNCT staff will continue to support the development of
new Registered Apprenticeship (RA) programs as well as the expansion of existing RA
programs through targeted industry outreach supported by labor market data, roundtable
collaborations with community partners and stakeholders, and employer needs. Through
engaging with employers, gathering local wisdom and analyzing labor market data,
WSNCT will identify where training gaps and common industry needs exist and position
the Board to address specific employer needs. WSNCT will develop employer consortiums
where occupational skill sets and training overlap. In addition to employer engagement,
WSNCT has partnerships with community and technical colleges, economic development
organizations, and a solid relationship with the regional Department of Labor Registered
Apprenticeship representatives. These collaborations will continue to help employers
navigate through the apprenticeship development journey.
WSNCT continues to expand integration and co-location efforts with Vocational
Rehabilitation Services (VRS) to enable WSNCT and VRS to leverage resources and better
serve our shared customers. WSNCT became one of the first Board areas to fully integrate
VRS into a workforce center, and additional integrations have been completed throughout
our North Central Texas region.
Recognizing that English can be critical to a participant’s success in the job market,
WSNCT actively partners with Adult Education and Literacy (AEL) providers to offer
instruction and remediation, including English as a Second Language (ESL), as a part of
a participant’s service continuum. Integration of AEL with the service delivery system is
vital to the deployment of WIOA. In support of AEL grant recipients providing activities
that promote student success in career and higher education goals, the AEL/Workforce
Regional Coalition (Regional Coalition) was implemented to ensure integration of services
within the 14-county WSNCT area. The objectives of the Regional Coalition are to resolve
shared transitional issues, address local concerns and needs, share information and best
practices, and explore systems and services for continuous improvement in order to close
strategic and operational gaps. The Regional Coalition has the authority and responsibility
to carry out the following functions:
■ Develop strategies for system improvements,
■ Oversee, analyze, and adjust strategy implementation,
■ Share best practices to assist program achievements and promote continuous
improvement, and
■ Track and support the achievement of state, federal and/or local performance goals
and targets.
WD Letter 18-20, Attachment 2 •4•C. High-Performing Board
(WIOA §108(b)(18); 20 CFR §679.560(b)(17))
Boards must include a description of the actions the Board will take toward becoming or
remaining a high-performing Board, consistent with the factors developed by the Texas Workforce
Investment Council (TWIC).
Continuing our journey of excellence, WSNCT has established a culture of continuous
improvement. The following are some examples of our efforts to continuously improve:
In 2020, WSNCT submitted a full, 50-page Malcolm Baldrige Criteria application with
the Quality Texas Foundation. While being recognized for participating in this rigorous
review, most importantly, WSNCT will receive valuable feedback to refine our management
systems and build for the future.
The year 2020 marked the 10th consecutive year WSNCT has received, in partnership
with North Central Texas Council of Governments, the Achievement of Excellence in
Procurement® (AEP) award. The annual AEP award was established by the National
Procurement Institute, Inc. (NPI) in 1995 and recognizes organizational excellence in public
procurement. The criteria continue to become more robust and are designed to measure
innovation, professionalism, productivity, e-procurement, and leadership attributes of
the procurement organization. Applying annually ensures that we continue to raise our
standard of excellence in procurement.
WSNCT continues to utilize an Enterprise Content Management (ECM) application,
Laserfiche, to convert physical participant files to an electronic format to increase
accessibility and reliability of participant files/documents and maintain compliance with
programmatic work processes via the design and implementation of workflow automation.
Also, Laserfiche is utilized to maintain compliance with our document/file retention policy.
Workflow automation is designed to improve operational efficiency, reduce programmatic
cycle-times and minimize opportunities for staff and participant error.
Within WSNCT’s data management and analysis activities, Tableau, which is a data analysis
and visualization tool, is often utilized to conduct an enhanced analysis of available data
from various data repositories for planning and decision-making purposes. Data outcomes
are displayed on locally developed dashboards that are customizable at the user’s request.
Local Tableau dashboards are typically accessible via a web-based interface to users
that have access to the specified URL. WSNCT ensures that PII (Personally Identifiable
Information) data elements/fields are not posted to the web-based accessible tool.
WSNCT continues to emphasize fiscal management by completing the following monthly:
■ Review Subrecipient’s year-to-date financial data and evaluate expenditures and trends,
analyze grant level expenditures compared to established targets, address variances
from target levels and discuss strategies for correction.
■ Review Board level year-to-date financial data and evaluate expenditures and trends,
complete various reports reflecting the Board level expenditures compared to
established targets, discuss variances with the management staff and as appropriate
identify strategies to address improvements and ensure Board level funding is effectively
WD Letter 18-20, Attachment 2 •5•managed.
■ Review overall grant-to-date financial data and evaluate expenditures and trends,
complete various reports reflecting the cumulative grant-to-date expenditures compared
to established targets, discuss variances with management staff and if necessary,
develop strategies for correction to ensure each grant is effectively managed.
To maintain comprehensive compliance, WSNCT performs continuous fiscal and
programmatic risk-based monitoring. Staff are engaged full-time in specific compliance
monitoring and follow up, including follow up review of corrective actions and implementation
of improvements. Customer issues and requests for service received by WSNCT are
entered into the Laserfiche application for consistent action by appropriate staff and timed
follow up to ensure timely responses.
Part 2: Economic and Workforce Analysis
A. Regional Economic and Employment Needs Analysis
(WIOA §108(b)(1)(A); 20 CFR §679.560(a)(1))
Boards must include a regional analysis of the following:
• The economic conditions, including existing and emerging in-demand industry sectors, in-
demand occupations, and target occupations
• The employment needs of employers in existing and emerging in-demand industry sectors,
in-demand occupations, and target occupations
A thorough understanding of the economic conditions and employment needs within our
WSNCT service area is paramount to the deployment of initiatives that help employers and
workers connect successfully. To gain an understanding of the short- and long-term needs
of our region, the process criteria utilized to identify our in-demand industries, in-demand
occupations, and target occupations include current employment, historical employment
change, employment projected growth, and that wages are on par with the most current
cost of living. The variables in the process criteria that measure current employment and
wages are especially important in assessing economic conditions and guiding us toward
areas of high opportunity.
Our in-demand industries highlight the areas that have shown steady and robust employment
growth and that have become uniquely positioned in our region, performing above national
concentration averages. The in-demand occupations and target occupations lists are
created with similar parameters as those of the in-demand industries but go down a level
that is more reflective of the employment needs of our employers. Each occupation list
layouts the occupations that are most impactful for the sustainability of our local economy,
which should be supported with a skilled talent pipeline to help employers meet needs.
WD Letter 18-20, Attachment 2 •6•In-Demand Industries
The process criteria to identify our in-demand industries measure the following:
■ 2020 Employment
■ Average Earnings Per Job
■ 2020-2025% Employment Change
■ Location Quotient
■ 5-History Employment Change
The process criteria resulted in 10 in-demand industries. The in-demand industries were
identified using the “four-digit” North American Industry Classification System (NAICS),
but if examined through their parent NAICS categorization, Manufacturing (NAICS 31-33)
emerged as the largest sector by employment with three in-demand industries. Closely
behind Manufacturing was Wholesale Trade (NAICS 42), which is also represented by
three in-demand industries at the “four-digit” NAICS level. Other in-demand industries were
Activities Related to Credit Intermediation (NAICS 5223) under Finance and Insurance,
which is the largest industry in the list by employment at the “four-digit” NAICS level, with
Office Administration Services (NAICS 5611) next in terms of employment representation.
Office of Real Estate Agents and Brokers (NAICS 5312) and Commercial and Industrial
Machinery and Equipment (except Automotive and Electronic) Repair and Maintenance
(8112) conclude the list, both showing similar 2020 employment figures.
Although the process criteria verify the in-demand industries’ average earnings per job
exceed the living wage for the WSNCT service area, is it noteworthy to mention that all the
in-demand industries exceed the living wage threshold by a large amount. The smallest
difference between our living wage and the wage paid on average per job is $40,800
annually.
WD Letter 18-20, Attachment 2 •7•In-Demand Industries
2020 - Avg. 2019
2020
Parent Sector NAICS NAICS Descrip�on 2025 % Earnings Loca�on
Empl....
Change Per Job Quo�ent
Plas�cs Product
3261 4537 10% $69,456 1.08
Manufacturing
Architectural and
Manufacturing 3323 Structural Metals 6823 11% $73,785 2.43
Manufacturing
Semiconductor and Other
$129,50
3344 Electronic Component 7302 16% 2.70
0
Manufacturing
Professional and
Commercial Equipment $108,48
4234 5678 14% 1.15
and Supplies Merchant 4
Wholesalers
Household Appliances and
Wholesale Trade Electrical and Electronic $129,06
4236 4692 15% 1.83
Goods Merchant 7
Wholesalers
Hardware, and Plumbing
and Hea�ng Equipment
4237 2183 21% $96,137 1.05
and Supplies Merchant
Wholesalers
Finance and Ac�vi�es Related to Credit $121,37
5223 8241 31% 3.58
Insurance Intermedia�on 6
Real Estate and Offices of Real Estate
5312 2522 17% $64,956 1.02
Rental and Leasing Agents and Brokers
Administra�ve and
Support and Waste Office Administra�ve
5611 6182 22% $99,652 1.61
Management and Services
Remedia�on Services
Commercial and Industrial
Other Services Machinery and Equipment
$102,53
(except Public 8113 (except Automo�ve and 2508 34% 1.52
1
Administra�on) Electronic) Repair and
Maintenance
Source: Emsi & JobsEQ
In-Demand Occupations
The process criteria to identify our in-demand industries measure the following:
■ 2020 Employment
■ 2020-2025% Employment Change
■ Unemployment Rate
WD Letter 18-20, Attachment 2 •8•■ 5-History Employment Change
The primary of purpose of the process criteria launched to determine in-demand occupations
was to find those occupations that have a large numeral presence, and therefore a large
impact, in our economy. Additionally, these occupations were identified because of their
economic resilience, as measured by the unemployment rate, and strong historical and
projected growth. All the in-demand occupations have had an impactful growth in the past
five years within our service area, and their growth in the next five years is expected to
exceed the current median growth of all the occupations that make up our local economy.
The in-demand occupations can be grouped into 10 occupational groups. The occupation
groups with biggest number of occupations are (1) Health Care, (2) Construction, Design, &
Mechanical Technology, (3) Business Administration & Professional Services, (4) Finance,
Insurance, Real Estate (FIRE), and lastly (5) Information Technology (IT). These five
occupation groups have at least 11 occupations.
At the occupation level, the largest occupations by current employment are diverse. The
largest occupations, sorted from largest to smallest employment size, are (1) General and
Operations Managers, (2) Software Developers and Software Quality Assurance Analysts
and Testers, (3) Registered Nurses, (4) Project Management Specialists and Business
Operations Specialists, All Other, and (5) Maintenance and Repair Workers, General. These
occupations vary in industry sector, skillsets, and level of education needed to enter the
respective labor markets.
WD Letter 18-20, Attachment 2 •9•In-Demand Occupations
5‐Year History
2020 ‐ Total
2025 % Unemploym Employment
Occupation SOC 2020 Jobs Change ent Rate Change
Health Care
Chiropractors 29‐1011 362 27.7% 1.3% 181
Clinical, Counseling, and School
Psychologists 19‐3031 740 17.0% 1.8% 135
Dental Assistants 31‐9091 3,619 19.2% 3.0% 599
Dental Hygienists 29‐1292 1,810 21.2% 0.9% 378
Dentists, General 29‐1021 1,031 20.0% 0.9% 195
Healthcare Social Workers 21‐1022 758 18.1% 1.7% 109
Medical Assistants 31‐9092 5,097 19.5% 2.7% 982
Medical Dosimetrists, Medical Records
Specialists, and Health Technologists 29‐2098 1,834 16.9% 2.8% 432
Medical Scientists, Except
Epidemiologists 19‐1042 310 23.0% 2.8% 115
Medical Secretaries and Administrative
Assistants 43‐6013 6,632 15.5% 3.8% 1074
Nurse Practitioners 29‐1171 1,050 23.6% 1.6% 311
Ophthalmic Medical Technicians 29‐2057 561 15.1% 3.5% 169
Phlebotomists 31‐9097 580 24.0% 2.4% 155
Physician Assistants 29‐1071 638 25.2% 1.4% 141
Physicians, All Other; and
Ophthalmologists, Except Pediatric 29‐1228 1,770 16.3% 0.8% 418
Radiologic Technologists and
Technicians 29‐2034 797 16.6% 1.4% 138
Registered Nurses 29‐1141 13,513 15.2% 1.7% 2008
Respiratory Therapists 29‐1126 696 17.2% 1.3% 108
Social and Human Service Assistants 21‐1093 1,329 17.2% 3.8% 145
WD Letter 18-20, Attachment 2 • 10 •5‐Year History
2020 ‐ Total
2025 % Unemploym Employment
Occupation SOC 2020 Jobs Change ent Rate Change
Substance Abuse, Behavioral Disorder,
and Mental Health Counselors 21‐1018 946 26.6% 2.0% 243
Surgical Technologists 29‐2055 495 14.9% 3.4% 100
Construction, Design, & Mechanical Technology
Architectural and Engineering
Managers 11‐9041 1,006 14.1% 2.0% 152
Bus and Truck Mechanics and Diesel
Engine Specialists 49‐3031 1,818 13.7% 4.2% 188
Civil Engineers 17‐2051 1,452 16.1% 1.6% 378
Compliance Officers 13‐1041 1,785 15.0% 1.0% 586
Construction Managers 11‐9021 2,771 14.0% 2.5% 391
Cost Estimators 13‐1051 1,643 15.0% 2.6% 236
Electronics Engineers, Except Computer 17‐2072 1,190 14.3% 2.7% 270
Farm Equipment Mechanics and
Service Technicians 49‐3041 246 22.6% 3.1% 102
First‐Line Supervisors of Construction
Trades and Extraction Workers 47‐1011 5,103 13.7% 4.3% 445
First‐Line Supervisors of Mechanics,
Installers, and Repairers 49‐1011 3,175 14.0% 3.2% 516
Heating, Air Conditioning, and
Refrigeration Mechanics and Installers 49‐9021 1,932 21.0% 3.4% 761
Industrial Engineers 17‐2112 1,858 16.0% 2.3% 411
Industrial Machinery Mechanics 49‐9041 2,408 20.7% 3.3% 745
Maintenance and Repair Workers,
General 49‐9071 10,222 14.6% 3.6% 1548
Mechanical Engineers 17‐2141 1,449 13.7% 2.5% 300
Telecommunications Equipment
Installers and Repairers, Except Line 49‐2022 1,913 16.4% 2.7% 706
Telecommunications Line Installers and
Repairers 49‐9052 1,482 14.8% 3.1% 268
WD Letter 18-20, Attachment 2 • 11 •5‐Year History
2020 ‐ Total
2025 % Unemploym Employment
Occupation SOC 2020 Jobs Change ent Rate Change
Business Administration & Professional Services
Accountants and Auditors 13‐2011 9,392 13.9% 2.1% 1,405
Billing and Posting Clerks 43‐3021 3,728 15.0% 2.7% 182
Data Scientists and Mathematical
Science Occupations, All Other 15‐2098 206 16.0% 2.2% 100
General and Operations Managers 11‐1021 17,618 14.7% 2.6% 4,133
Human Resources Managers 11‐3121 912 16.2% 3.2% 320
Human Resources Specialists 13‐1071 4,121 13.8% 3.0% 1,064
Management Analysts 13‐1111 3,848 19.7% 3.5% 910
Market Research Analysts and
Marketing Specialists 13‐1161 3,533 23.6% 3.3% 1,219
Marketing Managers 11‐2021 1,549 17.4% 3.5% 465
Medical and Health Services Managers 11‐9111 2,514 17.4% 1.6% 495
Operations Research Analysts 15‐2031 1,047 24.3% 1.9% 283
Project Management Specialists and
Business Operations Specialists, All 13‐1198 10,288 14.9% 3.3% 2,278
Sales Managers 11‐2022 2,927 14.1% 3.3% 540
Veterinarians 29‐1131 524 18.2% 1.2% 169
Veterinary Assistants and Laboratory
Animal Caretakers 31‐9096 1,027 14.9% 3.0% 155
Finance, Insurance, Real Estate (FIRE)
Claims Adjusters, Examiners, and
Investigators 13‐1031 1,469 15.1% 2.6% 130
Credit Analysts 13‐2041 992 15.1% 2.4% 210
Financial and Investment Analysts,
Financial Risk Specialists, and Financial 13‐2098 4,126 16.2% 2.0% 875
Financial Examiners 13‐2061 619 18.2% 2.8% 262
WD Letter 18-20, Attachment 2 • 12 •5‐Year History
2020 ‐ Total
2025 % Unemploym Employment
Occupation SOC 2020 Jobs Change ent Rate Change
Financial Managers 11‐3031 4,397 22.2% 1.9% 1,057
Insurance Claims and Policy Processing
Clerks 43‐9041 2,466 18.9% 3.4% 328
Insurance Sales Agents 41‐3021 5,933 20.0% 3.0% 687
Loan Officers 13‐2072 2,641 15.2% 2.2% 518
Personal Financial Advisors 13‐2052 922 29.0% 0.7% 453
Property, Real Estate, and Community
Association Managers 11‐9141 1,426 18.0% 3.0% 812
Real Estate Sales Agents 41‐9022 1,530 17.1% 3.1% 556
Securities, Commodities, and Financial
Services Sales Agents 41‐3031 4,058 19.7% 2.4% 1,406
Information Technology (IT)
Computer and Information Systems
Managers 11‐3021 3,104 19.9% 2.1% 867
Computer Network Architects 15‐1241 1,538 15.5% 1.1% 342
Computer Network Support Specialists 15‐1231 1,551 17.3% 3.7% 464
Computer Occupations, All Other 15‐1299 3,119 16.6% 2.8% 863
Computer Systems Analysts 15‐1211 5,403 18.2% 2.0% 1,278
Computer User Support Specialists 15‐1232 6,868 16.3% 3.8% 1,580
Database Administrators and Architects 15‐1245 1,307 16.0% 1.8% 204
Information Security Analysts 15‐1212 1,287 28.1% 3.3% 395
Network and Computer Systems
Administrators 15‐1244 3,453 14.7% 3.3% 567
Software Developers and Software
Quality Assurance Analysts and Testers 15‐1256 14,557 21.5% 2.0% 3,714
Web Developers and Digital Interface
Designers 15‐1257 1,076 18.6% 3.1% 410
WD Letter 18-20, Attachment 2 • 13 •5‐Year History
2020 ‐ Total
2025 % Unemploym Employment
Occupation SOC 2020 Jobs Change ent Rate Change
Personal Care Services
Barbers 39‐5011 420 19.4% 3.9% 213
First‐Line Supervisors of Housekeeping
and Janitorial Workers 37‐1011 914 19.0% 3.9% 254
First‐Line Supervisors of Landscaping,
Lawn Service, and Groundskeeping 37‐1012 671 18.1% 3.6% 175
Massage Therapists 31‐9011 854 32.2% 2.9% 296
Personal Service Managers, All Other;
Entertainment and Recreation 11‐9198 2,437 16.5% 2.1% 1476
Pest Control Workers 37‐2021 1,028 16.6% 3.6% 474
Education/Training
Education Administrators,
Postsecondary 11‐9033 813 24.9% 2.7% 233
Educational, Guidance, and Career
Counselors and Advisors 21‐1012 2,466 15.1% 2.4% 291
Speech‐Language Pathologists 29‐1127 1,882 18.8% 1.4% 155
Training and Development Specialists 13‐1151 2,381 16.7% 2.5% 578
Law, Public Safety, Corrections & Security
Lawyers 23‐1011 2,758 19.1% 1.1% 473
Paralegals and Legal Assistants 23‐2011 1,395 21.5% 2.7% 755
Hospitality & Food Services
Food Service Managers 11‐9051 1,642 17.3% 2.3% 377
Transportation, Distribution, & Logistics
Transportation, Storage, and
Distribution Managers 11‐3071 968 14.1% 2.5% 207
Electro‐Mechanical and Mechatronics
Technologists and Technicians 17‐3024 218 9.2% 3.0% 13
Source: Emsi & JobsEQ
WD Letter 18-20, Attachment 2 • 14 •Target Occupations
The process criteria to identify our in-demand industries measure the following:
■ Typical Entry Level Education
■ 2020 Employment
■ Entry Hourly Earnings
■ 2020 - 2025% Employment Change
■ Unemployment Rate
■ 5-History Employment Change
The target occupations, like the in-demand occupations, shed light on the employment
needs of employers. However, the target occupations’ process criteria go several steps
further and measure educational attainment requirements and that wages meet our region’s
living wage. The target occupations show that our region’s employment opportunities are
diverse, an indicator of resiliency against unpredictable economic downturns, and that key
areas of innovation continue to grow.
Of the 10 occupation groups into which the list can be divided, Construction, Design,
and Mechanical Technology, which is represented by 14 occupations, is the largest
grouping. The second largest group is Business Administration & Professional Services
with 12 occupations. Other occupation groups with a high number of occupations are
Finance, Insurance, Real Estate (FIRE) with 10 occupations; and Information Technology
(IT), composed of 13 occupations. Additionally, Health Care is represented with seven
occupations. After this group, there is a steep drop off in the size of occupation groups.
Although it is important to recognize the makeup and diversity of the target occupations
list, analyzing the size of each occupation group in terms of current employment also
provides valuable insights. The group with the largest employment presence in our region
is Business Administration & Professional Services at 57,954 jobs, with IT in a close second
place at 43,264 jobs. After Administration & Professional Services and IT, the number of
jobs per occupation group decreases significantly, but those occupation groups still have
a large presence and are an important part of our economy. The next group tier includes
FIRE with 30,578 jobs, Construction at 29,052 jobs, and Health Care, which is represented
in the list with 21,876 jobs.
At the occupation level, the top five largest occupations by employment are General and
Operations Managers, Software Developers and Software Quality Assurance Analysts and
Testers, Registered Nurses, Project Management Specialists and Business Operations
Specialists, All Other, and Accountants and Auditors. These five largest occupations’
median wages range from $73,300 to $103,900 per year.
Other indicators that should be noted are the unemployment rate and projected employment
growth. All the target occupations have a low unemployment rate, ranging from 0.07% to
4.3%, and the projected employment growth of the occupations is an average of 17.6% and
3,352 jobs in the next five years.
WD Letter 18-20, Attachment 2 • 15 •Target Occupations
2020 ‐ Ann
Typical Entry Level 2020 2025 % Median Unempl.
Occupation SOC Education Empl. Change Wage Rate
Construction, Design, & Mechanical Technology
Telecommunications Line Installers and High school
Repairers 49‐9052 diploma or 1,482 14.8% $43,600 3.1%
Bus and Truck Mechanics and Diesel High school
Engine Specialists 49‐3031 diploma or 1,818 13.7% $49,300 4.2%
High school
Industrial Machinery Mechanics 49‐9041 diploma or 2,408 20.7% $49,700 3.3%
Telecommunications Equipment Postsecondary
Installers and Repairers, Except Line 49‐2022 nondegree award 1,913 16.4% $56,800 2.7%
First‐Line Supervisors of Construction High school
Trades and Extraction Workers 47‐1011 diploma or 5,103 13.7% $57,800 4.3%
Cost Estimators 13‐1051 Bachelor's degree 1,643 15.0% $61,700 2.6%
First‐Line Supervisors of Mechanics, High school
Installers, and Repairers 49‐1011 diploma or 3,175 14.0% $68,000 3.2%
Compliance Officers 13‐1041 Bachelor's degree 1,785 15.0% $70,200 1.0%
Civil Engineers 17‐2051 Bachelor's degree 1,452 16.1% $81,400 1.6%
Construction Managers 11‐9021 Bachelor's degree 2,771 14.0% $90,900 2.5%
Mechanical Engineers 17‐2141 Bachelor's degree 1,449 13.7% $91,700 2.5%
Industrial Engineers 17‐2112 Bachelor's degree 1,858 16.0% $93,100 2.3%
Electronics Engineers, Except Computer 17‐2072 Bachelor's degree 1,190 14.3% $117,100 2.7%
Architectural and Engineering Managers 11‐9041 Bachelor's degree 1,006 14.1% $150,100 2.0%
Business Administration & Professional Services
Human Resources Specialists 13‐1071 Bachelor's degree 4,121 13.8% $60,700 3.0%
Market Research Analysts and Marketing
Specialists 13‐1161 Bachelor's degree 3,533 23.6% $68,400 3.3%
Accountants and Auditors 13‐2011 Bachelor's degree 9,392 13.9% $73,300 2.1%
Project Management Specialists and
Business Operations Specialists, All Other 13‐1198 Bachelor's degree 10,288 14.9% $76,900 3.3%
Operations Research Analysts 15‐2031 Bachelor's degree 1,047 24.3% $82,400 1.9%
Management Analysts 13‐1111 Bachelor's degree 3,848 19.7% $83,100 3.5%
WD Letter 18-20, Attachment 2 • 16 •2020 ‐ Ann
Typical Entry Level 2020 2025 % Median Unempl.
Occupation SOC Education Empl. Change Wage Rate
Data Scientists and Mathematical Science
Occupations, All Other 15‐2098 Bachelor's degree 206 16.0% $91,200 2.2%
Medical and Health Services Managers 11‐9111 Bachelor's degree 2,514 17.4% $94,800 1.6%
General and Operations Managers 11‐1021 Bachelor's degree 17,618 14.7% $103,900 2.6%
Human Resources Managers 11‐3121 Bachelor's degree 912 16.2% $120,700 3.2%
Sales Managers 11‐2022 Bachelor's degree 2,927 14.1% $127,700 3.3%
Marketing Managers 11‐2021 Bachelor's degree 1,549 17.4% $128,800 3.5%
Finance, Insurance, Real Estate (FIRE)
High school
Insurance Sales Agents 41‐3021 diploma or 5,933 20.0% $66,300 3.0%
Loan Officers 13‐2072 Bachelor's degree 2,641 15.2% $70,700 2.2%
Insurance Claims and Policy Processing High school
Clerks 43‐9041 diploma or 2,466 18.9% $38,200 3.4%
Securities, Commodities, and Financial
Services Sales Agents 41‐3031 Bachelor's degree 4,058 19.7% $56,300 2.4%
Property, Real Estate, and Community High school
Association Managers 11‐9141 diploma or 1,426 18.0% $63,200 3.0%
Claims Adjusters, Examiners, and High school
Investigators 13‐1031 diploma or 1,469 15.1% $66,200 2.6%
High school
Real Estate Sales Agents 41‐9022 diploma or 1,530 17.1% $66,300 3.1%
Credit Analysts 13‐2041 Bachelor's degree 992 15.1% $68,800 2.4%
Financial and Investment Analysts,
Financial Risk Specialists, and Financial 13‐2098 Bachelor's degree 4,126 16.2% $76,900 2.0%
Personal Financial Advisors 13‐2052 Bachelor's degree 922 29.0% $79,100 0.7%
Financial Examiners 13‐2061 Bachelor's degree 619 18.2% $83,500 2.8%
Financial Managers 11‐3031 Bachelor's degree 4,397 22.2% $136,200 1.9%
Information Technology (IT)
Some college, no
Computer User Support Specialists 15‐1232 degree 6868 16.3% $46,600 3.8%
Web Developers and Digital Interface
Designers 15‐1257 Associate's degree 1,076 18.6% $70,000 3.1%
Computer Network Support Specialists 15‐1231 Associate's degree 1,551 17.3% $73,100 3.7%
WD Letter 18-20, Attachment 2 • 17 •2020 ‐ Ann
Typical Entry Level 2020 2025 % Median Unempl.
Occupation SOC Education Empl. Change Wage Rate
Network and Computer Systems
Administrators 15‐1244 Bachelor's degree 3,453 14.7% $85,700 3.3%
Computer Systems Analysts 15‐1211 Bachelor's degree 5,403 18.2% $91,400 2.0%
Computer Occupations, All Other 15‐1299 Bachelor's degree 3,119 16.6% $91,600 2.8%
Database Administrators and Architects 15‐1245 Bachelor's degree 1,307 16.0% $98,400 1.8%
Software Developers and Software
Quality Assurance Analysts and Testers 15‐1256 Bachelor's degree 14,557 21.5% $107,600 2.0%
Information Security Analysts 15‐1212 Bachelor's degree 1,287 28.1% $108,400 3.3%
Computer Network Architects 15‐1241 Bachelor's degree 1,538 15.5% $124,000 1.1%
Computer and Information Systems
Managers 11‐3021 Bachelor's degree 3,104 19.9% $149,600 2.1%
Health Care
Postsecondary
Dental Assistants 31‐9091 nondegree award 3,619 19.2% $40,800 3.0%
Substance Abuse, Behavioral Disorder,
and Mental Health Counselors 21‐1018 Bachelor's degree 946 26.6% $46,100 2.0%
Surgical Technologists 29‐2055 Associate's degree 495 14.9% $48,800 3.4%
Radiologic Technologists and Technicians 29‐2034 Associate's degree 797 16.6% $59,300 1.4%
Respiratory Therapists 29‐1126 Associate's degree 696 17.2% $60,600 1.3%
Registered Nurses 29‐1141 Bachelor's degree 13,513 15.2% $72,300 1.7%
Dental Hygienists 29‐1292 Associate's degree 1,810 21.2% $79,700 0.9%
Personal Care Services
Postsecondary
Massage Therapists 31‐9011 nondegree award 854 32.2% $43,800 2.9%
First‐Line Supervisors of Landscaping, High school
Lawn Service, and Groundskeeping 37‐1012 diploma or 671 18.1% $50,000 3.6%
High school
Pest Control Workers 37‐2021 diploma or 1,028 16.6% $53,300 3.6%
Personal Service Managers, All Other;
Entertainment and Recreation Managers, 11‐9198 Bachelor's degree 2,437 16.5% $121,900 2.1%
Education/Training
Training and Development Specialists 13‐1151 Bachelor's degree 2,381 16.7% $62,500 2.5%
WD Letter 18-20, Attachment 2 • 18 •2020 ‐ Ann
Typical Entry Level 2020 2025 % Median Unempl.
Occupation SOC Education Empl. Change Wage Rate
Hospitality & Food Services
High school
Food Service Managers 11‐9051 diploma or 1,642 17.3% $55,400 2.3%
Law, Public Safety, Corrections & Security
Paralegals and Legal Assistants 23‐2011 Associate's degree 1,395 21.5% $54,100 2.7%
Transportation, Distribution, & Logistics
Transportation, Storage, and Distribution High school
Managers 11‐3071 diploma or 968 14.1% $91,800 2.5%
Electro‐Mechanical and Mechatronics
Technologists and Technicians 17‐3024 Associate's degree 218 9.2% $49,600 3.0%
Source: Emsi & JobsEQ
WD Letter 18-20, Attachment 2 • 19 •B. Knowledge and Skills Analysis
(WIOA §108(b)(1)(B); 20 CFR §679.560(a)(2))
Boards must include an analysis of the knowledge and skills needed to meet the employment
needs of the employers in the region, including employment needs for in-demand industry
sectors, in-demand occupations, and target occupations.
Identifying the knowledge and skills needed to meet the employment needs of our region
is necessary to fill in talent gaps that could position our region for more growth and provide
a bridge to better opportunities for workers open to upskilling. To capture the knowledge
and skill needs of employers in our region, we reviewed the skills that have appeared the
most often in online job postings during the past 12 months in our region for in-demand
industries, in-demand occupations, and target occupations.
In-Demand Industries
The examination of employment needs within our in-demand industries focuses on baseline
skills which are skills that are consistently requested in job postings across industries and
occupations, making them a baseline qualification in the job market. The most solicited
baseline skills by employers within our in-demand industries show that the top five skills
for each industry can be summed to 15 different skills, and they can be categorized almost
evenly into soft and technical skills.
The skill that appeared across all in-demand industries was Communication (Verbal &
Written), which shows the critical attention this area needs within all training programs at
all education levels. This skill appeared twice among the top five skills within two in-demand
industries as indicated by the double X’s in the chart below. Other skills that appeared
the most often, in order from most to least often, were Building Effective Relationships,
Microsoft Excel, Computer Literary, and Problem Solving. Although soft skills, as depicted by
the number of times Communication (Verbal &Written) appeared in the analysis, is growing
in importance in the workforce, technical skills continue to be of almost equal importance
for industries that are critical for our economy to continue to operate successfully. Top 5
Skills per In-Demand Industry
WD Letter 18-20, Attachment 2 • 20 •In-Demand Industries
Professi Househ Hardwa
onal old re, and Commercial
and Applian Plumbi and
Semico Comme ces and ng and Industrial
nductor rcial Electric Heating Machinery
Archite and Equipm al and Equipm and
ctural Other ent and Electro ent and Activiti Equipment
Skill and Electro Supplie nic Supplie es Offices (except
Structu nic s Goods s Related of Real Automotive
Plastics ral Compo Mercha Mercha Mercha to Estate Office and
Product Metals nent nt nt nt Credit Agents Admini Electronic)
Manufa Manufa Manufa Wholes Wholes Wholes Interme and strative Repair and
cturing cturing cturing alers alers alers diation Brokers Service Maintenanc
(3261) (3323) (3344) (4234) (4236) (4237) (5223) (5312) s (5611) e (8113)
Building Effective
Relationships/Tea
mwork/
Collaboration x x x x xx
Communication
(Verbal &
Written) x x xx x x x x x xx x
Computer
Literacy x x x x
Detail-Oriented x x x
English x
Microsoft Excel x x x x x
Microsoft Office x x x
Organizational
Skills x x x
People
Management x
Physical Abilities x x
Planning x
Preventive
Maintenance x x
Problem Solving x x x x
Time
Management x
Troubleshooting x x
Note: Two X’s per square indicate the skill appeared twice amongst the industry’s top five skills in demand.
Source: Burning Glass
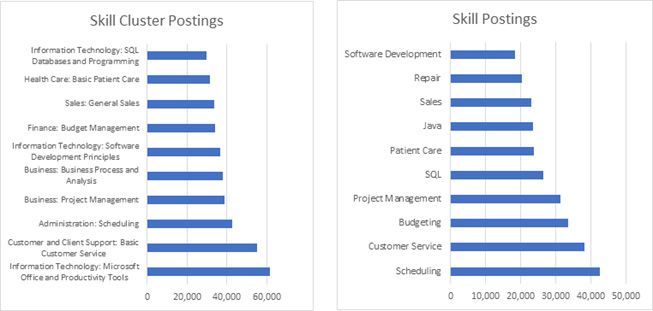
WD Letter 18-20, Attachment 2 • 21 •In-Demand Occupations and Target Occupations
The skills connected to our in-demand occupations and target occupations bring us one
step closer to establishing initiatives that could help employers find the talent they need,
and workers obtain jobs that could catapult them into self-sustainability. The skills most
closely connected to in-demand occupations and target occupations were assessed
utilizing skill clusters and specialized skills. Skill clusters indicate the sector where a group
of related skills is needed, and specialized skills point to more granular skill categorizations
as the coding language examples show on the charts on the right. The examination of both
the skill cluster and specialized skill provide a way to cross reference needs and direct skill
training programs to larger areas of need.
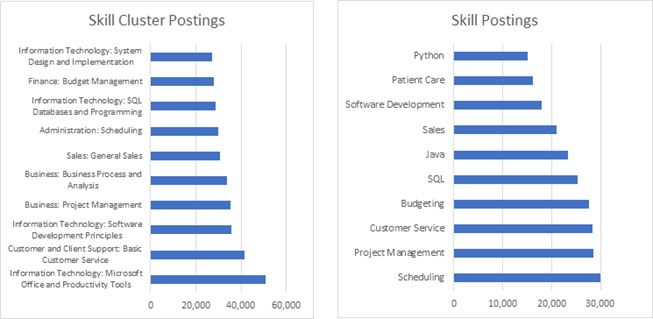
The top 10 skills that have been in most demand for in-demand occupations and target
occupations are largely the same and mirror the occupational groupings of both lists. One
differentiation between the two sets of skills is that the target occupation skills show one
more IT skill than is shown on the in-demand occupation skills, while the latter skills set
calls for Patient Care in its place.
Top 10 Skills for In-Demand Occupations
Source: Burning Glass
WD Letter 18-20, Attachment 2 • 22 •Top 10 Skills for In-Demand Occupations
Source: Burning Glass
C. Labor Force Analysis and Trends
(WIOA §108(b)(1)(C); 20 CFR §679.560(a)(3))
Boards must include an analysis of the regional workforce, including current labor force
employment and unemployment data, information on labor market trends, and educational and
skill levels of the workforce, including individuals with barriers to employment.
The WSNCT region’s population continues to outpace the state of Texas and nation on
several important workforce readiness indicators. WSNCT’s Population Annual Average
Growth is 2.7%, Texas shows a growth rate of 1.6%, while the nation trails both areas at
0.7%. Our Labor Force Participation Rate is currently 68.4%, several points higher than
the rates for Texas and the nation. In other indicators of prosperity in the region, such as
Median Household Income and Per Capita Income, the latest demographic data show that
wages in the WSNCT region are significantly higher than both Texas and the nation.
Education Attainment, which is the highest level of education an individual received, is
another important dataset that is closely correlated to economic wellbeing. People with
more education usually earn more money throughout their lifetimes and are less vulnerable
to significant economic disruptions. Educational attainment is overall positive for WSNCT’s
region. Our region’s largest educational attainment groupings are bachelor’s degree and
post-graduate degree holders. Both categories represent approximately 41% of our
population ages 25-64, and the percentages per group are higher than the state and nation.
WD Letter 18-20, Attachment 2 • 23 •Percent Value
WSNCT Texas USA WSNCT Texas USA
Demographics
Population (ACS) — — — 2,766,881 27,885,195 322,903,030
Male 49.3% 49.7% 49.2% 1,363,062 13,849,775 158,984,190
Female 50.7% 50.3% 50.8% 1,403,819 14,035,420 163,918,840
Median Age2 — — — 36.6 34.4 37.9
Under 18 Years 25.9% 26.2% 22.8% 715,628 7,292,686 73,553,240
18 to 24 Years 8.8% 10.0% 9.6% 243,857 2,777,150 30,903,719
25 to 34 Years 13.2% 14.7% 13.8% 364,775 4,094,297 44,567,976
35 to 44 Years 14.7% 13.5% 12.6% 405,510 3,767,582 40,763,210
45 to 54 Years 14.4% 12.6% 13.2% 397,772 3,511,040 42,589,573
55 to 64 Years 11.5% 11.1% 12.8% 318,174 3,104,626 41,286,731
65 to 74 Years 7.3% 7.2% 8.8% 201,710 2,000,715 28,535,419
75 Years, and Over 4.3% 4.8% 6.4% 119,455 1,337,099 20,703,162
Race: White 77.5% 74.3% 72.7% 2,144,878 20,720,689 234,904,818
Race: Black or African
American 8.1% 12.1% 12.7% 224,740 3,365,783 40,916,113
Race: American Indian and
Alaska Native 0.6% 0.5% 0.8% 15,956 136,061 2,699,073
Race: Asian 7.7% 4.7% 5.4% 212,689 1,308,257 17,574,550
Race: Native Hawaiian and
Other Pacific Islander 0.1% 0.1% 0.2% 2,982 23,672 582,718
Race: Some Other Race 2.9% 5.7% 4.9% 81,013 1,600,234 15,789,961
Race: Two or More Races 3.1% 2.6% 3.2% 84,623 730,499 10,435,797
Hispanic or Latino (of any race) 17.9% 39.2% 17.8% 495,378 10,921,556 57,517,935
Population Growth
Population (Pop Estimates)4 — — — 3,027,876 28,995,881 328,239,523
Population Annual Average
Growth4 2.7% 1.6% 0.7% 70,334 419,412 2,146,799
People per Square Mile — — — 286.0 111.0 92.9
Economic
Labor Force Participation Rate
and Size (civilian population 16
years and over)5 68.4% 64.4% 63.2% 1,459,235 13,728,630 162,248,196
Prime-Age Labor Force
Participation Rate and Size
(civilian population 25-54)5 83.9% 80.4% 81.8% 978,534 9,095,705 104,136,254
Armed Forces Labor Force 5
0.1% 0.4% 0.4% 1,527 89,701 1,028,133
Veterans, Age 18-645 5.0% 5.0% 4.7% 86,178 862,771 9,398,789
Veterans Labor Force
Participation Rate and Size, Age
18-645 83.7% 77.8% 76.3% 72,145 671,366 7,168,168
Median Household Income 2,5
— — — $80,719 $59,570 $60,293
WD Letter 18-20, Attachment 2 • 24 •Per Capita Income5 — — — $37,314 $30,143 $32,621
Mean Commute Time
(minutes)5 — — — 29.7 26.4 26.6
Commute via Public
Transportation5 0.8% 1.4% 5.0% 10,643 184,848 7,602,145
Educational Attainment, Age 25-64
No High School Diploma 8.8% 15.7% 11.2% 130,118 2,274,547 18,885,967
High School Graduate 20.3% 24.7% 25.8% 302,251 3,571,759 43,699,272
Some College, No Degree 22.1% 22.1% 21.0% 328,389 3,193,349 35,525,113
Associate Degree 8.0% 7.5% 9.1% 118,831 1,088,717 15,389,737
Bachelor's Degree 27.3% 20.0% 20.8% 405,725 2,894,532 35,261,652
Postgraduate Degree 13.5% 10.0% 12.1% 200,917 1,454,641 20,445,749
Housing
Total Housing Units — — — 1,042,245 10,769,900 136,384,292
Median House Value (of
owner-occupied units)2 — — — $231,015 $161,700 $204,900
Homeowner Vacancy 1.2% 1.6% 1.7% 8,247 95,712 1,304,850
Rental Vacancy 6.3% 7.7% 6.0% 20,915 308,747 2,822,053
Renter-Occupied Housing Units
(% of Occupied Units) 31.6% 38.1% 36.2% 303,366 3,635,275 43,285,318
Occupied Housing Units with
No Vehicle Available (% of
Occupied Units)5 3.0% 5.4% 8.7% 28,608 512,772 10,424,934
Social
Poverty Level (of all people)5 8.9% 15.5% 14.1% 243,185 4,213,938 44,257,979
Households Receiving Food
Stamps/SNAP 6.1% 12.2% 12.2% 58,667 1,167,725 14,635,287
Enrolled in Grade 12 (% of total
population) 1.4% 1.5% 1.4% 39,753 405,822 4,442,295
Disconnected Youth 3,5
2.2% 2.9% 2.6% 3,500 46,016 438,452
Children in Single Parent
Families (% of all children)5 23.0% 34.6% 34.3% 158,775 2,402,953 23,973,249
Uninsured 12.6% 17.4% 9.4% 345,487 4,764,897 29,752,767
With a Disability, Age 18-645 7.4% 9.6% 10.3% 126,940 1,618,704 20,240,504
With a Disability, Age 18-64,
Labor Force Participation Rate
and Size5 48.3% 44.3% 41.6% 61,329 717,826 8,421,018
Foreign Born 14.0% 17.0% 13.5% 387,045 4,736,692 43,539,499
Speak English Less Than Very
Well (population 5 yrs and
over) 7.6% 14.0% 8.5% 197,657 3,617,887 25,647,781
Source: JobsEQ
1. American Community Survey 2014-2018, unless noted otherwise
2. Median values for certain aggregate regions (such as MSAs) may be estimated as the weighted averages of the median values from the
composing counties.
3. Disconnected Youth are ages 16-19 who are (1) not in school, (2) not high school graduates, and (3) either unemployed or not in the labor
force.
4. Census 2019, annual average growth rate since 2009
WD Letter 18-20, Attachment 2 • 25 •You can also read