Three Essays in Civic Capital
←
→
Page content transcription
If your browser does not render page correctly, please read the page content below
Alma Mater Studiorum - Università di Bologna

                   Dottorato di Ricerca in Economia

                              Ciclo XXIII

            Three Essays in Civic Capital

                    Presentata da: Matthias Bürker

                  Relatore: Gaetano Alfredo Minerva

                Coordinatore Dottorato: Andrea Ichino

Settore scientifico-disciplinare di afferenza: Secs-P/01 Economia Politica
Contents
1 Introduction 4
1.1 Chapter 1 . . . . . . . . . . . . . . . . . . . . . . . . . . . . . . . . . . . . . . . . . . . . . . . 4
1.2 Chapter 2 . . . . . . . . . . . . . . . . . . . . . . . . . . . . . . . . . . . . . . . . . . . . . . . 4
1.3 Chapter 3 . . . . . . . . . . . . . . . . . . . . . . . . . . . . . . . . . . . . . . . . . . . . . . . 5
2 Chapter 1: Explaining the Size Distribution of Plants: An Approach Based on Civic
Capital 6
2.1 Introduction . . . . . . . . . . . . . . . . . . . . . . . . . . . . . . . . . . . . . . . . . . . . . . 6
2.2 Conceptual framework . . . . . . . . . . . . . . . . . . . . . . . . . . . . . . . . . . . . . . . . 9
2.3 The concept of civic capital . . . . . . . . . . . . . . . . . . . . . . . . . . . . . . . . . . . . . 9
2.4 Civic capital, trust and the size of organizations . . . . . . . . . . . . . . . . . . . . . . . . . . 9
2.4.1 Trust and the delegation of authority . . . . . . . . . . . . . . . . . . . . . . . . . . . 10
2.4.2 Trust and shirking in team work . . . . . . . . . . . . . . . . . . . . . . . . . . . . . . 10
2.4.3 Trust and cooperation in one-shot transactions . . . . . . . . . . . . . . . . . . . . . . 11
2.4.4 Testable implications . . . . . . . . . . . . . . . . . . . . . . . . . . . . . . . . . . . . . 11
2.5 Data and variables . . . . . . . . . . . . . . . . . . . . . . . . . . . . . . . . . . . . . . . . . . 12
2.6 Plant size distribution . . . . . . . . . . . . . . . . . . . . . . . . . . . . . . . . . . . . . . . . 12
2.7 Measurement of civic capital . . . . . . . . . . . . . . . . . . . . . . . . . . . . . . . . . . . . 14
2.8 Other explanatory variables . . . . . . . . . . . . . . . . . . . . . . . . . . . . . . . . . . . . . 16
2.9 The effect of civic capital: OLS results . . . . . . . . . . . . . . . . . . . . . . . . . . . . . . . 17
2.10 Average plant size . . . . . . . . . . . . . . . . . . . . . . . . . . . . . . . . . . . . . . . . . . 17
2.11 Standard deviation of plant size . . . . . . . . . . . . . . . . . . . . . . . . . . . . . . . . . . . 19
2.12 A graphical discussion of the results . . . . . . . . . . . . . . . . . . . . . . . . . . . . . . . . 19
2.13 Extensions and robustness of the analysis . . . . . . . . . . . . . . . . . . . . . . . . . . . . . 20
2.14 Heterogeneity across industries, and small vs. large plants . . . . . . . . . . . . . . . . . . . . 20
2.15 Further robustness and sensitivity checks . . . . . . . . . . . . . . . . . . . . . . . . . . . . . 21
2.16 The effect of civic capital: evidence from 2SLS estimation . . . . . . . . . . . . . . . . . . . . 22
2.17 Motivation and identifying assumptions . . . . . . . . . . . . . . . . . . . . . . . . . . . . . . 22
2.18 Results . . . . . . . . . . . . . . . . . . . . . . . . . . . . . . . . . . . . . . . . . . . . . . . . . 23
2.18.1 Civic capital in the 19th and early 20th century . . . . . . . . . . . . . . . . . . . . . 23
2.18.2 Free-city state experiences during the Middle Age . . . . . . . . . . . . . . . . . . . . 25
2.19 Conclusion . . . . . . . . . . . . . . . . . . . . . . . . . . . . . . . . . . . . . . . . . . . . . . 26
2.20 Appendix . . . . . . . . . . . . . . . . . . . . . . . . . . . . . . . . . . . . . . . . . . . . . . . 26
2.21 Detailed description of the data . . . . . . . . . . . . . . . . . . . . . . . . . . . . . . . . . . . 26
2.21.1 Dependent variables . . . . . . . . . . . . . . . . . . . . . . . . . . . . . . . . . . . . . 26
2.21.2 Measures or instruments for civic capital . . . . . . . . . . . . . . . . . . . . . . . . . . 26
2.21.3 Other explanatory variables . . . . . . . . . . . . . . . . . . . . . . . . . . . . . . . . . 27
2.22 Derivation of the first principal component . . . . . . . . . . . . . . . . . . . . . . . . . . . . 28
23 Chapter 2: Civic Capital, Firm Size and Purchased Service Intensity in Italy 43
3.1 Introduction . . . . . . . . . . . . . . . . . . . . . . . . . . . . . . . . . . . . . . . . . . . . . . 43
3.2 Conceptual Framework . . . . . . . . . . . . . . . . . . . . . . . . . . . . . . . . . . . . . . . . 44
3.3 Data and variables . . . . . . . . . . . . . . . . . . . . . . . . . . . . . . . . . . . . . . . . . . 46
3.3.1 Firm Level Variables . . . . . . . . . . . . . . . . . . . . . . . . . . . . . . . . . . . . . 46
3.3.2 Measurement of Civic Capital . . . . . . . . . . . . . . . . . . . . . . . . . . . . . . . . 47
3.3.3 Control Variables . . . . . . . . . . . . . . . . . . . . . . . . . . . . . . . . . . . . . . . 47
3.4 Determinants of PSI: OLS Estimates . . . . . . . . . . . . . . . . . . . . . . . . . . . . . . . . 49
3.4.1 Preliminary analysis . . . . . . . . . . . . . . . . . . . . . . . . . . . . . . . . . . . . . 49
3.5 Determinants of PSI: Instrumental Variables Estimates . . . . . . . . . . . . . . . . . . . . . . 52
3.5.1 Results . . . . . . . . . . . . . . . . . . . . . . . . . . . . . . . . . . . . . . . . . . . . 52
3.6 Conclusion . . . . . . . . . . . . . . . . . . . . . . . . . . . . . . . . . . . . . . . . . . . . . . 53
3.7 Appendix . . . . . . . . . . . . . . . . . . . . . . . . . . . . . . . . . . . . . . . . . . . . . . . 54
3.7.1 Definition of Purchased Services . . . . . . . . . . . . . . . . . . . . . . . . . . . . . . 54
4 Chapter 3: Civic Capital and the Performance Differentials between Foreign and Do-
mestic Firms 68
4.1 Introduction . . . . . . . . . . . . . . . . . . . . . . . . . . . . . . . . . . . . . . . . . . . . . . 68
4.2 Civic Capital and the Governance Costs of Foreign Firms . . . . . . . . . . . . . . . . . . . . 69
4.3 Data Description . . . . . . . . . . . . . . . . . . . . . . . . . . . . . . . . . . . . . . . . . . . 70
4.3.1 The UniCredit-Capitalia dataset . . . . . . . . . . . . . . . . . . . . . . . . . . . . . . 70
4.3.2 Measurement of civic capital . . . . . . . . . . . . . . . . . . . . . . . . . . . . . . . . 71
4.4 Empirical Strategy . . . . . . . . . . . . . . . . . . . . . . . . . . . . . . . . . . . . . . . . . . 71
4.5 Results . . . . . . . . . . . . . . . . . . . . . . . . . . . . . . . . . . . . . . . . . . . . . . . . . 73
4.6 Conclusion . . . . . . . . . . . . . . . . . . . . . . . . . . . . . . . . . . . . . . . . . . . . . . 75
5 Conclusion 82
31 Introduction
The topic of this doctoral thesis is to analyze the effect of civic capital on contractual relationships between
economic agents, both within and between firms. All three chapters are empirical studies, conducted in the
context of Italy. The concept of civic capital is a relatively new research area in the realm of economics.
Although Noble Prize winner Kenneth Arrow stated as early as 1972 that “Virtually every commercial
transaction has within itself an element of trust, certainly any transaction conducted over a period of
time”, it is only since the mid 1990s that economics systematically investigate the role of trust in economic
interactions.1
1.1 Chapter 1
The first chapter of this thesis analyses the role of civic capital in intra firm relationship. The cooperation
enhancing effect of civic capital is especially important in this context as relationships within firms take place
in situations in which other mechanism that induce cooperative outcomes are ineffective: First, measurement
problems of performance and unobservability of actions render third-party contract enforcement unfeasible.
Second, interactions do not take place frequently so there is no space for interpersonal trust to evolve. Third,
agents typically are not related to their partners by personal bonds. Using Italian census data, the analysis
reveals that civic capital increases the size and the dispersion of establishments. Civic capital turns out to
have a positive effect on both the average and the standard deviation of the plant size distribution. This
effect is stronger in labor-intensive industries. The potential endogeneity of current civic capital is addressed
by instrumenting it with historical variables. Moreover, we explicitly address the problem of measurement
error of civic capital by extracting the first principal component of three proxies, namely electoral turnout
in referenda, blood donation and volunteering. Our interpretation for these results is that civic capital is
associated with reduced opportunistic behavior, which improves intra-firm cooperation and hampers the
incidence of principal-agent problems, thus allowing plants to operate on a larger scale.
1.2 Chapter 2
The second chapter analysis the effect of civic capital in contractual relationships between firms. the influ-
ential transaction costs literature (Williamson, 1979, 1985) stresses that, when faced with the make-or-buy
decision, firms choose the form of exchange that minimizes transaction costs. If civic capital decreases
opportunistic behavior, contract incompleteness should decrease as well. Therefore, we expect more trans-
action on the market where civic capital is high. We test this prediction by analyzing the pattern of service
outsourcing. The results show that firms tend to outsource more services to external suppliers where civic
capital is higher. We estimate that a one standard deviation increase in social capital, according to the
measure employed, brings an increase in the share of purchased services over sales between 4% and 6%.
The firms that are more heavily influenced are the smaller ones. Again, potential sources of endogeneity are
addressed by instrumenting civic capital by historical values and by extracting the first principal component.
1 See Arrow (1972).
41.3 Chapter 3
The last chapter instead investigates the effect of civic capital for foreign affiliates. While a huge literature
has tackled the question of whether foreign affiliates outperform their domestic counterparts, these studies
do not reach a consensus on this issue. We complement this literature by arguing that civic capital has
a differential impact on firm performance according to whether a firm is domestically or foreign owned.
Specifically, we expect that the performance of foreign affiliates hinges on a larger extend on civic capital
than purely domestic firms. The reason is that agency problems are exacerbated when a firm operates
in different countries. Not only does the production process require an efficient organization, but spatial
separation makes monitoring difficult and increases the scope of asymmetric information and the related
contractual problems. This question is analyzed in the last chapter by employing a panel dataset of Italian
manufacturing firms. Specifically, we first estimate total factor productivity which is then regressed on our
variables of interest, namely the stock of civic capital in the province where the firm is located interacted
with a dummy identifying a foreign affiliate.
52 Chapter 1: Explaining the Size Distribution of Plants: An Ap-
proach Based on Civic Capital
2.1 Introduction
What determines the size distribution of economic organizations in different industries? Oligopoly theory
stresses the role of market size: in large markets, competitive pressures are intense and reduce the mark-
up of firms. In order to recover the fixed costs of production, each firm has to operate on a larger scale,
which increases average size. Similarly, models of monopolistic competition with heterogeneous firms such
as Melitz and Ottaviano (2008) predict that market size increases both average size and the standard
deviation of size. Empirical evidence has confirmed these theoretical predictions. Employing data on 13
retail industries in the US, Campbell and Hopenhayn (2005) show that market size has a magnifying effect
on average establishment size. Moreover, they find that the dispersion in plant size is positively related to
the size of the local market in some retail industries, but not in all of them. Similarly, Syverson (2004)
shows that, for the concrete industry in the US, market size increases plant size.
In this paper, we empirically identify another fundamental determinant of the size distribution of estab-
lishments: the stock of local civic capital.2 Employing Italian 2001 Census data, we show that civic capital
allows economic organizations to operate on a larger scale, leading to higher average plant size. Moreover,
our results document an increase in the dispersion of establishment size. We motivate these findings by an
important property of civic capital in that it serves as a check against opportunistic behavior and hence in-
creases the likelihood of cooperative outcomes in collective endeavors. Therefore, civic capital plays a crucial
role in intra-firm relationships, where a smooth flow of information is required for decision making, where
CEOs have to efficiently coordinate a wide variety of tasks, where decisions have to be communicated in a
transparent way, and diverging individual interests need to be bridged for the sake of the firm as a whole. In
short, the internal efficiency of organizations depends crucially on the extent to which individuals cooperate.
In principle, there exist several mechanisms which sustain cooperation, such as relational contracts, external
enforcement, or kinship bonds. However, interactions within firms often take place in contexts where (i)
external enforcement is hampered by unobservability of actions or problems of performance measurement,
(ii) interactions are not repeated frequently, and (iii) agents are not related to their partner by personal
bonds. In those situations cooperation among individuals hinges crucially on civic capital and its associated
high level of trust. In addition, the importance of civic capital in sustaining cooperation depends on the
size of the organization in that the scope for opportunistic defection increases with the number of workers.
Standard models of moral hazard predict that the probability of shirking increases with team size (Holm-
strom, 1982), as each member gets a lower share of output. Moreover, relational contracting is less feasible
because interactions between any two members of an organization become less frequent.
Our choice of focusing on Italian data bears several important advantages. First, the variation in the
endowment of civic capital across Italy has received ample interest in social sciences (Banfield, 1958; Putnam,
1993; Guiso et al., 2004, 2008a). This allows us to circumvent the contentious measurement issue, as we
2 Although conceptually closely related, we avoid using the loaded term of social capital. See section 2.2 for a definition of
civic capital and its relationship with trust.
6can fall back on a range of well-established proxies which are available at a geographically disaggregated
level. Specifically, we build on Guiso et al. (2004) and measure civic capital by the number of blood
donations and electoral turnout in referenda.3 The extent to which individuals engage in volunteering in
non-profit organizations completes the set of measures. Second, working on Italy allows us to use data from
the 8th Census on Industry and Services (2001) which provides detailed information on the 4.4 millions
plants operating in Italy. Hence, our analysis does not suffer from sample selection issues, provided that we
are working with the universe of Italian establishments. Third, by focusing on one country, other factors
typically affecting plant size like government subsidies, employment regulation or tax regimes are held
constant.
In order to claim a causal impact of civic capital on economic outcomes, it is crucial to overcome several
potential sources of endogeneity. The first problem concerns measurement error. None of our three proxies
accurately reflects the true stock of civic capital. In order to minimize measurement error and the resulting
attenuation bias, we extract the first principle component of the three variables of civic capital.
The second problem is the issue of reversed causality. According to the modernization theory, economic
development has a direct impact on the formation of cultural and social values, thereby determining the
level of civic capital (Inglehart and Baker, 2000). Similarly, trust in others is likely to be triggered by trust
in political and legal institutions (Rothstein, 2000). Accordingly, efficient law enforcement both produces
high levels of civic capital and favors economic activity, resulting in large plants. Similarly to Buonanno
et al. (2009) and de Blasio and Nuzzo (2010), we use historical data to overcome the problem of reversed
causality and omitted variables. In particular, we use information on civic capital at the middle of the 19th
and beginning of the 20th century. Moreover, relying on Putnam (1993) and Guiso et al. (2008a), a second
set of instruments is based on the number of free-city states in the territory of a province during the Middle
Age.
Several controls ensure that our results are not driven by confounding factors. To separate civic capital
from confounding unobservables related to socio-economic development, we exploit only its variation at
the provincial level within the 20 Italian regions, by including a dummy for each region. In addition, we
interpret our data set as a panel, where observations pertaining to a given industry are collected repeatedly
over different provinces. Industry-specific heterogeneity is accordingly removed by four-digit Nace industry
fixed effects. Moreover, based on Input-Output Use tables, we construct a proxy for local final demand.
The quality of contract enforcement, human capital, financial development, urbanization rates in 1861, and
GDP, all defined at the province level, complete the set of controls.
Results reveal that the variation of civic capital has a magnifying impact on both the mean and the
dispersion of the plant size distribution. Consistently with this, we find that the number of large plants is
higher in high-civic capital areas. We attribute this increase to the fact that civic capital is associated with
a reduction in opportunistic behavior of agents in the local area, which in turn leads to more cooperation in
intra-firm relationships, and hampers the incidence of principal-agent problems. We discuss at length these
mechanisms below. Empirically, the effect of civic capital is heterogeneous across different industries: we
find that the impact is stronger in industries where the capital-labor ratio is low. Concerning the economic
magnitude of our results, the model predicts that the difference in the endowment of civic capital between
3 Other studies which use these measures include Buonanno et al. (2009), and de Blasio and Nuzzo (2010).
7the provinces of Naples (low civic capital) and Milan (high civic capital) is associated with a difference in
the average size of plants of 25%.
The positive relationship between civic capital and the size of organizations is a priori not straightforward,
though. In principle, there are at least two mechanisms why civic capital could actually be associated with
a decrease in average plant size. On the one hand, the influential transaction costs literature (Williamson,
1979, 1985) stresses that, when faced with the make-or-buy decision, firms choose the form of exchange
that minimizes transaction costs. If civic capital decreases opportunistic behavior, contract incompleteness
should decrease as well. Consequently, market transactions become more attractive relative to in-house
production, and so some activities are outsourced to external suppliers and the average size of plants could
decrease.4 On the other hand, civic capital is positively related to entrepreneurship. Tabellini (2010) shows
that the prevailing cultural traits in Southern Italy are such that they discourage individual initiative and
effort, which is supposed to hinder the foundation of new firms.5 Accordingly, de Blasio and Nuzzo (2010)
and Percoco (2011) show that in the Italian context civic capital increases entrepreneurship, which could
then decrease the average size of plants, provided that newly established firms are smaller.
All in all, the Census data we employ unambiguously reveal that the overall effect of civic capital on
the average size of organizations is positive, despite the fact that the mechanisms just mentioned point to
a possibile negative effect. This is one contribution of our paper.
Another contribution is that we identify a novel determinant that affects the size distribution of plants,
beside local market size. Moreover, while papers like Syverson (2004) and Campbell and Hopenhayn (2005)
limit their analysis to a narrow set of industries, our study establishes a regularity which holds for the whole
spectrum of economic activity.
Next, whereas the literature on the determinants of firm size has stressed the role of formal institutions
such as the quality of contract enforcement or the protection of property rights (Kumar et al., 1999; Laeven
and Woodruff, 2007; Lu and Tao, 2009), our analysis implies that informal institutions matter directly in
this respect.
Finally, the idea that informal institutions such as trust are important for the functioning of large
organizations has been formulated by Fukuyama (1995). However, he does not corroborate his claim with
some strong empirical evidence. La Porta et al. (1997) provide a cross-country analysis of the relative
importance of large organizations and the level of trust. They analyze the sales of the top twenty largest
firms relative to national GDP. Differently from them, our analysis focuses on the absolute size of the
universe of plants in Italy. Bloom et al. (2009) are closer to our approach, since they show, in a cross-
country analysis, that the average of firm size for manufacturing as a whole, measured at the regional level
in terms of NUTS 2 spatial units, is larger in regions where trust is higher. Our paper substantially improves
their analysis in terms of precision in at least two ways. First, we are able to assess how the size distribution
within each single 4-digit Nace industry in the Italian Census changes according to the variation in the level
of trust. Second, we do it at a very detailed spatial scale (provinces, which correspond to NUTS 3 spatial
4 In a related study (Bürker and Minerva, 2010) we show that civic capital favors outsourcing of business services. Specifically,
relative to overall sales, firms acquire more services on the market in areas where civic capital is high.
5 Similarly, in his illustrative study on social and economic life in a small village in Southern Italy, Banfield (1958) has
observed a mentality of the local population characterized by resignation and helplessness.
8units).
The rest of the paper is organized as follows. In section 2.2, we provide a definition of civic capital and
outline how it relates to opportunistic behavior and trust. In section 2.5, we present the data and describe
the construction of the variables. Section 2.9 presents the baseline OLS analysis. Sections 2.13 and 2.16
provide robustness analysis and two-stages least square results, respectively. Finally, section 2.19 concludes.
2.2 Conceptual framework
2.3 The concept of civic capital
Guiso et al. (2010) define civic capital as “those persistent and shared beliefs and values that help a
group overcome the free rider problem in the pursuit of socially valuable activities”.6 Two immediate and
interrelated predictions of civic capital can be derived from this definition. First, civic capital is associated
with a reduction in opportunism. This is an immediate implication from the definition, as free-riding in
collective endeavors is a genuine form of opportunistic behavior. Second, areas with more civic capital
are expected to have higher levels of trust. The literature has stressed that the decision to trust another
group or person depends on both the belief in the trustworthiness of others and on individual preferences
(Fehr, 2009; Sapienza et al., 2007). Opportunistic behavior, defined as “self-interest seeking which guile”
includes “calculated efforts to mislead, distort, disguise, obfuscate, or otherwise confuse” (Williamson, 1985,
p. 47). It is therefore reasonable to assume that in an area in which opportunistic behavior is widespread,
individuals form adverse beliefs about the trustworthiness of others, resulting in a distrusting environment.
Similarly, to the extent that civic capital is associated with widespread pro-social preferences, this should
also lead to high trust (Fehr, 2009). Given the interrelatedness between civic capital and trust, in what
follows we will use the two terms interchangeably.7
2.4 Civic capital, trust and the size of organizations
The reasoning above suggests that civic capital improves overall organizational efficiency of firms by facil-
itating cooperation and reducing the scope of agency problems and dilemmas of collective actions, which
are centered around opportunism. Arrow (1968) has made this point plainly clear by stating that “one
of the characteristics of a successful economic system is that the relations of trust and confidence between
6 This deviation from strict self-interest can be explained by pro-social attitudes such as altruism (Andreoni and Miller, 2002),
inequity aversion (Fehr and Schmidt, 1999), preferences for reciprocal fairness (Falk and Fischbacher, 2006) or more generally
by strongly internalized values which constitute a moral obligation not to defect (Portes, 1998). An alternative mechanism
stresses the social component of civic capital. Specifically, individuals cooperate in order not to be socially ostracized by their
fellows (Portes, 1998).
7 It is important to stress that in the agency literature trust is usually modelled as an endogenous outcome of firm strategies.
The enhancement of trust can be obtained through motivational schemes (Casadesus-Masanell, 2004) or by facilitating social
interactions outside the workplace during sport activities, holidays, etc. (Spagnolo, 1999). We abstain from all these aspects
and consider trust as exogenously determined by civic capital. Empirical evidence corroborates the validity of this assumption.
Employing data on a large Italian bank, Ichino and Maggi (2000) demonstrate that individual background is a chief determinant
of cooperative behavior at the workplace. Along these lines, we assume that intra-plant cooperation is exclusively determined
by the stock of civic capital in the province where the plant is located, as embodied by the workers.
9principal and agent are sufficiently strong so that the agent will not cheat even though it may be ‘rational
economic behavior’ to do so”.8
In this section we outline three specific mechanisms of how civic capital improves cooperation in intra-
firm relationships such that it increases establishment size. However, our analysis does not allow to make a
qualitative assessment of their relative importance. Rather, the aim is to show that our empirical findings are
well-grounded in the predictions of some theoretical models. First, we look at the decision of the principal
to delegate decision rights to the agent. Next, we consider team production, while the third mechanism by
which civic capital impacts on plant size relies on the fact that, as organizations get larger, cooperation in
one-shot transactions becomes increasingly more important.
2.4.1 Trust and the delegation of authority
The first mechanism of how civic capital translates into larger establishment size works through the delega-
tion of decision authority by CEOs to subordinate managers. In theoretical models of allocation of decision
rights, trust makes the objective functions of the principal and the agent more similar. The rationale behind
is that a reduction in opportunistic behavior implies that the agent is less likely to take actions which merely
serve his private goals rather than the benefit of the organization as a whole. In Aghion and Tirole (1997)
these congruence effects increase the agent’s willingness to pay for authority relative to the principal which
leads to more delegation. Alternatively, in Dessein (2002), higher similarity in objective functions reduces
the incurred loss of control by the principal and improves communication. Under standard assumptions on
the uncertainty of the environment, the decrease in the loss of control outweighs the communication effect
which leads to more delegation. Delegation of tasks and decision rights, in turn, is crucial for the growth of
the size of plants. Penrose (1959) stressed that CEOs face resource constraints in terms of time and cognitive
abilities if they have a wide span of control. This acts as a stumbling block on establishment growth, as the
CEO has to invest costly resources such as time and effort to manage and decide upon complex business
operations. Delegation then reduces the overload of CEOs and frees resources necessary for expansion.9
2.4.2 Trust and shirking in team work
When individual contributions in team production are unobservable and the team members’ remuneration
is linked to overall team output, individuals have an incentive to free-ride on their colleagues (Alchian and
Demsetz, 1972; Holmstrom, 1982). As suggested by its definition, civic capital plays an important role in
reducing individual shirking in collective endeavors. Ichino and Maggi (2000) show in the Italian context
that shirking, defined as absenteeism and misconduct, is higher in the low civic capital regions in the South.
Becker and Murphy (1992) illustrate how uncooperative behavior in team work reduces the size of plants.
In their model firm output is the cooperative outcome of a team of workers. In order to produce a unit
of final output, a given number of complementary tasks has to be performed. As both workers and tasks
are assumed to be identical, each worker performs an equally large set of tasks. The working time of
each member consists in acquiring task-specific skills and then performing the production tasks. As the
8 See p. 538.
9 Chandler (1962) provides historical evidence that the growth of several North-American corporations was spurred by the
creation of separated divisions within firms and the corresponding delegation of decision authority to subordinates.
10size of the team increases, each worker performs a smaller set of tasks which increases its proficiency in
production (for example, due to learning by doing). On the other hand, as specialization increases, so
does the probability that the production chain collapses as the demand for coordination increases in the
number of workers. Optimal team size is then given by the trade-off between gains from specialization and
coordination costs. In a framework like Becker and Murphy (1992), civic capital can be thought to reduce
shirking and coordination costs, and to allow for larger teams.
2.4.3 Trust and cooperation in one-shot transactions
Relational contracts play an important role in governing intra-firm relationships (Baker et al., 2002). If
employees interact frequently, the threat to terminate the relationship in the case of defection acts as an
effective enforcement device. In particular, as long as the discounted gains from future trade outweigh
short-run benefits from defection, agents have an incentive to stick to informal agreements. However,
the frequency of interactions between two given employees depends on the size of the plant. In large
establishments in which production is fragmented into numerous divisions, the probability that agents
interfere with “strangers” is much larger than in smaller ones. Hence, the role of reputation and implicit
contracts decreases because interactions are less likely to be repeated. Again, if transactions take place in
trusting environments, cooperative outcomes can be sustained even if the game is not repeated (Fehr and
Fischbacher, 2002).10
2.4.4 Testable implications
These considerations allow us to derive our main working hypotheses. First of all, the discussion above
makes clear why we expect that, in areas where the stock of civic capital is high, plants should be larger. As
to the standard deviation of average size, the way it may react to civic capital is very much in line with the
way market size increases the standard deviation in the theoretical model of Melitz and Ottaviano (2008).
If in areas where civic capital is high we have a larger average size of plants, this may also bring an increase
in the standard deviation due to the direct magnifying effect on the size distribution. We will describe more
concretely this issue in the discussion of the empirical results.
The second implication of our framework is that we expect some heterogeneity in the impact of civic
capital on the plant size distribution across different industries. Specifically, we expect industries where
there is an intense interaction among workers to be more reactive to the stock of local civic capital. The
reason simply lies on the fact that the mechanisms of how civic capital affects relationships at the level of
plants are firmly grounded in interpersonal contacts. Conversely, we expect plants where the production
process is based on standardized routines and automation to be less sensitive to civic capital.11
10 When explaining differences in the size of firms across countries, Fukuyama (1995) stresses this important property of
trust.
11 Automation is the use of control systems and information technologies to reduce the need for the intervention of human
work in the production of goods and services.
112.5 Data and variables
In this section, we describe the different data sources used. We then discuss in detail the procedure that we
follow to build the variables. First of all, let us describe the industrial and geographic scales we work with.
Industries are classified according to the Statistical Classification of Economic Activities in the European
Community (NACE), rev. 1. We work with a disaggregation at the 4-digit level, which classifies the entire
spectrum of economic activity into 503 different industries. We keep in the sample only establishments
which are owned by private entities, and we exclude establishments owned by non-profit organizations and
public institutions.12
Concerning the geographic disaggregation, we work with the 103 Italian provinces existing in 2001.13
We work with provinces, and not with smaller spatial units, because data on civic capital are not available
at a smaller level of geography. However, working with provinces is particularly convenient provided that
it allows us to have a sufficiently large number of observations for each 4-digit industry.14
2.6 Plant size distribution
The data on plant size come from the 8th Census of Industry and Services carried out by the Italian national
statistic authority (Istat) in 2001, covering the universe of Italian establishments. In the Census, plants
are classified into 12 different size bins, according to the size of the plant in terms of workers.15 For each
province and each industry, the data set then provides information on the total number of plants and the
total number of workers in a given size bin.16
Let us now turn to the description of the dependent variables that we employ in the analysis. Following
Kumar et al. (1999) and Laeven and Woodruff (2007), the first dependent variable that we define is the
weighted average of plant size in 4-digit industry i and province j. In formal terms we compute average
plant size (APS) as:
emp emp
n
! !
X Nb,i,j Nb,i,j
AP Si,j = estab
× emp , (1)
Nb,i,j Ni,j
b=1
emp estab
where Nb,i,j is the total number of workers in bin b, industry i, and province j, Nb,i,j is the total number
emp
of plants in a given bin-province-industry, while Ni,j is the total number of workers in industry i and
province j for all size bins. Hence, in this formula we weight the average size per bin, as given by the first
fraction in equation (1), by the share of workers working in that bin over the total number of workers in
the province-industry. The literature has emphasized that the rationale for this weighting scheme is to put
more weight on those plants which carry out the bulk of economic activity in a given province-industry, and
to weaken the impact on average plant size of a large number of small plants.
12 This choice implies that are excluded from the analysis industries where plants are exclusively managed by non-profit or
government institutions, like health, social services and public administration.
13 Italian provinces correspond to the NUTS 3 partitioning.
14 The average number of observations for each industry is 70, which amounts to say that, on average, a 4-digit industry can
be found in 70 provinces out of a total of 103.
15 The bin categories are the following: bin number 1 (0 workers), 2 (1 worker), 3 (2 workers), 4 (3-5 workers), 5 (6-9), 6
(10-19), 7 (20-49 workers), 8 (50-99), 9 (100-199), 10 (200-499), 11 (500-999), 12 (1000 and more).
16 The information about plant size in the Istat Census is similar to the one provided in the County Business Patterns for
the U.S. County Business Patterns data are used, for example, in Holmes and Stevens (2002).
12In the robustness checks, we also consider a simplified version of (1), in which each size bin is weighted
by the share of firms in that bin:
emp emp
n
! !
Nb,i,j estab
X Nb,i,j Ni,j
AP S i,j = estab
× estab
= estab
. (2)
b=1
Nb,i,j Ni,j Ni,j
This amounts to a simple division of the total number of workers by the total number of plants for each
province-industry combination. We refer to AP S i,j as the simple average plant size. Moreover, we will
emp
also look at the effect of civic capital on total employment in the province-industry, Ni,j , on the total
estab
number of establishments, Ni,j , and on the number of establishments above or below the 20 employees
size threshold.
The other feature of the size distribution of plants in a given province-industry that we want to charac-
terize is the degree of dispersion around the mean. For this reason, we consider a set of regressions where
the dependent variable is the standard deviation of weighted plant size in industry i and province j. It is
defined as: v
u n " emp
! #2 emp
!
uX Nb,i,j Nb,i,j
SDP Si,j =t estab
− AP Si,j × emp . (3)
Nb,i,j Ni,j
b=1
This variable puts more weight in the computation of dispersion on the size bins that carry out the bulk
of economic activity in a given province-industry. The counterpart of (2) which will be employed in the
robustness section is:
v #2
u n " emp
! !
uX Nb,i,j estab
Nb,i,j
SDP S i,j =t estab
− AP S i,j × estab
. (4)
b=1
Nb,i,j Ni,j
Finally, notice that in the baseline analysis a given industry in a given province is included in the final
sample only if at least three plants are located there.17
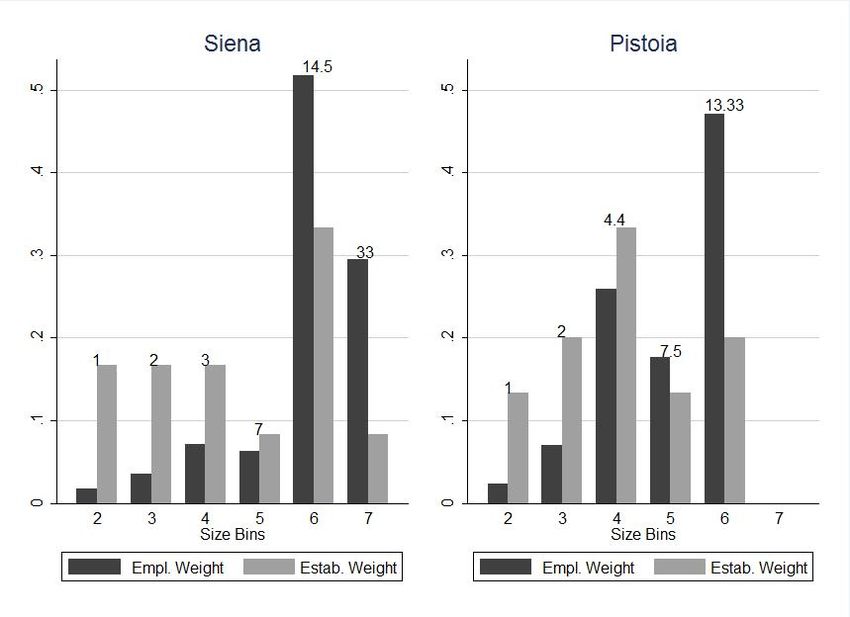
In order to highlight the difference between the weighting schemes employed, Figure 1 provides a graph-
ical representation of the empirical size distribution of plants. The two graphs show the size distribution
for the Manufacture of Tools (Nace rev. 1 code 2862) in two provinces of Tuscany, Siena and Pistoia.
[Insert Figure 1 about here]
Size bins are plotted on the horizontal axis, with the value on top of the bars indicating average plant
emp estab
size in that bin; that is, Nb,i,j /Nb,i,j . On the vertical axis we measure the value of the weight given to
the bins. For each bin, the two bars correspond to the two different weights. The dark gray bars provide
the weights based on employees, as in equations (1) and (3). The light gray bars provide the weights based
on the number of establishments, as in equations (2) and (4). By putting more weight on large plants,
the employee-based weighting scheme increases both the average and standard deviation of plant size. For
example, in Siena AP S is 18.04, while AP S is halved in magnitude, taking the value of 9.3. As for the
standard deviation, SDP S is 10.42, and SDP S is 9.02. The idea behind our paper is to assess whether,
for provinces belonging to the same region (say, Tuscany) and the same 4-digit industry (say, Manufacture
of Tools) we can establish if part of the change in the plant size distributions like those of Figure 1 can be
attributed to the variation in the stock of civic capital at the provincial level.
17 The rationale for this choice is to exclude observations where the dependent variable is computed from very few plants. In
the robustness and sensitivity analysis we also include observations based on one or two plants only.
13The maps displayed in Figure 2 and 3 show the geographic variation of AP S and SDP S across Italian
provinces.
[Insert Figures 2, 3 about here]
Not surprisingly, AP S is the highest in the metropolitan areas of Milan, Rome and Turin. Moreover,
the map reveals that average plant size is generally larger in the Northern part of the country. This
pattern is even more evident in the case of the dispersion in plant size, as shown in Figure 3. The three
metropolitan areas just mentioned stand out, and the higher frequency of light-gray-colored provinces in
the North reveals a substantial North-South difference in the dispersion of plant size. The only three
light-gray-colored provinces in the South pertain to the metropolitan areas of Naples, Bari and Palermo.
2.7 Measurement of civic capital
We employ several proxies to measure the stock of civic capital in a given province. These are blood
donations and the number of volunteers in non-profit organizations, both standardized by population, and
electoral participation in referenda over the period between 1946 and 1987.18 Although quite different, all
three activities share common properties which make them suitable proxies for the stock of civic capital in
a province. First, individuals who donate blood, participate in volunteering or vote incur a non-negligible
cost. These costs often exceed the mere opportunity cost of time devoted to each of these activities.19
Second, and most important, none of these activities provide financial or legal incentives, so individuals do
not obtain any economic pay-off. Rather, individuals who donate blood, engage in volunteering, or vote
in referenda express a concern for some common good, triggered either by social preferences or by social
pressure.20 As outlined in section 2.2, the diffusion of these traits among the local population accounts for
the stock of civic capital in a province.
Figures 4, 5, 6 show the geographic distribution of blood donation, volunteering and electoral turnout,
respectively. All three maps reveal that civic capital is higher in the Central and Northern part of the
country.
[Insert Figures 4, 5, 6 about here]
Table 1 provides evidence that there exists a pronounced positive correlation between each of the three
proxies. The relationships are roughly equally strong in magnitude but nevertheless far from being perfect.
Despite broad common patterns, the maps reveal some differences. This indicates that none of the three
proxies can be taken as a precise measure of the stock of local civic capital. Rather, each variable is
blurred by idiosyncratic factors which induce a certain geographic participation pattern, although they are
orthogonal to the prevalence of civic capital.21
18 In Appendix 2.21 we provide a detailed description of the variables and their sources.
19 For example, donating blood imposes a substantial physical limitation in the short-run, voting requires information gath-
ering and personal evaluation of alternatives.
20 See Putnam (1993) p. 93 for reasons why turnout referenda is more suitable than participation in “normal” political
elections. For a general motivation of the choice of electoral turnout to proxy civic capital see again Putnam (1993).
21 For example, let us think to the 1987 referenda, dealing with some laws regulating the installation of nuclear plants in
Italy, which assumed in the political debate the status of a vote against the use of nuclear energy. It is well known that the
14[Insert Table 1 about here]
In order to remove the noise, we look at the common component of the three proxies. The last row in
Table 1 shows the correlation of the three proxies with their first principal component.22 The fact that the
correlation with each of the individual trust variables is strong, with only slight differences in magnitude,
suggests that all three proxies have a pronounced common dimension. Put differently, the first principal
component identifies the behavioral attitude of the local population that simultaneously underlies the choice
of whether to donate blood, participate on a voluntary basis in non-profit organizations, or vote in referenda;
that is, it identifies the values and beliefs that account for the stock of civic capital.23
Figure 7 shows the geographic distribution across Italian provinces of the measure of civic capital based
on the first principal component. As before, we find that civic capital is the highest in regions in the Center-
North, like Emilia-Romagna, and the lowest in the Southern mainland and Sicily. However, it is important
to stress that our identification strategy relies on the variation of civic capital at the provincial level within
Italian regions, because we will introduce in the empirical analysis dummy variables at the regional level.
Figure 8 illustrates this variation within regions. Specifically, the map shows the residuals from a regression
of the principal component of civic capital on a set of regional dummies. The fact that provinces with
very high and very low residuals, as evidenced by white and black-colored areas, are dispersed all over the
country indicates that the variation of civic capital that we exploit is equally pronounced in all parts of
Italy.
[Insert Figures 7, 8 about here]
In the analysis we also use historical variables of civic capital as instruments. The first historical measure
is the number of mutual aid societies in 1873, standardized by population. These predominantly urban
associations served craftsmen and artisans as a form of insurance against economic and social calamities.
The second measure is average electoral turnout in elections during the period 1919-1921. Both variables
are available at the regional level.24 The last historical instrument is related to the type of early political
institutions that were prevalent in the territory of a given province in 1300. More specifically, we employ
the number of cities in each province that were free city-states in the year 1300. This variable is based on
data from Guiso et al. (2008a).25 In section 2.16 we justify the choice of these variables as instruments for
current civic capital.
local population is strongly against the presence of nuclear plants in his own territory (this is sometimes referred to as the
‘nimby’ syndrome). Then, participation rates in 1987 referenda across Italian provinces could be driven by the presence of
nuclear plants in the territory, in addition to the stock of civic capital.
22 In Appendix 2.22 we briefly review how to derive the first principal component.
23 Another example where the first principal component is used to summarize common cultural traits at the regional level is
Tabellini (2010).
24 For a detailed description consult the Appendix 2.21 and Putnam (1993).
25 The authors, in order to reduce the cost of collecting historical data at the town level, analyze the history of only the 400
biggest cities in terms of 1871 population in the area that was under the Holy Roman Empire at the beginning of the second
Millennium (basically, the Center-North of Italy). For this reason, in the analysis with this set of instruments we are forced to
drop observations from the South Italy and from the Islands (Sicily and Sardinia).
152.8 Other explanatory variables
The size distribution of establishments may be affected by a wide range of factors. For this reason, we
control for as many determinants as possible.26 The first control variable that we consider is the size of
the local market. Melitz and Ottaviano (2008) show in a monopolistically competitive model with firm
heterogeneity that average firm size (both in terms of output and sales) is larger in bigger markets. This
theoretical result is in accordance with the empirical findings for the U.S. (Syverson, 2004; Campbell and
Hopenhayn, 2005). In addition, Melitz and Ottaviano (2008) show that the dispersion of the plant size
distribution should increase with market size. We use two variables for the dimension of the local market.
The first is given by the provincial population, weighted by the relevance of final demand for that particular
industry, as derived from the Italian Input-Output Use tables.27 The second measure is provincial gross
domestic product.
The degree of urbanization could be correlated with the plant size distribution: even after controlling
for the intensity of final demand, plant size could still be the outcome of the overall degree of urbaniza-
tion.28 Correlation between the plant size distribution and urbanization could also go through the different
geographic characteristics of the provinces, even within the same region. This translates into nature-given
starting or stumbling blocks for economic activity, and might confound our results. Urbanization in 1861 is
supposed to capture such time-constant provincial characteristics.29
Another possible determinant of the size distribution is the local stock of human capital. We see human
capital as an outcome of education. For this reason our regressions control for the share of university
graduates in the population of a given province.
Next, we take the efficiency of the legal system into account, understood as the quality of contract
enforcement. Working on Mexican regions, Laeven and Woodruff (2007) show that firm size is increasing
with the quality of the legal system. We proxy the quality of the legal system computing the average number
of days it took to complete first-degree trials in labor-related affairs which ended in 2001, in each of the 165
Italian labor courts.
Apart from the direct link through contract enforcement, formal institutions influence the size of eco-
nomic organizations through the development of financial markets (Beck and Levine, 2003; La Porta et al.,
1997): well-functioning financial markets allow firms to grow and to increase in terms of size.30 As in
Benfratello et al. (2008) we use the number of bank branches per province, normalized by population, as a
proxy for the degree of financial development.
Finally, we investigate whether the impact of civic capital on the plant size distribution is heterogeneous
across industries. To this end, we characterize the production process of each industry according to the
intensity in human interactions. To quantify this dimension we have picked up the capital-labor ratio at the
26 A detailed description of the data and the corresponding sources is provided in Appendix 2.21
27 See Appendix 2.21 for further details.
28 A classical reference linking plant growth and urbanization is Jacobs (1969).
29 It will be explained below that picking historical urbanization is also particularly convenient for the first stage of our
instrumental variables approach, where we regress civic capital on historical instruments and other regressors.
30 However Rajan and Zingales (1998) point out that developed financial markets not only allow firms to grow faster, but
also increase the birth rate of new firms, which are generally quite small. Hence, the overall effect of financial development on
firm size is a priori ambiguous.
16four-digit industry level. We believe that this is a good proxy to measure the sensitivity of a given industry
to human relations, or, symmetrically, the extent to which it depends on standardized routines and process
automation.
In Table 2 we provide the full set of descriptive statistics for our data.
[Insert Table 2 about here]
2.9 The effect of civic capital: OLS results
2.10 Average plant size
We begin the regression analysis with the ordinary least squares estimation of the relationship between
average plant size and civic capital. The equation that we estimate is the following:
ln AP Si,j = α0 + α1 ln CCj + ln Xj0 α2 + γr + γi + i,j (5)
where ln AP Si,j is the logarithm of employment-weighted average plant size in province j and industry i,
ln CCj is the log of the measure of civic capital in province j, ln Xj is the log of a vector of provincial
controls, γr denotes the region’s dummy, γi is a 4-digit unobserved industry effect, and i,j is the error
term.31 We apply to equation (5) a fixed effect analysis, in the sense that we interpret our data set as a
panel, where observations pertaining to a given industry i are collected repeatedly over different provinces.
During the statistical inference process, we take into account the potential correlation among the regression
error terms using standard errors that are clustered both at the provincial level and at the industry level.32
Results confirm our hypothesis that the level of civic capital is positively correlated with average plant
size. In columns from (1) to (4) of Table 3 we regress average plant size on four different civic capital
variables: blood donations, volunteers, electoral turnout in referenda, and the first principal component of
all these three measures. Except for the case of the referenda turnout, the results are always statistically
significant. The coefficient is most precisely estimated when the principal component is used. This is what
we expected, given that the motivation to extract the first principal component is getting an accurate
measure of civic capital out of the three proxy variables. In addition to the region dummy variables, the
only control that is added at the provincial level in these estimates is the strength of final demand. Also final
demand turns out to affect positively average plant size. The latter result is in accordance with theoretical
models such as Melitz and Ottaviano (2008) and empirical analyses such as Syverson (2004), Campbell and
Hopenhayn (2005) and Laeven and Woodruff (2007).
31 When we measure civic capital by the principal component our equation is the following:
ln AP Si,j = α0 + α1 P Cj + ln Xj0 α2 + γr + γi + i,j .
Here P Cj is the principal component of the log of the three proxy variables, rather than the log of some variable.
32 The two-way clustering procedure that we adopt tackles two issues. On the one side, the correlation between error terms
within provinces could be the result of disturbances at the local level, which could descend, for instance, from unobservable
provincial characteristics. On the other side, the correlation in the error terms within industries could still survive the inclusion
of the fixed effects γi . Think, for example, to some random event that led some big plants in an industry to locate in some
province. This could induce correlation in the error terms for observations in that particular industry. On inference with
clustered data see Cameron and Miller (2010).
17In columns from (5) to (8) of Table 3 we include additional determinants of plant size at the provincial
level. In order to claim that civic capital increases plant size by increasing trust and cooperation at the plant
level, we have to exclude that results are driven by certain characteristics of the environment in which a
plant operates that are correlated with both civic capital and the plant size distribution. These confounding
factors are dealt with by including appropriate provincial controls, described in section 2.8.
Turning to the results, they show little sensitivity to the inclusion of controls. This is partially reassuring,
though of course it does not completely solve the issue of unobserved heterogeneity. With the exception of
referenda turnover, both the number of blood donations and that of volunteers are still statistically significant
at the 5% level. The same is true for the first principal component, which is statistically significant at the
1% level. It should be kept in mind that the coefficient α1 is actually an elasticity, because both the
dependent variable and the regressors are logarithms. Then, in the case of blood donations, an estimated
elasticity equal to 0.07 means that a 10% increase in the number of blood donations at the provincial level is
associated to a 0.7% increase in weighted average size of plants at the level of 4-digit industries. The value
is very similar in the case of volunteers. It is only in the case of the referenda turnover that the coefficient
is no longer significant. This fact can be taken as evidence that, once the regional effects are washed out
by the dummy variables, γr , there is not enough variability left in provincial turnout to allow a coefficient
estimate which is statistically different from zero.33 The following example gives an idea of the economic
magnitude of the effect of civic capital when the measure is the first principal component. Milan is a high
civic capital province (it ranks 21st in Italy), while Naples is the province with the lowest civic capital in
Italy. The estimated coefficient equal to 0.05 implies that average plant size would be 25% larger if Naples
had the stock of civic capital of Milan.34 This is a sizeable impact given that the observed difference is such
that plants are, on average, 47% larger in Milan.
Among the provincial controls, a coefficient being different from zero in a statistically significant way is
the number of bank branches. The fact that we get a negative sign can be explained by a certain prevalence
of younger and, for this reason, smaller plants were financial development is higher.35 In our estimates the
role of civic capital seems to outweigh that of formal institutions, since the quality of contract enforcement,
expressed by the length of trials, is no longer statistically different from zero.
33 When the proxy of civic capital is the first principal component of the above mentioned three variables, it is less straight-
forward to provide an interpretation in terms of elasticity of the coefficient of civic capital. As we outline in Appendix 2.22, the
extraction of the principal component is a statistical procedure whose output, starting from the log of our three proxies, is a
variable which has no observable counterpart. However, we think that this procedure is particular appropriate in a framework
as ours where we want to identify in the most accurate way the common behavioral attitude of the local population toward
trusting others, and in view of this a certain artificiality of the measure can be tolerated.
34 The principal component for Naples is -3.347, while for Milan it is +1.236. The contribution from the difference in civic
capital to the difference of average plant size in log terms for the two locations (ln AP Si,M ilan − ln AP Si,N aples ) is then equal
to 0.229, which corresponds to a difference of 25% in terms of average size measured in levels.
35 However, this control variable could be endogenous in equation (5). Guiso et al. (2004) stress the importance of civic
capital for the development of financial markets in the Italian context.
182.11 Standard deviation of plant size
Our empirical analysis proceeds with the estimation of the link between the standard deviation of plant size
and civic capital. The equation that we estimate is now the following:
ln SDP Si,j = α0 + α1 ln CCj + ln Xj0 α2 + γr + γi + i,j (6)
where ln SDP Si,j is the logarithm of the standard deviation of plant size in industry i and province j,
computed according to equation (3). As before, we perform a fixed effect analysis where the panel dimension
is in terms of 4-digit industries.
The results provided in Table 4, in the columns from (1) to (4), are obtained with just one provincial
control (final demand). In columns from (5) to (8) we add the full set of controls. The following results
stand out. As before, all proxies of civic capital are statistically significant, with the exception of electoral
turnout in referenda. Moreover, there is little sensitivity of the estimates with respect to the inclusion of
the full set of provincial controls. The elasticity of the standard deviation with respect to civic capital is
0.08 for blood donations and for volunteers.
The results suggest that the impact of civic capital, although smaller in magnitude, is qualitatively
similar to that of market demand: it increases both the first and the second moment of the distribution of
plant size. As to the other controls, financial development, measured by the number of bank branches, is
associated to a less dispersed distribution in terms of size (probably due to a larger number of small plants
in the province-industry, something which makes the distribution more even).
2.12 A graphical discussion of the results
In order to discuss our results, we go back to Figure 1, where the distribution for NACE 2862 in Siena and
Pistoia is plotted. We want to provide a stylized graphical interpretation of how civic capital shifts the
distribution of plant size. The two provinces are roughly equal in terms of overall size (measured by total
GDP) and belong to the same region (Tuscany). However, they differ markedly in the endowment of civic
capital. While Pistoia’s endowment ranks 42nd in Italy in terms of the first principal component, Siena has
the 3rd highest endowment. The figure highlights that civic capital increases the number of plants at the
top end of the distribution: comparing the height of the dark gray bar in size bin number 6 reveals that
relatively large plants are more frequent in Siena than in Pistoia. Moreover, Siena hosts establishments
which have no size counterpart in Pistoia (there is no plant in size bin number 7 in Pistoia). We do not
find such a pattern in the left tail: in size bins number 2, 3, and 4 (where the total number of employees is
small, ranging from 1 to 5), the distribution is actually fatter in Pistoia than in Siena.36
The mechanism we have in mind to explain why civic capital increases both average plant size and the
standard deviation of plant size is coherent with this stylized example. Our argument hinges upon a larger
mass of big plants being active in the local areas with high civic capital. This happens because of the
different channels outlined in the conceptual framework, and gives rise to a magnification of the local plant
size distribution which ultimately increases also the standard deviation of size. In the following section we
provide further evidence on this.
36 Qualitatively, we get the same results looking at the light gray bars, where the weights are given by the number of plants
that each size bin contains.
19You can also read