Shutdown: estimating the COVID-19 employment shock - Brendan Coates, Matt Cowgill, Tony Chen, and Will Mackey
←
→
Page content transcription
If your browser does not render page correctly, please read the page content below
Shutdown: estimating the COVID-19 employment
                                       shock
               Brendan Coates, Matt Cowgill, Tony Chen, and Will Mackey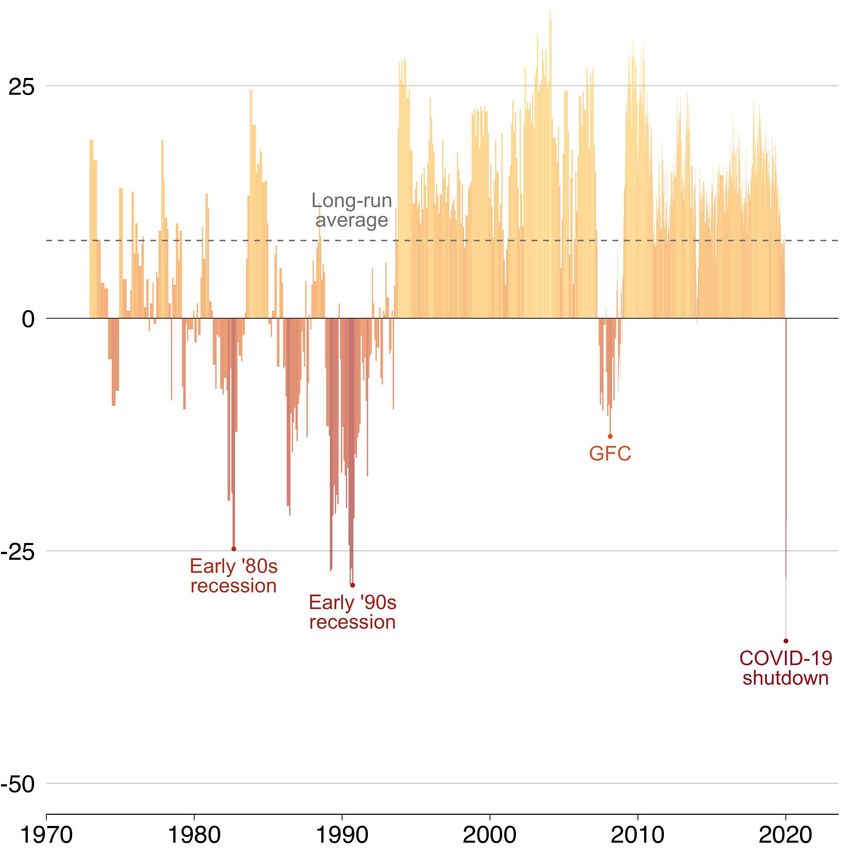
Shutdown: estimating the COVID-19 employment shock

Grattan Institute Support                                        Grattan Institute Working Paper No. 2020-03, April 2020

Founding members                     Endowment Supporters        This working paper was written by Brendan Coates, Matt Cowgill, Tony
                                     The Myer Foundation         Chen, and Will Mackey.
                                     National Australia Bank     We would like to thank Jeff Borland, Peter Davidson, Richard Holden,
                                     Susan McKinnon Foundation   Sean Innis, and a number of other reviewers for their comments on this
                                     Affiliate Partners          working paper. The opinions in this paper are those of the authors and
                                                                 do not necessarily represent the views of Grattan Institute’s founding
                                     Medibank Private
                                                                 members, affiliates, individual board members, reference group
                                     Susan McKinnon Foundation
                                                                 members, or reviewers. Any errors or omissions are the responsibility
                                     Veitch Lister Consulting
                                                                 of the authors.
                                     Senior Affiliates           Analysis in this paper relies on correspondence tables between US and
                                     Cuffe Family Foundation     Australian occupational codes. These were provided to Grattan Institute
                                     Maddocks                    by Andrew Reeson and Gavin Walker of CSIRO. We are very grateful
                                     The Myer Foundation         for their assistance.
                                     PwC                         Analysis in this paper used the R programming language (R Core
                                     Scanlon Foundation          Team, 2019) and a range of R packages including the Tidyverse
                                     Trawalla Foundation         (Wickham et al, 2019).
                                     Wesfarmers
                                                                 Grattan Institute is an independent think tank focused on Australian
                                     Westpac                     public policy. Our work is independent, practical, and rigorous. We aim
                                     Affiliates                  to improve policy outcomes by engaging with decision makers and the
                                     Allens
                                                                 broader community.
                                     Ashurst                     For further information on the Institute’s programs, or to join our mailing
                                     Corrs                       list, please go to: http://www.grattan.edu.au/.
                                     Flagstaff Partners          This working paper may be cited as: Coates, B., Cowgill, M., Chen, T., and Mackey, W.
                                                                 (2020). Shutdown: estimating the COVID-19 employment shock. Grattan Institute.
                                     Jemena
                                     McKinsey & Company          ISBN: 978-0-6487380-5-3

                                     Silver Chain                All material published or otherwise created by Grattan Institute is licensed under a
                                                                 Creative Commons Attribution-NonCommercial-ShareAlike 3.0 Unported License
                                     Urbis
                                     Woodside

Grattan Institute 2020                                                                                                                                  2
Shutdown: estimating the COVID-19 employment shock

Overview
Australia faces an unprecedented economic challenge in the coming           be counted among the unemployed either. Nonetheless, we expect the
weeks and months. Never before has such a large proportion of               unemployment rate could rise to between 10 and 15 per cent.
economic activity come to such a sudden stop. Never before has such
a large slowdown been deliberately engineered as a matter of public         There is, of course, considerable uncertainty around our estimates
policy – in this case, to protect public health during a global pandemic.   of the job losses from COVID-19. Real-time data on the extent to
                                                                            which different occupations and industries are being hit by spatial
COVID-19 is already having a big impact on the livelihoods of many          distancing is limited. The degree to which many jobs can be adapted
Australians. This is visible at Centrelink offices around the country, as   to be done remotely is unclear. We do not factor in the impact that
people queue to be added to the income support rolls, and visible in the    policy responses to date will have in boosting demand, although these
form of closed shopfronts in all Australian cities, suburbs, and towns.     measures are unlikely to maintain work in directly affected sectors. But
But the size of the employment shock from the COVID-19 response is          if our estimates are even close to accurate, Australia is facing either the
not yet known and will not be known for weeks, even months. In this         worst or one of the worst economic downturns in its history.
working paper, we estimate the hit to employment from mandatory and
voluntary spatial distancing.                                               The second-round impacts of the COVID-19 crisis on employment, and
                                                                            economic activity, will also be severe. Firms and households not initially
We calculate that between 14 and 26 per cent of Australian workers –        affected by public health measures will scale back their spending to
1.9-to-3.4 million people – could be out of work in the coming weeks        preserve cash flow in the face of an extended downturn. Meanwhile
as a result of spatial distancing measures to contain the spread of         Australia faces a synchronised slowdown among our major trading
COVID-19, if they aren’t already. More than half of all workers in          partners, adding to the economic hit from COVID-19.
the hospitality industry could be off work due to COVID-19. Many
workers in retail trade, education and training and the arts are also       History tells us that recovery from periods of high unemployment is
at risk. Lower-income workers are twice as likely to be out of work as      rarely fast. This time may be different: recession has been deliberately
high-income earners. Younger Australians and women are likely to be         engineered as a matter of public health, and substantial economic
hit hardest, because they are more likely to be employed in occupations     support is in place. But the longer the downturn goes, and the worse
and industries most affected by the response to COVID-19.                   it gets, the less likely the labour market can spring back afterwards.

Unemployment will rise substantially in the coming months, but the          The economic challenge of COVID-19 underscores the importance of
Commonwealth Government’s new JobKeeper wage subsidy will                   getting the virus under control. Resolving the public health crisis is a
obscure much of the impact. Many Australians out of work will still be      critical first step on any path to sustained economic recovery. Policy
counted as ‘employed’ because they will receive JobKeeper payments          makers have rightly taken unprecedented steps to households and
via their employers. Others that would have lost their jobs will remain     businesses weather this storm. But given the size of the economic
employed. And others will leave the labour force entirely and so won’t      shock from COVID-19, more support will be needed in time.

Grattan Institute 2020                                                                                                                                 3
Shutdown: estimating the COVID-19 employment shock

                                                     Table of contents

                                                     Overview . . . . . . . . . . . . . . . . . . . . . . . . . . . . . . . . 3

                                                     1   How big should we expect the employment shock to be? . . . . . 5

                                                     2   How do we estimate the size of the employment shock? . . . . . 14

                                                     3   Our estimates of the employment shock . . . . . . . . . . . . . . 19

                                                     4   The broader economic costs of COVID-19 will also be severe . . 29

                                                     5   Policy implications   . . . . . . . . . . . . . . . . . . . . . . . . . 36

                                                     A Validating ‘proximity scores’ from the O*NET data . . . . . . . . 44

                                                     B Manual estimates by industry       . . . . . . . . . . . . . . . . . . . 46

                                                     C How will people be classified in labour force statistics? . . . . . . 50

Grattan Institute 2020                                                                                                           4
Shutdown: estimating the COVID-19 employment shock
1 How big should we expect the employment shock to be?
It is clear that the employment effects of social or spatial distancing Figure 1.1: Consumer confidence has hit its lowest level on record
are large and widespread. But exactly how many Australians will lose Net consumer confidence: difference between the percentage of positive
survey respondents and negative respondents (percentage points)
their jobs is still unclear. It will be several weeks – even months –
before the extent of the employment shock can be measured using
publicly-available data. Policy makers require informed estimates of
the size of the downturn in employment to guide their response to the
crisis.
This chapter reviews the available data on the state of the Australian
economy, and collects various estimates, including from overseas, of
the shock to employment and economic activity.
The evidence and estimates released so far suggest three things. First,
the employment downturn in Australia and elsewhere is likely to be
very large. Estimates vary, but all suggest that Australia is facing one
of the largest drops in economic activity – perhaps the largest – in its
history. Second, the precise size of the shock, both in Australia and
overseas, remains unclear. Third, most estimates of the size of the
shock to employment and output have grown over time – more recent
estimates are more pessimistic than earlier views.1
Australia’s governments have already announced substantial support
for households and businesses, and the Reserve Bank has loosened
monetary policy.2 They will need to closely monitor the data to
ascertain whether more support is needed.
1. Some forecasts of the unemployment rate have been revised down a little.
This reflects expectations about the effect the JobKeeper Payment will have
on the number of people who are not working but are nevertheless considered
Note: The ANZ-Roy Morgan Consumer Confidence Rating is the unweighted average
‘employed’, an issue discussed further in Section 3.5.
of the difference between the percentage of respondents who give positive or negative
2. For a summary of the Commonwealth Government’s fiscal response to COVID-
answers to five questions about economic conditions and their household finances.
19, see: Wood et al (2020b). For a summary of state responses see: Wood et al
(2020a). Source: ANZ-Roy Morgan Consumer Confidence index. Grattan Institute is grateful to
ANZ for providing the full time series of this data.
Grattan Institute 2020 5Shutdown: estimating the COVID-19 employment shock
1.1 Up-to-date Australian data is scarce, but points to a large
downturn Figure 1.2: Searches for unemployment-related terms spiked in March
Google searches in Australia for phrase, as a percentage of the most-ever
The latest ABS labour force survey results were released on 16 April.3 searches for the phrase
The survey was conducted in mid-March, and respondents were asked
about their employment situation in the first two weeks of March, a Allowance Centerlink Centrelink
100
period before widespread spatial distancing and mandatory shutdowns.
So these data do not help us to ascertain the size of the COVID-19 75
employment shock. As outlined in Box 2, it will be several weeks before 50
we have labour force survey data on how employment has fared since
the shutdown. To gauge the likely size of the employment shock, we 25
Original
Seasonally adjusted
need therefore to look at other data. 0
The ABS surveyed businesses between 30 March and 3 April and Dole Newstart Redundancy
100
asked them a series of questions about the impact of COVID-19 on
their business.4 It found that 47 per cent of businesses made changes 75
to their workforce in the previous two weeks, in response to COVID-19.
50
A small proportion of businesses increased work hours, but most did
not. About a quarter reduced the work hours of their staff, and 9 per 25
cent stood staff down or sent them on unpaid leave. These figures may 0
understate the proportion of businesses facing difficulty, as businesses
that have closed down may have been less likely to respond to the Redundant Unemployed Unemployment
100
survey.
75
The consumer confidence data released on 29 March were the worst
50
ever recorded in the nearly 50-year history of the ANZ-Roy Morgan
Consumer Confidence series, as shown in Figure 1.1 on the preceding 25
page. Confidence plunged materially lower than in the deep recessions
0
of the early 1980s and early 1990s, or during the Global Financial 2005 '10 '15 '20 2005 '10 '15 '20 2005 '10 '15 '20
Crisis. The index from a week earlier, 22 March, was the third-worst Notes: Data normalised by Google: the number of searches for a given term in a month
ever recorded, behind only the figures recorded at the end of 1990. is divided by all searches in Australia for all terms in that month; the result is then re-
scaled so 100 is the maximum normalised search volume for the term observed over
Confidence bounced back a bit on 5 April and again on 12 April, after
the whole period since 2004. Seasonally adjusted by Grattan Institute using X11.
Sources: Google Trends and Grattan analysis.
3. ABS (2020a).
4. ABS (2020b).
Grattan Institute 2020 6Shutdown: estimating the COVID-19 employment shock
the announcement of the JobKeeper payment and other fiscal support,
but remained at one of its lowest-ever levels. Box 1: How is consumer confidence measured?
Westpac’s consumer sentiment survey released on 15 April asked The ANZ-Roy Morgan Consumer Confidence Index is based on
people about their employment prospects. They found that 7 per cent randomly-selected survey respondents’ answers to a series of five
of those surveyed lost their jobs in the last month, while an additional questions about their family’s finances, the state of the economy,
14 per cent were stood down without pay.5 and their expectations about the coming year.
The words and phrases that Australians search for on Google can The questions are:
also provide up-to-date information about what is happening in the
economy.6 Searches for unemployment-related terms spiked in March • Would you say you and your family are better-off financially or
2020, as shown in Figure 1.2 on the previous page. Most of these worse off than you were at this time last year?;
search terms recorded their largest-ever search volumes in March. • This time next year, do you and your family expect to be
There were about four times as many searches for words such as better-off financially or worse off than you are now?;
‘Newstart’ and ‘Centrelink’ in March compared to February 2020.
• Thinking of economic conditions in Australia as a whole. In
The number of online job posts also provides real-time data on labour the next 12 months, do you expect we’ll have good times
demand from firms. After all, firms are more likely to stop hiring new financially, bad times, or some good and some bad?;
workers before they fire existing ones. The number of average weekly
job posts on the hiring website Indeed significantly declined in the • Looking ahead, what would you say is more likely, that in
second half of March. Job posts at the start of April were 50 per cent Australia as a whole, we’ll have continuous good times during
below where they were at the same time in 2019.7 Postings have fallen the next five years or so – or we’ll have bad times – or some
further from last year’s trend in Australia than in most other countries good and some bad?; and
recorded by Indeed – including Italy and France, which both went into
• Generally, do you think now is a good time – or a bad time –
shutdown earlier than Australia (Figure 1.4).
for people to buy major household items?.a
Fewer postings may be an indication that firms are cutting back on
The overall consumer confidence number reflects the balance
hiring, in expectation of hard times ahead. The employment effects of
between positive or optimistic responses and negative or
5. Wright (2020a). pessimistic responses.
6. Google Trends data has been used to get up-to-date information on the state
of the economy – ‘now-cast’ – by a number of researchers; for example, see: a. Roy Morgan Research (2020).
Choi and Varian (2012). RBA researchers have demonstrated that searches for
unemployment-related search terms are correlated with the unemployment rate in
Australia: Gill et al (2012). Others have used Google Trends data to directly study
job-search activity; see: Baker and Fradkin (2017).
7. Pickering (2020).
Grattan Institute 2020 7Shutdown: estimating the COVID-19 employment shock
COVID-19 are apparent not only in a much higher than usual rate of job starting 16 March – a record high.14 During the same week in the US,
loss, but also a slower rate of new hiring. more than 3.2 million workers submitted a claim for unemployment
insurance. And the number of US workers submitting claims more than
1.2 International data doubled the following week, to more than 6.6 million. This magnitude of
claims is unprecedented in the US over the past 50 years, including
As at mid-April 2020, few countries had released labour force data that
during the GFC, the deep recession of the early-1980s, and the
revealed the full effects of COVID-19 and the associated shutdowns.
‘stagflation’ period of the 1970s (Figure 1.5).15
But the data that is available presents an extremely worrying picture for
Australia. These data paint a clear picture: large numbers of people all around
the world are being thrown out of work by COVID-19 and the public
The unemployment rate has risen sharply in a range of advanced
health response to it. And these data come from the early days of the
economies:
COVID-19 crisis. The unemployment peak is yet to come.
• Employment in Canada fell by 5.3 per cent in March, compared to
February; the unemployment rate rose from 5.6 to 7.8 per cent.8
1.3 Labour market forecasts
• In Norway, the March unemployment rate was 10.9 per cent,
The data to date confirms that Australia and many other countries
almost five times what it was at the end of February.9
are facing sharp and severe downturns in economic activity and
• In Austria, the unemployment rate reached 12.2 per cent.10 employment. But this data is limited. Economic forecasts can help shed
more light on the expected size of the downturns.
• The Israeli unemployment rate, which was less than 4 per cent a
month ago, has increased to a record high of 24.1 per cent.11
1.3.1 Forecasts for Australia
• Spain suffered the biggest jump in unemployment in its history in
The minutes of the Reserve Bank of Australia’s board meeting on
March, with 800,000 people becoming unemployed.12
18 March state that there is ‘likely to be significant job losses over
Data on the number of workers claiming unemployment benefits the months ahead, although the extent of this would depend on the
tells a similar story. In France, about 4 million people applied for capacity of businesses to retain employees during this period’.16 The
unemployment benefits in the second half of March.13 In Canada, half RBA Governor’s statement after the 7 April board meeting was even
a million workers applied for unemployment benefits during the week more stark:
8. Statistics Canada (2020).
9. Solsvik (2020). 14. Hagan and Bolongaro (2020).
10. Murphy and King (2020). 15. Mongey (2020) points out the first two weeks of the COVID-19 shutdown period
11. Staff (2020). had more unemployment claims in excess of the previous 12-month average, than
12. Badka et al (2020). the entire first year of the GFC.
13. Ibid. 16. RBA (2020a).
Grattan Institute 2020 8Shutdown: estimating the COVID-19 employment shock
Box 2: When will we have actual data on the employment shock?
Unfortunately, administrative data on the number of people claiming will provide important information about the size of the employment
unemployment benefits in Australia is released only after a long and shock. The full extent may not be apparent until subsequent labour
variable lag. As at mid-April 2020, the most recently-released data force releases.
on the number of people claiming Newstart and Youth Allowance
(Other), the payments for jobseekers, relates to December 2019.a
Figure 1.3: The ABS labour force survey data was collected before
The Department of Social Services also releases information on the
searches for ‘Centrelink’ surged
demographics of payment recipients; the latest data are from the Google searches in Australia for ‘Centrelink’ per day, as a percentage of the
September quarter of 2019.b It may be many months before data are most searches since 1 January 2020
released on the number of benefit recipients in March and April 2020. March labour force
survey asks about
The ABS released the results of the March labour force survey on this period
● ●
16 April, with more detailed data to follow on 23 April. But this data 100 New
rules Stricter
reflects the state of the labour market before many of the current Travel
restrictions
Travel
restrictions
for
pubs, social
on China on Iran cafes, distancing
restrictions were imposed. The survey was conducted between 8 and gyms, requirements
etc
21 March, with respondents asked about their labour force status the 75
Gatherings
of >500
week before – from 1 to 14 March. The restrictions on pubs, cafes, people
banned
restaurants, gyms, and other businesses did not take effect until midday
on 23 March. Daily data from Google Trends shows that the number of 50
Australians searching for ‘Centrelink’ was only mildly elevated during
early-to-mid March, when the ABS labour force survey was conducted.
Searches for ‘Centrelink’ soared on 22 March (Figure 1.3). 25
The April labour force survey will reflect the effect of the shutdown
and spatial distancing – but the results will not be released until
0
mid-May. Nevertheless, the ABS has responded extremely quickly 1 January 1 February 1 March 1 April
to the crisis. It has announced a range of special data collections Notes: Data normalised by Google: the number of searches for a given term in a day
related to COVID-19, including a survey of households on the impact is divided by all searches in Australia on that day; the result is re-scaled so 100 is the
of COVID-19, and a new weekly release of jobs and wages information maximum normalised search volume over the period. Not seasonally adjusted.
sourced from payroll data.c These are very welcome initiatives that Source: Google Trends.
a. Department of Social Services (2020).
b. Department of Social Services (2019).
c. Gruen (2020a); and Gruen (2020b).
Grattan Institute 2020 9Shutdown: estimating the COVID-19 employment shock
Figure 1.4: Job postings in Australia have fallen further from last year’s Figure 1.5: Unemployment insurance claims in the US have hit a record
trend, than in most other nations high
Percentage decrease in job postings on Indeed relative to one year ago, as at Number of unemployment insurance claims per week in the United States
10 April 2020 7m Week ending 28 March
New Zealand Week ending 4 April
Australia 6m
United Kingdom
Week ending 11 April
5m
Canada
Ireland
4m
Italy
Week ending 21 March
France 3m
United States
2m
Netherlands
Belgium
1m Volcker
Stagflation GFC
Germany recession
Singapore 0m
1970 1980 1990 2000 2010 2020
-60% -50% -40% -30% -20% -10% 0% Note: Seasonally adjusted data.
Source: Pickering (2020). Source: FRED (2020).
Grattan Institute 2020 10Shutdown: estimating the COVID-19 employment shock
There is considerable uncertainty about the near-term outlook for the
Australian economy. Much will depend on the success of the efforts
to contain the virus and how long the social distancing measures Figure 1.6: Unemployment is expected to top 10 per cent in the June
need to remain in place. A very large economic contraction is, quarter and forecasts have been revised up
however, expected to be recorded in the June quarter and the Forecasts of Australia’s unemployment rate in June quarter 2020
unemployment rate is expected to increase to its highest level for
many years.17 15%
The RBA hasn’t yet released updated macroeconomic forecasts since
● ●
the COVID-19 response took hold. The next edition of the RBA’s
Statement on Monetary Policy is due in mid-May.
● ● ● JP
Treasury forecasts that the unemployment rate will reach 10 per cent in ● Morgan
the June quarter, according to a statement issued by the Treasurer on
10% ● Treasury
14 April.18 The Treasurer’s statement indicates that Treasury predicted ●
that the unemployment rate would have reached 15 per cent if not for ANZ
the JobKeeper program.19
Several researchers have estimated the labour force shock in Australia
using a ‘bottom-up’ approach. They use their judgement to assess ●
●
which industries are at particular risk of contracting due to spatial ● ● ● ● ● ● ●
●
distancing and mandated shutdowns, and count the number of workers 5% ● ● ● ● ●
in those industries, thereby arriving at an estimate of the number of
jobs that could be lost.
RBA
Borland (2020a) uses this method and finds that 1.4 million workers are
likely to be directly affected by spatial distancing closures, with more at
risk if households tighten their spending. The most exposed industry,
unsurprisingly, is hospitality. Cassells et al (2020) use a similar method,
0%
and project that 1.1 million workers will lose their job – with most of the 1 February 1 March 1 April 1 May
job losses to occur in the next three months. Date forecast issued
Sources: RBA Statement on Monetary Policy; JP Morgan Australia and New Zealand
17. Lowe (2020a). Weekly Prospects; ANZ Macro Weekly.
18. Frydenberg (2020).
19. The impact of JobKeeper on the labour force statistics is discussed further in
Section 3.5.
Grattan Institute 2020 11Shutdown: estimating the COVID-19 employment shock
Financial market economists have come up with a range of forecasts
Box 3: How many jobs can be done from home?
for the Australian unemployment rate. Most now expect a rate in
low-double digits in the June quarter of 2020. These estimates were A recent paper by University of Chicago researchers uses O*NET
revised upwards very rapidly and to a striking extent through March. data to count the number of jobs which can be done from home
Two representative forecasts from financial institutions are shown in in the US.a They find about 37 per cent of US jobs can plausibly
Figure 1.6 on the preceding page, along with the latest public forecasts be performed at home. The researchers designate whether a job
from the RBA and Treasury. ANZ now expects the unemployment rate can be done from home by looking at its context and occupational
to reach 9.5 per cent in the June quarter – it had previously forecast a activities. For example, a job where the average respondent says
13 per cent rate, prior to the announcement of the JobKeeper program. they use email less than once a month, or a job where most
JP Morgan still expects unemployment to reach 11.4 per cent. Both respondents say they work outdoors every day, is unlikely to be
institutions – and others – revised up their forecasts dramatically easily done from home.b Mongey and Weinberg (2020) extend this
through March. Forecasts from other financial institutions are broadly analysis to show that employees who can work from home tend to
similar. Westpac is forecasting a peak unemployment rate of 9 per cent, be better off, on a range of dimensions, than those who can’t.
and states that it would have expected unemployment to reach 17 per
We have taken the ‘work from home classifications’ for each
cent if not for the JobKeeper Payment.20
US occupation from Dingel and Neiman (2020), and applied
them to the Australian labour force using the method described
1.3.2 Estimates for other advanced economies in Section 2.2. We find that the Australian results are almost
Researchers from government departments and think tanks in other identical: 38.6 per cent of jobs, accounting for 39.7 per cent of
advanced economies have predicted the employment effects of hours worked, can be done from home.c
spatial distancing in their own countries using a range of methods
Yet this figure cannot be easily translated into an expected number
(Table 1.1). Some use a ‘bottom-up’ approach, as per Borland (2020a)
of jobs lost. Not all jobs which have to be done in-person are
and Cassells et al (2020), while others use a ‘top-down’ approach.
going to be shut down. People who work in ‘essential services’
A ‘top-down’ approach generally involves making a prediction about
are being implored to continue to report to work if well. Other jobs
the pace of GDP growth, and then using the historical relationship
will be adapted to a remote setting. It nevertheless provides an
between GDP and unemployment to predict the unemployment rate.21
important fact about the labour market – about 60 per cent of jobs
But the nature of the COVID-19 downturn means that the historical
have traditionally needed to be performed in person.
GDP-unemployment relationship may not hold in 2020, so a ‘bottom-up’
approach may yield more realistic estimates of job losses. The a. Dingel and Neiman (2020).
b. See the Appendix to Dingel and Neiman (ibid) for their full methodology.
COVID-19 shock has hit labour-intensive industries, such as hospitality,
c. Dingle and Neiman also use a second method where they manually code
hardest of all, which will affect the GDP-unemployment relationship. whether a profession can be done at home. Using manual classifications,
they estimate that 32 per cent of jobs can be done at home. When applying
20. B. Evans (2020). their manual classifications, we again find a similar result: 33.7 per cent of
21. This relationship is known as ‘Okun’s Law’. Australian jobs can be done at home.
Grattan Institute 2020 12Shutdown: estimating the COVID-19 employment shock
Forecasts across countries vary significantly. Several are shown in Table 1.1: Labour market predictions for other advanced economies
Table 1.1. In the Netherlands, the Bureau for Economic Policy Analysis
Country Source Method and Prediction
(2020) estimates that unemployment will rise to a comparatively low assumptions
8.4 per cent, while in the US, Gascon (2020) suggests that up to 46
US Gascon (ibid) Classifies occupations 46% of workers are at
per cent of workers are at high risk of being laid-off. Researchers from into those at ‘high risk’ high risk of layoff
the St Louis Fed estimate that the unemployment rate for the US in the of layoff
June quarter of 2020 could be anywhere between 10.5 per cent and Leibovici et al Uses O*NET to group 22% of workers in high-
40.6 per cent – a range that reflects both the size and uncertainty of (2020) occupations into low, contact occupations, at
medium, and high risk of job loss
the employment shock.22 Researchers have also estimated that only a contact-intensity
minority of jobs can be done from home – meaning that relatively few Dingel and Uses O*NET to estimate About 60% of jobs
workers are truly insulated from the COVID-19 shock (see Box 3). Neiman (2020) the share of jobs that cannot be done at home
cannot be done at home
The employment effects of spatial distancing are likely to vary across Wolfe and Based on financial 20 million jobs lost by
countries, and Australia’s economy is different to those in Table 1.1, Cooper (2020) economist GDP July 2020
with a different contribution to total employment from each industry. predictions
Swagel (2020) Spatial distancing Unemployment exceeds
However, international analysis still provides an additional reference
scaled back 75% during 10% in Q2 2020
point for Australian estimates. International findings also underline the the second half of 2020
fact that all economies around the world are being severely affected by
Canada PBO (2020) Self-isolation measures Unemployment reaches
the COVID-19 crisis – regardless of their composition. This in itself is end in August. OPEC 15% in Q3 2020,
likely to affect the pace of the recovery from the crisis because, unlike does not limit oil supply recovers to 12.7% in
in previous recessions, there is no country untouched by the slump. Q4 2020
France Barrot et al Counts the number of Active workforce
(2020) workers affected by declines by 52%
French administrative
closures and
confinement policies
Netherlands Bureau for Physical contact Unemployment reaches
Economic restrictions for 6 months, 6.3% in 2020 and 8.4%
Policy Analysis no direct recovery after in 2021
(2020) restrictions lifted
Ireland McQuinn et al 12-week shutdown Unemployment reaches
(2020) 18% in Q2 2020, then
recovers to 11% in Q4
2020
22. Faria-e-Castro (2020).
Grattan Institute 2020 13Shutdown: estimating the COVID-19 employment shock
2 How do we estimate the size of the employment shock?
The economic situation facing Australia and other advanced economies 2.1 What we are measuring
is quite literally unprecedented. The pandemic-induced shutdown does
We estimate the likely effect of spatial distancing and mandated
not resemble ‘ordinary’ recessions, and previous pandemics have not
shutdowns on the number of hours worked and the number of people
been of the same magnitude, or they occurred so long ago that few
doing paid work in Australia in the second quarter of 2020.23 Our
relevant economic insights can be gleaned from them. This means that
results do not easily translate into the numbers found in the ABS
estimating the size of the COVID-19 employment shock is particularly
labour force survey, such as the number of employed people or the
difficult. This working paper represents our best attempt to forecast the
unemployment rate.24 The translation of our results into standard
size of the shock, under conditions of extreme uncertainty and limited
employment and unemployment figures is considered in Section 3.5
information.
on page 24.
This chapter outlines our methods for estimating the size of the We estimate the direct, immediate effect of the COVID-19 response
COVID-19 shock to employment in Australia. Our methods are on the labour market. We assume the restrictions on personal and
based on either data about occupations’ characteristics, or Grattan business activity broadly in place as at early April 2020 will continue for
researchers’ judgement about the likelihood of job losses within at least another month, and will likely remain in place through June.25
individual industries, or both.
Our estimates do not take into account further negative effects from
Our starting point is to assume that the probability a particular job will reduced overall spending in the economy – the ‘second round’ effect.
be lost as a result of COVID-19 depends on whether the job requires Nor do our figures account for the positive effect of government
physical proximity to other people. In general, we assume jobs that stimulus, both fiscal and monetary. Some attempt is made to factor in
require workers to be near other people – their co-workers or the the effect of policy decisions such as the JobKeeper payment when
public – are more likely to be lost than jobs that do not require physical translating the hours worked estimates into estimates of the number of
proximity. We translate jobs’ physical proximity requirements into a
probability that the job will be lost as a result of COVID-19. 23. Estimates of the number of affected workers are ‘raw’ – they do not refer to
‘full-time equivalents’. We include all employed persons in our figures. Our
estimates are based on workers’ main occupation – where they hold multiple jobs,
We also use a method that does not rely on the physical proximity our estimates pertain only to the main job.
measure, as a cross-check on the proximity-based measures. For this 24. We estimate the number of people who will cease working as a result of
method, Grattan researchers manually estimated the percentage of COVID-19, but it is possible to not be carrying out paid work and still be
jobs that will be lost within each sub-industry. Our preferred method considered ‘employed’.
25. Prime Minister Scott Morrison recently signalled that current restrictions would
combines the two, giving an estimate of the likelihood that a job will be remain in place for at least four weeks. Hayne (2020). However in practice
lost based on both the occupation’s physical proximity requirement and restrictions, if lifted, will likely only be relaxed gradually over a number of months.
our manual estimates of industry-level job risks. Daley and Duckett (2020).
Grattan Institute 2020 14Shutdown: estimating the COVID-19 employment shock
employed people and the unemployment rate, since by its design the Figure 2.1: Most jobs require at least some physical proximity to other
JobKeeper payment will obscure some of the effect of job losses on the people
Number of occupations, by the degree to which they require physical proximity
unemployment rate (Box 4 on page 24).
to other people
30
2.2 The data we use
O*NET data on physical proximity
We begin with data from the Occupational Information Network
(O*NET) on the degree of physical proximity required by various 20
occupations in the United States. O*NET, which is sponsored by the
US Department of Labour, conducts extensive surveys to understand
the ‘anatomy of an occupation’ – its database is the United States’ main Physical
therapists
source of information on the nature of individual occupations.26 10
Each job demands different knowledge, skills, and abilities – and
Fine
each job requires workers to perform different tasks and activities. artists
The O*NET database quantifies these characteristics, in the form
of hundreds of standardised descriptors about each occupation. 0
The database contains information about almost 1,000 occupations, 0 25 50 75 100
Unscaled O*NET proximity scores
covering almost the entire US economy.27 O*NET collects the data for
Source: O*NET occupational characteristics database.
these descriptors by surveying workers in each occupation and asking
them about their work and the tasks they perform.28
O*NET provides the following guide for interpreting physical proximity
Our analysis uses the ‘physical proximity’ occupational attribute from
scores:
O*NET, to identify which occupations are at risk of job loss due to
coronavirus-related shutdowns and spatial distancing. These proximity
• Score of 0: I don’t work near other people (they are more than 100
scores are based on a question O*NET asks workers: ‘To what extent
feet away)
does this job require the worker to perform job tasks in close physical
proximity to other people?’ Responses are recorded on a 0-to-100 • Score of 25: I work with others but not closely (e.g., in a private
scale. The higher the score, the closer the proximity. office)
26. O*NET Resource Center (2020). • Score of 50: Slightly close (e.g., in a shared office)
27. Ibid.
28. O*NET (2018). • Score of 75: Moderately close (at arm’s length)
Grattan Institute 2020 15Shutdown: estimating the COVID-19 employment shock
• Score of 100: Very close (near touching)29 are not always perfect. In some cases a US occupation matches with
multiple Australian occupations; in these cases, the CSIRO researchers
Figure 2.1 on the previous page shows the distribution of these scores have identified, and we use, a ‘primary’ match.
for individual US occupations. Very few score less than 25 on this
measure. Most are somewhere in the middle. The top of the distribution We assume that an occupation in the US and its equivalent in Australia
is dominated by occupations that require workers to touch other people, require the same degree of physical proximity to other people.
such as a range of health professions.
We scale and square the O*NET proximity scores.30 Data on the number of people in different occupations and industries
We use the 2016 Census to obtain the number of employees in each
Converting US occupations to their Australian equivalents industry-occupation combination, and the number of hours that they
work.33 There are 17,680 unique occupation-industry combinations in
The O*NET data measures the extent to which occupations – such
Australia. People with occupations or industries recorded as ‘not stated’
as ‘dental hygienists’, ‘barbers’, or ‘court clerks’ – require physical
or ‘inadequately described’ were excluded. To align our figures with the
proximity. Occupations in the US are classified under the US Standard
scope of the ABS labour force survey, we restrict the Census data to
Occupational Classification System (US SOC). Australia uses
civilians (i.e. excluding Defence Force personnel) aged 15 and older.
a different framework, the Australia and New Zealand Standard
The Census gives us a reliable measure of the number of people in
Classification of Occupations (ANZSCO), but the two frameworks are
each occupation, within each industry.34
broadly similar.31
We use a ‘SOC-ANZSCO correspondence table’ to translate the The drawback with using Census data is that it is now several years
American occupations into their Australian equivalents.32 The matches old. The workforce has grown since 2016. The number of people in
each individual occupation and industry may have grown or contracted.
29. O*NET Online (2020). We need to scale up the Census numbers. We use the labour force
30. We scale so that the occupation that requires the highest degree of physical
survey to do so.
proximity has a value of 1, and the lowest has a value of 0. We then square those
scaled values, which has the effect of leaving high-proximity occupations’ scores
relatively unaffected while dragging down those in the middle of the distribution. We use the February 2020 release of the quarterly detailed labour
This transformation – scaling and squaring the proximity scores – is crucial to force survey to scale up or down the number of people in each
some of our estimates of job loss. We have a limited basis on which to judge occupation.35 We use a four-quarter rolling average of the labour force
whether this transformation of the raw proximity scores is the appropriate one.
We produce job-loss estimates that do not rely on the proximity scores as a
cross-check that this approach produces plausible results. In Appendix A we also 33. We examine 4-digit occupations and 2-digit industries.
examine the validity of the transformation. 34. Sample surveys are not well-equipped to do this, because the sample size within
31. Both are aligned with the International Standard Classification of Occupations, any occupation-industry cell is too small – or even non-existent. We examine
created by the International Labour Organization. 17,680 occupation-industry cells, whereas the monthly labour force survey is of
32. The table was provided to Grattan by CSIRO researchers Andrew Reeson and only about 26,000 dwellings (housing about 66,000 civilians aged 15+).
Gavin Walker. We are very grateful for their assistance. 35. ABS (2020c).
Grattan Institute 2020 16Shutdown: estimating the COVID-19 employment shock
figures to smooth spikes in numbers. This is especially important for researchers manually estimated what they judged to be the likely effect
occupations with small numbers of people employed. on employment in each of 88 industries.38 The median of researchers’
estimates was used as the industry-level job loss probability.
Job loss probabilities by industry
The probability that a particular job will be lost is determined not only by 2.3 Our methods
the nature of the occupation, but also the nature of the industry. People We use three methods for combining this information on occupations
working in most occupations in the health industry, for example, will and industries to arrive at estimates of the impact of the COVID-19
be relatively safe from job losses: a cleaner at a hospital is unlikely to crisis on employment and hours worked in Australia.39
lose their job, but a cleaner of a pub might. We therefore need to take
industry as well as occupation into account in estimating how much Our preferred method uses both the occupation-level proximity scores
each job is at risk of being lost. We use two data sources to quantify and Grattan researchers’ manually-estimated probabilities of job loss
the risk to each industry. in each of the 88 industries. In this method, each job has a probability
of job loss given by the (arithmetic) mean of the scaled-and-squared
The first approach is based on the occupational physical proximity
occupational physical proximity scores and the manually-assigned
scores. We calculate industry physical proximity scores as the
industry job loss probabilities. We prefer this method because it
weighted average of physical proximity scores of the occupations in
incorporates more information. Combining the proximity-based
the industry.36 We manually specify industry proximity scores for the
occupational scores with judgement-based industry estimates provides
healthcare and social assistance industry, and the public administration
a way to incorporate a broader range of information about the likely
and safety industry, so that these industries contain zero job loss risk.37
labour market impacts of COVID-19 than using one data source only.
Industries that rely on physical proximity – such as hospitality – will be
more at risk than those that do not. We assume that all occupations Alternative method one uses the occupation- and industry-level
within a high-risk industry are at greater risk of job loss than the same proximity scores to estimate the likelihood of job loss. It does not use
occupations in a low-risk industry. Grattan researchers’ manually-estimated job loss probabilities. For this
method, we assume each job has a probability of job loss equal to the
The second approach to quantifying industries’ job-loss probabilities harmonic mean of the scaled-and-squared occupational and industry
is entirely separate from the proximity-based approach. Grattan
36. The occupational proximity scores are scaled and squared before calculating the 38. Grattan staff gave each of the 88 2-digit ANZSIC codes a rating of -100 per cent
industry-level weighted averages. (complete job loss), -75 per cent, -50 per cent, -25 per cent, 0 (no job loss), or +10
37. Physical proximity scores classify the health industry and occupations within it per cent (job gains). Estimates were collected in these rough bins to avoid giving
as high risk due to their requirement for close human contact. But we expect the the impression of false precision.
health industry as a whole to be safe from job losses during this period. Individual 39. Note that by ‘employment’ here we mean the number of people actually carrying
occupations, such as physiotherapists or dental hygienists, may suffer job loss, out paid work, as opposed to being stood down. The difficulty of translating these
while others, such as nurses, may experience an increase in employment and figures into estimates of employment that align with the ABS labour force survey
hours worked. We assume the net effect is zero. measurement framework is discussed in Section 3.5.
Grattan Institute 2020 17Shutdown: estimating the COVID-19 employment shock
physical proximity scores. We set the industry scores to zero for jobs in estimates, and it is not possible to quantify that uncertainty. We present
the public administration industry and the hospitals sub-industry. results using the three methods outlined above, but these results do not
represent upper and lower bounds on the plausible range of outcomes.
Alternative method two does not use the proximity scores at all. Australia – indeed, the world – is facing a situation without modern
Instead, it uses Grattan researchers’ manually-estimated probabilities precedent. Forecasting the effect on the labour market is fraught with
of job loss in each of the 88 sub-industries.40 For this method, we do difficulty.
not distinguish between different occupations in an industry.
Our methods do not account for the prospect that firms adjust their
2.4 Limitations operations in response to social distancing directives, altering the
need for proximity in jobs compared to the O*NET data upon which
We assume that, broadly speaking, the level of restrictions in place our estimates are based. For example, many restaurants have shifted
in early April remain in place through the second quarter of 2020.41 from in-house dining to take away and delivery only. Our estimates
This was the basis on which our manual industry-level estimates of may therefore overestimate the degree to which jobs continue to
the probability of job loss were constructed. If the level of restrictions require physical proximity today, inflating our estimates of the jobs
is changed, this would obviously affect the number of people who will lost as a result of COVID-19. Similarly, some workers may instead find
lose their jobs. themselves on reduced hours rather than being out of work entirely.
Our approach does not enable us to estimate these effects with any On the other hand, our methods do not factor in any additional
precision – such as quantifying the employment consequences of job loss caused by deficient aggregate demand, over and above
moving up from Stage Three to Stage Four restrictions, or moving the direct effects of spatial distancing and shutdowns. Nor do they
from Stage Three back to Stage Two, although this may be the focus of factor in the boost to aggregate demand from fiscal and monetary
future work. One difficulty is that the employment effects of COVID-19 stimulus. although such stimulus in unlikely to materially affect the hit
are affected not only by government policy; voluntary spatial distancing to employment in those occupations and industries directly affected by
over and above that mandated by government can affect the number of spatial distancing. We attempt to factor in the JobKeeper program when
businesses that are open, and the number of people they employ.42 translating our results to an estimate of the change in employment, as
measured by the ABS (see Section 3.5).
The figures we obtain using these methods are approximate and
indicative. There is a high degree of uncertainty around these
40. ‘Sub-industries’ here refers to two-digit industries in the ANZSIC framework.
41. While the Federal Government has flagged some restrictions may be relaxed,
starting in late May, restrictions are likely to only be relaxed very gradually to
prevent the re-emergence of COVID-19. Hayne (2020).
42. For example, restaurant reservations in many countries had already declined
sharply well before before public health authorities required them to close. The
state of the restaurant industry (2020).
Grattan Institute 2020 18Shutdown: estimating the COVID-19 employment shock
3 Our estimates of the employment shock
Using the methods outlined in Chapter 2, we estimate that between Figure 3.1: About a fifth to a quarter of Australians are likely to be out of
14 and 26 per cent of workers will be out of work as a result of the work due to COVID-19
Estimated proportion of jobs and hours worked likely to be lost due to spatial
COVID-19 shutdown and spatial distancing (Figure 3.1). Our preferred
distancing and shutdown
method gives results at the top end of that range. These estimates are
approximate, indicative, and subject to a high level of uncertainty.
Each of our methods yields slightly different results, but all are in broad
agreement: somewhere around a fifth to a quarter of workers are
likely to be out of work as a result of the COVID-19 policy response.
Our preferred method suggests about 26 per cent of workers will be
out of work. In February 2020, 13.01 million people in Australia were
employed – so 3.43 million Australians could lose work. Some may
quickly return as spatial distancing measures are relaxed, but a shock
to employment of this size and speed is unprecedented in Australia.
We find, unsurprisingly, that the hospitality industry is likely to be the
hardest hit, with more than half of workers in that industry thrown out
of work. Younger workers are more likely to be affected than older
workers. Lower-income workers are twice as likely to be out of work
than the highest income-earners. Women appear to be slightly more
likely to be out of work than men. But we expect the hit to employment
will be large in most industries, all age groups, and for men and
women.
Our estimates relate to the June quarter of 2020. They refer to the
number of people actually doing paid work – as opposed to people
who are technically ‘employed’ but are not working. The distinction is
discussed in Section 3.5. Our estimates also only to jobs or hours likely
to be lost as a result of shutdowns and spatial distancing – they do not
incorporate any further negative effects from lower aggregate demand, Notes: See Chapter 2 for description of methods. ‘Workers’ or ‘jobs’ refers to people
nor any offsetting boost to employment from fiscal or monetary doing paid work.
stimulus. Sources: Grattan analysis of O*NET Online (2020), ABS (2016) and ABS (2020c).
Grattan Institute 2020 19Shutdown: estimating the COVID-19 employment shock
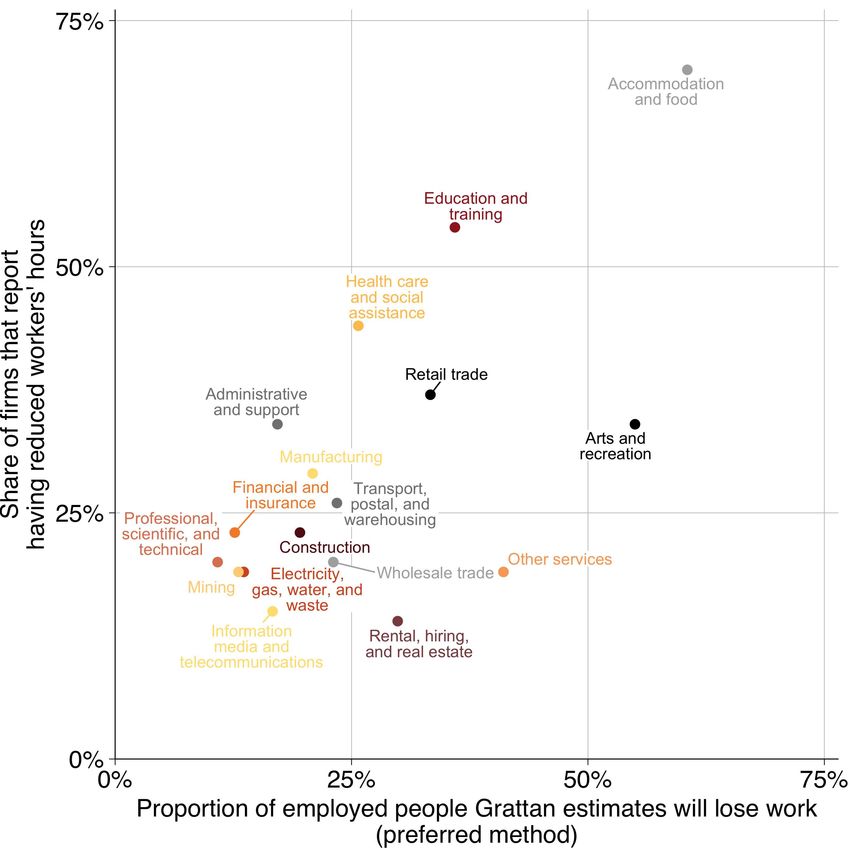
3.1 Many will lose work in hospitality and the arts
Unsurprisingly, we expect that the hospitality industry – ‘accommoda-
Figure 3.2: Hospitality and the arts will be hardest hit
tion and food services’ – will be the hardest hit (Figure 3.2). Most jobs
Estimated percentage of workers who will be out of work, by industry
in this industry require a high degree of proximity to other people, and
the industry has been hit hard by government-mandated shutdowns.
Our preferred method suggests about two-thirds of hospitality workers
could be off work. Nearly 40 per cent of workers in this industry are
short-term casual workers who will be ineligible for the JobKeeper
program.43 The ‘arts and recreation services’ industry follows closely
behind hospitality.
The situation is less clear when it comes to ‘health care and social
assistance’. This industry is large and diverse, encompassing nurses
in public hospitals, who are very unlikely to lose their jobs during this
crisis, as well as workers who are more vulnerable to job loss. For
example, allied health workers in private practice and a range of social
care occupations are more at risk of being out of work. Our preferred
method suggests about a quarter of jobs in this industry are at risk.
Some industries are expected to be less affected by the response to
COVID-19. Jobs that don’t require proximity to other people – and
which can be performed from home – are much less likely to be lost.
Our estimates should be regarded as approximate. In some industries,
the ‘preferred method’ yields results that are likely an over-estimate of
the proportion of people who will lose work, such as in the finance and
mining industries. In others, such as hospitality, the ‘preferred method’
figures may be too low. But on the whole, our estimates broadly align
with ABS figures on the proportion of firms that report reducing working
Notes: See Figure 3.1.
hours in response to COVID-19 (Section 3.4).
Sources: Grattan analysis based on O*NET Online (2020), ABS (2016) and ABS
(2020c).
43. Employees without paid leave entitlements with less than 12 months
continuous service with their employers comprised 38 per cent of all workers in
accommodation and food services: Grattan analysis of ABS (2019a).
Grattan Institute 2020 20Shutdown: estimating the COVID-19 employment shock
3.2 Lower-income workers are likely to be worst affected
Figure 3.3: The lower your income, the higher the probability of losing
The effects of the COVID-19 response will not be felt evenly across the
work
community. People with lower incomes are much more likely to lose
Estimated percentage of workers who will lose work, by weekly personal
work as a result of this crisis than people on higher incomes. This is income
shown in Figure 3.3.
Using our preferred method, we find that about 40 per cent of workers
in the lowest income group are likely to off work during this crisis. This
group includes workers who make less than $150 per week in personal
income. By contrast, people earning more than $3,000 per week have
less than half the risk of losing work.
We find that the lower a person’s income, the more likely it is that their
job is at risk as a result of COVID-19 and the public health response to
the virus.
This is predictable, given the nature of the crisis. People who work in
occupations that require them to be near other people are more likely
to be thrown out of work. Industries like hospitality and retail are heavily
affected, as shown in Figure 3.2. The most-heavily affected industries
tend to have lower wages than industries like professional services,
where fewer jobs require proximity to other people and more can be
done from home.
People on lower incomes are less likely to have enough money in the
bank to see them through a period of unemployment.44 This means
that financial support from government will be essential to see these
workers through the pandemic, as discussed further in Chapter 5.
Notes: See Figure 3.1. Excludes people with no personal income, or negative income.
Sources: Grattan analysis based on O*NET Online (2020), ABS (2016) and ABS
(2020c).
44. See Coates and Cowgill (2020a).
Grattan Institute 2020 21Shutdown: estimating the COVID-19 employment shock
3.3 Younger workers and women will be hit hardest – but plenty Figure 3.4: Younger workers and women will be hit hardest
of older workers and men will lose their jobs, too Estimated percentage of workers who will be out of work, by age
Given that the hospitality industry is expected to suffer the biggest loss
of jobs (Figure 3.2), it is perhaps unsurprising that young people will be
hardest hit.
We estimate that about 40 per cent of employed teenagers will lose
work due to the COVID-19 shutdown and spatial distancing. People
in their 20s are the next most-likely to lose work. All other age groups
have a broadly-similar prospect of losing work, as shown in Figure 3.4.
The proportion of workers who will be thrown out of work by the
COVID-19 response is high for all age groups – around a quarter of
workers even in the older age groups.
Women are disproportionately likely to be employed in the occupations
and industries most affected by the response to COVID-19. We find Estimated percentage of workers who will lose their jobs, by gender
that they face a higher probability of losing their jobs than men (see
Figure 3.4).
3.4 How plausible are our results?
Since the Australian economy has never previously experienced the
kind of shutdown and labour force shock resulting from COVID-19, we
don’t have a way to directly test the validity of our method and results.
As indicated earlier in this chapter, our results should be regarded as
approximate and indicative.
To roughly gauge the plausibility of our results, we compare our
estimates of the proportion of jobs lost in each industry with ABS Notes: See Figure 3.1. Workers aged 70 and older are not shown on these charts, but
survey data on recent firm behaviour. The ABS has asked businesses are included in our analysis.
a series of questions about the impact of COVID-19, as a supplement Sources: Grattan analysis based on O*NET Online (2020), ABS (2016) and ABS
to its regular ‘business indicators’ survey.45 Randomly-selected (2020c).
businesses were asked in the week commencing 30 March 2020
45. ABS (2020b).
Grattan Institute 2020 22You can also read