IER5, a DNA damage response gene, is required for Notch-mediated induction of squamous cell differentiation - eLife
←
→
Page content transcription
If your browser does not render page correctly, please read the page content below
RESEARCH ARTICLE

                                    IER5, a DNA damage response gene, is
                                    required for Notch-mediated induction of
                                    squamous cell differentiation
                                    Li Pan1, Madeleine E Lemieux2, Tom Thomas1, Julia M Rogers3, Colin H Lipper3,
                                    Winston Lee1†, Carl Johnson1, Lynette M Sholl1, Andrew P South4,
                                    Jarrod A Marto1,5, Guillaume O Adelmant1,5, Stephen C Blacklow3, Jon C Aster1*
                                    1
                                     Department of Pathology, Brigham and Women’s Hospital, and Harvard Medical
                                    School, Boston, United States; 2Bioinfo, Plantagenet, Canada; 3Department of
                                    Biological Chemistry and Molecular Pharmacology, Blavatnik Institute, Harvard
                                    Medical School, Boston, United States; 4Department of Dermatology and
                                    Cutaneous Biology, Sidney Kimmel Medical College, Thomas Jefferson University,
                                    Philadelphia, United States; 5Departmentof Oncologic Pathology and Blais
                                    Proteomics Center, Dana FarberCancer Institute, HarvardMedical School, Boston,
                                    United States

                                    Abstract Notch signaling regulates squamous cell proliferation and differentiation and is
                                    frequently disrupted in squamous cell carcinomas, in which Notch is tumor suppressive. Here, we
                                    show that conditional activation of Notch in squamous cells activates a context-specific gene
                                    expression program through lineage-specific regulatory elements. Among direct Notch target
                                    genes are multiple DNA damage response genes, including IER5, which we show is required for
*For correspondence:                Notch-induced differentiation of squamous carcinoma cells and TERT-immortalized keratinocytes.
jaster@rics.bwh.harvard.edu         IER5 is epistatic to PPP2R2A, a gene that encodes the PP2A B55a subunit, which we show interacts
Present address: †                  with IER5 in cells and in purified systems. Thus, Notch and DNA-damage response pathways
Departmentof Pathology,             converge in squamous cells on common genes that promote differentiation, which may serve to
University of Michigan Medical      eliminate damaged cells from the proliferative pool. We further propose that crosstalk involving
School, Ann Arbor, United States    Notch and PP2A enables tuning and integration of Notch signaling with other pathways that
Competing interest: See
                                    regulate squamous differentiation.
page 26
Funding: See page 26

Received: 20 April 2020             Introduction
Accepted: 15 September 2020         Notch receptors participate in a conserved signaling pathway in which successive ligand-mediated
Published: 16 September 2020        proteolytic cleavages by ADAM10 and g-secretase permit intracellular Notch (ICN) to translocate to
                                    the nucleus and form a Notch transcription complex (NTC) with the DNA-binding factor RBPJ and
Reviewing editor: Apurva Sarin,
                                    co-activators of the Mastermind-like (MAML) family (for review, see Bray, 2016). Outcomes of Notch
Institute for Stem Cell Science
and Regenerative Medicine,
                                    activation are dose and cell-context-dependent, in part because most Notch response elements lie
India                               within lineage-specific enhancers (Castel et al., 2013; Ryan et al., 2017; Skalska et al., 2015;
                                    Wang et al., 2014). As a result, Notch-dependent transcriptional programs vary widely across cell
   Copyright Pan et al. This
                                    types.
article is distributed under the
                                       The context-dependency of outcomes produced by Notch signaling is reflected in the varied pat-
terms of the Creative Commons
Attribution License, which          terns of Notch mutations that are found in different cancers (for review, see Aster et al., 2017). In
permits unrestricted use and        some cancers oncogenic gain-of-function Notch mutations predominate, but in human cutaneous
redistribution provided that the    squamous cell carcinoma (SCC) (South et al., 2014; Wang et al., 2011) loss-of-function mutations
original author and source are      are common, early driver events, observations presaged by work showing that loss of Notch function
credited.                           promotes skin cancer development in mouse models (Nicolas et al., 2003; Proweller et al., 2006).

Pan et al. eLife 2020;9:e58081. DOI: https://doi.org/10.7554/eLife.58081                                                          1 of 32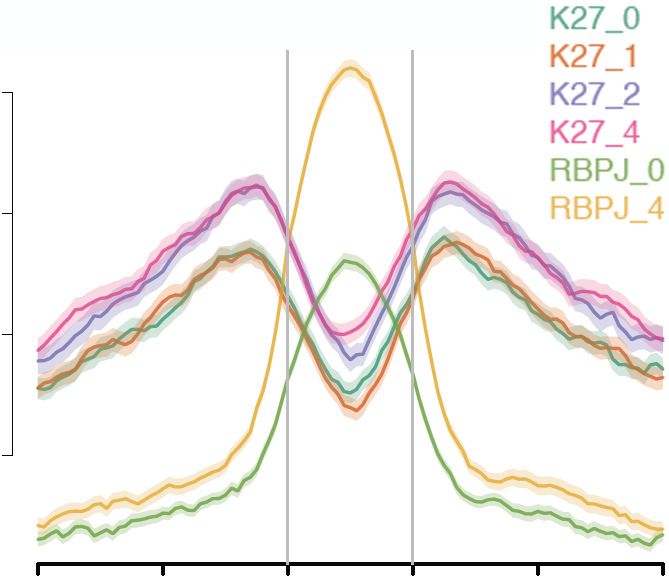
Research article                                                                                      Cancer Biology Cell Biology

                                    The mechanism underlying the tumor suppressive effect of Notch appears to involve its ability to
                                    promote squamous differentiation at the expense of self-renewal, a function that is operative in
                                    other squamous epithelia (Alcolea et al., 2014), where Notch also has tumor suppressive activities
                                    (Agrawal et al., 2011; Agrawal et al., 2012; Loganathan et al., 2020). In line with this idea, condi-
                                    tional ablation of Notch1 in postnatal mice results in epidermal hyperplasia and expansion of prolif-
                                    erating basal-like cells (Nicolas et al., 2003; Rangarajan et al., 2001). Moreover, murine and human
                                    b-papilloma viruses express E6 proteins that target MAML1 and inhibit Notch function
                                    (Meyers et al., 2017; Tan et al., 2012), thereby causing epidermal hyperplasia and delayed differen-
                                    tiation of infected keratinocytes. Conversely, constitutively active forms of Notch enhance keratino-
                                    cyte differentiation in vitro and in vivo (Nickoloff et al., 2002; Rangarajan et al., 2001;
                                    Uyttendaele et al., 2004).
                                        While these studies delineate a pro-differentiation, tumor suppressive role for Notch in squamous
                                    cells, little is known about the Notch target genes that confer this phenotype. Work to date has
                                    focused on candidate genes chosen for their known activities in keratinocytes or their roles as Notch
                                    target genes in other cell types. These include CDKN1A/p21 (Rangarajan et al., 2001), which has
                                    been linked to cell cycle arrest and differentiation (Missero et al., 1996); HES1, which represses
                                    basal fate/self-renewal (Blanpain et al., 2006); and IRF6, expression of which positively correlates
                                    with Notch activation in keratinocytes (Restivo et al., 2011). However, dose- and time-controlled
                                    genome-wide studies to determine the immediate, direct effects of Notch activation in squamous-
                                    lineage cells have yet to be performed.
                                        To this end, we developed and validated 2D and 3D culture models of malignant and non-trans-
                                    formed human squamous epithelial cells in which tightly regulated Notch activation produces growth
                                    arrest and squamous differentiation. We find that immediate, direct Notch target genes are largely
                                    keratinocyte-specific and are associated with lineage-specific NTC-binding enhancers enriched for
                                    the motifs of transcription factors linked to regulation of keratinocyte differentiation, particularly
                                    AP1. Among these targets are multiple genes previously shown to be upregulated by DNA damage
                                    and cell stress, including IER5, a member of the AP1-regulated immediate early response gene fam-
                                    ily (Williams et al., 1999). Here, we show that IER5 is required for Notch-induced differentiation of
                                    human SCC cells and TERT-immortalized human keratinocytes, and that this requirement is abol-
                                    ished by knockout of the B55a regulatory subunit of PP2A, to which IER5 directly binds. Our studies
                                    provide the first genome-wide view of the effects of Notch on gene expression in cutaneous squa-
                                    mous carcinoma cells, highlight previously unrecognized crosstalk between Notch and DNA
                                    response genes, and point to the existence of a Notch-IER5-PP2A signaling axis that coordinates
                                    keratinocyte differentiation.

                                    Establishment of a conditional Notch-on SCC model
                                    Determination of the immediate, direct effects of Notch in a model system requires tightly timed,
                                    switch-like Notch activation. This is difficult to achieve with ligands because simple addition of solu-
                                    ble Notch ligands does not induce signaling (Sun and Artavanis-Tsakonas, 1997). Methods of trig-
                                    gering Notch activation include plating of cells on immobilized ligands (Varnum-Finney et al.,
                                    2000); treatment with EDTA, which renders Notch susceptible to activating cleavages by chelating
                                    Ca2+ and thereby destabilizing the Notch negative regulatory region (Rand et al., 2000); and g-sec-
                                    retase inhibitor (GSI) washout, which reliably delivers a pulse of ICN in 15–30 min to the nuclei of
                                    cells expressing mutated or truncated forms of membrane-tethered Notch (Petrovic et al., 2019;
                                    Ryan et al., 2017; Wang et al., 2014; Weng et al., 2006). Plating of adherent cells on substrate
                                    coated with immobilized ligand is confounded by the need to first produce cell suspensions with
                                    trypsin and/or EDTA, which activates Notch in cells expressing Notch receptors. EDTA treatment
                                    also suffers from several limitations: (i) Notch activation is confined to a period of several minutes
                                    immediately following EDTA addition and is therefore limited in degree and duration, possibly
                                    because chelation of Zn2+ also rapidly inactivates ADAM metalloproteases and (ii) off-target effects
                                    of EDTA, including on surface proteins that mediate cell adhesion. GSI washout is open to criticism
                                    because g-secretase has numerous substrates in addition to Notch receptors, raising questions about
                                    specificity. However, major phenotypes induced by treatment of flies (Micchelli et al., 2003), mice
                                    (van Es et al., 2005), and humans (Aster and Blacklow, 2012) with GSI are all related to Notch inhi-
                                    bition, strongly suggesting that Notch is the dominant GSI substrate at the organismal level. In line
                                    with these observations, in prior work we have noted that cells lacking ongoing Notch signaling

Pan et al. eLife 2020;9:e58081. DOI: https://doi.org/10.7554/eLife.58081                                                             2 of 32
Research article                                                                                       Cancer Biology Cell Biology

                                    show little or no change in phenotype when treated with GSI, and we therefore selected GSI wash-
                                    out to produce timed activation of Notch in cells of squamous lineage.
                                        To create a squamous cell model in which GSI washout activates NOTCH1 (Figure 1A), we first
                                    engineered a cDNA encoding a mutated truncated form of NOTCH1, DEGF-L1596H, that cannot
                                    respond to ligand and that has a point substitution in its negative regulatory region that produces
                                    ligand-independent, g-secretase-dependent Notch activation (Gordon et al., 2009; Malecki et al.,
                                    2006). Notably, when expressed from retroviruses NOTCH1 alleles bearing negative regulatory
                                    region mutations like L1596H generate Notch signals that are sufficient to produce physiologic
                                    effects in hematopoietic stem cells (induction of T cell differentiation) without causing pathophysio-
                                    logic effects (induction of T cell acute lymphoblastic leukemia) (Chiang et al., 2008). Because Notch
                                    transcription complexes appear to largely act through ‘poised’ enhancers primed by lineage-specific
                                    ‘pioneer’ transcription factors (Falo-Sanjuan et al., 2019), we reasoned that squamous cell carci-
                                    noma lines with loss-of-function Notch mutations and little/no ongoing Notch signaling would be an
                                    ideal context in which to identify direct downstream targets of Notch. We therefore transduced
                                    DEGF-L1596H into two human SCC cell lines, IC8 and SCCT2, that have biallelic inactivating muta-
                                    tions in NOTCH1 and TP53 (Inman et al., 2018), lesions that were confirmed by resequencing on a
                                    clinical-grade targeted exome NGS platform (summarized in Tables 1 and 2).
                                        In pilot studies, we observed that the growth of IC8 and SCCT2 cells transduced with empty virus
                                    was unaffected by the presence or absence of GSI, whereas the growth of lines transduced with
                                    DEGF-L1596H was reduced by GSI washout (Figure 1—figure supplement 1A, B). GSI washout was
                                    accompanied by rapid activation of NOTCH1 (ICN1) followed by upregulation of markers of differen-
                                    tiation, such as involucrin (Figure 1—figure supplement 1C, D). Of interest, ICN1 levels reproduc-
                                    ibly peaked at around 4 hr and then declined, suggesting that sustained NOTCH1 activation and
                                    accompanying changes in cell state led to induction of feedback loops that negatively regulate
                                    ICN1. We also observed that IC8-DEGF-L1596H cells formed ‘skin-like’ epithelia when seeded onto
                                    organotypic 3D cultures, whereas SCCT2-DEGF-L1596H cells did not (data not shown); therefore,
                                    additional studies focused on IC8 cells and derivatives thereof.
                                        To further characterize and validate our system, we performed single-cell cloning of IC8 DEGF-
                                    L1596H cells and observed that differentiation following GSI washout correlated with ICN1 accumu-
                                    lation (Figure 1—figure supplement 2A and B). The subclone SC2, which showed moderate accu-
                                    mulation of ICN1 and sharply reduced growth following GSI washout, was selected for further study.
                                    The ability of SC2 cells to form a multilayered epithelium in the Notch-on, growth suppressive state
                                    appears to stem from an unexpected property that emerged in 3D cultures, namely the self-organi-
                                    zation of these cells into a proliferating, ICN1-low basal layer in contact with matrix and a non-prolif-
                                    erating, ICN1-high suprabasal layer (Figure 1—figure supplement 2C). The self-organization of
                                    Notch-on SC2 cells grown on collagen rafts into ICN1-low basal proliferating cells and ICN1-high
                                    suprabasal non-proliferating cells suggested that contact of SC2 cells with collagen reduces ICN1
                                    levels. To test this idea, we plated SC2 cells on plastic or collagen, washed out GSI, and compared
                                    ICN1 levels by western blotting. As shown in Figure 1—figure supplement 2D, culture of SC2 cells
                                    on collagen sharply reduced ICN1 levels, whereas the level of total NOTCH1 polypeptides was
                                    unchanged or slightly increased in cells grown on collagen. These observations point to the exis-
                                    tence of one or more matrix-dependent effects that decrease ICN1 levels and which may serve to
                                    reinforce the ‘Notch-low’ status of basal keratinocytes.
                                        We also noted that the growth arrest induced by GSI washout in SC2 cells was blocked by domi-
                                    nant-negative MAML1 (DN-MAML), a specific inhibitor of Notch-dependent transcription
                                    (Figure 1B; Nam et al., 2007; Weng et al., 2003), confirming that the growth inhibitory effects of
                                    GSI washout are mediated through Notch activation. Growth arrest occurred several days after
                                    Notch activation (compare Figure 1B and C) and was accompanied by upregulation of multiple
                                    markers of squamous differentiation, such as involucrin, keratin1, and plakophilin1, in 2D
                                    (Figure 1C–E) and in 3D cultures (Figure 1F). In addition, we also noted that staining for keratin14,
                                    a prototypic marker of proliferating basal keratinocytes (Fuchs, 1995), became more sharply local-
                                    ized to basal cells in Notch-on SC2 cells (Figure 1F).
                                        Although Notch activation in IC8 and SC2 cells clearly induced expression of squamous differenti-
                                    ation markers, the distribution of these markers in 3D cultures failed to precisely mimic that of nor-
                                    mal epidermis, as staining for involucrin and plakophilin-1 was seen in proliferating keratin14-
                                    positive basal cells. The observed expression of spinous markers in ICN1-low proliferating basal cells

Pan et al. eLife 2020;9:e58081. DOI: https://doi.org/10.7554/eLife.58081                                                              3 of 32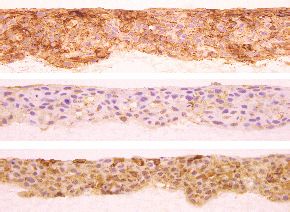
Research article                                                                                                                              Cancer Biology Cell Biology

      A                                                               B                                60
                                                                                                                         GSI, SC2/EV
                                                                                                       50                DMSO, SC2/EV
                                                                                                                         GSI, SC2/DN-MAML
                                                                                                                         DMSO, SC2/DN-MAML
                                                                                                       40

                                                                           Fluorescence
                                                                            units X1000
                                                                                                       30

                                                                                                       20

                                                                                                       10                                     ***           ****
                                                                                                        0
                                                                                                               Day 1         Day 3            Day 5         Day 7

      C                                                               D                                600
                                                                                                                                     **
                                                                                                                KRT1
       WO (h) 0 0.5      1    2   4    8    24 48 72

                                                                            Relative mRNA Expression
                                                                                                       500
                                                                                                                IVL
                                                         ICN1
                                                                                                       400
                                                         Involucrin                                                                       *
                                                                                                       300

                                                         Actin                                         200

                                                                                                       100

                                                                                                         0
                                                                                                             control GSI control WO DN-MAML DN-MAML
                                                                                                                                      GSI     WO

                                                                       F                                               GSI                          WO
       E
                                                                       ICN1
    WO (days)        0                 6                 8

                                                                           IVL

        IVL

                                                                       PKP1

      PKP1
                                                                       KRT1

                                                                      KRT14

Figure 1. Notch activation induces growth arrest and differentiation of squamous carcinoma cells. (A) Strategy used to activate Notch in a tightly
regulated fashion. (B) Notch-induced suppression of SC2 cell growth in standard cultures is abrogated by DN-MAML, a specific inhibitor of canonical
Notch signaling. SC2 cells were transduced with empty MigRI virus (EV) or with MigRI virus encoding DN-MAML. Cell numbers at various times post-
GSI washout (DMSO vehicle alone) or sham GSI-washout (GSI) were assessed using Cell Titer-Blue on biological replicates performed in quadruplicate.
Figure 1 continued on next page

Pan et al. eLife 2020;9:e58081. DOI: https://doi.org/10.7554/eLife.58081                                                                                                     4 of 32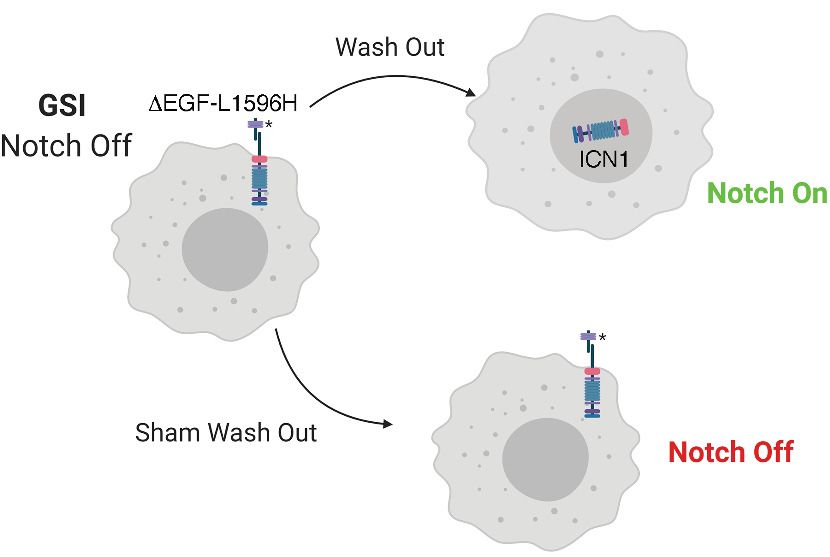
Research article                                                                                                Cancer Biology Cell Biology

Figure 1 continued
Error bars represent standard deviations. Timepoints with significantly different cell growth between Notch-on cells (DMSO, empty vector) and Notch-
off cells (GSI, empty vector; DMSO, DN-MAML1; and GSI, DN-MAML1) are denoted with *** (p
Research article                                                                                  Cancer Biology Cell Biology

                                    Table 1. Sequence variants, IC8* and SCCT2** squamous cell carcinoma cell lines.
                                    Gene                          Variant                                       Variant allele frequency
                                                                                          IC8 cell
                                    CASP8                         c.971T > C(p.M324T)                           66% of 411 reads
                                    FBXW7                         c.1633T > C(p.Y545H)                          33% of 195 reads
                                    KMT2D                         c.7412G > A(p.R2471Q)                         42% of 255 reads
                                    MGA                           c.5599G > A(p.V1867I)                         39% of 710 reads
                                    MTOR                          c.4828G > A(p.E1610K)                         56% of 280 reads
                                    NOTCH1                        c.5059C > T (p.Q1687*)                        100% of 412 reads
                                    PAXIP1                        c.2023C > T(p.H675Y)                          17% of 384 reads
                                    PMS1                          c.566_567delTCinsAT(p.V189D)                  36% of 108 reads
                                    RIF1                          c.658G > A(p.E220K)                           62% of 251 reads
                                    ROS1                          c.1144T > G(p.Y382D)                          87% of 169 reads
                                    ROS1                          c.1164+2_1164+8delTTAGTCC ()                  19% of 191 reads
                                    SDHA                          c.1627T > C(p.Y543H)                          56% of 668 reads
                                    SF3B1                         c.2549T > C(p.I850T)                          31% of 246 reads
                                    TERT                          CC242-243TT promoter mutation                 50% of 26 reads
                                    TP53                          c.451C > T(p.P151S)                           100% of 366 reads
                                    WHSC1                         c.2185C > T(p.R729C)                          66% of 410 reads
                                    WWTR1                         c.551T > G (p.V184G)                          64% of 256 reads
                                    ZNF217                        c.2590C > T(p.L864F)                          39% of 835 reads
                                    ZNF217                        c.1162delC(p.H388Tfs*77)                      55% of 822 reads
                                                                                         SCCT2 Cell
                                    ALK                           c.2854G > A (p.G952R)                         50% of 441 reads
                                    ASXL1                         c.3959C > T (p.A1320V)                        31% of 930 reads
                                    BRD3                          c.533C > T (p.S178F)                          49% of 281 reads
                                    BRD4                          c.3915_3917dupTGC (p.A1306dup)                45% of 170 reads
                                    CDH4                          c.1801C > T (p.L601F)                         30% of 447 reads
                                    CDKN2A                        c.*151–1G > A ()                              100% of 172 reads
                                    CDKN2A                        c.212A > T (p.N71I)                           100% of 184 reads
                                    CREBBP                        c.5842C > T (p.P1948S)                        74% of 77 reads
                                    CREBBP                        c.2116G > A (p.G706R)                         45% of 172 reads
                                    DDB1                          c.327+6G > A ()                               47% of 451 reads
                                    DICER1                        c.775C > T (p.P259S)                          42% of 301 reads
                                    DOCK8                         c.185T > A (p.V62E)                           100% of 597 reads
                                    EGFR                          c.1955G > A (p.G652E)                         48% of 518 reads
                                    EGFR                          c.298C > T (p.P100S)                          49% of 595 reads
                                    ERCC2                         c.886A > T (p.S296C)                          48% of 165 reads
                                    ERCC5                         c.264+1G > A ()                               50% of 442 reads
                                    ETV4                          c.1298C > G (p.P433R)                         45% of 302 reads
                                    FANCF                         c.494C > T (p.T165I)                          50% of 644 reads
                                    FANCL                         c.155+1G > A ()                               51% of 220 reads
                                    FAT1                          c.9076–1G > A ()                              49% of 367 reads
                                    FH                            c.681G > T (p.Q227H)                          4% of 756 reads
                                    FLT4                          c.2224G > A (p.D742N)                         49% of 346 reads
                                    GALNT12                       c.1035+5G > A ()                              52% of 523 reads
                                    GLI2                          c.1859C > A (p.T620K)                         45% of 351 reads
                                    Table 1 continued on next page

Pan et al. eLife 2020;9:e58081. DOI: https://doi.org/10.7554/eLife.58081                                                           6 of 32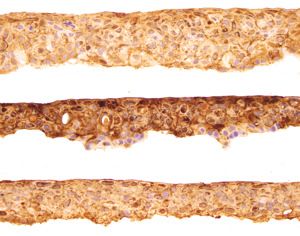
Research article                                                                                              Cancer Biology Cell Biology
                                    Table 1 continued
                                    Gene                            Variant                                                  Variant allele frequency
                                    HNF1A                           c.1640C > T (p.T547I)                                    54% of 392 reads
                                    JAZF1                           c.477C > T (p.I159I)                                     47% of 606 reads
                                    JAZF1                           c.328C > T (p.P110S)                                     44% of 211 reads
                                    KMT2D                           c.10355+1G > A ()                                        49% of 622 reads
                                    LIG4                            c.1271_1275delAAAGA (p.K424Rfs*20)                       40% of 659 reads
                                    MAP2K1                          c.568+1G > A ()                                          53% of 239 reads
                                    MED12                           c.2080G > A (p.E694K)                                    100% of 269 reads
                                    MYB                             c.1461+5G > A ()                                         41% of 430 reads
                                    NF1                             c.2608G > A (p.V870I)                                    50% of 615 reads
                                    NF2                             c.813T > G (p.F271L)                                     48% of 168 reads
                                    NOTCH1                          c.1226G > T (p.C409F)                                    44% of 519 reads
                                    NOTCH1                          c.1406A > G (p.D469G)                                    50% of 912 reads
                                    NOTCH1                          c.1245G > T (p.E415D)                                    42% of 495 reads
                                    NOTCH2                          c.5252G > A (p.G1751D)                                   44% of 459 reads
                                    NOTCH2                          c.1298G > A (p.C433Y)                                    50% of 484 reads
                                    NOTCH2                          c.1108+1G > A ()                                         53% of 305 reads
                                    NSD1                            c.7669G > A (p.G2557R)                                   49% of 743 reads
                                    PDGFRB                          c.2586+2T > A ()                                         43% of 380 reads
                                    PHOX2B                          c.181A > T (p.T61S)                                      52% of 222 reads
                                    POLQ                            c.6565G > A (p.A2189T)                                   27% of 462 reads
                                    POLQ                            c.1634G > A (p.S545N)                                    33% of 667 reads
                                    PPARG                           c.819+6T > C ()                                          100% of 134 reads
                                    PRKDC                           c.6436G > A (p.A2146T)                                   42% of 471 reads
                                    RAD51C                          c.996G > A (p.Q332Q)                                     45% of 302 reads
                                    RHEB                            c.443C > T (p.S148F)                                     46% of 120 reads
                                    ROS1                            c.6871C > T (p.P2291S)                                   45% of 605 reads
                                    ROS1                            c.3342A > T (p.Q1114H)                                   48% of 274 reads
                                    ROS1                            c.137A > T (p.D46V)                                      42% of 215 reads
                                    RPTOR                           c.2992G > A (p.V998I)                                    48% of 352 reads
                                    RUNX1T1                         c.1039G > A (p.D347N)                                    45% of 715 reads
                                    SDHA                            c.1151C > T (p.S384L)                                    53% of 446 reads
                                    SLC34A2                         c.1700T > A (p.I567N)                                    50% of 460 reads
                                    SMARCA4                         c.3947T > G (p.F1316C)                                   55% of 431 reads
                                    SMARCE1                         c.395C > T (p.A132V)                                     51% of 587 reads
                                    STAT3                           c.1852G > A (p.G618S)                                    47% of 527 reads
                                    TDG                             c.166+4G > A ()                                          48% of 329 reads
                                    TP53                            c.375+1G > T                                             47% of 173 reads
                                    TP53                            c.832_833delCCinsTT                                      46% of 418 reads
                                                                    (p.P278F)
                                    UIMC1                           c.971T > C (p.V324A)                                     48% of 745 reads
                                    XPC                             c.571C > T (p.R191W)                                     100% of 219 reads
                                    *
                                     Based on analysis of 16,131,317 unique, high-quality sequencing reads (mean, 406 reads per targeted exon, with
                                    98% of exons having more than 30 reads).
                                    †
                                        Based on analysis of 20,972,158 unique, high-quality sequencing reads (mean, 413 reads per targeted exon, with
                                    99% of exons having more than 30 reads).

Pan et al. eLife 2020;9:e58081. DOI: https://doi.org/10.7554/eLife.58081                                                                        7 of 32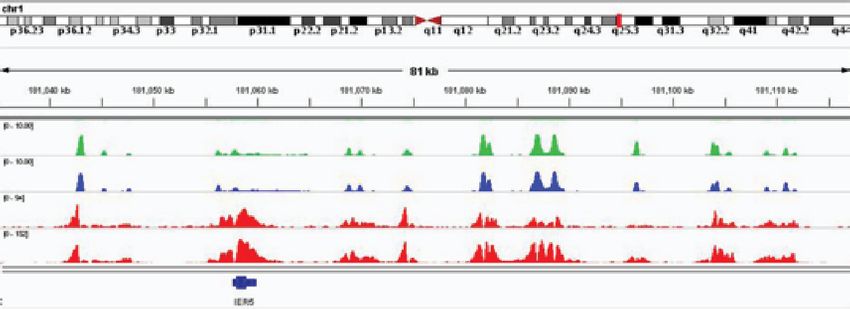
Research article                                                                                     Cancer Biology Cell Biology

                                    Notch responsiveness of all genes tested, and also revealed variation in the kinetics of response,
                                    even among ‘canonical’ Notch target genes. For example, HES1 showed fast induction followed by
                                    rapid down-regulation, consistent with autoinhibition (Hirata et al., 2002), whereas HES4, HES5,
                                    and NRARP (a feedback inhibitor of NTC function [Jarrett et al., 2019]) showed more sustained
                                    increases in expression (Figure 2C). Genes encoding non-structural proteins known to be linked to
                                    squamous differentiation also were ‘early’ responders (Figure 2D), as were genes linked to DNA
                                    damage/cell stress response (Figure 2E). In the case of the latter novel targets, we confirmed that
                                    protein levels also rose in a Notch-dependent fashion (Figure 2F). By contrast, increased expression
                                    of genes encoding structural proteins associated with keratinocyte differentiation (e.g. IVL, KRT1,
                                    KRT13) was delayed, only emerging at 24–72 hr (Supplementary files 1–3). These findings suggest
                                    that Notch activation induces the expression of a core group of early direct target genes, setting in
                                    motion downstream events that lead to differentiation.
                                       Notch activation also down-regulated a smaller set of genes (Figure 2A, summarized in
                                    Supplementary files 1–3), possibly via induction of transcriptional repressors of the Hes family.
                                    These include multiple genes expressed by basal epidermal stem cells, including genes encoding
                                    the Notch ligand DLL1 (Lowell et al., 2000); b1-integrin (Jones and Watt, 1993); LRIG1
                                    (Jensen and Watt, 2006), a negative regulator of epidermal growth factor receptor signaling; and
                                    multiple WNT ligands (WNT7A, 7B, 9A, 10A, and 11), of interest because WNT signaling contributes
                                    to maintenance of epidermal stem cells (Lim et al., 2013).
                                       To determine the overlap of Notch target genes in squamous cells with other cell lineages, we
                                    compared the list of Notch-responsive genes in SC2 cells with three other cell types in which GSI
                                    washout has been used to identify genes that are rapidly upregulated by Notch: triple-negative
                                    breast cancer cells (Petrovic et al., 2019); mantle cell lymphoma cells (Ryan et al., 2017); and T-cell
                                    acute lymphoblastic leukemia (T-ALL) cells. Using fairly stringent cutoffs for Notch-responsiveness
                                    (FDR < 0.05, log2 change >1; summarized in Supplementary file 6), we failed to identify any genes
                                    that were co-regulated by Notch in all of these cell types (Figure 2—figure supplement 2). Even in
                                    two epithelial cell types, SC2 squamous cells and MB157 triple negative breast cancer cells, only
                                    10.8% of Notch-responsive genes in SC2 cells were also Notch-responsive in MB157 cells. As would
                                    be expected, the overlap between Notch-responsive genes in SC2 cells and B lineage REC1 cells (9/
                                    390, 2.3%) and T lineage DND41 cells (1/390, 0.3%) was even lower. These observations serve to
                                    again emphasize the remarkable context-specificity of Notch effects on gene expression.

                                    Notch target genes are associated with lineage-specific NTC-binding
                                    enhancer elements
                                    To identify sites of NTC-binding to Notch-responsive regulatory elements in IC8-DEGF-L1596H cells,
                                    we performed ChIP-seq for Notch transcription complex components (RBPJ and MAML1) 4 hr after
                                    Notch activation, as well as for RBPJ prior to Notch activation. The rationale for identifying RBPJ
                                    and MAML1-binding sites, rather than NOTCH1-binding sites, was several fold: (i) we wanted to
                                    identify binding of endogenous Notch transcription complex components with reliable commercially
                                    available monoclonal antibodies; (ii) based on our RNA-seq data sets, MAML1 is the most highly
                                    expressed member of the MAML family in IC8 cells (MAML1 log2 read counts per million = 6.66;
                                    MAML2 log2 read counts per million = 3.59; MAML3 log2 read counts per million = 0.70), and there-
                                    fore was the logical member of the family to study; and (iii) we were intrigued by prior studies sug-
                                    gesting that MAML1 might associate with non-Notch transcription factor complexes (Jin et al.,
                                    2010; Quaranta et al., 2017; Shen et al., 2006; Zhao et al., 2007). In the Notch-on state, we found
                                    that most MAML1 binding sites also bound RBPJ (8533/9,187 sites, 93%; Figure 3A), in line with
                                    studies showing that MAML1 association with DNA requires both RBPJ and NICD (Nam et al.,
                                    2006). Approximately 92% of RBPJ/MAML1 co-binding sites (hereafter designated NTC binding
                                    sites) are in intergenic or intronic regions consistent with enhancers (Figure 3B). As predicted by
                                    past studies (Castel et al., 2013; Krejcı́ and Bray, 2007; Ryan et al., 2017; Wang et al., 2014),
                                    NTC binding was associated with increases in RBPJ ChIP-Seq signals and H3K27ac signals at pro-
                                    moter and enhancer sites (Figure 3C), features previously noted to characterize ‘dynamic’ functional
                                    Notch response elements. Motif analysis revealed that the most common motif lying within 300 bp
                                    of NTC ChIP-Seq signals is that of RBPJ (Figure 3D), and that the motif for AP1, a factor not associ-
                                    ated with NTC binding sites in other cell types (Chatr-Aryamontri et al., 2017; Drier et al., 2016;
                                    Petrovic et al., 2019; Ryan et al., 2017; Wang et al., 2014), is also highly enriched in this 600 bp

Pan et al. eLife 2020;9:e58081. DOI: https://doi.org/10.7554/eLife.58081                                                            8 of 32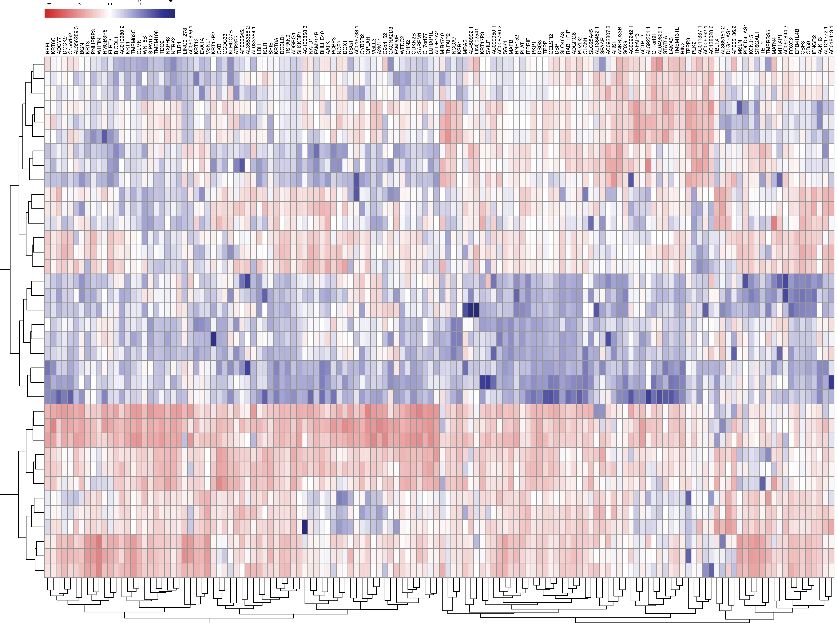
Research article Cancer Biology Cell Biology
Table 2. Copy number variants, squamous cell carcinoma cell lines.
Chromosome Type Genes affected
IC8 cell line
1q Gain MCL1, GBA, RIT1, NTRK1, DDR2, PVRL4, SDHC,
CDC73, MDM4, PIK3C2B, UBE2T,
PTPN14, H3F3A, EGLN1, AKT3, EXO1, FH
2 Loss XPO1, FANCL, REL, MSH6, EPCAM, MSH2, SOS1,
ALK, BRE, DNMT3A, GEN1, MYCN, TMEM127,
GLI2, ERCC3, CXCR4, RIF1, ACVR1, ABCB11,
NFE2L2, PMS1, CASP8, SF3B1, CTLA4,
ERBB4, IDH1, BARD1, XRCC5, DIS3L2
3p Loss MITF, BAP1, PBRM1, COL7A1, RHOA, SETD2,
CTNNB1, MLH1, MYD88, XPC, PPARG,
RAF1, FANCD2, OGG1, VHL
3q Gain NFKBIZ, CBLB, POLQ, GATA2, MBD4, TOPBP1,
FOXL2, ATR, MECOM, PRKCI, TERC,
PIK3CA, SOX2, ETV5, BCL6
4 Loss PHOX2B, RHOH, SLC34A2, FGFR3, WHSC1, KDR,
KIT, PDGFRA, FAM175A, HELQ,
TET2, FBXW7, NEIL3, FAT1
5 Gain RICTOR, IL7R, SDHA, TERT, MAP3K1, PIK3R1,
XRCC4, RASA1, APC, RAD50, CTNNA1, PDGFRB,
ITK, NPM1, TLX3, FGFR4, NSD1, UIMC1, FLT4
6 Gain CCND3, NFKBIE, POLH, VEGFA, CDKN1A,
PIM1, RNF8, FANCE, DAXX, HFE, HIST1H3B,
HIST1H3C, ID4, PRDM1, ROS1, RSPO3, MYB,
TNFAIP3, ESR1, ARID1B, PARK2, QKI
7 Gain EGFR, IKZF1, JAZF1, ETV1, PMS2, RAC1,
CARD11, SBDS, CDK6, SLC25A13, CUX1, RINT1,
MET, POT1, SMO, BRAF, PRSS1, EZH2,
RHEB, XRCC2, PAXIP1
8p Loss KAT6A, POLB, FGFR1, WHSC1L1, NRG1,
WRN, NKX3-1, PTK2B, GATA4, NEIL2
8q11.21-q21.11 Loss PRKDC, MYBL1, TCEB1
8q21.3-q24.3 Gain NBN, RUNX1T1, RAD54B, RSPO2, EXT1,
RAD21, MYC, RECQL4
9p13.2-p21.3 Loss PAX5, FANCG, RMRP, CDKN2A, CDKN2B, MTAP
9p24.1-p24.3 Gain CD274, JAK2, PDCD1LG2, DOCK8
11p11.2-p13 Gain EXT2, LMO2
13q33.1 Loss ERCC5
15q Gain FAN1, GREM1, BUB1B, MGA, RAD51, TP53BP1,
B2M, USP8, MAP2K1, PML, NEIL1, FAH,
NTRK3, BLM, FANCI, IDH2, IGF1R
16p13.3 Loss CREBBP, SLX4
19 Loss BABAM1, CRTC1, JAK3, KLF2, MEF2B, BRD4,
NOTCH3, CALR, KEAP1, SMARCA4, ELANE,
GNA11, MAP2K2, STK11, TCF3, CCNE1,
C19orf40, CEBPA, AKT2, AXL, CIC, XRCC1,
ARHGAP35, ERCC1, ERCC2, BCL2L12,
PNKP, POLD1, PPP2R1A
20 Gain MCM8, ASXL1, BCL2L1, MAFB,
AURKA, ZNF217, GNAS, CDH4
SCCT2 Cell Line
1q32.1 Loss UBE2T
1q42.12-q42.2 Gain H3F3A, EGLN1
1q43 Loss AKT3, EXO1
1q43 Gain FH
Table 2 continued on next page
Pan et al. eLife 2020;9:e58081. DOI: https://doi.org/10.7554/eLife.58081 9 of 32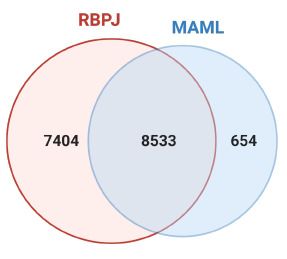
Research article Cancer Biology Cell Biology
Table 2 continued
Chromosome Type Genes affected
3 p Arm level Loss MITF, BAP1, PBRM1, COL7A1, RHOA, SETD2,
CTNNB1, MLH1, MYD88, XPC,
PPARG, RAF1, FANCD2, OGG1, VHL
3q Arm level Gain NFKBIZ, CBLB, POLQ, GATA2, MBD4, TOPBP1,
FOXL2, ATR, MECOM, PRKCI,
TERC, PIK3CA, SOX2, ETV5, BCL6
8q Arm level Gain PRKDC, MYBL1, TCEB1, NBN, RUNX1T1,
RAD54B, RSPO2, EXT1, RAD21, MYC, RECQL4
9q Arm level Gain GNAQ, NTRK2, FANCC, PTCH1, GALNT12, XPA,
KLF4, TAL2, ENG, ABL1, TSC1, BRD3, NOTCH1
18q11.2 Gain GATA6, RBBP8
18q11.2-q21.33 Gain SS18, SETBP1, SMAD2, SMAD4, BCL2
20 Gain MCM8, ASXL1, BCL2L1, MAFB, AURKA, ZNF217,
GNAS, CDH4
window. Based on the method of Severson et al., 2017, approximately 13% of NTC-binding sites in
IC8 cells are predicted to be sequence paired sites (Figure 3E), a specialized type of response ele-
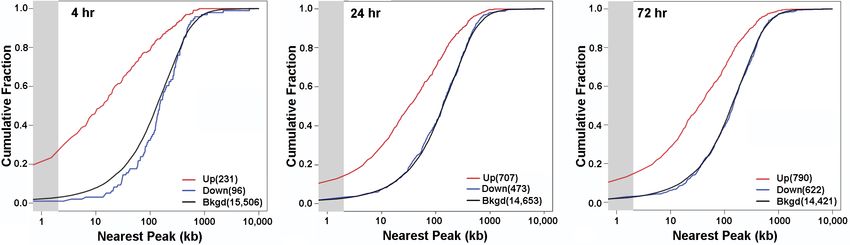
ment that binds NTC dimers (Arnett et al., 2010). Finally, particularly at early time points, NTC-
binding sites were spatially associated with genes that are upregulated by Notch, whereas genes
that decreased in expression were no more likely to be associated with NTC binding sites than
genes that did not change in expression (Figure 3F). Taken together, these studies show that NTCs
mainly bind lineage-specific enhancers in SCC cells and that their loading leads to rapid ‘activation’
of Notch-responsive elements and upregulation of adjacent genes.
We also performed motif analysis on sites producing significant signals for only RBPJ or only
MAML1. RBPJ ‘only’ sites also were enriched for RBPJ (E value 1.3e-124) and AP1 (E value 2.8e-71)
motifs but had lower average ChIP-Seq signals, suggesting these may be weak RBPJ-binding sites.
MAML1 ‘only’ sites also were enriched for AP1 motifs (E value 2.9e-181) but were not associated with
RBPJ motifs. These sites were relatively few in number (N = 654) and the associated AP1 motifs
were distributed broadly around MAML1 signal peaks, arguing against direct physical interaction
between MAML1 and AP1 family members on chromatin. Thus, the significance of these ‘MAML1-
only’ peaks is uncertain, and it is possible that the observed ChIP-seq signals are non-specific, stem-
ming from over-representation of ‘open’ chromatin in ChIPs.
IER5 is a direct Notch target gene
We were intrigued by the convergence of Notch target genes, which presumably serve to promote
and coordinate keratinocyte differentiation, and genes linked to DNA damage/cell stress responses.
We selected one gene of this class, IER5, a member of the immediate early response gene family,
for detailed analysis based on prior work implicating IER5 in cellular responses to DNA damaging
agents and heat shock (Ding et al., 2009; Ishikawa and Sakurai, 2015; Kis et al., 2006), as well as
functional studies suggesting that IER5 is a modulator of the serine/threonine kinase PP2A
(Asano et al., 2016; Ishikawa et al., 2015; Kawabata et al., 2015) and might therefore serve as
point of crosstalk between Notch and signaling pathways that depend on serine/threonine phos-
phorylation for signal transduction.
To confirm that IER5 is also upregulated by activation of endogenous Notch signaling in non-
transformed keratinocytes, we studied TERT-immortalized NOK1 keratinocytes, which undergo squa-
mous differentiation when moved to high Ca2+ medium (Piboonniyom et al., 2003). We observed
that differentiation of NOK1 cells significantly increased the expression of IER5 as well as the canoni-
cal Notch target gene NRARP, effects that were blocked by GSI and by DN-MAML1, confirming that
the observed changes in gene expression are Notch-dependent (Figure 4—figure supplement 1A
and B). In line with the Notch-dependent increases in IER5 transcripts upon induction of differentia-
tion, we also observed that IER5 protein levels increased in differentiation medium in a GSI- and
DN-MAML1-sensitive fashion (Figure 4—figure supplement 1C and D). Differentiation was
Pan et al. eLife 2020;9:e58081. DOI: https://doi.org/10.7554/eLife.58081 10 of 32Research article Cancer Biology Cell Biology
A B
300 4hr 24hr 72hr
-Log 10 FDR
Differentially expressed genes
200 GO Term FDR (%–log10)
Neg. reg. of endopeptidase 4.36
100 Endopeptidase inh. activity 2.92
Keratinocyte differentiation 3.90
0 Peptide crosslinking 3.22
-10 -5 0 5 10 -10 -5 0 5 10 -10 -5 0 5 10
Log2 Fold Change
C HES1 HES4 HES5 NRARP
10 8 120 80
Relative RNA Expression
100
8
6 60
80
6
4 60 40
4
40
2 20
2 20
0 0 0 0
h
0h
1h
2h
4h
pB h
pB h
E
E
0h
1h
0h
1h
2h
4h
2h
4h
E
pB h
E
0h
1h
2h
4h
24
24
24
AB
AB
AB
24
AB
pB
D RHOV RIPK4 IRF6 CCN1
20 4 5
16
Relative RNA Expression
16 4
3 12
12 3
2 8
8 2
1 4
4 1
0 0 0 0
E
0h
1h
2h
4h
E
pB 24 h
pB 24 h
0h
1h
2h
4h
E
pB h
0h
1h
2h
4h
0h
1h
2h
4h
pB 4 h
E
AB
AB
AB
24
AB
2
E IER5 GADD45A ID3 F EV DN-MAML
Relative RNA Expression
6 8 3
WO - + - +
6 ICN1
4 2
4 IER5
2 1
2 GADD45A
0 0 0 ID3
pB 4 h
E
0h
1h
2h
4h
E
pB 24 h
ABh
0h
E
1h
2h
4h
0h
1h
2h
4h
AB
2
pB 24
AB
Actin
Figure 2. Identification of Notch-induced genes in squamous carcinoma cells. (A) Volcano plots showing changes in RNA transcript read counts
induced by Notch activation in SC2 cells for 4, 24, and 72 hr as compared to control cells treated with sham GSI washout. RNA-seq for each treatment
group was performed in triplicate on biological replicates. Vertical lines denote a twofold change in read count, while the horizontal line denotes a false
discovery rate (FDR) of 5%. (B) Gene ontogeny (GO) annotation of differentially expressed genes in ‘Notch-on’ SC2 cells. The most highly associated
Figure 2 continued on next page
Pan et al. eLife 2020;9:e58081. DOI: https://doi.org/10.7554/eLife.58081 11 of 32Research article Cancer Biology Cell Biology
Figure 2 continued
GO terms are shown; other significant associated annotated gene sets (FDR < 5%) are listed in Supplementary file 7. (C-E) Transcriptional responses
of selected ‘canonical’ Notch target genes (C), genes linked to keratinocyte differentiation (D), and genes associated with DNA damage responses (E),
to Notch activation in IC8-DEGF-L1596H cells. Transcript abundance in technical replicates prepared in triplicate was measured by RT-PCR and
normalized against GAPDH. Error bars represent standard deviations of the mean. (F) Western blots of cell lysates prepared from IC8-DEGF-L1596H
cells transduced with empty virus (EV) or DN-MAML following sham GSI washout (-) or 24 hr post-GSI washout (+).
The online version of this article includes the following figure supplement(s) for figure 2:
Figure supplement 1. GSI treatment has little effect on gene expression in IC8 squamous carcinoma cells.
Figure supplement 2. Venn diagram showing the overlap in Notch target genes (defined as log2 change >1 and FDR < 0.05 following GSI washout) in
IC8 squamous carcinoma cells (S2 subclone), MB157 triple negative breast carcinoma cells (Petrovic et al., 2019), REC1 mantle cell lymphoma cells
(Ryan et al., 2017), and DND-41 T-ALL cells (Petrovic et al., 2019).
accompanied by activation of NOTCH2 and NOTCH3 (inferred from the accumulation of smaller pol-
ypeptides consistent with ADAM cleavage products under differentiation conditions in the presence
of GSI; Figure 4—figure supplement 1C and D), as well as increased expression of NOTCH3, a
known target of activated Notch. Suppression of IER5 transcript levels by GSI in some experiments
was less pronounced than the abrogation of the accumulation of IER5 protein by Notch inhibitors,
suggesting that additional pathways influence IER5 expression (consistent with the complex
enhancer landscape around this gene) and that Notch signaling may regulate IER5 both transcrip-
tionally and post-transcriptionally. Unexpectedly, we did not observe any activation of NOTCH1 in
NOK1 cells in differentiation medium (data not shown), suggesting that differentiation in this model
is directed by NOTCH2 instead of NOTCH1. Notably, given that germline swaps of the coding
sequences of the intracellular domains of NOTCH1 and NOTCH2 yield apparently normal mice
(Liu et al., 2015), it is likely that NOTCH1 and NOTCH2 activate the same sets of target genes,
including IER5 in keratinocytes.
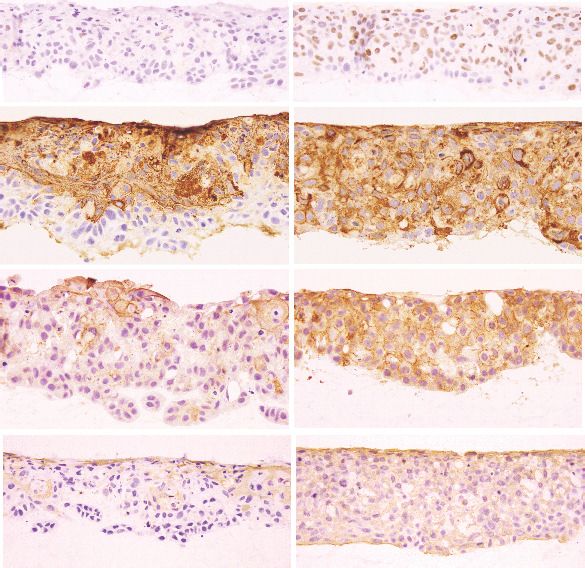
We next sought to confirm that IER5 is a direct Notch target gene. Inspection of chromatin land-
scapes around IER5 in IC8 cells revealed a series of flanking enhancers, two of which (D and E)
showed the largest RBPJ/MAML1 signals and the greatest increase in H3K27ac following Notch acti-
vation (Figure 4A), a dynamic change that is strongly correlated with increased transcription of flank-
ing genes (Wang et al., 2014). Notably, a similar enhancer landscape exists in non-transformed
human keratinocytes (Figure 4—figure supplement 1E), and expression of IER5 transcripts is readily
detectable in normal human skin (Figure 4—figure supplement 1F-H), consistent with the idea that
the observed enhancers are involved in physiologic regulation of IER5 in keratinocytes. Reporter
gene assays with enhancers D and E in IC8-DEGF-L1596H cells (Figure 4B and C, respectively) con-
firmed that the Notch responsiveness of these elements depend on RBPJ-binding sites and also
showed, in the case of enhancer D, that a flanking AP1 consensus site is also required. To determine
the contributions of enhancers D and E within the genomic IER5 locus, we used CRISPR/Cas9 target-
ing to delete the regions containing RBPJ-binding sites in these two enhancers in SC2 cells
(Figure 4D). These deletions partially abrogated the Notch-dependent increase in IER5 transcription
(Figure 4E) and suppressed the accumulation of IER5 protein following Notch activation (Figure 4F),
confirming that IER5 is directly regulated by Notch through these elements.
IER5 is required for ‘late’ Notch-dependent differentiation events in
squamous cells
To systematically determine the contribution of IER5 to Notch-dependent changes in gene expres-
sion, we compared the transcriptional response to Notch activation in SC2 cells, SC2 cells in which
IER5 was knocked out (I5 cells), and I5 cells to which IER5 expression was added back (I5AB cells,
Figure 5A). Different doses of IER5 had no effect on gene expression in the absence of Notch sig-
naling, or on the expression of genes that are induced by Notch within 4 hr (Figure 5B, denoted
with a blue box); however, by 24 hr and 72 hr of Notch activation, I5 cells failed to upregulate a large
group of Notch-responsive genes that were rescued by add-back of IER5 (Figure 5B, denoted with
a red box). GO analysis revealed that IER5-dependent genes were associated with various aspects of
keratinocyte differentiation and biology (Figure 5C; summarized in Supplementary files 7 and
8). An example of a differentiation-associated gene impacted by loss of IER5 is KRT1, a marker of
spinous differentiation, expression of which is markedly impaired by IER5 knockout and restored by
Pan et al. eLife 2020;9:e58081. DOI: https://doi.org/10.7554/eLife.58081 12 of 32Research article Cancer Biology Cell Biology
A B 3·8TR
4%
ncRNA
TTS
Pseudogene
Exon 48% 44%
Intron
Intergenic
Promoter
5·8TR
C Enhancer Sites Promoter Sites
6
4
Log2 (fold change)
4
2
2
0
-1000 -500 0 0 500 1000 -1000 -500 0 0 500 1000
BP (5· to 3·) BP (5· to 3·)
D E 800
Binding Sites
600
12.9%
400
RBPJ (4.8e-426)
200
AP1 (4.4e-52)
0.2 0.4 0.6 0.8 1.0
PBM x PBM Score
F
Figure 3. Characterization of Notch transcription complex (NTC) binding sites in IC8-DEGF-L1596H cells. (A) Number and overlap of RBPJ and MAML1
binding sites determined by ChIP-Seq of chromatin prepared 4 hr after Notch activation. (B) Genomic distribution of RBPJ/MAML1 co-binding sites 4 hr
after Notch activation. TTS, transcription termination sites; ncRNA, non-coding RNA. (C) Effect of NTC loading on histone3 lysine27 acetylation
(H3K27ac), based on ChIP-Seq for H3K27ac in cells maintained in GSI and in cells 1, 2, and 4 hr after GSI washout. (D) Transcription factor motifs
Figure 3 continued on next page
Pan et al. eLife 2020;9:e58081. DOI: https://doi.org/10.7554/eLife.58081 13 of 32Research article Cancer Biology Cell Biology
Figure 3 continued
enriched within 300 bp of RBPJ/MAML1 ChIP-Seq signal peaks. (E) Protein-binding matrix (PBM) X PBM scores for NTC-binding sites. Sites with scores
in the right-hand Gaussian distribution correspond to likely sequence paired sites. (F) Kolmogorov-Smirnov analysis showing spatial relationships
between NTC-binding sites and transcriptional start sites (TSSs) of genes that increase, decrease, or are unchanged in expression following Notch
activation. The gray zone denotes genes with TSSs within 2 kb of RBP/MAML1 peaks.
IER5 add-back (Figure 5D). Similarly, IER5 was required for Notch-dependent expression of the late
marker involucrin in 3D cultures (Figure 5G). Thus, IER5 is necessary but not sufficient for expression
of a group of genes that respond to Notch with delayed kinetics.
To extend these observations to non-transformed keratinocytes that rely on endogenous Notch
signaling for differentiation, we targeted IER5 with CRISPR/Cas9 and also enforced expression of
IER5 through retroviral transduction in NOK1 cells. Although CRISPR/Cas9 targeting of bulk NOK1
cells was only partially effective, it was sufficient to diminish the expression of multiple differentia-
tion-associated genes (Figure 5F), whereas overexpression of IER5 increased expression of each of
these markers (Figure 5G). Thus, IER5 is required for Notch-dependent differentiation of malignant
and non-transformed keratinocytes.
IER5 binds B55a/PP2A complexes
IER5 encodes a 327 amino acid protein with a ~ 50 amino acid N-terminal IER domain and a C-termi-
nal domain predicted to be unstructured, suggesting that it functions through protein-protein inter-
actions. To identify interacting proteins in an unbiased way, we expressed a tagged form of IER5 in
IER5 null I5 cells and performed affinity purification followed by mass spectrometry
(Adelmant et al., 2019), which identified the B55a regulatory subunit of PP2A (encoded by the
PPP2RA2 gene) and PP2A scaffolding and catalytic subunits as potential interactors (Figure 6A;
summarized in Supplementary file 9). We confirmed these associations by expressing tagged IER5
in I5 cells and tagged B55a in SC2 cells (Figure 6B). Full-length IER5 and the N-terminal IER domain
of IER5 co-precipitated endogenous B55a in Notch-independent fashion, whereas the C-terminal
portion of IER5 did not (Figure 6C). Similarly, tagged B55a co-precipitated endogenous IER5 in a
fashion that was augmented by Notch activation (Figure 6D), consistent with increased recovery of
IER5 due to induction of IER5 expression by Notch. To confirm that IER5 binds B55a directly, we
studied the interaction of purified recombinant proteins. IER5 exhibited saturable binding to B55a-
coated beads (Figure 6E), and additional microscale thermophoresis studies showed that IER5 binds
B55a with a Kd of approximately 100 nM (Figure 6F).
IER5 is epistatic to PPP2R2A in SCC cells
To gain insight into the role of IER5-B55a interaction in the regulation of Notch- and IER5-sensitive
genes, we prepared SCC cells that were knocked out for IER5, PPP2R2A, or both genes (Figure 7A).
Knockout of PPP2R2A did not affect the levels of ICN1 following GSI washout (Figure 7A), but
markedly increased the expression of the late differentiation gene KRT1 in 2D culture (Figure 7B)
and the accumulation of involucrin in 3D cultures (Figure 7C), effects that were suppressed by add-
back of B55a, suggesting a model in which IER5 suppresses a B55a-dependent activity. This was
supported by assays performed with IER5/PPP2R2A double knockout cells (Figure 7A), in which
expression of the late genes such as KRT1 was also restored (Figure 7D). These results suggest that
Notch modulation of B55a-PP2A activity via IER5 is important in regulating the complex series of
events downstream of Notch that lead to squamous cell differentiation.
Discussion
Our work provides a genome-wide view of the direct effects of Notch in SCC cells, in which Notch
activation induces growth arrest and differentiation. The phenotypic changes induced by Notch are
mediated by a largely squamous-cell-specific transcriptional program that includes genes linked to
keratinocyte differentiation and DNA damage responses, including IER5, which modulates the activ-
ity of B55a-containing PP2A complexes. Upregulation of these Notch-responsive genes are associ-
ated with binding of NTCs to RBPJ sites within lineage-specific enhancers, including a minority of
sequence-paired sites, a specialized dimeric NTC binding element recently implicated in anti-
Pan et al. eLife 2020;9:e58081. DOI: https://doi.org/10.7554/eLife.58081 14 of 32Research article Cancer Biology Cell Biology
A
RBPJJ
MAML1
1
GSI
H3k27acc
WO
A B C D E F G H
IER5
B N.S.
GSI 24h WO
**
**
** **
**
0 5 10 15 20
Luciferase Activity
C
GSI 24h WO
NS
**
NS *
**
**
**
*
0 20 40 60
Luciferase Activity
D
E GSI
WO 2hr
A B C D E F G H
3
CRISPR/Cas9 Targeting ** *
2.5
Relative IER5 Expression
A B C D E F G H **
2
1.5
F SC2 / con SC2 / D + E 1
WO (h) 0 1 2 4 0 1 2 4 0.5
ICN1 0
SC2/con SC2/ D+E)
IER5
Actin
Figure 4. IER5 is a direct Notch target gene. (A) Chromatin landscapes around IER5 in IC8-DEGF-L1596H cells. ChIP-Seq signals for RBPJ, MAML1, and
H3K27ac for cells maintained in and 4 hr after GSI washout (WO) are shown. (B, C) Activities of a WT IER5 enhancer E luciferase reporter gene and
derivatives bearing mutations (m) in two RBPJ consensus motifs (B) and a WT IER5 enhancer D luciferase reporter gene and derivatives bearing
mutations in two RBPJ consensus motifs or in flanking AP1 consensus motifs (C). Reporter gene assays were performed in SC2 cells maintained in GSI
Figure 4 continued on next page
Pan et al. eLife 2020;9:e58081. DOI: https://doi.org/10.7554/eLife.58081 15 of 32Research article Cancer Biology Cell Biology Figure 4 continued or 24 hr after GSI washout (WO). Luciferase reporter gene activity was determined in biological replicates prepared in triplicate and normalized to the activity of a Renilla luciferase internal control gene. Error bars represent standard deviations. (D) Cartoon showing the CRISPR/Cas9 targeting strategy for IER5 enhancers D and E. (E) Relative IER5 transcript levels in SC2 cells targeted with control AAVS1 CRISPR/Cas9 plasmids (SC2/con) or with CRISPR/Cas9 plasmids that remove the RPBJ sites in enhancers D and E (SC2/DD+E). Cells were either maintained in GSI or were harvested 2 hr following GSI washout (WO). Transcript abundance was measured in experimental triplicates by RT-PCR and normalized against GAPDH. Error bars represent standard errors of the mean. (F) Western blots showing IER5 protein levels in SC2/con cells and SC2/DD+E cells that were either maintained in GSI or harvested 1, 2, or 4 hr following GSI washout (WO). In B, C, and E, *, p
Research article Cancer Biology Cell Biology
Notch Notch
A B
On Off Notch On
SC2 I5KO I5/con I5AB
I5AB-24h
I5KO-GSI
I5KO-72h
I5AB-72h
I5AB-GSI
I5KO-24h
SC2-24h
SC2-72h
SC2-GSI
I5KO-4h
I5AB-4h
SC2-4h
WO - + - + - + - +
IER5
ICN1
4
Actin
2
0
-2
C -4
Under-expressed genes, IER5 KO cells
GO Term FDR (%)
Late Genes
Calcium ion binding 2.2 x 10⁻⁴ (24-72 hrs)
ERK1/ERK2 cascade 0.024
Extracellular exosome 0.026
Response to LPS 0.053
Homophilic cell adhesion 0.19
Regulation of IL6 production 0.44
Endoeptidase inhibitor activity 1.00
Regulation of IL1b production 0.93
Desmosome 1.35
Regulation of gene expression 1.51 Early Genes
Transcription factor activity 1.44
Neg. reg. of endopeptidase 2.30
(4 hrs)
Cell Adhesion 2.31
Response to retinoic acid 2.44
Cell-cell adhesion 3.45
Arachidonic acid binding 4.20
Desmosome organization 4.96
NS
Involucrin IHC D *
E
**
Relative KRT1 RNA Expression
400
SC2
300
GSI
I5KO 200 WO 4h
WO 24h
WO 72h
100
I5AB
0
SC2 I5KO I5AB
F con I5KO G con IER5
crisprV
con IER5 MIEG3
120 con IER5
I5KO Actin 400
IER5 *
Relative RNA Expression (%)
Relative RNA Expression (%)
100 350
Actin
300
80 * *
* 250
60
* 200 *
40 * 150 *
100
20 * 50
0 0
KRT1 IVL FLG LOR LCE3A KRT1 IVL FLG LOR LCE3A
Figure 5. Effect of IER5 on Notch-dependent changes in gene expression in SC2 cells and NOK1 cells. (A) Western blots showing IER5 and ICN1
protein levels in SC2 cells, a single-cell clone derived from SC2-IER5 knockout cells (I5KO), I5KO cells transduced with empty virus (I5/con), and pooled
I5KO cells transduced with IER5 cDNA (I5AB) that were maintained in GSI (-) or harvested 48 hr post-GSI washout (+). (B) Heat map showing Notch-
induced changes in gene expression in SC2 cells, I5KO cells, and I5AB cells. RNA-seq was performed in biological replicates in triplicate at time 0, 4 hr,
Figure 5 continued on next page
Pan et al. eLife 2020;9:e58081. DOI: https://doi.org/10.7554/eLife.58081 17 of 32Research article Cancer Biology Cell Biology Figure 5 continued 24 hr, and 72 hr after GSI washout. Samples were subjected to unsupervised clustering using a gene set containing all genes that were significantly upregulated at any time point after Notch activation in SC2 cells. The blue boxes highlight genes that are upregulated at 4, 24, and 72 hr after Notch activation, whereas the red box highlights genes that are under-expressed in IER5 knockout cells (I5KO) and rescued by re-expression of IER5 (I5AB) at later timepoints (24 and 72 hr). (C) Gene ontogeny (GO) terms associated with the set of under-expressed genes in I5KO cells following Notch activation. FDR = false discovery rate. (D) Diminished induction of KRT1 expression at 24 and 72 hr after GSI WO in I5KO cells is prevented by IER5 addback (I5AB cells). Transcript abundance in biological replicates prepared in triplicate was measured by RT-PCR and normalized against GAPDH. Error bars represent standard deviations of the mean. *, p
Research article                                                                                  Cancer Biology Cell Biology

Continued

Reagent type
(species) or resource         Designation                    Source or reference         Identifiers             Additional information
Antibody                      Horse polyclonal               Cell Signaling              Cat. #: 7076            WB, 1:1,000
                              anti-mouse                     Technology                                          -1:20,000
                              Ig linked to HRP
Antibody                      Goat polyclonal                Cell Signaling              Cat. #: 7074            WB, 1:1000
                              anti-rabbit                    Technology
                              Ig linked to HRP
Antibody                      Mouse monoclonal               Sigma                       Cat. #: A1978           WB, 1:10,000
                              anti-actin
Antibody                      Mouse monoclonal               Sigma                       Cat. #: F3165           WB, 1:1000
                              anti-FLAG
Antibody                      Rabbit polyclonal              Sigma                       Cat. #: HPA029894       WB, 1:1000
                              anti-IER5
Antibody                      Mouse monoclonal               Santa Cruz                  Cat. #: sc-66192        IHC, 1:100
                              anti-filaggrin                 Biotechnology
Antibody                      Mouse monoclonal               Biocare Medical             Cat. #: CM163A          IHC, 1:250
                              anti-p63
Antibody                      Rabbit polyclonal              BioLegend                   Cat. #: 905103          IHC, 1:800
                              anti-loricrin
Antibody                      Mouse monoclonal               Cell Marque                 Cat. #: 227 M-95        IHC, 1:500
                              anti-BCL6                      Tissue Diagnostics
Antibody                      Rabbit monoclonal              Cell Signaling              Cat. #: 71536           IHC, 1:2000
                              anti-keratin5                  Technology
Antibody                      Chicken polyclonal             BioLegend                   Cat. #: 906004          IHC, 1:800
                              anti-keratin14
Antibody                      Chicken polyclonal             Lifesensors                 Cat. #: AB7002          WB, 1:2000
                              anti-SUMO
Antibody                      Sheep polyclonal               ThermoFisher                Cat. #: 11203D          ChIP, 100 ml beads
                              anti-rabbit                    Scientific                                          per 20  106 cells
                               Ig linked to Dynabeads
Antibody                      Mouse monoclonal               Sigma                       Cat #: M8823            Tandem purification,
                              anti-FLAG                                                                          40 ml to 1 ml beads
                              epitope linked to
                              magnetic beads
Cell line                     IC8                            10.1038/s41467-                                     Dr. Andrew South
(Homo sapiens)                                               018-06027-1                                         (Thomas Jefferson
                                                                                                                 University)
Cell line                     SCCT2                          10.1038/s41467-                                     Dr. Andrew South
(H. sapiens)                                                 018-06027-1                                         (Thomas Jefferson
                                                                                                                 University)
Cell line                     NOK1                           Piboonniyom et al., 2003;                           Dr. Karl Munger
(H. sapiens)                                                 63:476–83                                           (Tufts University)
Commercial                    CellTiter Blue                 Promega                     Cat. #: G8080
assay or kit
Commercial                    ChIP Assay Kit                 Millipore                   Cat. #: 17–295
assay or kit
Commercial                    Next Ultra II DNA              New England                 Cat. #: E7645
assay or kit                  Library Prep Kit               BioLabs
Commercial                    Next Ultra II RNA              New England                 Cat. #: E7775
assay or kit                  Library Prep Kit               BioLabs
Commercial                    QuickChange II Kit             Agilent                     Cat. #: 200523
assay or kit                                                 Technologies
Commercial                    Dual Luciferase Kit            Promega                     Cat. #: E1910
assay or kit
Continued on next page

Pan et al. eLife 2020;9:e58081. DOI: https://doi.org/10.7554/eLife.58081                                                          19 of 32
Research article Cancer Biology Cell Biology
Continued
Reagent type
(species) or resource Designation Source or reference Identifiers Additional information
Chemical Compound E Tocris Cat. #:
compound, drug CAS 209986-17-4
Recombinant pL-CRISPR. Addgene Cat. #: #57827
DNA reagent SFFV.GFP
Recombinant pL-CRISPR.SFFV.tRFP Addgene Cat. #: #57826
DNA reagent
Recombinant lentiCRISPRv2 neo Addgene Cat. #: 98292
DNA reagent
Recombinant lentiCRISPRv2 hygro Addgene Cat. #: 98291
DNA reagent
Recombinant pVL1392 Expression Cat. #: 91–012
DNA reagent Systems
Cell lines and 2D cultures
Cells were grown under 5% C02 at 37˚C in media supplemented with glutamine and streptomycin/
penicillin. IC8 cells (Wang et al., 2011) were cultured in Keratinocyte medium as described
(Purdie et al., 2011). DEGF-L1596H cDNA cloned into pBABE-puro was packaged into pseudotyped
retrovirus and used to transduce IC8 and SCCT2 cells, which were selected with puromycin (1 mg/
ml). In some instances, cells were also transduced with pseudotyped MigRI retrovirus encoding dom-
inant negative MAML1 fused to GFP (Weng et al., 2003). Single-cell IC8 cell clones were isolated by
limiting dilution. NOK1 cells were grown in keratinocyte-SFM medium supplemented with human
EGF and bovine pituitary extract (BPE) (Thermo Fisher Scientific) and induced to differentiate by
transfer to Dulbcecco modified Eagle medium (DMEM) containing 10% fetal bovine serum. The iden-
tity of IC8 cells and SCCT2 cells was confirmed by detection of cell-line-specific ‘private’ driver muta-
tions (Inman et al., 2018) by NextGen sequencing. The identity of NOK1 cells was confirmed by STR
testing (Genetica Cell Line Testing, Case # CX4-007937). Culture cells were tested for mycoplasma
periodically using the LookOut Mycoplasma PCR Detection Kit (Millipore Sigma, Cat. #MP0035).
To determine the effect of collagen matrix on ICN1 levels, 5 104 cells were plated in the pres-
ence of GSI in standard Corning six-well plates or Corning Biocoat Collagen 6-well plates coated
with rat tail collagen 1. After 4 days, cells were subjected to GSI washout or sham GSI washout and
cultured for an additional 24 hr.
Cell growth assays
Cell numbers were estimated using CellTiter Blue (Promega) per the manufacturer’s recommenda-
tions. Fluorescence was measured using a SpectraMax M3 microplate reader (Molecular Devices).
Organotypic 3D cultures
3D raft cultures were performed on a matrix containing 5 105 J2 3T3 fibroblast cells and rat colla-
gen as described (Arnette et al., 2016). Briefly, rafts were allowed to mature for 6–7 days and then
were seeded with 5 105 SCC cells in E-medium in the presence of GSI. After 2 days, rafts were
raised to the fluid-air interface, and medium was refreshed + / - GSI every 2 days for a total of 12
additional days.
Targeted exon sequencing
NGS was performed on IC8 and SCCT2 cell genomic DNA using the ‘oncopanel’ assay (Abo et al.,
2015; Wagle et al., 2012), which covers 447 cancer genes. Briefly, DNA (200 ng) was enriched with
the Agilent SureSelect hybrid capture kit and used for library preparation. Following sequencing (Illu-
mina HiSeq 2500), reads were aligned to human genome GRCh37 (hg19) (Li and Durbin, 2009),
sorted, duplicate marked, and indexed. Base-quality score calibration and alignments around indels
was done with Genome Analysis Toolkit (DePristo et al., 2011; McKenna et al., 2010). Single-nucle-
otide variant calls were with MuTect (Cibulskis et al., 2013). Copy number alterations were deter-
mined using RobustCNV. Structural variants were detected using BreaKmer (Abo et al., 2015).
Pan et al. eLife 2020;9:e58081. DOI: https://doi.org/10.7554/eLife.58081 20 of 32Research article Cancer Biology Cell Biology
Preparation of ChIP-Seq and RNA-seq libraries
Chromatin was prepared as described (Wang et al., 2014) and was immunoprecipitated with anti-
bodies against MAML1 (clone D3K7B) or RBPJ (clone D10A11, both from Cell Signaling Technology)
and Dynabeads bearing sheep anti-rabbit Ig (Thermo Fisher Scientific). H3K27ac ChIPs were pre-
pared using the ChIP assay kit (Millipore) and H2K27ac antibody (ab4729, Abcam). ChIP-seq libraries
were constructed using the NEBNext Ultra II DNA Library Prep Kit (New England BioLabs). Total
RNA was prepared with Trizol (Life Technology) and RNeasy Mini columns (Qiagen). RNA libraries
were constructed using the NEBNext Ultra II RNA Library Prep kit (New England BioLab). ChIP-seq
and RNA-seq libraries were sequenced on an Illumina NextSeq 500 instrument. ChIP-seq and RNA-
seq data sets are deposited in GEO (https://www.ncbi.nlm.nih.gov/geo/query/acc.cgi?acc=
GSE156488).
For Figure 2—figure supplement 1, IC8 cells were seeded at 6 105 cells per 10 cm dish. The
next morning, media was changed to media containing GSI (Compound E, 1 mM) or an equivalent
volume of DMSO. One day after the media change, cells were lifted from the dish with trypsin con-
taining 1 mM GSI or an equivalent volume of DMSO and washed with PBS containing 1 mM GSI or
vehicle (DMSO), and 106 cells were pelleted and resuspended in TRIzol (Thermo Fisher). Two biolog-
ical replicates were collected per condition. RNA Spike-in standards (Invitrogen, 1 mL of 1:10 diluted
ERCC) were added to each tube of RNA in TRIzol. Total RNA was extracted by phenol/chloroform
with MaXtract tubes (Qiagen). RNA quality was assessed by HS RNA ScreenTape on an Agilent Tape
Station. Libraries were constructed using the TruSeq Stranded Total RNA Library Prep Gold kit (Illu-
mina) at the HMS Nascent Transcriptomics Core. Samples were sequenced for paired end reads on
the Illumina NovaSeq at the Harvard Bauer Center Sequencing Core, using the S1 Flow Cell and the
100 Cycle Kit. RNA-seq data sets for IC8 cells treated with vehicle or GSI are available at https://
www.ncbi.nlm.nih.gov/geo/query/acc.cgi?acc=GSE156624.
ChIP-seq data analysis
Reads were trimmed with Trim Galore (v.0.3.7 using cutadapt v.1.8), assessed for quality with
FastQC (v.0.11.3), and aligned to GRCh38/hg38 with bowtie (v.2.0.0; Langmead and Salzberg,
2012). Peaks were identified using MACS2 (v.2.1.1; Zhang et al., 2008) and annotated using Homer
(v3.12, 6-8-2012; Heinz et al., 2010). Peaks mapping to repeats (repeatMasker track, from UCSC) or
ENCODE blacklisted regions were removed. Overlapping RBPJ and MAML1 peaks were identified
with bedtools intersectBed (v2.23.0; Quinlan and Hall, 2010). Motif analysis was performed using
MEME-ChIP (Machanick and Bailey, 2011). Average signal profiles were generated with ngsplot
(Shen et al., 2014). RBPJ sequence-paired sites (SPSs) were identified as described (Severson et al.,
2017). Mixed Gaussian curves were generated in R using the mixtools (v.1.1.0) function
(Benaglia et al., 2009).
RNA-seq data analysis
Reads were trimmed as described for DNA reads and aligned to human genome GRCh38/hg38
using gencode release 27 annotations and STAR (v.2.5.3a) (Dobin et al., 2013). Raw counts from
two sequencing runs were loaded into R (R Development Core Team, 2014), summed, and filtered
to exclude transcripts with 0.5 in all pairwise comparisons was used with RUVg
(k = 1) to identify unwanted variation. Second-pass edgeR analysis included the RUVg weights in the
model matrix. Genes with FDR < 5% and absolute logFC >1 were retained for further analysis.
DAVID v.6.8 (Huang da, Huang et al., 2009) was used for gene ontology (GO) enrichment analysis
of the DE gene lists. EdgeR cpm function with library size normalization and log2 conversion was
used to generate expression values, which were displayed using pheatmap (R package version
1.0.8). Other plots were made using in-house R scripts (available upon request).
For Figure 2—figure supplement 1, sequencing reads were filtered to retain reads with an aver-
age quality score 20 and were then mapped to hg38 with Ensembl release 99 annotations using
Star version 2.7.0 f. (Dobin et al., 2013). Duplicated reads were removed. ERCC spike-in reads were
mapped using Bowtie version 1.2.2 (Langmead et al., 2009). The percentage of reads mapping to
the spike-in was not significantly different between samples. To identify differentially expressed
Pan et al. eLife 2020;9:e58081. DOI: https://doi.org/10.7554/eLife.58081 21 of 32You can also read