Freshwater monitoring by nanopore sequencing - eLife
←
→
Page content transcription
If your browser does not render page correctly, please read the page content below
RESEARCH ARTICLE

                                    Freshwater monitoring by nanopore
                                    sequencing
                                    Lara Urban1†*, Andre Holzer2†*, J Jotautas Baronas3, Michael B Hall1,
                                    Philipp Braeuninger-Weimer4, Michael J Scherm5, Daniel J Kunz6,7,
                                    Surangi N Perera8, Daniel E Martin-Herranz1, Edward T Tipper3,
                                    Susannah J Salter9, Maximilian R Stammnitz9*
                                    1
                                     European Bioinformatics Institute, Wellcome Genome Campus, Hinxton, United
                                    Kingdom; 2Department of Plant Sciences, University of Cambridge, Cambridge,
                                    United Kingdom; 3Department of Earth Sciences, University of Cambridge,
                                    Cambridge, United Kingdom; 4Department of Engineering, University of
                                    Cambridge, Cambridge, United Kingdom; 5Department of Biochemistry, University
                                    of Cambridge, Cambridge, United Kingdom; 6Wellcome Sanger Institute, Wellcome
                                    Trust Genome Campus, Hinxton, United Kingdom; 7Department of Physics,
                                    University of Cambridge, Cambridge, United Kingdom; 8Department of Physiology,
                                    Development & Neuroscience, University of Cambridge, Cambridge, United
                                    Kingdom; 9Department of Veterinary Medicine, University of Cambridge,
                                    Cambridge, United Kingdom

                                    Abstract While traditional microbiological freshwater tests focus on the detection of specific
                                    bacterial indicator species, including pathogens, direct tracing of all aquatic DNA through
*For correspondence:                metagenomics poses a profound alternative. Yet, in situ metagenomic water surveys face
lara.h.urban@gmail.com (LU);
                                    substantial challenges in cost and logistics. Here, we present a simple, fast, cost-effective and
andre.holzer.biotech@gmail.com
                                    remotely accessible freshwater diagnostics workflow centred around the portable nanopore
(AH);
maxrupsta@gmail.com (MRS)
                                    sequencing technology. Using defined compositions and spatiotemporal microbiota from surface
                                    water of an example river in Cambridge (UK), we provide optimised experimental and
†
 These authors contributed          bioinformatics guidelines, including a benchmark with twelve taxonomic classification tools for
equally to this work
                                    nanopore sequences. We find that nanopore metagenomics can depict the hydrological core
Competing interests: The            microbiome and fine temporal gradients in line with complementary physicochemical
authors declare that no             measurements. In a public health context, these data feature relevant sewage signals and pathogen
competing interests exist.          maps at species level resolution. We anticipate that this framework will gather momentum for new
Funding: See page 21                environmental monitoring initiatives using portable devices.

Received: 28 July 2020
Accepted: 01 December 2020
Published: 19 January 2021

Reviewing editor: Marı́a
                                    Introduction
Mercedes Zambrano, CorpoGen,
                                    The global assurance of safe drinking water and basic sanitation has been recognised as a United
Colombia                            Nations Millennium Development Goal (Bartram et al., 2005), particularly in light of the pressures
                                    of rising urbanisation, agricultural intensification, and climate change (Haddeland et al., 2014;
   Copyright Urban et al. This
                                    Schewe et al., 2014). Waterborne diseases represent a particular global threat, with zoonotic dis-
article is distributed under the
                                    eases such as typhoid fever, cholera, or leptospirosis resulting in hundreds of thousands of deaths
terms of the Creative Commons
Attribution License, which          each year (Prüss et al., 2002; Prüss-Ustün et al., 2019).
permits unrestricted use and           To control for risks of infection by waterborne diseases, microbial assessments can be conducted.
redistribution provided that the    While traditional microbial tests focus on the isolation of specific bacterial indicator organisms
original author and source are      through selective media outgrowth in a diagnostic laboratory, this cultivation process is all too often
credited.                           time consuming, infrastructure-dependent and lacks behind in automatisation (Salazar and

Urban, Holzer, et al. eLife 2021;10:e61504. DOI: https://doi.org/10.7554/eLife.61504                                                1 of 27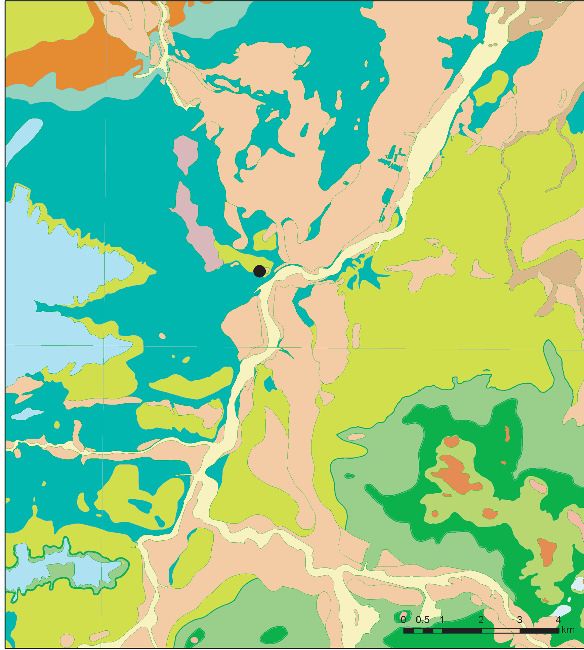
Research article                                                                     Ecology Microbiology and Infectious Disease

                                    eLife digest Many water-dwelling bacteria can cause severe diseases such as cholera, typhoid
                                    or leptospirosis. One way to prevent outbreaks is to test water sources to find out which species of
                                    microbes they contain, and at which levels.
                                        Traditionally, this involves taking a water sample, followed by growing a few species of ‘indicator
                                    bacteria’ that help to estimate whether the water is safe. An alternative technique, called
                                    metagenomics, has been available since the mid-2000s. It consists in reviewing (or ‘sequencing’) the
                                    genetic information of most of the bacteria present in the water, which allows scientists to spot
                                    harmful species. Both methods, however, require well-equipped laboratories with highly trained
                                    staff, making them challenging to use in remote areas.
                                        The MinION is a pocket-sized device that – when paired with a laptop or mobile phone – can
                                    sequence genetic information ‘on the go’. It has already been harnessed during Ebola, Zika or SARS-
                                    CoV-2 epidemics to track the genetic information of viruses in patients and environmental samples.
                                    However, it is still difficult to use the MinION and other sequencers to monitor bacteria in water
                                    sources, partly because the genetic information of the microbes is highly fragmented during DNA
                                    extraction.
                                        To address this challenge, Urban, Holzer et al. set out to optimise hardware and software
                                    protocols so the MinION could be used to detect bacterial species present in rivers. The tests
                                    focussed on the River Cam in Cambridge, UK, a waterway which faces regular public health
                                    problems: local rowers and swimmers often contract waterborne infections, sometimes leading to
                                    river closures.
                                        For six months, Urban, Holzer et al. used the MinION to map out the bacteria present across nine
                                    river sites, assessing the diversity of species and the presence of disease-causing microbes in the
                                    water. In particular, the results showed that optimising the protocols made it possible to tell the
                                    difference between closely related species – an important feature since harmful and inoffensive
                                    bacteria can sometimes be genetically close. The data also revealed that the levels of harmful
                                    bacteria were highest downstream of urban river sections, near a water treatment plant and river
                                    barge moorings. Together, these findings demonstrate that optimising MinION protocols can turn
                                    this device into a useful tool to easily monitor water quality.
                                        Around the world, climate change, rising urbanisation and the intensification of agriculture all
                                    threaten water quality. In fact, access to clean water is one of the United Nations sustainable
                                    development goals for 2030. Using the guidelines developed by Urban, Holzer et al., communities
                                    could harness the MinION to monitor water quality in remote areas, offering a cost-effective,
                                    portable DNA analysis tool to protect populations against deadly diseases.

                                    Sunagawa, 2017; Tringe and Rubin, 2005). Environmental metagenomics, the direct tracing of
                                    DNA from environmental samples, constitutes a less organism-tailored, data-driven monitoring alter-
                                    native. Such approaches have been demonstrated to provide robust measurements of relative taxo-
                                    nomic species composition as well as functional diversity in a variety of environmental contexts
                                    (Almeida et al., 2019; Bahram et al., 2018; Tara Oceans coordinators et al., 2015), and overcome
                                    enrichment and resolution biases common to culturing (Salazar and Sunagawa, 2017; Tringe and
                                    Rubin, 2005). However, they usually depend on expensive stationary equipment, specialised opera-
                                    tional training and substantial time lags between fieldwork, sample preparation, raw data generation
                                    and access. Combined, there is an increasing demand for freshwater monitoring frameworks that
                                    unite the advantages of metagenomic workflows with high cost effectiveness, fast technology
                                    deployability, and data transparency (Gardy and Loman, 2018).
                                       In recent years, these challenges have been revisited with the prospect of mobile DNA analysis.
                                    The main driver of this is the ‘portable’ MinION device from Oxford Nanopore Technologies (ONT),
                                    which enables real-time DNA sequencing using nanopores (Jain et al., 2016). Nanopore read
                                    lengths can be comparably long, currently up to ~2*106 bases (Payne et al., 2019), which is enabled
                                    by continuous electrical sensing of sequential nucleotides along single DNA strands. In connection
                                    with a laptop for the translation of raw voltage signal into nucleotides, nanopore sequencing can be
                                    used to rapidly monitor long DNA sequences in remote locations. Although there are still common

Urban, Holzer, et al. eLife 2021;10:e61504. DOI: https://doi.org/10.7554/eLife.61504                                                2 of 27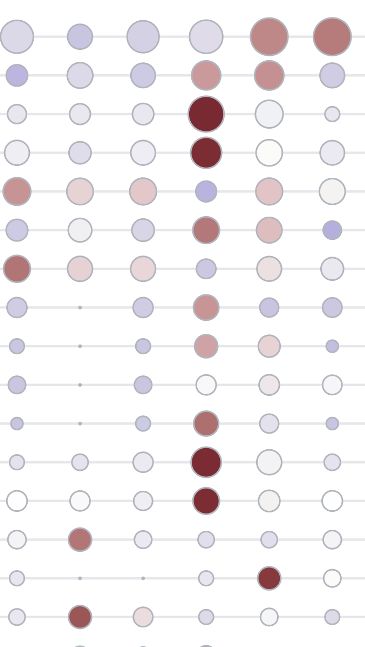
Research article Ecology Microbiology and Infectious Disease
a Downstream b
N 9
11
I. Filtration of 400 mL river water 11
1
W E Baits Bite Lock (0.2 µm cellulose membrane)
Ѯ
Ѥ
S
Sewage Pipe Outlet filtered
water sample residue
Ѯ
Ѥ
II. DNA extraction
7 (Qiagen DNA Power Water Kit)
6 diluted filter purified DNA
Green Dragon Bridge
5 Ѯ
Ѥ
Bridge Of Sighs III. 16S rRNA amplification
Fort St. George (barcoded custom primers)
Ѯ
Ѥ
Ѯ
Ѥ
16S rDNA
16S rDNA
4 with barcodes
Mill Pond
Ѯ
Ѥ
City of
IV. ONT sequencing primer ligation
Cambridge (ONT Ligation Kit)
3
pooled barcoded
library DNA
fragments
Grantchester Meadows
Ѯ
Ѥ
1 2 River Cam V. Nanopore sequencing
Nature Reserve
Ѯ
Ѥ
Distance Zone 1 (MinION, R9.4.1 flow cell) ...ATGACTATGACT
Nature Reserve 1 km Zone 2
Ѯ
Ѥ
Zone 3
Upstream
am MinION
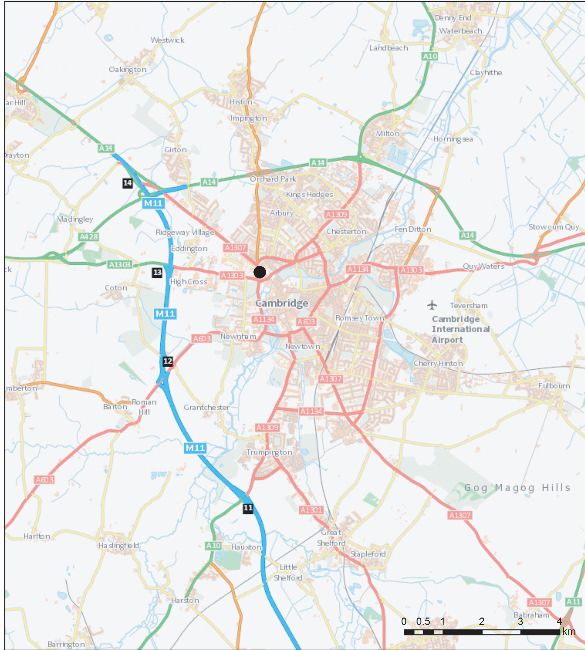
Figure 1. Freshwater microbiome study design and experimental setup. (a) Schematic map of Cambridge (UK), illustrating sampling locations (colour-
coded) along the River Cam. Geographic coordinates of latitude and longitude are expressed as decimal fractions according to the global positioning
system. (b) Laboratory workflow to monitor bacterial communities from freshwater samples using nanopore sequencing (Materials and methods).
The online version of this article includes the following figure supplement(s) for figure 1:
Figure supplement 1. Bioinformatics consensus workflow.
concerns about the technology’s base-level accuracy, mobile MinION setups have already been
transformative for real-time tracing and rapid data sharing during bacterial and viral pathogen out-
breaks (Boykin et al., 2019; Chan et al., 2020; Faria et al., 2018; Faria et al., 2017;
Kafetzopoulou et al., 2019; Quick et al., 2015; Quick et al., 2016). In the context of freshwater
analysis, a MinION whole-genome shotgun sequencing protocol has recently been leveraged for a
comparative study of 11 rivers (Reddington et al., 2020). This report highlights key challenges which
emerge in serial monitoring scenarios of a relatively low-input DNA substrate (freshwater), for exam-
ple large sampling volumes (2–4 l) and small shotgun fragments (mean < 4 kbp). We reasoned that
targeted DNA amplification may be a suitable means to bypass these bottlenecks and assess river
microbiomes with nanopore sequencing.
Here, we report a simple, cost-effective workflow to assess and monitor microbial freshwater eco-
systems with targeted nanopore DNA sequencing. Our benchmarking study involves the design and
optimisation of essential experimental steps for multiplexed MinION usage in the context of local
environments, together with an evaluation of computational methods for the bacterial classification
of nanopore sequencing reads from metagenomic libraries. To showcase the resolution of sequenc-
ing-based aquatic monitoring in a spatiotemporal setting, we combine DNA analyses with physico-
chemical measurements of surface water samples collected at nine locations within a confined ~12
km reach of the River Cam passing through the city of Cambridge (UK) in April, June, and August
2018.
Urban, Holzer, et al. eLife 2021;10:e61504. DOI: https://doi.org/10.7554/eLife.61504 3 of 27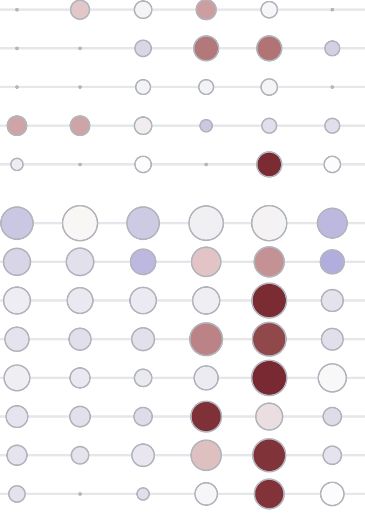
Research article Ecology Microbiology and Infectious Disease
a c
)
15
)
Bacterial gDNA in known quantity
21
)
=8
k=
6)
k=
T
k=
AS
(k
2(
2(
ge
ed
TN
GO
ap
eq
BL
r(
2
XA
AX
ifu
ct
en
E
thu
nim
Ps
AS
ga
ntr
IN
pe
TA
NT
IM
P
ak
MA
RD
Me
Mo
SP
Ce
BL
ex
Mi
QI
ID
Kr
SI
Full length Pseudomonadaceae 4.2 0.7 0.7 0.8 0.7 0.7 0.7 0.7 0.7 4.1 0.7 1.0 0.8
1
16S PCR Enterobacteriaceae 20.5 58.8 59.1 59.9 59.7 60.0 59.6 60.4 59.9 48.2 59.9 60.4 67.0
Lactobacillaceae 18.4 4.9 4.8 4.7 4.7 4.7 4.6 4.7 4.6 9.4 4.8 5.0 1.8
Enterococcaceae 9.9 4.8 4.7 4.8 4.5 4.6 4.8 4.5 4.6 10.7 3.0 3.9 1.8
Sequencing &
2
Classification Staphylococcaceae 15.5 10.1 9.9 9.6 9.8 9.8 9.8 9.7 9.7 4.5 9.4 11.1 8.7
Listeriaceae 14.1 8.0 7.9 7.2 7.7 7.1 7.4 6.9 6.7 4.2 4.0 1.6 2.0
observed
± 0.00
- 0.10
Bacillaceae 17.4 12.8 12.9 13.0 13.0 13.1 13.2 13.2 13.9 19.0 18.1 17.1 18.1
- 0.05
+ 0.15 RMSE
expected 0.00 15.91 16.04 16.38 16.30 16.42 16.25 16.57 16.41 12.36 16.63 16.87 19.68
RMSE scoring 3 RMSE reduced 0.00 6.52 6.57 6.75 6.78 6.88 6.95 7.04 7.53 9.38 11.42 11.78 16.58
2 02 + (- 0.10) 2 + (- 0.05) 2 + 0.15 2
4
= 0.094 RMSE_reduced ● ●●
●
●●● ● ●● ●
0 5 10 15
observed abundance [%]
b 60 ●
d
Enterobacteriaceae Comparison to majority vote
40 overlapping non overlapping not in majority unclassified
20 100 95 93 91 92 92 92 91
85
●●
●
83
● ● 80 77 74
0 ●
0 20 40 60 64
Percentage
expected abundance [%] 60
observed abundance [%]
Bacillaceae 40 32
30 ● 25
Staphylococcaceae 19 22
● 20 11 13 12
Listeriaceae
20 ● 3 6 5 5 4 6 4 7 5 7 6 7 7 7
140 0 1 0 0 0 1 41
0 0 0 0
Lactobacillaceae 0
● ●
10 Enterococcaceae
N
ST
)
5)
XA
eq
2
X
1)
ge
P
6)
(8
A
D
ST
E
(1
(2
r(
Ps
ifu
LA
TA
T
R
O
IIM
hu
LA
N
2
2
● Pseudomonadaceae
G
A
tr
aB
ap
ID
SI
0
Q
n
IN
ot
M
en
B
ke
im
eg
M
SP
C
ra
0 10 20 30
in
m
K
M
expected abundance [%]
Figure 2. Benchmarking of classification tools with nanopore full-length 16S sequences. (a) Schematic of mock community quantification performance
testing. (b) Observed vs. expected read fraction of bacterial families present in 10,000 nanopore reads randomly drawn from mock community
sequencing data. Example representation of Minimap2 (kmer length 15) quantifications with (upper) and without (lower) Enterobacteriaceae (Materials
and methods). (c) Mock community classification output summary for twelve classification tools tested against the same 10,000 reads. Root mean
squared errors observed and expected bacterial read fractions are provided with (RMSE) and without Enterobacteriaceae (RMSE reduced). (d)
Classification output summary for 10,000 reads randomly drawn from an example freshwater sample (Materials and methods). ‘Overlapping’ fractions
(red) represent agreements of a classification tool with the majority of tested methods on the same reads, while ‘non-overlapping’ fractions (light blue)
represent disagreements. Dark green sets highlight rare taxon assignments not featured in any of the 10,000 majority classifications, while dark blue
bars show unclassified read fractions.
The online version of this article includes the following figure supplement(s) for figure 2:
Figure supplement 1. Benchmarking of twelve taxonomic classifiers with nanopore full-length 16S sequences.
Figure supplement 2. Key challenges of freshwater monitoring with nanopore sequencing.
Results
Experimental design and computational workflows
Using a bespoke workflow, nanopore full-length (V1-V9) 16S ribosomal RNA (rRNA) gene sequenc-
ing was performed on all location-barcoded freshwater samples at each of the three time points
(Figure 1; Supplementary file 1; Materials and methods). River isolates were multiplexed with nega-
tive controls (deionised water) and mock community controls composed of eight bacterial species in
known mixture proportions.
To obtain valid taxonomic assignments from freshwater sequencing profiles using nanopore
sequencing, twelve different classification tools were compared through several performance metrics
(Figure 2; Figure 2—figure supplement 1; Materials and methods). Our comparison included
Urban, Holzer, et al. eLife 2021;10:e61504. DOI: https://doi.org/10.7554/eLife.61504 4 of 27Research article Ecology Microbiology and Infectious Disease
a 0.0%
0.0%
10% 0.0% 11%
17% 0.0% 0.0% 15%
0.6% 23% 2.4%
15% 0.0% 30%
0.6% 0.0%
11% 23% 0.8%
2,080,266 737,164 13% 5,491,510
11%
0.8%
15% 23% 6% 0.8%
11% 16%
0.0% 19% 16% 0.0%
10%
0.0%
April 0.0%
June August
Barcodes
1 2 3 4 5 6 7 8 9.1 9.2 Negative Mock
b 106
105
104
Reads
103
102
101
100
1.00
0.75
Abundance
0.50
0.25
0.00
April
Apr
Ap ril June
June A
Aug
ug April
Apr
Ap ril June
June Aug April
Apr
Ap ril June
June Aug
Aug April
Apr
Ap ril June
June A
Aug
ug April
Apr
Ap ril June
June Aug
Aug Aprilil JJune
Ap une Aug
Aug April
Apr
Ap ril June
June Aug
Aug April
Apr
Ap ril June
June Aug
Aug April
Apr
Ap ril June
June Aug
Aug April
Apr
April JJune
une A
Aug
ug
1 2 3 4 5 6 7 8 9
Upstream Downstream
Taxonomic level Downsampling Most abundant families
Total Cut off Methylophilaceae Rhodobacteraceae Spirosomaceae
Classified Most abundant families Microbacteriaceae Sphingomonadaceae Burkholderiaceae
Family Other families Flavobacteriaceae Arcobacteraceae
Rhodocyclaceae 16ïPDrine group Other families
Figure 3. Bacterial diversity of the River Cam. (a) Nanopore sequencing output summary. Values in the centre of the pie charts depict total numbers of
classified nanopore sequences per time point. Percentages illustrate representational fractions of locations and control barcodes (negative control and
mock community). (b) Read depth and bacterial classification summary. Upper bar plot shows the total number of reads, and the number of reads
classified to any taxonomic level, to at least bacterial family level, to the ten most abundant bacterial families across all samples, or to other families.
Rarefaction cut-off displayed at 37,000 reads (dashed line). Lower bar plot features fractions of the ten most abundant bacterial families across the
samples with more than 100 reads. Colours in bars for samples with less than 37,000 reads are set to transparent.
The online version of this article includes the following figure supplement(s) for figure 3:
Figure supplement 1. Impact of rarefaction on diversity estimation.
established classifiers such as RDP (Wang et al., 2007), Kraken (Wood and Salzberg, 2014), and
Centrifuge (Kim et al., 2016), as well as more recently developed methods optimised for higher
sequencing error rates such as IDTAXA (Murali et al., 2018) and Minimap2 (Li, 2018). An Enterobac-
teriaceae overrepresentation was observed across all replicates and classification methods, pointing
towards a consistent Escherichia coli amplification bias potentially caused by skewed taxonomic
Urban, Holzer, et al. eLife 2021;10:e61504. DOI: https://doi.org/10.7554/eLife.61504 5 of 27Research article Ecology Microbiology and Infectious Disease
a Samples
Cluster
Time
Location
Time
4 April
June
3 August
Location
2 1
2
1 3
4
5
0 6
Families
7
8
9
Mock
Cluster
C1
C2
C3
C4
Core
families
b April June August
BurkholderLDFHDH
6SLURVRPDFHDH
C4
16ïPDrLQHJURXS
5KRGREDFWHrDFHDH
6SKLQJRPRQDGDFHDH
$UFREDFWHrDFHDH
FlDvREDFWHrLDFHDH
Meth\ORSKLODFHDH
0LFUREDFWHrLDFHDH
5KRGRF\FODFHDH
ThioYXODFHDH
&URFLQLWRPLFDFHDH
SporichthyDFHDH
;DQWKRPRQDGDFHDH
DiplorickHWWVLDFHDH
C2
&KLWLQRSKDJDFHDH
RhizRELDOHV,QFHrWDH6HGLV
2SLWXWDFHDH
6&ï,ï
$HURPRQDGDFHDH
PHSWRVWUHSWRFRFFDFHDH
SulfurospirLOODFHDH
5XPLQRFRFFDFHDH
1LWURVRPRQDGDFHDH
RhizRELDFHDH
*HPPDWLPRQDGDFHDH
+DOLDQJLDFHDH
10-1 100 101 102 10-1 100 101 102 10-1 100 101 102
Abundance (%)
Figure 4. Core microbiome of the River Cam. (a) Hierarchical clustering of bacterial family abundances across
freshwater samples after rarefaction, together with the mock community control. Four major clusters of bacterial
families occur, with two of these (C2 and C4) corresponding to the core microbiome of ubiquitously abundant
families, one (C3) corresponding to the main mock community families and one (C1) corresponding to the majority
Figure 4 continued on next page
Urban, Holzer, et al. eLife 2021;10:e61504. DOI: https://doi.org/10.7554/eLife.61504 6 of 27Research article Ecology Microbiology and Infectious Disease
Figure 4 continued
of rare accessory taxa. (b) Detailed river core microbiome. Violin plots summarise fractional representation of
bacterial families from clusters C2 and C4 (log10 scale of relative abundance [%] across all samples, nApril = 7,
nJune = 2, nAugust = 7), sorted by median total abundance. Vertical dashed lines depict 0.1% proportion.
The online version of this article includes the following figure supplement(s) for figure 4:
Figure supplement 1. River Cam core microbiome analysis on the bacterial genus level.
specificities of the selected 16S primer pair 27F and 1492R (Frank et al., 2008; Figure 2b). Root
mean square errors (RMSE) between observed and expected bacteria of the mock community dif-
fered slightly across all classifiers (Figure 2c). Robust quantifications were obtained by Minimap2
alignments against the SILVA v.132 database (Quast et al., 2013), for which 99.68% of classified
reads aligned to the expected mock community taxa (mean sequencing accuracy 92.08%; Figure 2—
figure supplement 2c). Minimap2 classifications reached the second lowest RMSE (excluding Enter-
obacteriaceae), and relative quantifications were highly consistent between mock community repli-
cates. Benchmarking of the classification tools on one aquatic sample further confirmed Minimap2’s
reliable performance in a complex bacterial community (Figure 2d), although other tools such as
MAPseq (Matias Rodrigues et al., 2017), SPINGO (Allard et al., 2015), or IDTAXA also produced
highly concordant results – despite variations in memory usage and runtime over several orders of
magnitude (Figure 2—figure supplement 1b).
Diversity analysis and river core microbiome
Using Minimap2 classifications within our bioinformatics consensus workflow (Figure 1—figure sup-
plement 1; Materials and methods), we then inspected sequencing profiles of three independent
MinION runs for a total of 30 river DNA isolates and six controls. This yielded ~8.3 million sequences
with exclusive barcode assignments (Figure 3a; Supplementary file 2). Overall, 82.9%
(n = 6,886,232) of raw reads could be taxonomically assigned to the family level (Figure 3b). To
account for variations in sample sequencing depth, rarefaction with a cut-off at 37,000 reads was
applied to all samples. While preserving ~90% of the original family level taxon richness (Mantel test,
R = 0.814, p = 2.1*10 4; Figure 3—figure supplement 1a–b), this conservative thresholding
resulted in the exclusion of 14 samples, mostly from the June time point, for subsequent high-resolu-
tion analyses. The 16 remaining surface water samples revealed moderate levels of microbial hetero-
geneity (Figure 3b; Figure 3—figure supplement 1c): microbial family alpha diversity ranged
between 0.46 (June-6) and 0.92 (April-7) (Simpson index), indicating low-level evenness with a few
taxonomic families that account for the majority of the metagenomic signal.
Hierarchical clustering of taxon profiles showed a dominant core microbiome across all aquatic
samples (clusters C2 and C4, Figure 4a). The most common bacterial families observed were Bur-
kholderiaceae (40.0%), Spirosomaceae (17.7%), and NS11-12 marine group (12.5%), followed by
Arcobacteraceae (4.8%), Sphingomonadaceae (2.9%), and Rhodobacteraceae (2.5%) (Figure 4b).
Members of these families are commonly associated with aquatic environments; for example, major
fractions of Burkholderiaceae reads originated from genera such as Limnohabitans, Rhodoferax, Pol-
ynucleobacter, or Aquabacterium (Figure 4—figure supplement 1), which validates the suitability of
this nanopore metagenomics workflow. Hierarchical clustering additionally showed that two biologi-
cal replicates collected at the same location and time point (April samples 9.1 and 9.2), grouped
with high concordance; this indicates that spatiotemporal trends are discernible even within a highly
localised context.
Besides the dominant core microbiome, microbial profiles showed a marked arrangement of time
dependence, with water samples from April grouping more distantly to those from June and August.
Principal component analysis (PCA) illustrates the seasonal divergence among the three sampling
months (Figure 5a; Figure 5—figure supplement 1). The strongest differential abundances along
the seasonal axis of variation (PC3) derived from Carnobacteriaceae (Figure 5b), a trend also
highlighted by taxon-specific log-normal mixture model decomposition between the two seasons
(April vs. June/August; p < 0.01; Materials and methods). Indeed, members of this bacterial family
have been primarily isolated from cold substrates (Lawson and Caldwell, 2014).
Urban, Holzer, et al. eLife 2021;10:e61504. DOI: https://doi.org/10.7554/eLife.61504 7 of 27Research article Ecology Microbiology and Infectious Disease
a 15
10
PC4 (Variance = 0.086)
5
0
-5 Time
April
-10 June
August
-15 -10 -5 0 5 10 15
PC3 (Variance = 0.106)
b
Carnobacteriaceae Campylobacteraceae
Saprospiraceae Gallionellaceae
LiUU-11-161 Cytophagaceae
Azospirillaceae Geminicoccaceae
Gracilibacteraceae Fibrobacteraceae
Lachnospiraceae Micotrichaceae
Microbacteriaceae Omnitrophaceae
Prevotellaceae Cryptosporangiaceae
Arcobacteraceae 67-14
Blastocatellaceae Ilumatobacteraceae
-0.15 -0.10 -0.05 0.00 0.05 0.10 0.15 -0.20 -0.10 0.00 0.10 0.20
Contribution to PC3 Contribution to PC4
Figure 5. Spatiotemporal axes of taxonomic diversity in the River Cam. (a) PCA of bacterial composition across
locations, indicating community dissimilarities along the main time (PC3) and spatial (PC4) axes of variation; dots
coloured according to time points. Kruskal-Wallis test on PC3 component contributions, with post-hoc Mann-
Whitney U rank test (April vs. August): p = 2.2*10 3. (b) Contribution of individual bacterial families to the PCs in
(a). Error bars represent the standard deviation of these families across four independent rarefactions.
The online version of this article includes the following figure supplement(s) for figure 5:
Figure supplement 1. Principal component analysis of river bacterial family compositions.
Hydrochemistry and seasonal profile of the River Cam
While a seasonal difference in bacterial composition can be expected due to increasing water tem-
peratures in the summer months, additional changes may have also been caused by alterations in
river hydrochemistry and flow rate (Figure 6a; Figure 6—figure supplement 1; Supplementary file
1). To assess this effect in detail, we measured the pH and a range of major and trace cations in all
river water samples using inductively coupled plasma-optical emission spectroscopy (ICP-OES), as
well as major anions using ion chromatography (Materials and methods). As with the bacterial com-
position dynamics, we observed significant temporal variation in water chemistry, superimposed on
a spatial gradient of generally increasing sodium and chloride concentrations along the river reach
(Figure 6b–c). This spatially consistent effect is likely attributed to wastewater and agricultural dis-
charge inputs in and around Cambridge city. A comparison of the major element chemistry in the
River Cam transect with the world’s 60 largest rivers further corroborates the likely impact of anthro-
pogenic pollution in this fluvial ecosystem (Gaillardet et al., 1999; Figure 6d; Materials and
methods).
Urban, Holzer, et al. eLife 2021;10:e61504. DOI: https://doi.org/10.7554/eLife.61504 8 of 27Research article Ecology Microbiology and Infectious Disease
a
Bedrock geology
sandstone
mudstone
9 9 chalk
8 8 chalk
chalk
7 7 chalk
5
6
5
6 mudstone
chalk
4 4 mudstone
3 3 Superficial deposits
sand & gravel
12 12 diamicton
diamicton
clay, slit, sand & gravel
clay, slit, sand & gravel
sand & gravel
clay, slit, sand & gravel
peat
sand & gravel
b c
6
Sr2+
3
5 Ca2+
4
PC2 (Variance = 0.275)
Mg2+
2 S2-
7
6 Si
2 3 4 1 9.2
1 4 9.2 67
0 2 pH at 25°C
9.1 5 4
3 6 7 8
Li+
2 9.1
8 1 5
-2 Time Ba2+
9.1
9.2 April
Na+
-4 June
8 K+
August
Cl-
-4 -2 0 2 4 6 -0.4 -0.2 0.0 0.2 0.4
PC1 (Variance = 0.489) contribution to PC1
d 50.0
Carbonates
Kikori Pollution
Panuco
Amazon Yukon 7'6PJO
HCO3- / Na+ [mol/mol]
10.0 Ganges Niger Fly TDS > 500 mg/l
Silicates
Location
(August)
2.0 April
Odra 1
Irrawaddy 2
June 3
Nile
Cam 4
0.5 August
Don Elbe 5
Murray 6
7
8
Evaporites
0.1 9
0.1 0.2 0.5 1.0 2.0 5.0 10.0 20.0
Ca2+ / Na+ [mol/mol]
Figure 6. Geological and hydrochemical profile of the River Cam and its basin. (a) Outline of the Cam River
catchment surrounding Cambridge (UK), and its corresponding lithology. Overlay of bedrock geology and
superficial deposits (British Geological Survey data: DiGMapGB-50, 1:50,000 scale) is shown as visualised by
GeoIndex. Bedrock is mostly composed of subtypes of Cretaceous limestone (chalk), gault (clay, sand), and
mudstone. Approximate sampling locations are colour-coded as in Figure 1. (b) Principal component analysis of
measured pH and 13 inorganic solute concentrations of this study’s 30 river surface water samples. PC1 (~49%
variance) displays a strong, continuous temporal shift in hydrochemistry. (c) Parameter contributions to PC1 in (b),
Figure 6 continued on next page
Urban, Holzer, et al. eLife 2021;10:e61504. DOI: https://doi.org/10.7554/eLife.61504 9 of 27Research article Ecology Microbiology and Infectious Disease
Figure 6 continued
highlighting a reduction in water hardness (Ca2+, Mg2+) and increase in pH towards the summer months (June and
August). (d) Mixing diagram with Na+-normalised molar ratios, representing inorganic chemistry loads of the
world’s 60 largest rivers; open circles represent polluted rivers with total dissolved solid (TDS)
concentrations > 500 mg l 1. Cam River ratios are superimposed as ellipses from ten samples per month (50%
confidence, respectively). Separate data points for all samples from August are also shown and colour-coded,
indicating the upstream-to-downstream trend of Na+ increase (also observed in April and June). End-member
signatures show typical chemistry of small rivers draining these lithologies exclusively (carbonate, silicate and
evaporite).
The online version of this article includes the following figure supplement(s) for figure 6:
Figure supplement 1. Cambridge weather and River Cam flow rate.
Maps of potential bacterial pathogens at species level resolution
Freshwater sources throughout the United Kingdom have been notorious for causing bacterial infec-
tions such as leptospirosis (Public Health England, 2016; Public Health England, 2019). In line with
the physicochemical profile of the River Cam, we therefore next determined the spatiotemporal
enrichment of potentially important functional bacterial taxa through nanopore sequencing. We
retrieved 55 potentially pathogenic bacterial genera through integration of species known to affect
human health (Jin et al., 2018; Wattam et al., 2017), and also 13 wastewater-associated bacterial
genera (Global Water Microbiome Consortium et al., 2019; Supplementary file 3). Of these, 21
potentially pathogenic and 8 wastewater-associated genera were detected across all of the river
samples (Figure 7; Materials and methods). Many of these signals were stronger downstream of
urban sections, within the mooring zone for recreational and residential barges (location 7;
Figure 1a) and in the vicinity of sewage outflow from a nearby wastewater treatment plant (location
8). The most prolific candidate pathogen genus observed was Arcobacter, which features multiple
species implicated in acute gastrointestinal infections (Kayman et al., 2012).
In general, much of the taxonomic variation across all samples was caused by sample April-7 (PC1
explains 27.6% of the overall variance in bacterial composition; Figure 5—figure supplement 1a–b).
Its profile was characterised by an unusual dominance of Caedibacteraceae, Halomonadaceae and
others (Figure 5—figure supplement 1c). Isolate April-8 also showed a highly distinct bacterial com-
position, with some families nearly exclusively occurring in this sample (outlier analysis; Materials and
methods). The most predominant bacteria in this sewage pipe outflow are typically found in waste-
water sludge or have been shown to contribute to nutrient pollution from effluents of wastewater
plants, such as Haliangiaceae, Nitospiraceae, Rhodocyclaceae, and Saprospiracea (Nielsen et al.,
2012; Global Water Microbiome Consortium et al., 2019; Figure 7).
Using multiple sequence alignments between nanopore reads and pathogenic species references,
we further resolved the phylogenies of three common potentially pathogenic genera occurring in
our river samples, Legionella, Salmonella, and Pseudomonas (Figure 8a–c; Materials and methods).
While Legionella and Salmonella diversities presented negligible levels of known harmful species, a
cluster of reads in downstream sections indicated a low abundance of the opportunistic, environ-
mental pathogen Pseudomonas aeruginosa (Figure 8c).
Along the course here investigated, we also found significant variations in relative abundances of
the Leptospira genus, which was recently described to be enriched in wastewater effluents in Ger-
many (Numberger et al., 2019; Figure 8d). Indeed, the peak of River Cam Leptospira reads fell into
an area of increased sewage influx (~0.1% relative abundance; Figure 7). The Leptospira genus con-
tains several potentially pathogenic species capable of causing life-threatening leptospirosis through
waterborne infections, however, also features close-related saprophytic and ‘intermediate’ taxa
(Vincent et al., 2019; Wynwood et al., 2014). To resolve its complex phylogeny in the River Cam
surface, we aligned Leptospira reads from all samples together with many reference sequences
assigned to pre-classified pathogenic, saprophytic and other environmental Leptospira species
(Figure 8d; Supplementary file 4; Materials and methods). Despite the presence of nanopore
sequencing errors (Figure 2—figure supplement 2c) and correspondingly inflated read divergence,
we could pinpoint spatial clusters and a distinctly higher similarity between our amplicons and sapro-
phytic rather than pathogenic Leptospira species. These findings were subsequently validated by
Urban, Holzer, et al. eLife 2021;10:e61504. DOI: https://doi.org/10.7554/eLife.61504 10 of 27Research article Ecology Microbiology and Infectious Disease
pDWP
pot. pathogen
D B
WP
W
W
H
9.4 1.9 1.3 2.3 1.1 12.6 4.7 1.9 10.8 2.5 0.8 1.9 11.8 16.9 17.0 abundance (%)
W
P
Arcobacter Sigma
Aeromonas
Pseudomonas ●
Legionella ●
Clostridium sensu stricto 1 3
Escherichia−Shigella
Genera of potential pathogens
Bacillus
Serratia ●
Klebsiella
Enterobacter ● 2
Yersinia
Acinetobacter ●
Coxiella ●
Salmonella ● ●●
Streptococcus 1
Enterococcus
Clostridium sensu stricto 13
Citrobacter
Stenotrophomonas
Listeria 0
Leptospira ●
Rhodoferax
Waste water genera
Sulfuritalea log10(reads+1)
Haliangium ●
0
Dechloromonas ● ● -1
2
Zoogloea ●
4
Candidatus Accumulibacter ●
6
Nitrospira ●
8
Dokdonella
10 100 1,000 Time Ap Ju Au Ap Au Ap Ap Au Ap Au Ju Au Ap Ap Au
Location 1 1 1 2 2 3 4 4 5 5 6 6 7 8 9
Reads
Figure 7. Potentially pathogenic and wastewater treatment related bacteria in the River Cam. Boxplots on the left show the abundance distribution
across locations per bacterial genus. Error bars represent Q1 – 1.5*IQR (lower), and Q3 + 1.5*IQR (upper), respectively; Q1: first quartile, Q3: third
quartile, IQR: interquartile range. The central table depicts the categorisation of subsets of genera as waterborne bacterial pathogens (WB), drinking
water pathogens (DWP), potential drinking water pathogens (pDWP), human pathogens (HP), and core genera from wastewater treatment plants (WW)
(dark grey: included, light grey: excluded) (Supplementary file 3). The right-hand circle plot shows the distribution of bacterial genera across locations
of the River Cam. Circle sizes represent overall read size fractions, while circle colours (sigma scheme) represent the standard deviation from the
observed mean relative abundance within each genus.
targeted, Leptospira species-specific qPCR (Supplementary file 5; Materials and methods), confirm-
ing that R9.4.1 nanopore sequencing quality is already high enough to yield indicative results for
bacterial monitoring workflows at the species level.
Discussion
Using a cost-effective, easily adaptable and scalable framework, we provide the first spatiotemporal
nanopore sequencing atlas of bacterial microbiota throughout the course of a river. Our results sug-
gest that this workflow allows for robust assessments of both, the core microbiome of an example
fluvial ecosystem and heterogeneous bacterial compositions in the context of supporting physical
(temperature, flow rate) and hydrochemical (pH, inorganic solutes) parameters. We show that the
technology’s current sequencing accuracy of ~92% allows for the designation of significant human
pathogen community shifts along rural-to-urban river transitions, as illustrated by downstream
increases in the abundance of pathogen candidates.
Our assessment of bioinformatics workflows for taxonomic classification highlights current chal-
lenges with error-prone nanopore sequences. A number of recent reports feature bespoke 16S read
classification schemes centred around a single software (Acharya et al., 2019; Benı́tez-Páez et al.,
2016; Kerkhof et al., 2017; Nygaard et al., 2020), and others integrated outputs from two
Urban, Holzer, et al. eLife 2021;10:e61504. DOI: https://doi.org/10.7554/eLife.61504 11 of 27Research article Ecology Microbiology and Infectious Disease
a 20 21-24 b 2-3 4-11
Legionella Salmonella
25
-2
8
19
1-
tio e
29
Lo Tim
n
ce 1
ca
ce
Loc ime
ren
ren
n
atio
T
Refe
Refe
30 31-44
51-53
45 4
0 6-5
Tree scale: 0.05 Tree scale: 0.05
c d
7 89 19-36 37-41
Pseudomonas Leptospira 8
6 10 2-1 42
-55
4-5 -11
3 1
56
12
-6
Lo Tim ce
13
2
tio e
en
2
n
fer
1
63-
ca
Re
ce
68
Loc ime
ren
n
atio
T
Refe
14
15
69
16
-19
6
-3
20
34
-2
33 3
24
25-
28
29-32 Tree scale: 0.05 Tree scale: 0.1
Location (inner ring) Reference (outer ring)
1 2 3 4 5 6 7 8 9 Pathogen Other Outgroup
Leptospira
Time (middle ring)
P1 Pathogenic S1 Saprophytic Other environmental
April June August
P2 Intermediate S2 Saprophytic Outgroup
Figure 8. High-resolution phylogenetic clustering of candidate pathogenic genera in the River Cam. Phylogenetic trees illustrating multiple sequence
alignments of exemplary River Cam nanopore reads (black branches) classified as (a) Legionella, (b) Salmonella, (c) Pseudomonas, or (d) Leptospira,
together with known reference species sequences ranging from pathogenic to saprophytic taxa within the same genus (coloured branches). Reference
species sequences are numbered in clockwise orientation around the tree (Supplementary file 4). Nanopore reads highlighted in light violet
background display close clustering with pathogenic isolates of (b) Salmonella spp. and (c) Pseudomonas aeruginosa.
Urban, Holzer, et al. eLife 2021;10:e61504. DOI: https://doi.org/10.7554/eLife.61504 12 of 27Research article Ecology Microbiology and Infectious Disease
methods (Cuscó et al., 2018). Through systematic benchmarking of twelve different classification
tools, using matched mock community and river water datasets with respect to the SILVA v.132 ref-
erence database, we lay open key differences in terms of these methods’ read (mis)classification
rates, consensus agreements, speed and memory performance metrics. For example, our results
indicate that very fast implementations like Kraken 2 or Centrifuge yield less accurate classifications
than slightly slower and more memory-demanding frameworks such as Minimap2 (Figure 2; Fig-
ure 2—figure supplement 1).
Using Minimap2, 16.2% of freshwater-derived sequencing reads were assigned to a bacterial spe-
cies on average, thereby primarily encouraging automated analyses on the genus (65.6% assigned)
or family level (76.6% assigned). As nanopore sequencing quality continues to increase through
refined pore chemistries, basecalling algorithms and consensus sequencing workflows (Calus et al.,
2018; Karst et al., 2021; Latorre-Pérez et al., 2020; Rang et al., 2018; Santos et al.,
2020; Zurek et al., 2020), future bacterial taxonomic classifications are likely to improve and
advance opportunities for species discovery.
We show that nanopore amplicon sequencing data can resolve the core microbiome of a freshwa-
ter body, as well as its temporal and spatial fluctuations. Common freshwater bacteria account for
the vast majority of taxa in the River Cam; this includes Sphingomonadaceae, which had also been
previously found at high abundance in source water from the same river (Rowe et al., 2016). Our
findings suggest that the differential abundances of Carnobacteriaceae most strongly contribute to
seasonal loadings in the River Cam. Carnobacteriaceae have been previously associated with a range
of low-temperature environments (Lawson and Caldwell, 2014), and we found these taxa to be
more abundant in colder April samples (mean 11.3˚C, vs. 15.8˚C in June and 19.1˚C in August). This
might help to further establish this family as an indicator for bacterial community shifts along with
temperature fluctuations, albeit the influence of co-occurring hydrochemical trends such as water
hardness, dissolved carbon or flow speed changes should also be noted (Figure 6b–d; Figure 6—
figure supplement 1d).
Most routine freshwater surveillance frameworks focus on semi-quantitative diagnostics of only a
limited number of target taxa, such as pathogenic Salmonella, Legionella and faecal coliforms (Ram-
ı́rez-Castillo et al., 2015; Tan et al., 2015), whereas metagenomics approaches can give a complete
and detailed overview of environmental microbial diversity. Besides nanopore shotgun-sequencing
(Reddington et al., 2020), our proof-of-principle analysis highlights that targeted full-length 16S
rRNA gene MinION sequencing is a suitable complement to hydrochemical controls in pinpointing
relatively contaminated freshwater sites, some of which in case of the River Cam had been previously
highlighted for their pathogen diversity and abundance of antimicrobial resistance genes
(Rowe et al., 2017; Rowe et al., 2016). Nanopore amplicon sequencing has here allowed us to reli-
ably distinguish closely related pathogenic and non-pathogenic bacterial species of the common
Legionella, Salmonella, Pseudomonas, and Leptospira genera. For Leptospira bacteria, which are of
particular interest to communal stakeholders of the River Cam, we validated nanopore sequencing
results through the gold standard qPCR workflow of Public Health England (Supplementary file 5).
In order to also study the potential viability and functional implications of sequenced pathogen can-
didates for public health, we encourage future studies to combine nanopore based freshwater meta-
genomics with targeted follow-up measurements of living pathogens by established microbiological
approaches, including species-specific isolation and subsequent culturing.
A number of experimental intricacies should be addressed towards nanopore freshwater
sequencing with our approach, mostly by scrutinising water DNA extraction yields, PCR biases and
molar imbalances in barcode multiplexing (Figure 3a; Figure 2—figure supplement 2a–b;
Supplementary file 2). Similar to challenges with other organic substrates, microbial raw DNA
extraction protocols require careful pre-testing and optimisation towards the physicochemical com-
position of a given freshwater source, in order to avoid both taxonomic enrichment biases and drop-
offs in total yield. One example lies in the optimisation of the filtrate volume – in this study, mem-
brane DNA extraction from 400 mL River Cam water was sufficient to yield valuable insights, while
as much as 10,000 mL were used in a previous study of the same river (Rowe et al., 2016). More-
over, potentially dissolved inhibitory compounds for DNA extraction, sample cooling and storage
chains should be thoroughly considered for larger and remote river monitoring projects. We wit-
nessed that yield variations may bear negative effects on the molar balance of barcoded nanopore
sequencing runs, as illustrated by elevated sample dropouts in June 2018, emphasising the need for
Urban, Holzer, et al. eLife 2021;10:e61504. DOI: https://doi.org/10.7554/eLife.61504 13 of 27Research article Ecology Microbiology and Infectious Disease
highly accurate concentration measurement and scaling when dozens of input DNA sources are
pooled. Our study further highlights that MinION (R9.4.1) flow cell throughput can fluctuate by an
order of magnitude, altogether causing the exclusion of measurements upon application of a conser-
vative read threshold. We reason that real-time selective nanopore sequencing could serve as a pow-
erful means to improve barcode balances in the context of multiplexed 16S analyses (Loose et al.,
2016), albeit such approaches are yet undergoing computational optimisations (Kovaka et al.,
2020; Payne et al., 2020).
Our results show that it would already be theoretically feasible to obtain meaningful river micro-
biota from > 100 barcoded samples on a single nanopore flow cell, thereby enabling water monitor-
ing projects involving large collections at costs below £20 per sample (Supplementary file 6). In line
with this, ONT has already released several commercial 96-barcode multiplexing kits for PCR- and
non-PCR-based applications, as well as the smaller ‘Flongle’ flow cell with considerably reduced cost
as compared to the traditional MinION model. On the other hand, shotgun nanopore sequencing
approaches may bypass pitfalls associated with amplicon sequencing, namely taxon-specific primer
biases (Frank et al., 2008), 16S rRNA copy number fluctuations between species (Darby et al.,
2013) or the omission of functionally relevant sequence elements. In combination with sampling pro-
tocol adjustments, shotgun nanopore sequencing could moreover be used for the serial monitoring
of eukaryotic microorganisms and viruses in freshwater ecosystems (Reddington et al., 2020).
Since the commercial launch of the MinION in 2015, a wide set of microbial nanopore sequencing
applications in the context of rRNA gene (Benı́tez-Páez et al., 2016; Cuscó et al., 2018;
Kerkhof et al., 2017; Nygaard et al., 2020) and shotgun (Leggett et al., 2020; Nicholls et al.,
2019; Reddington et al., 2020; Stewart et al., 2019) metagenomics have attracted the interest of
a growing user community. Two independent case studies have recently provided decomposition
analyses of faecal bacterial pathogens in MinION libraries derived from river and spring waters in
Montana, USA (Hamner et al., 2019) and Kathmandu Valley, Nepal (Acharya et al., 2019). Although
it is to be expected that short-read metagenomics technology continues to provide valuable envi-
ronmental insights, as illustrated through global cataloguing efforts of ocean (Tara Oceans coordi-
nators et al., 2015) and wastewater (Global Water Microbiome Consortium et al., 2019)
microbiomes, due to their large sizes and fixed costs these traditional platforms remain unfeasible
for the monitoring of remote environments – especially in low-resource settings. We reason that the
convenience of MinION handling and complementary development of portable DNA purification
methods (Boykin et al., 2019; Gowers et al., 2019) will allow for such endeavours to become
increasingly accessible to citizens and public health organisations around the world, ultimately dem-
ocratising the opportunities and benefits of DNA sequencing.
Materials and methods
Freshwater sampling
We monitored nine distinct locations along a 11.62 km reach of the River Cam, featuring sites
upstream, downstream and within the urban belt of the city of Cambridge, UK. Measurements were
taken at three time points, in two-month intervals between April and August 2018 (Figure 1;
Supplementary file 1a). To warrant river base flow conditions and minimise rain-derived biases, a
minimum dry weather time span of 48 hr was maintained prior to sampling (Fisher et al., 2015).
One litre of surface water was collected in autoclaved DURAN bottles (Thermo Fisher Scientific, Wal-
tham, MA, USA), and cooled to 4˚C within 3 hr. Two bottles of water were collected consecutively
for each time point, serving as biological replicates of location 9 (samples 9.1 and 9.2).
Physical and chemical metadata
We assessed various chemical, geological and physical properties of the River Cam (Figure 6; Fig-
ure 6—figure supplement 1; Supplementary file 1b-c).
In situ water temperature was measured immediately after sampling. To this end, we linked a
DS18B20 digital temperature sensor to a portable custom-built, grid mounted Arduino nano v3.0
system. The pH was later recorded under temperature-controlled laboratory conditions, using a pH
edge electrode (HI-11311, Hanna Instruments, Woodsocket, RI, USA).
Urban, Holzer, et al. eLife 2021;10:e61504. DOI: https://doi.org/10.7554/eLife.61504 14 of 27Research article Ecology Microbiology and Infectious Disease
To assess the dissolved ion concentrations in all collected water samples, we aerated the samples
for 30 s and filtered them individually through a 0.22 mM pore-sized Millex-GP polyethersulfone
syringe filter (MilliporeSigma, Burlington, MA, USA). Samples were then acidified to pH ~2, by add-
ing 20 mL of 7M distilled HNO3 per 3 mL sample. Inductively coupled plasma-optical emission spec-
troscopy (ICP-OES, Agilent 5100 SVDV; Agilent Technologies, Santa Clara, CA, USA) was used to
analyse the dissolved cations Na+, K+, Ca2+, Mg2+, Ba2+, Li+, as well as Si and SO2- 4 (as total S)
(Supplementary file 1b). International water reference materials (SLRS-5 and SPS-SW2) were inter-
spersed with the samples, reproducing certified values within 10% for all analysed elements. Chlo-
ride concentrations were separately measured on 1 mL of non-acidified aliquots of the same
samples, using a Dionex ICS-3000 ion chromatograph (Thermo Fisher Scientific, Waltham, MA, USA)
(Supplementary file 1b). Long-term repeat measurements of a USGS natural river water standard
T-143 indicated precision of more than 4% for Cl-. However, the high Cl- concentrations of the sam-
ples in this study were not fully bracketed by the calibration curve and we therefore assigned a more
conservative uncertainty of 10% to Cl- concentrations.
High calcium and magnesium concentrations were recorded across all samples, in line with hard
groundwater and natural weathering of the Cretaceous limestone bedrock underlying the river
catchment (Figure 6a). There are no known evaporite salt deposits in the river catchment, and there-
fore the high dissolved Na+, K+, and Cl- concentrations in the River Cam are likely derived from
anthropogenic inputs (Rose, 2007; Figure 6c–d). We calculated bicarbonate concentrations through
a charge balance equation (concentrations in mol/L): conc (HCO-3) = conc (Li+) + conc (Na+) + conc
(K+) + 2*conc (Mg2+) + 2*conc (Ca2+) - conc (Cl-) - 2*conc (S2-).
The total dissolved solid (TDS) concentration across the 30 freshwater samples had a mean of 458
mg/L (range 325–605 mg/L) which is relatively high compared to most rivers, due to (1) substantial
solute load in the Chalk groundwater (particularly Ca2+, Mg2+, and HCO-3) and (2) likely anthropo-
genic contamination (particularly Na+, Cl-, and SO2- 4 ). The TDS range and the major ion signature of
the River Cam is similar to other anthropogenically heavily-impacted rivers (Gaillardet et al., 1999),
exhibiting enrichment in Na+ (Figure 6d).
Overall, ion profiles clustered substantially between the three time points, indicating characteris-
tic temporal shifts in water chemistry. PC1 of a PCA on the solute concentrations [mmol/L] shows a
strong time effect, separating spring (April) from summer (June, August) samples (Figure 6b). We
highlighted the ten most important features (i.e. features with the largest weights) and their contri-
butions to PC1 (Figure 6c).
We integrated sensor data sets on mean daily air temperature, sunshine hours and total rainfall
from a public, Cambridge-based weather station (Figure 6—figure supplement 1a–c;
Supplementary file 1c). Similarly, mean gauged daily Cam water discharge [m3s 1] of the River Cam
was retrieved through publicly available records from three upstream gauging stations connected to
the UK National River Flow Archive (https://nrfa.ceh.ac.uk/), together with historic measurements
from 1968 onwards (Figure 6—figure supplement 1d).
DNA extraction
Within 24 hr of sampling, 400 mL of refrigerated freshwater from each site was filtered through an
individual 0.22 mm pore-sized nitrocellulose filter (MilliporeSigma, Burlington, MA, USA) placed on a
Nalgene polysulfone bottle top filtration holder (Thermo Fisher Scientific) at 30 mbar vacuum pres-
sure. Additionally, 400 mL de-ionised (DI) water was also filtered. We then performed DNA extrac-
tions with a modified DNeasy PowerWater protocol (Qiagen, Hilden, Germany). Briefly, filters were
cut into small slices with sterile scissors and transferred to 2 mL Eppendorf tubes containing lysis
beads. Homogenisation buffer PW1 was added, and the tubes subjected to ten minutes of vigorous
shaking at 30 Hz in a TissueLyser II machine (Qiagen). After subsequent DNA binding and washing
steps in accordance with the manufacturer’s protocol, elution was done in 50 mL EB. We used Qubit
dsDNA HS Assay (Thermo Fisher Scientific) to determine water DNA isolate concentrations
(Supplementary file 2a).
Bacterial full-length 16S rDNA sequence amplification
DNA extracts from each sampling batch and DI water control were separately amplified with V1-V9
full-length (~1.45 kbp) 16S rRNA gene primers, and respectively multiplexed with an additional
Urban, Holzer, et al. eLife 2021;10:e61504. DOI: https://doi.org/10.7554/eLife.61504 15 of 27Research article Ecology Microbiology and Infectious Disease
sample with a defined bacterial mixture composition of eight species (Pseudomonas aeruginosa,
Escherichia coli, Salmonella enterica, Lactobacillus fermentum, Enterococcus faecalis, Staphylococcus
aureus, Listeria monocytogenes, Bacillus subtilis; D6305, Zymo Research, Irvine, CA, USA) (Figure 2),
which was previously assessed using nanopore shotgun metagenomics (Nicholls et al., 2019). We
used common primer binding sequences 27F and 1492R, both coupled to unique 24 bp barcodes
and a nanopore motor protein tether sequence (Supplementary file 7). Full-length 16S rDNA PCRs
were performed with 30.8 mL DI water, 6.0 mL barcoded primer pair (10 mM), 5.0 mL PCR-buffer with
MgCl2 (10x), 5.0 mL dNTP mix (10x), 3.0 mL freshwater DNA extract, and 0.2 mL Taq (Qiagen) under
the following conditions:
94˚C - 2 min
94˚C - 30 s, 60˚C - 30 s, 72˚C - 45 s (35 cycles)
72˚C - 5 min
Nanopore library preparation
Amplicons were purified from reaction mixes with a QIAquick purification kit (Qiagen). Two rounds
of alcoholic washing and two additional minutes of drying at room temperature were then per-
formed, prior to elution in 30 mL 10 mM Tris-HCl pH 8.0 with 50 mM NaCl. After concentration
measurements with Qubit dsDNA HS, twelve barcoded extracts of a given batch were pooled in
equimolar ratios, to approximately 300 ng DNA total (Supplementary file 2b). We used KAPA Pure
Beads (KAPA Biosystems, Wilmington, MA, USA) to concentrate full-length 16S rDNA products in 21
mL DI water. Multiplexed nanopore ligation sequencing libraries were then made by following the
SQK-LSK109 protocol (Oxford Nanopore Technologies, Oxford, UK).
Nanopore sequencing
R9.4.1 MinION flow cells (Oxford Nanopore Technologies) were loaded with 75 ml of ligation library.
The MinION instrument was run for approximately 48 hr, until no further sequencing reads could be
collected. Fast5 files were basecalled using Guppy (version 3.15) and output DNA sequence reads
with Q > 7 were saved as fastq files. Various output metrics per library and barcode are summarised
in Supplementary file 2c.
Leptospira validation
In collaboration with Public Health England, raw water DNA isolates of the River Cam from each
location and time point were subjected to the UK reference service for leptospiral testing
(Supplementary file 5). This test is based on quantitative real-time PCR (qPCR) of 16S rDNA and
LipL32, implemented as a TaqMan assay for the detection and differentiation of pathogenic and
non-pathogenic Leptospira spp. from human serum. Briefly, the assay consists of a two-component
PCR; the first component is a duplex assay that targets the gene encoding the outer membrane lipo-
protein LipL32, which is reported to be strongly associated with the pathogenic phenotype. The sec-
ond reaction is a triplex assay targeting a well-conserved region within the 16S rRNA gene (rrn) in
Leptospira spp. Three different genomic variations correlate with pathogenic (PATH probe), interme-
diate (i.e. those with uncertain pathogenicity in humans; INTER probe) and non-pathogenic Lepto-
spira spp. (ENVIRO probe), respectively.
DNA sequence processing workflow
The described data processing and read classification steps were implemented using the Snakemake
workflow management system (Köster and Rahmann, 2012) and are available on Github - together
with all necessary downstream analysis scripts to reproduce the results of this manuscript (https://
github.com/d-j-k/puntseq; Urban et al., 2020; copy archived at swh:1:rev:
1408d508c807b88e0989a5252c5d904072dc3c4a).
Read data processing
Reads were demultiplexed and adapters trimmed using Porechop (version 0.2.4, https://github.com/
rrwick/porechop). The only non-default parameter set was ’–check_reads’ (to 50,000), to increase
Urban, Holzer, et al. eLife 2021;10:e61504. DOI: https://doi.org/10.7554/eLife.61504 16 of 27You can also read