Past and Future of Plant Stress Detection: An Overview From Remote Sensing to Positron Emission Tomography - ScienceOpen
←
→
Page content transcription
If your browser does not render page correctly, please read the page content below
REVIEW
                                                                                                                                             published: 27 January 2021
                                                                                                                                          doi: 10.3389/fpls.2020.609155

                                             Past and Future of Plant Stress
                                             Detection: An Overview From
                                             Remote Sensing to Positron
                                             Emission Tomography
                                             Angelica Galieni 1 , Nicola D’Ascenzo 2,3*, Fabio Stagnari 4*, Giancarlo Pagnani 4 ,
                                             Qingguo Xie 2,3* and Michele Pisante 4
                                             1
                                               Research Centre for Vegetable and Ornamental Crops, Council for Agricultural Research and Economics, Monsampolo del
                           Edited by:        Tronto, Italy, 2 School of Life Science and Technology, Huazhong University of Science and Technology, Wuhan, China,
                                             3
             Shawn Carlisle Kefauver,          Department of Medical Physics and Engineering, Istituto Neurologico Mediterraneo, I.R.C.C.S, Pozzilli, Italy, 4 Faculty of
        University of Barcelona, Spain       Bioscience and Technology for Food, Agriculture and Environment, University of Teramo, Teramo, Italy
                       Reviewed by:
                 Shabir Hussain Wani,
                                             Plant stress detection is considered one of the most critical areas for the improvement
          Sher-e-Kashmir University of
Agricultural Sciences and Technology,        of crop yield in the compelling worldwide scenario, dictated by both the climate
                                 India       change and the geopolitical consequences of the Covid-19 epidemics. A complicated
                   Christos Kissoudis,
           Wageningen University and
                                             interconnection of biotic and abiotic stressors affect plant growth, including water, salt,
                Research, Netherlands        temperature, light exposure, nutrients availability, agrochemicals, air and soil pollutants,
                  *Correspondence:           pests and diseases. In facing this extended panorama, the technology choice is manifold.
                    Nicola D’Ascenzo
                                             On the one hand, quantitative methods, such as metabolomics, provide very sensitive
                  ndasc@hust.edu.cn
                        Fabio Stagnari       indicators of most of the stressors, with the drawback of a disruptive approach, which
                     fstagnari@unite.it      prevents follow up and dynamical studies. On the other hand qualitative methods, such
                          Qingguo Xie
                   qgxie@hust.edu.cn
                                             as fluorescence, thermography and VIS/NIR reflectance, provide a non-disruptive view
                                             of the action of the stressors in plants, even across large fields, with the drawback
                   Specialty section:        of a poor accuracy. When looking at the spatial scale, the effect of stress may
         This article was submitted to
 Technical Advances in Plant Science,
                                             imply modifications from DNA level (nanometers) up to cell (micrometers), full plant
               a section of the journal      (millimeters to meters), and entire field (kilometers). While quantitative techniques are
            Frontiers in Plant Science
                                             sensitive to the smallest scales, only qualitative approaches can be used for the larger
      Received: 22 September 2020            ones. Emerging technologies from nuclear and medical physics, such as computed
      Accepted: 18 November 2020
        Published: 27 January 2021           tomography, magnetic resonance imaging and positron emission tomography, are
                              Citation:      expected to bridge the gap of quantitative non-disruptive morphologic and functional
   Galieni A, D’Ascenzo N, Stagnari F,       measurements at larger scale. In this review we analyze the landscape of the different
      Pagnani G, Xie Q and Pisante M
(2021) Past and Future of Plant Stress
                                             technologies nowadays available, showing the benefits of each approach in plant stress
 Detection: An Overview From Remote          detection, with a particular focus on the gaps, which will be filled in the nearby future by
         Sensing to Positron Emission        the emerging nuclear physics approaches to agriculture.
                          Tomography.
          Front. Plant Sci. 11:609155.       Keywords: plant stress, plant imaging, plant positron emission tomography, metabolomics, spectroscopy, thermal
       doi: 10.3389/fpls.2020.609155         imaging, fluorescence imaging, remote sensing

Frontiers in Plant Science | www.frontiersin.org                                    1                                          January 2021 | Volume 11 | Article 609155
Galieni et al. Plant Stress Detection
1. INTRODUCTION strategies [nuclear magnetic resonance (NMR) and mass
spectrometry (MS)] to the Volatile organic compound-based
The world population is expected to increase up to 10.9 billion by techniques. Such laboratory methods, although often result
2050. Consequently food supply needs to be increased from 50 to very accurate, are sampling destructive and allow monitoring
75% depending upon the region (Prosekov and Ivanova, 2018). only a very limited number of plants or sections of plants.
Such scenario is even more complicated due to the global climate Consequently, such approach is not suitable to control, estimate
change and to the recent COVID-19 geopolitical problems that and manage within-field spatial variability as well as ready
have been affecting the food production and importation in many detection of the changes of physiological crop responses
parts of the world. over time.
Global climate change has resulted in heat waves due to Therefore the current frontier of stress evaluation in plant
rising temperature, increased atmospheric CO2 level, frequent science is the establishment of novel quantitative and non-
spells of drought and higher precipitations. In addition to disruptive imaging techniques, both for precision morphological
climate change, the natural resource depletion as well as the studies (computed tomography, magnetic resonance) and
anthropogenic activities have created serious challenges to dynamic functional imaging (positron emission tomography).
agriculture sustainability causing lower agricultural yields, threat In this review we present an overview of the several methods
to the food security and food and feed safety (Miraglia et al., 2009; and approaches to detect the most affecting biotic and abiotic
Pisante et al., 2012). stress in agricultural crops at the different plant scales, ranging
The already critical food security situation has been from qualitative remote sensing techniques (section 2), to
exacerbated by the restrictions of movement and trade due to the sample disruptive quantitative techniques (section 3), to frontier
recent Covid-19 crisis. A series of social problems are also heavily quantitative and non-disruptive functional imaging technologies
affecting agriculture. On the one hand the limited availability of (section 4).
seasonal workers disrupted the harvesting cycles, on the other
hand increasing food price is limiting food accessibility. The
World Bank estimates that protectionism accounted for about 2. REMOTE SENSING QUALITATIVE
40% of the increase in the global price of wheat and 25% of the METHODS FOR STRESS ASSESSMENT
rise in maize prices.
When subjected to both biotic and abiotic stressful conditions The term remote sensing can be defined as a set of techniques that
plants respond through physiological and metabolic changes allow detecting the chemical or physical properties of physical
mediated by pulses of gene expression, suggesting the existence objects, from whatever distance, through the record, measure and
of a complex signaling network that allows plant recognizing interpretation of imagery and digital representations of energy
adverse environmental conditions as well as changes in growth patterns derived from non-contact sensor systems. It represents
conditions (Kollist et al., 2019). a rapid, non-destructive, method to detect both biotic and abiotic
Therefore, it became extremely urgent to define novel stressful conditions, utilized in precision agriculture and plant
technologies and methods to ensure better growth and yields of phenotyping for resistance breeding purposes.
all crops. An early warning system of plant stress (i.e., before The processes involved are mainly based on the interaction
symptoms are visible in the plant) would be, indeed, the tool that between electromagnetic radiation and plants. Since any stressful
helps growers on greenhouse management to increase efficiency condition can induce numerous and complex physiological
the use of resources. Moreover such approach could constitute and biochemical responses in plants (i.e., altered stomatal
the base for breeding programs to select genotypes for biotic conductance, pigments concentration, and biochemistry),
and abiotic stress adaptation and high yield in both stress and healthy crop status could be derived from alterations observed
non-stress environments. in plant-electromagnetic radiation relationship, provided on
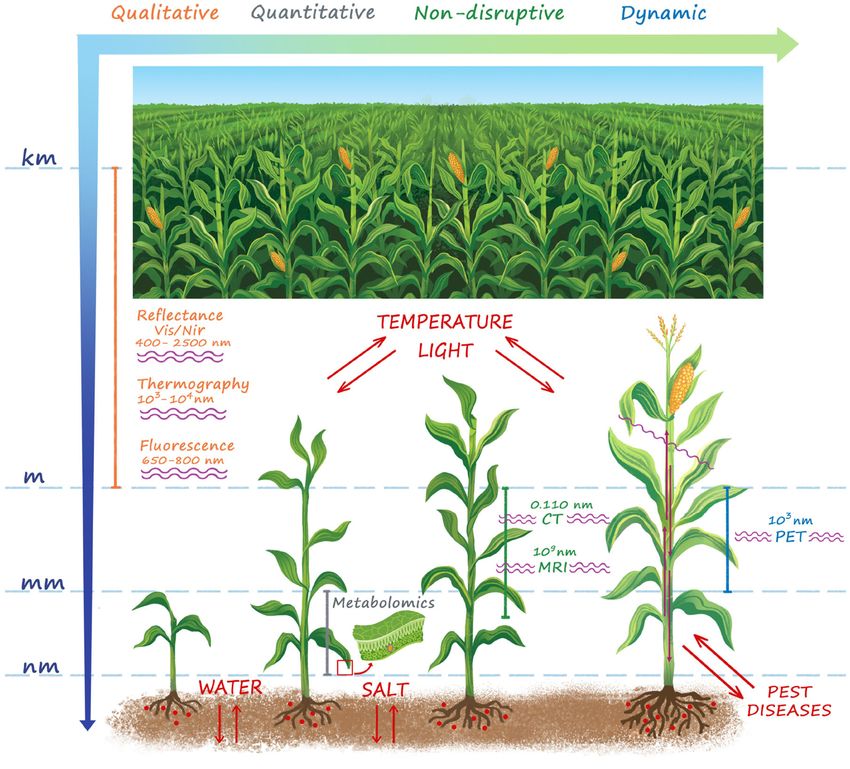
As represented in Figure 1, the effect of stressors manifests specific spectral domains. Over the past decades, agricultural
itself in a series of signs at a wide length scale, ranging from sciences relied principally on reflectance (in the visible, VIS,
the entire cropping system down to the cellular level. Therefore 0.4–0.7 µm, near-infrared, NIR, 0.7–1.3 µm and short wave-
a series of detection techniques has been developed to measure infrared, SWIR, 1.3–2.5 µm regions), thermal (in the thermal
physiological responses to situation of stress. infrared, TIR 7.0–20.0 µm region) and fluorescence (at 0.68 and
The remote sensing approach is preferred for large area 0.74 µm wavelengths) sensors. These sensors, although each
investigations, as it allows to detect the chemical or physical one with proper characteristics, can be used for applications on
properties of crops from whatever distance, through the scales ranging from microscopic observation (i.e., laboratory
record, measure and interpretation of imagery and digital spectroscopy or hyperspectral microscopy) to ground (proximal
representations of energy patterns. With these methods the whole sensing, i.e., detector within 2 m from the observed object),
fields can be investigated during the whole crop seasons, allowing airborne, and satellite remote sensing. Consequently, each
an accurate, early and reliable detection of crop stress, thanks also sensor is characterized, beyond its resolution in discriminating
to highly innovative and sophisticated methods of data analysis. the signal variations, by the spatial resolution, as a function
However, remote sensing methods are qualitative and do of the distance between the sensor itself and the subject of
not allow precision measurements. Quantitative techniques at the analysis. Sensors can also be classified based on their
cellular level principally relay on two different acquisition application in (i) non-imaging [i.e., VIS and infrared (IR)
Frontiers in Plant Science | www.frontiersin.org 2 January 2021 | Volume 11 | Article 609155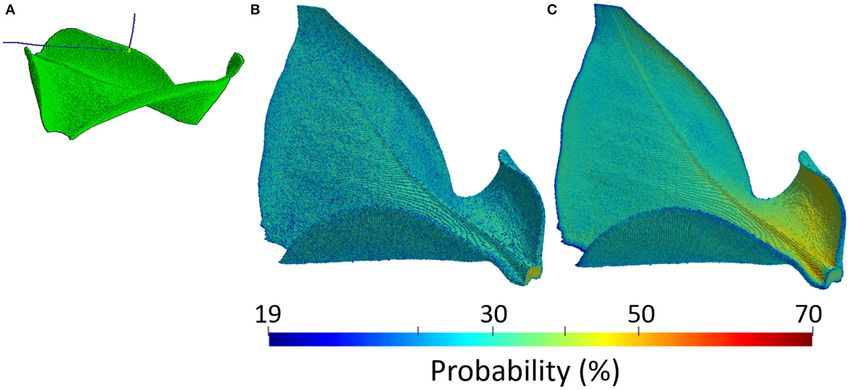
Galieni et al.                                                                                                                                          Plant Stress Detection

  FIGURE 1 | A summary of the main techniques for plant stress detection. The stressors and the wavelength used for stress detection in each technique are also
  shown. Stress manifests itself over a wide length scale ranging from the microscopic cellular to the macroscopic plant and field level. Whole field sensing (VIS/NIR
  reflectance, Thermography, Fluorescence) is naturally attractive in the agricultural practice, but provides only a qualitative information. At plant level morphological
  imaging techniques (CT, MRI) provide quantitative high resolution detection of structural damages induced by the stress, but cannot provide any information on the
  functional basis of the physiological mechanisms of reactions to both biotic and abiotic stressors at cellular level. For this purpose, metabolomics is an essential tool to
  enhance the results obtained with morphologic imaging techniques, but it is sample disruptive and is not able to provide timely indications to support early
  interventions both in open-field and controlled conditions. PET is by far the only quantitative functional imaging technique, which provides a time-dynamic
  non-disruptive information of the modifications of functional mechanisms and transport flows in the vascular system in response to biotic and abiotic stress.

spectroscopy, fluorescence spectroscopy], and (i) imaging (i.e.,                           for the characterization of a specific disease at the field scale,
VIS, multispectral and hyperspectral imaging, thermal imaging,                             proximal hyperspectral imaging is more able than hyperspectral
fluorescence imaging, x-ray imaging) approaches. In general,                               remote sensing, thanks to higher spatial resolution (Kuska and
non-imaging sensors could be more effectively applied on                                   Mahlein, 2018). Despite the potential of remote sensing for stress
lab-scales or leaf-scales measurements, since they provide data                            detection, some general considerations and weaknesses deserve
without spatial information.                                                               to be highlighted.
   The high resolution of the currently available sensors helps in                            Firstly, based on the reached technological advances and
individuating the possible correlations between subtle processes                           on the intrinsic characteristics of the applied technology, each
at the tissue level and plant electromagnetic patterns, following                          sensing technique is characterized by its own effectiveness
stress exposure (Thomas et al., 2017, 2018). At canopy or                                  in stress detection and identification (see also Figure 1), that
landscape levels, the spatial resolution represents a critical factor                      depends on (i) the kind of stressful conditions and (ii) its
to gather information on plant responses to stress. As an example,                         magnitude. Consequently, the desirable early identification of

Frontiers in Plant Science | www.frontiersin.org                                       3                                           January 2021 | Volume 11 | Article 609155
Galieni et al.                                                                                                                  Plant Stress Detection

stressful conditions (i.e., before symptoms appearance) is not              leaves (Buschmann, 2007; Pandey et al., 2015). So, ChlF and
obvious at all. For example, in the case of water stress,                   ChlF parameters are widely applied to rapid assess any mutation
the temperature-based indices (see section 2.3) provide an                  of Photosystem II, following the plant exposure to both biotic
appropriate pre-visual detection of plant responses, while some             and abiotic stressful conditions (Belasque et al., 2008; Pandey
vegetation indices derived from reflectance in the VIS/NIR                  et al., 2015). With respect to the latter, the fluorescence in the
domain (see section 2.2) are effective only at late plant responses         blue-green range (400–600 nm, with two maxima in the blue—
(Gerhards et al., 2019).                                                    440nm and green—530 nm) is related to fungal leaf infections
   Secondly, within the same sensing vegetation technique and               as it is emitted by substances (e.g., stilbenes) produced by the
stressful condition, spectral responses to stress exposure are              leaf following a fungal attack, and so providing a useful early
related to plant genotype (i.e., principally due to genotype-               detection tool (Casa et al., 2016). Active systems, based on laser-
sensitivity). This aspect may need an in-depth study of specific            induced fluorescence (LIF), was applied, for example, on citrus
stress-genotype combinations, also involving the understanding              plants to detect the citrus canker disease (caused by Xanthomonas
of the physiological and biochemical processes, which cause                 axonopodis pv. citri) (Belasque et al., 2008) or, more recently,
changes in the spectral feature, to derive indicators or parameters         the Huanglongbing (caused by Candidatus Liberibacter spp.) or
for specific demands.                                                       citrus greening (Ranulfi et al., 2016).
   Thirdly, data acquisition processes should consider the                      LIF was also successfully applied to study the effects of
environmental condition during measurements as well as plant                dimethoate on physiological and growth responses of pigeon pea
canopy and leaf structural architecture. Improvements need to               plants and to measure out its application (Pandey et al., 2015).
be achieved in terms of (i) data pre-processing, (ii) inclusion of          A fluorescent index was also proposed to estimate leaf nitrogen
calibration systems integrated on automated systems, and (iii)              concentration in rice (Yang et al., 2019). In particular, differently
use of multiple sensors platforms also equipped with 3-D shape              to reflectance measurements (see sections 2.2 and 2.5), the signal
sensors (Mishra et al., 2020).                                              is not affected by soil properties; so, ChlF sensors can be applied
   Fourthly, some plant responses, potentially detectable for               to estimate Chl content (linked to nitrogen availability) even in
stress diagnosis, may be shared among different stresses (i.e.,             the early crop stages (after plant emergence or transplant) or in
drought, salinity, temperatures, mineral toxicity, or pathogen              sparse soil coverage conditions (Casa et al., 2016).
infection) making difficult the identification of specific stressors,
especially in open-field conditions, where a multi-stress scenario          2.2. Vis/NIR Spectroscopy
can occur. It derives that, while a single sensing technique                Leaf and/or canopy reflectance has been widely researched across
could be characterized by high specificity in the identification of         several biotic and abiotic stressful conditions with both active
individual stress signals in experimental conditions, the possible          and passive sensors; the former are equipped with light-emitting
multiple causes in agricultural applications can be identified only         components while the latter depend on sunlight as a source of
through a holistic and integrated approach (Jones and Schofield,            light. The main applications in plant health detection are based
2008).                                                                      on the spectral wavelengths ranging from 400 to 2,500 nm, since
   All the above considerations offer a new starting point for the          reflectance in the VIS, NIR and SWIR is primarily influenced
advancement in vegetation sensing for stress detection through              by photosynthetic pigments, cell structure and water content,
the implementation of the currently available techniques,                   respectively. These traits can in fact undergo important changes
also with the introduction and strengthening of innovative                  in plants growing under unfavorable conditions (Mishra et al.,
imaging techniques applicable to the agricultural sector (see               2017).
section 4). The review goes through a more detailed overview                    Briefly, the electromagnetic radiation that runs into the leaf
of remote sensing technologies applied to plant stress detection            surface can be reflected, scattered, absorbed and transmitted
in agriculture. Considering the complexity and breadth of                   at wavelengths which depend on the biochemical and physical
the covered topics, further information can be obtained by                  characteristics of the leaf. In the VIS and IR regions the reflection
consulting the available scientific literature, to which reference is       patterns are somehow influenced by (i) the C-O, O-H, C-H and
made (Gorbe and Calatayud, 2012; Murchie and Lawson, 2013;                  N-H covalent bonds of macromolecules (i.e., sugars, proteins,
Mishra et al., 2017; Khan et al., 2018; Gerhards et al., 2019).             lignin, and cellulose), (ii) the amount of natural pigments
                                                                            containing tetrapyrroles rings, like chlorophylls (as important
2.1. Fluorescence Spectroscopy                                              absorbing molecules, in the blue and in the red bands), as well
Fluorescent molecules absorb energy from a given wavelength,                as (iii) the anatomical and biochemical leaf traits (i.e., surface
modify its electronic shell, and, after a short time, descend back          texture or thickness of cuticle, trichome density and architecture,
to its natural status while emitting some of the absorbed energy in         shape and thickness of the palisade and spongy mesophyll).
the form of an electromagnetic wave. Wavelengths of absorption                  The typical spectral assignments of a green leaves in the
and emission are specific for each compound: chlorophyll a                  optical spectral ranges VIS-NIR-SWIR of the electromagnetic
fluorescence (ChlF) has a natural emission between 650 and                  spectrum is reported in Figure 2. In the VIS region, there are
800 nm, with two maxima in the red (680 nm) and far-red                     two main absorption bands in blue (470 nm) and in red (670
(735 nm) wavelengths. Changes in the fluorescence spectra shape             nm), associated with Chla and Chlb, and a reflectance peak in the
as well as in the ratio between the two maxima emission peaks               yellow-green band (550 nm). The NIR region is characterized by
(i.e., F685/F735) are responsive of changes in Chl content of               higher reflectance values (the typical spectrum plateau), while in

Frontiers in Plant Science | www.frontiersin.org                        4                                    January 2021 | Volume 11 | Article 609155
Galieni et al.                                                                                                                                   Plant Stress Detection

  FIGURE 2 | A typical healthy vegetation spectrum (350–2,500 nm); spectral reflectance signature refers to spinach leaves (author’s personal and unpublished data).
  Measurements were taken using full-range hyperspectral ASD FieldSpec 4 Hi-Res (Analytical Spectral Devices Inc., Boulder, CO, USA) spectroradiometer equipped
  with a contact probe. Red-edge and water bands’ absorption sections are highlighted in red and blue, respectively.

the SWIR region the leaf reflectance pattern is highly dependent                       El-Hendawy et al., 2019b), the specific secondary metabolites
on the light absorbed by leaf water (near 1,450 and 1,900 nm) and                      accumulation in plant tissue (Couture et al., 2016) as well as the
on leaf dry matter (Ge et al., 2019; Gholizadeh and Kopacková,                         plant phenotyping (Garriga et al., 2017; Ge et al., 2019).
2019).                                                                                     Nowadays, reflectance spectroscopy principally relies on
    Interestingly, the position (wavelength) of the rapid increase                     technologies based on hyperspectral sensors, which consist of
in leaf reflectance from VIS to NIR, called red-edge (RE), is                          acquiring images in several narrow (< 10 nm) and contiguous
significantly affected by Chl content in leaves (Liu et al., 2019b).                   spectral bands, and allow to collect a large amount of data
Thus, stressful conditions that influence the concentration of                         (Feng et al., 2018; El-Hendawy S. et al., 2019). Over years, the
leaf pigments can be effectively identified. To this purpose,                          reflectance values measured at specific wavelengths of the VIS
the analysis of the spectral derivative is successfully performed                      -NIR-SWIR domains have been combined to obtain different
to highlight changes in RE (i.e., position and amplitude). For                         spectral reflectance indices (SRIs), applied in the assessment
instance, a blue-shift of the RE in rice infested by rice leaf folder                  of morphological, physiological and biochemical parameters
has been found (Huang et al., 2019).                                                   related to stress (El-Hendawy S. et al., 2019). One of the
    In general, reflectance spectroscopy is used for the sensing of                    most commonly used SRI is represented by the Normalized
a wide range of stressful conditions. Some of the more recent                          Difference Vegetation Index (NDVI), which was observed to
literature on this topic concerns the assessment of the nitrogen                       significantly correlate with the final yield of many crop species
status in crops (Stellacci et al., 2016), the macro- and micro-                        (El-Hendawy et al., 2019b). It is very difficult to provide
nutrient deficiencies (Galieni et al., 2015; Visioli et al., 2016;                     a complete overview of all developed SRIs. In Table 1 are
Rustioni, 2017; Rustioni et al., 2018), the impact of air and                          summarized some of the SRIs commonly used to estimate a
soil pollution (Cotrozzi et al., 2018; Gholizadeh and Kopacková,                       range of plant characteristics indicative of various stressors
2019), the plant disease detection (Ortiz et al., 2019; Zhang                          exposures. Some SRIs have been formulated and validated
et al., 2019a), the salinity effects on crop growth and yield (El-                     under specific genotype-stressor combinations, see plant-disease
Hendawy S. et al., 2019; El-Hendawy et al., 2019a; Boshkovski                          during infection (i.e., grapevine-Flavescence Dorée, AL-Saddik
et al., 2020), the drought-induced changes in plants (Stagnari                         et al., 2017). Although their reliability, a significant amount
et al., 2014; Maimaitiyiming et al., 2017; Sylvain and Cecile, 2018;                   of information come from very narrow spectrum regions

Frontiers in Plant Science | www.frontiersin.org                                   5                                         January 2021 | Volume 11 | Article 609155
Galieni et al. Plant Stress Detection
TABLE 1 | Summary of some of the most commonly vegetation spectrum reflectance indices (SRIs) and the related estimated morphological or physiological traits. Traits
can relate to more than one stressful condition, so the same index can detect different kinds of stress, both biotic and abiotic. Abbreviations: N, nitrogen; Chl, chlorophyll;
Car, carotenoids.
Index Formula Estimated parameter Reference
Photochemical Reflectance Index (R531 - R570 )/(R531 +R570 ) Physiology Peñuelas et al., 1995a
(PRI) Photosynthesis
Normalized Difference Vegetation (R800 - R670 )/(R800 + R670 ) Physiology Photosynthesis Rouse et al., 1974
Index (NDVI)
Normalised Difference Red Edge (R790 - R720 )/(R790 + R720 ) N status Barnes et al., 2000
(NDRE)
Nitrogen Stress Index 1 (NSI-1) * (R415 /R710 ) N content Read et al., 2002
Nitrogen Stress Index 2 (NSI-2) * (R517 /R413 ) N content Zhao et al., 2005
Simple Ratio Index 1 (SR-1) * (R750 /R710 ) Chl Zarco-Tejada et al.,
2001
Simple Ratio Index 2 (SR-2) * (R750 /R550 ) Chl Gitelson and Merzlyak,
1996
Simple Ratio Index 3 (SR-3) * (R750 /R700 ) Chl Gitelson and Merzlyak,
1996
Green NDVI (GNDVI) (R780 - R550 )/(R780 + R550 ) Chla Gitelson et al., 1996
Transformed Chlorophyll Absorption 3 × ((R700 - R670 ) - 0.2 × (R700 - Chl Daughtry et al., 2000
and Reflectance Index (TCARI) R550 )) × (R700 /R670 )
Structure Insensitive Pigment Index (R800 -R445 )/(R800 -R680 ) Car/Chla Peñuelas et al., 1995b
(SIPI)
Modified Chlorophyll Absorption in [(R700 - R670 ) - 0.2 * (R700 - R550 )] * Green leaf area index Daughtry et al., 2000
Reflectance Index (MCARI) (R700 /R670 ) Chl
Soil Adjusted Vegetation Index (SAVI) 1.5 × (R800 - R670 )/(R800 + R670 + Green biomass Huete, 1988
0.5)
Plant Senescence Reflectance Index (R678 - R500 )/R750 Car/Chl Merzlyak et al., 1999
(PSRI) Senescence
Anthocyanin Reflectance Index (ARI) (1/R550 ) - (1/R700 ) Pigments Zarco-Tejada et al.,
2005
p
Salinity and Water Stress Indices 2 (R803 - R681 ) / (R1326 + R1507 ) Water content Hamzeh et al., 2012
(SWSI 2) Chlorophyll
p
Salinity and Water Stress Indices 3 (R803 - R681 ) / (R972 + R1174 ) Water content Hamzeh et al., 2012
(SWSI 3) Chlorophyll
Water Index (WI) R900 /R970 Leaf water potential Zarco-Tejada et al.,
2003
Simple Ratio Water Index (SRWI) R860 /R1240 Leaf water potential Zarco-Tejada et al.,
2003
Normalized Difference Water (R860 - R1240 )/ (R860 + R1240 ) Leaf water potential Gao, 1996
Index (NDWI)
Leaf Water Index (LWI)* (R1300 /R1450 ) Leaf water thickness Seelig et al., 2008
Normalized Water Indices (NWI-1) R970 - R900 /R970 + R900 Canopy water status Babar et al., 2006
Normalized Water Indices (NWI-2) R970 - R850 /R970 + R850 Canopy water status Babar et al., 2006
Normalized Water Indices (NWI-3) R970 – R920 /R970 + R920 Canopy water status Prasad et al., 2007
Normalized Water Indices (NWI-4) R970 – R880 /R970 + R880 Canopy water status Prasad et al., 2007
Normalized Photochemical PRI / [RDVI×(R700 /R670 )] Chlorophyll fluorescence Berni et al., 2009a,b
Reflectance Index (PRInorm ) Stomatal conductance
Copper Stress Vegetation Index R550 /R850 ×R700 /R850 Copper content Zhang et al., 2017
(CSVI)
New Vegetation Heavy Metal Pollution DCR505 - DCR640 / DCR690 -DCR730 Copper content Zhang C. et al., 2019
Index (VHMPI)
Heavy Metal Cd Stress-Sensitive (R780 -R712 )/R678 × (R678 /R550 ) Cadmium content Wu et al., 2019
Spectral Index (HCSI)
Heavy Metal Stress Sensitive Index CI(Red−edge)/ PSRI Cadmium, lead and mercury Zhang et al., 2018
(HMSSI) contents
*No original index abbreviation found.
Frontiers in Plant Science | www.frontiersin.org 6 January 2021 | Volume 11 | Article 609155Galieni et al. Plant Stress Detection
(Hansen and Schjoerring, 2003); moreover, the predictive Over years, thermography has been applied in the early
performances of SRIs can be significantly influenced by genetic, detection and monitoring of pests and diseases (Al-doski et al.,
environmental, and crop management factors (Kawamura et al., 2016; Ahmed et al., 2019; Vidal and Pitarma, 2019; Lydia et al.,
2018). Reflectance spectrum can be also used entirely as a 2020), even before symptoms appearance (Chaerle et al., 2009;
“fingerprint” of the plant. Due to the large datasets, different Awad et al., 2015), despite its low applicability on a large
techniques, that involves multivariate statistical approaches, scale. Other works have shown a relationship between higher
including the stepwise multiple linear regression analysis (SMLR) temperature and nutrient deficiency (Costa et al., 2013).
and the partial least squares regression (PLSR), were exploited However, its main applications is addressed toward the
(Garriga et al., 2017). SMLR is useful in defining the relationships sensing for crop water-stress detection, for agricultural and
between spectral reflectance and crop characteristics although phenotyping purposes: i.e., the setting-up of the irrigation
its predictive ability can be compromised when the number of schedules (Gutirrez et al., 2018), the identification of any
predictors (X) is higher than the number of observations (Y) anomalies in irrigation systems (Matese et al., 2018), as a part
(overfitting), and when several predictors are strongly correlated of Cloud of Things (CoT)-based automated irrigation network
to each other (multicollinearity) (El-Hendawy et al., 2019b). (Roopaei et al., 2017), as a powerful tool in plant breeding
PLSR was found to effectively relate the plant responses to activities (Shakoor et al., 2017; Sagan et al., 2019; Siddiqui
spectral signatures, as in the estimation and prediction of several et al., 2019) and in ecological studies (Still et al., 2019). Many
crop traits in viral infection causing leafroll disease in Vitis studies relied on thermography in both herbaceous (Mangus
vinifera (Naidu et al., 2009), to predict photosynthetic activity et al., 2016; Martynenko et al., 2016; Quebrajo et al., 2018) and
among six genotypes (three transgenic and three wild type lines) arboreous (Egea et al., 2017; Espinoza et al., 2017; Santesteban
of Nicotiana tabacum (Meacham-Hensold et al., 2019), and to et al., 2017; García-Tejero et al., 2018; Blaya-Ros et al., 2020;
detect the impact of tropospheric ozone on Salvia officinalis Gutiérrez-Gordillo et al., 2020) cropping systems. Consequently,
(Marchica et al., 2019). a large variety of crop water-stress indices (CWSIs) have been
Other studies reported the use of the principal component developed both isolating the effect of the crop water status and
analysis (PCA), spectral band intercorrelations and stepwise normalizing the aggregated data at the canopy level (Poirier-
discriminant analysis (Ray et al., 2010). Anyway, the accuracy Pocovi et al., 2020). Some combination of well-watered and dry
of the estimating proposed models depends also on the reference crop temperatures, starting from the CWSI proposed
preprocessing methods which include multiplicative scattering by Idso et al. (1981) till to the most recent ones developed
correction, standard normal variate, normalization, PCA and by Poirier-Pocovi et al. (2020), have been applied to derive the
others (Liu et al., 2019b). above-mentioned indices.
However, despite technology advances of detectors as well as
of data processing, further efforts should be addressed toward
2.3. Thermal Imaging (i) the optimization of data collection (Costa et al., 2013), (ii)
Thermal imaging (thermography) is one of the most used the indication of a generally accepted calculations of CWSI,
imaging techniques in agronomic and environmental sciences to determine crop-specific thresholds for irrigation scheduling,
as well as in the agri-food industry (Costa et al., 2013). It can and (iii) the advancement of hyperspectral TIR remote sensing
be successfully applied in the detection of stressful conditions (Gerhards et al., 2019).
thanks to the significant relationships between foliar surface
temperature (Tleaf ) and leaf gas exchange (CO2 and H2O 2.4. Fluorescence Imaging
fluxes regulated by stomatal closure or aperture) or stomatal The development of new technologies has allowed building up
conductance (gs) (Gutirrez et al., 2018). The physical laws that an image starting from the simultaneous gathering of a high
regulate the emission of bodies in the TIR region, as well as number of punctual fluorescence spectroscopy signals, which are
the atmospheric and environmental variables that condition the encoded with a color-value relation. Thanks to cameras it is
Tleaf-gs relationship, are well-known and well-treated topics possible to repeat the measure over time very rapidly, obtaining
(Jones and Schofield, 2008; Costa et al., 2013; Vialet-Chabrand a comprehensive visualization of the spatial-temporal gradients
and Lawson, 2019) and are beyond the scope of this review. of the crop. Generally, the system is composed of a UV light
As an imaging technique, thermography possess the advantage source for the excitation of the fluorescent molecules and a
to acquire geolocated data at canopy scale, overcoming the charge-coupled device (CCD) camera (Sankaran et al., 2010). In
classic handheld infrared thermometers, applied at leaf or single the multicolor fluorescence imaging approach, it is possible to
plant scales (Crusiol et al., 2020), providing results on a whole generate a fluorescent response from four different wavelength
plant basis (Poirier-Pocovi et al., 2020). TIR cameras are widely bands: red, far-red, blue and green (690, 740, 440, and 520 nm,
used as portable devices for both Unmanned Aerial Vehicles respectively) using a single UV light source of excitation (ranging
(UAVs) (Sagan et al., 2019) or for agricultural vehicle proximal from 340 to 360 nm).
to the ground, as an on-the-go system, or even involving Active ChlF sensors has been successfully applied in the
machine learning (Gutirrez et al., 2018), characterized by low- detection of the early stages of infection by fungi, viruses or
cost data acquisition, easy implementation, processing and bacteria: see for example, zucchini plants affected by soft-rot
immediate response as well as higher spatial-, spectral- and (caused by Dickeya dadantii) and powdery mildew (caused by
temporal resolutions. Podosphaera fusca) (Pérez-Bueno et al., 2016; Pineda et al.,
Frontiers in Plant Science | www.frontiersin.org 7 January 2021 | Volume 11 | Article 609155Galieni et al. Plant Stress Detection
2017). Fluorescence imaging represents also an useful tool for used are polymerase chain reaction (PCR and real-time
the investigation of stressful conditions attributable to nutrient PCR) and enzyme-linked immunosorbent assay (ELISA); other
deficiencies (Wang et al., 2018c), extreme temperatures (Dong techniques, mainly applied for disease detection, include
et al., 2019; Lu and Lu, 2020), pollution (Moustakas et al., 2019), immunoflourescence imaging (Gautam et al., 2020), flow
use of agrochemicals (Weber et al., 2017; Li et al., 2018) as well as cytometry (Chitarra and Bulk, 2003), fluorescence in situ
drought and/or salinity (Yao et al., 2018; Sun et al., 2019). Beside hybridization (FISH; Farber et al., 2019), and DNA microarrays.
active fluorescence techniques, sun induced ChlF through passive PCR screens complementary DNAs (cDNAs/cDNA) and
sensors deserves to be mentioned due to its various application in characterizes tissue-, organ- or development-specific cDNAs. It
plant stress studies (Bandopadhyay et al., 2020). allows identifying differentially induced or expressed genes and
represents a reliable and widely used method to reveal genes
2.5. Multi- and Hyperspectral Imaging and molecular mechanism which response to abiotic stress in
Spectral sensors are classified based on the resolution of the different plant species. It has been reported (Liu and Baird,
measure (i.e., the wavebands density in the measure): both multi- 2003) that the genes corresponding to 13 out of 17 cDNAs
and hyperspectral can load data from a broader and continuous clones isolated from sunflower were confirmed to be expressed
VIS/NIR band, typically from 400 to 1,000 nm, with the most differentially in response to osmotic stress by quantitative
advanced systems that reach the 350–2,500 nm band (Stellacci reverse-transcription PCR (RT-PCR). Suitable reference genes
et al., 2016; Maes and Steppe, 2019). Multispectral sensors reach have also been reported in cultivated rice (Pabuayon et al.,
a spectral resolution of about 50 nm while hyperspectral sensors 2016), rapeseed (Machado et al., 2015), potato (Tang et al.,
provide a resolution ranging between 1 and 10 nm (Mahlein, 2017) and ornamental plant species (Carex rigescens; Zhang K.
2016; Stellacci et al., 2016). Despite this, to date multi-spectral et al., 2019). Real-time PCR platforms have also been used for
sensors are mainly advantageous in agricultural applications due rapid diagnosis of plant diseases (Campos et al., 2019; Liu et al.,
to greater availability and lower costs. 2019a).
The working principle of spectral imaging sensors vary from ELISA-based biotic stress detection consists in the production
the filter-based ones, where only the light of a specific waveband of a specific antibody for a protein (antigen), associated with
can pass through, to the push broom and whisk broom scanners a plant disease, and is used for the detection of the biotic
that gather the full spectrum on one pixel than move to another, stress-causing microorganism inside an extracted probe from
to the most recent snapshot sensors that, using the same mosaic the plant tissue. The sensitivity of ELISA varies depending on
principle of the common RGB (red-green-blue) camera, allows the organism species (relatively low for bacteria, higher for
a quicker image recording, very useful in extremely variable and fungi), sample freshness and titre (Martinelli et al., 2015). The
adverse sampling conditions (Thomas et al., 2017). main disadvantages of molecular-based approaches rely on time-
With the image-based VIS/NIR approach, thanks to the consuming and labor-intensive domains. These shortcomings
combination of spectral information with the spatial and clash with the need of a rapid screening and detection and
temporal dimensions, it is possible to estimate the occurrence of monitoring of stress and can be overcome through the use of
stressful conditions even at landscape scale (Zhang et al., 2019a). detection techniques able to estimate the presence of any limiting
Spaceborne, airborne and ground-based, help to monitor in real- conditions on a plant-response basis (sections 2 and 4).
time the water status, biomass and yield, nutrient status, disease,
and pests (Xue and Su, 2017; Maes and Steppe, 2019; Zhang 3.2. Metabolomics
et al., 2019a; Caballero et al., 2020), thanks also to combined Metabolomics, defined as comprehensive and quantitative
elaboration of ground-based hyperspectral collected data with analysis of all small molecules in a biological system (Fiehn,
hand-carried radiometers and spectroradiometers and UAVs 2001), is widely shared in studies regarding plant physiology and
imaging data (Zheng et al., 2018). In Table 2, an overview of the biochemistry as it allows the comprehension of the regulation
recent literature about the application of hyperspectral imaging of metabolic networks (Obata and Fernie, 2012). Plants rely
for stress detection has been reported. on specific survival strategies to react to stress. Frequently
It is worth to highlight that the robustness of the estimation their response leads to the synthesis of primary and secondary
models built from spectral imaging datasets is greatly affected metabolites (Stagnari et al., 2016), which are involved, for
by the technical characteristics of the sensors, by environmental example, in the regulation of osmotic pressure within cells,
factors such as temperature, humidity and wind, by the camera cell signaling, membrane formation and scaffolding, whole-plant
settings (i.e., compression, stabilization, aperture, shutter speed), resource allocation, prevention from cell oxidation, deterrence
and even by data preprocessing and processing techniques from herbivores as well as prevention from infection and
(Barbedo, 2019; Liu et al., 2019a). growth of pathogenic microorganisms (Dawid and Hille, 2018).
Consequently, an adjustment of the metabolic pathways, aimed
3. DISRUPTIVE QUANTITATIVE PRECISION at achieving a new state of homeostasis (referred as acclimation)
METHODS FOR STRESS ASSESSMENT occur (Suzuki and Mittler, 2006).
The research conducted in the metabolomics field relays
3.1. Molecular Methods principally on two different acquisition strategies: nuclear
In the last decades, several molecular techniques have been magnetic resonance (NMR) and mass spectrometry (MS)—
developed for the detection of plant stress. The most commonly gas chromatography/liquid chromatography-mass spectrometry
Frontiers in Plant Science | www.frontiersin.org 8 January 2021 | Volume 11 | Article 609155Galieni et al. Plant Stress Detection
TABLE 2 | Published claims of stress identification from hyperspectral imaging since 2018, along with the chosen multivariate data processing technique and accuracy
reached. “Plant stress” refers to both (i) the classification or modeling of stressful conditions and (ii) the plant phenotyping.
Plant stress Species Techniques Accuracy Reference
Chilling blueberry PLS-DA >75% Gao et al., 2019
Salinity wheat Novel approach – Moghimi et al., 2018
Drought grapevine PLS-DA >97% Zovko et al., 2019
PLS-SVM
Drought grapevine RF (Deep learning) 80-83% Loggenberg et al., 2018
Drought rice PLSR-MLR – Krishna et al., 2019
Drought tomato Derived SRIs – Elvanidi et al., 2018
Drought-Meloidogyne incognita (Nematoda) tomato PLS-DA 90-100% Susič et al., 2018
PLS-SVM
Insect herbivory maize SLDA 79.0% do Prado Ribeiro et al., 2018
Discriminant classification
model
Powdery Mildew grapevine PLS-DA Pérez-Roncal et al., 2020
Stripe rust wheat PCA ∼80% Yao et al., 2019
BPNN
Fusarium head blight wheat Derived SRIs – Mahlein et al., 2019
Septoria tritici wheat PLS-DA 93% Yu et al., 2018
Powdery mildew barley SiVM ∼95% Thomas et al., 2018
Non-linear SVM
Magnaporthe oryzae barley LDA >98% Zhou et al., 2019
CARS
Charcoal rot soybean SVM 97% Nagasubramanian et al., 2018
Sclerotinia stem rot oilseed rape PLS-DA >90% Kong et al., 2018
SVM
Alternaria solani potato PLS-DA 92% Van De Vijver et al., 2020
SVM
Citrus canker tangerine RBS 94-100% Abdulridha et al., 2019
KNN
tomato spotted wilt sweet pepper OR-AC-GAN (Deep 96% Wang et al., 2019d
learning)
N content tea PLS-DA >90% Wang et al., 2020
LS-SVM
PLSR
N content apple PLSR 77-78% Ye et al., 2020
MLR
shikimic acid concentration transgenic maize PLSR 82% Feng et al., 2018
Cadmium content (model) tomato WT-LSSVR (Deep learning) – Jun et al., 2019
Lead concentration (model) lettuce WT-SAE (Deep learning) – Zhou et al., 2020
Dicamba soybean RF (Deep learning) – Zhang et al., 2019b
BPNN, back propagation neural network; CARS, competitive adaptive reweighted sampling; FNN fully-connected neural network; KNN, K nearest neighbor; LDA, linear discriminant
analysis; LS-SVM, least squares-support vector machines; MLR, multiple linear regression; OR-AC-GAN outlier removal auxiliary classifier generative adversarial nets; PCA, principal
component analysis; PLS-DA partial least squares-discriminant analysis; PLS-SVM, partial least squares-support vector machine; PLSR, partial least-squares regression model; RBF,
radial basis function; RF random forest; SiVM, simplex volume maximization; SLDA, stepwise linear discriminant analysis; SRIs, spectrum reflectance indices; SVM, support vector
machine; WT-LSSVR wavelet transform and least-square support vector machine regression; WT-SAE wave-let transform and stacked auto-encoders.
(GC/LC-MS) (Piasecka et al., 2019). NMR allows to elucidate Time-of-flight (TOF)-MS has become the method of
the structure of metabolites and the biomolecular composition choice thanks to its fast scan times. The crucial advantages
of plant extracts (Fernie et al., 2004). GC is the most of this technology are his stable protocols for machine setup
developed analytical platform for plant metabolite profiling and maintenance, and the chromatogram evaluation and
and represents one of the first high-throughput approaches interpretation. LC-based methods have the advantage, over
applied (Roessner et al., 2001). When coupled to MS, it allows GC-MS, to detect thermolabile, polar metabolites, and high-
profiling non-targeted metabolites, both thermally stable non- molecular weight compounds without any derivatization.
polar ones and derivatized polar one. This technique has lower Moreover, higher resolution and sensitivity have been
efficiency for molecular compounds with molecular weight larger achieved with the development of ultraperformance liquid
than 1 kDa. chromatography (UPLC) (Rogachev and Aharoni, 2012).
Frontiers in Plant Science | www.frontiersin.org 9 January 2021 | Volume 11 | Article 609155Galieni et al. Plant Stress Detection
Nowadays, the progresses in analytical instrumentation and the expression of the arginine decarboxylase gene, represents an
the application of bioinformatic procedures have improved the important response to cold stress (Kou et al., 2018).
measurements of a higher number of plant metabolites as well The metabolic regulation under heat shock has similarities
as the correlation of metabolome data with those from other with that regarding low temperature case (Guy et al., 2008). In
omics levels (i.e., transcriptome and/or genome). This allows recent years, metabolism reprogramming under heat stress has
the assessment of metabolic changes and the elucidation of the been extensively studied in several agricultural crops, i.e., wheat
involved metabolic pathways (Parihar et al., 2019), although the (Thomason et al., 2018; Wang et al., 2018a,c) and soybeans (Das
analytical sensitivity and resolution needed for the simultaneous et al., 2017), among others. Tomato microspore of pollen after
separation and detection of the metabolites found in plants, are 2 h of heat stress increased significantly the total abundance
still far to be achieved. of flavonoids (Paupiére, 2017); pepper plants coped with heat
Several metabolomic studies have revealed that many stress inducing the accumulation of osmotic adjusting materials
metabolic pathways are regulated under stress (i.e., drought, such as total soluble sugars, proline and total protein as well as
salinity, heat and chilling, nutrient deficiency, light, heavy flavonoids (isorhamnetin-3-O-neohesperidoside, daidzein, 7-O-
metals, ozone - alone or in combination). Since many methyleriodicty-ol, tulipanin) (Wang et al., 2019b). Heat-stress
of these studies have been previously reviewed (Obata was often studied in combination with other environmental
and Fernie, 2012; Arbona et al., 2013; Li et al., 2019), we stressful conditions, such as elevated CO2, reproducing the
will consider only the most recent literature on this topic. climate change scenario, as for maize (Qu et al., 2018a) and
Photosynthesis regulation and osmolytes accumulation have soybeans, among others.
been widely reported under water stress conditions. Proline, Heavy metal toxicity hampers the metabolic pathways,
tryptophan, L-arginine, L-histidine, L-isoleucine increased in reduces the photosynthesis, respiration or transpiration (Feng
the tolerant line after water stress induction while choline, et al., 2020) and contributes to generate ROS or non-free
phenylalanine, guanine, aspartic acid, and alpha-ketoglutaric radical species (i.e., singlet oxygen and hydrogen peroxide) and
decreased in the case of chickpea; however, the effect of cytotoxic compounds such as methylglyoxal causing oxidative
variety (and sensitivity to drought) could have affected the stress (Parihar et al., 2019). Plants normally react to heavy
accumulation of some of them after a long-term exposition to metals toxicity by significantly increasing proline and histidine
stressful conditions (Khan et al., 2019). Proline and arginine levels (Khalid et al., 2019) as well as alanine, β-alanine,
accumulations were also observed in drought-tolerant sesame serine, putrescine, sucrose, γ -amino butyric acid, raffinose, and
genotype, besides an increase of abscisic acid, lysine, aromatic trehalose contents (Sun et al., 2010).
and branched chain amino acids, 4-aminobutanoic acid, Regarding biotic stress, several metabolites have been
saccharopine, 2-aminoadipate, and allantoin). Metabolomics— identified as metabolic biomarkers in plant species (Li et al., 2019;
also in combination with other-omics—can explain the Castro-Moretti et al., 2020)—also including the volatile organic
drought-tolerance mechanism in drought-tolerant wild compounds (VOCs) (i.e., isoprene, methanol, phytohormone
and/or ancestral genotypes, providing useful information ethylene, and some monoterpenes, terpene, methyl jasmonate,
for breeding purposes, as wild soybean (Glycine soja) (Wang methyl salicylate) (Ninkovic et al., 2019). In tomato bacterially
et al., 2019a) and Brachypodium distachyon (Lenk et al., 2019), infected plants, the level of amino acids, organic acids, rutin,
among others, as well as the salt-tolerant mechanisms of the and phenylpropanoids increased, while viroid infection seems
halophyte for food or pharmaceutical purposes (Chen et al., to alter only glucose and malic acid biosynthesis (López-Gresa
2019). et al., 2010). In rice, 16 fatty acids (unsaturated linoleic acid)
The effect of extreme temperatures (beyond the maximum together with two amino acids (glutamine and phenylalanine)
and minimum cardinal temperatures) on plants metabolomics were identified as resistance markers (Agarrwal et al., 2014).
responses is rather relevant (Guy et al., 2008). Cold stress— Metabolomic analysis of barley, rice and purple false brome grass,
which is one of the most damaging abiotic stresses—can alter revealed a significant accumulation in the non-polymerized
significantly transcriptome and plant metabolism due to the lignin precursors during infection by Magnaporthe oryzae
direct inhibition of metabolic enzymes and to the reprogrammed (Parker et al., 2009). In addition, among secondary metabolites,
gene expression (Chinnusamy et al., 2007). As consequence, phytoalexins and phytoanticipins are biosynthesized in response
the observed growth reduction reduces the capacity for energy or advance to pathogen perception (Schlaeppi et al., 2010).
utilization, with a consequent inhibition of photosynthesis and Among the various “omics” technologies (genomics,
production of reactive oxygen species (ROS) (Arbona et al., transcriptomics, proteomics, metabolomics, and phenomics),
2013). Phenolics accumulation significantly increases in the cell metabolomic can be considered one of the most suitable
wall as well as amino acids, hormones and simple carbohydrate approach for the identification of phenotypic, genetic, and
levels, while starch content decreases (Moura et al., 2010; biochemical changes involved in plant plasticity responses
Rastogi et al., 2019). In wheat, the abundance of several simple to environmental stress conditions (Pandian et al., 2020).
carbohydrates, i.e., raffinose, trehalose, maltotetraose, mannose, However, it has a strong point of weakness due to the influence
and fructose follows cold acclimation (Zhao et al., 2019), with a of developmental stage and growth factors in the metabolic
preeminent role played by proline-synthesis pathway, ABA and responses among tissues and cells, which could compromise the
jasmonic acid (JA) signal transduction pathways. In the freezing detection of secondary metabolites of complicated structure,
tolerant potato genotypes the accumulation of putrescine via potentially involved in stress responses (Gokce et al., 2020).
Frontiers in Plant Science | www.frontiersin.org 10 January 2021 | Volume 11 | Article 609155Galieni et al. Plant Stress Detection
As a matter of facts, the complete comprehension of the the range between −550 and −800 HU and corresponds to the
complexity of plant’ stress response and tolerance, can be mesophyll (Figure 3F). They have been applied, for example,
achieved integrating data from the “omics” sciences into systems to identify fungal infections in wheat (Narvankar et al., 2009)
biology approaches (Gokce et al., 2020). The obtained reliable and pest injuries by cowpea weevil in soybean (Chelladurai
metabolite quantitative locus (mQTL) data from metabolomic, et al., 2014). Under both laboratory and field conditions, x-ray
can be effectively combined with phenotypic data, obtained fluorescence can be used to determine the elemental spatial
using high-throughput technologies, so also integrates the G distribution in plant organs, also in response to environmental
× E (Genotype × Environment) interaction, and providing stress (Mathanker et al., 2013; Fittschen et al., 2017).
insights of metabolic adaptation to the environment, crucial in Similarly, magnetic resonance imaging (MRI) is an
targeted breeding programs. However, it is essential to specify application of NMR, firstly developed for medical purposes.
that physiological, biochemical and molecular mechanisms Since MRI necessitates of large electro-magnets (commonly
involved in stress tolerance can be complementary but not equal between 0.2 and 7.0 T), it cannot operate directly in the field.
among tissues and organs so that the novel breeding strategies The magnetic interaction between the nuclei and the magnetic
can be based on targeting specific tissues or organs (Vives-Peris field results in a resonant absorption of certain frequencies,
et al., 2020). Various high-throughput phenotyping technologies, characterizing elements with a non-zero magnetic momentum
employed in the phenomics of plant above-ground organs, have nucleus (1 H, 13 C, 14 N, 15 N, and 31 P) and their bounds. The
been developed over the last years (see section 2). On the other signals intercepted by the detectors are elaborated by computing
hand, high-throughput phenotyping of below-ground organs is systems into a tridimensional image. In addition to food quality
still little explored and could advantage from non-destructive control (Chen et al., 2013; Ebrahimnejad et al., 2018), MRI
3D technologies, including the tomographic and dynamic was applied in plant stress detection (water and biotic stress)
phenotyping technologies described in the next sections (Qu (Goodman et al., 1992; Sorin et al., 2018). Recently MRI has been
et al., 2016; Yoshino et al., 2019). used to identify a reduction in xylem flux related to dehydration
sensitivity in potatoes (Aliche et al., 2020).
Although high-resolution structural imaging plays an essential
4. POSITRON EMISSION TOMOGRAPHY: role in the investigation of plants, the need of additional
AN EMERGING NON-DISRUPTIVE information is essential to properly characterize plant stress.
QUANTITATIVE FUNCTIONAL IMAGING Therefore lower resolution imaging techniques have been
TECHNIQUE FOR STRESS DIAGNOSIS developed with the aim of a multimodal approach. THz imaging
systems and ultrasound imaging are emerging examples of such
4.1. Morphological Plant Imaging approach. THz imaging refers to a band of electromagnetic
Techniques waves ranging from 0.1 to 10 THz (3,000–30 µm), between the
The frontier of plant stress diagnosis is represented by non- microwave and infrared regions, where the vibration and rotation
disruptive and non-invasive methods, the most of which have frequencies of the most polar and many organic molecules
been originally developed for quantitative precision medical occur (Martinelli et al., 2015; Qu et al., 2018b; Nie et al.,
imaging. Here it is needed to make a distinction between 2019). In the last years sources and detectors for THz region
morphological and functional imaging. have been developed leading to the definition of specific THz
Morphological imaging consists of visualizing in a non- spectroscopy (such as THz time-domain spectroscopy, THz-
invasive way the internal structures of the plant with a resolution TDS) and imaging techniques (Qu et al., 2018b; Wang et al.,
of few hundreds micrometers. X-rays (i.e., electromagnetic 2018c). Nowadays, these techniques are principally used to detect
radiation in the wavelength range 0.01–10 nm) have the the leaf water content (Nie et al., 2017; Song et al., 2018;
distinct advantage to penetrate through several objects and are Zahid et al., 2019; Li et al., 2020). Other applications include
particularly suited to this purpose. The x-ray studies in the food agrochemicals detection in plant tissues and/or plant derived
and agricultural sectors generally apply low-energetic x-rays (up foods (Lee et al., 2016; Qin et al., 2018; Nie et al., 2019),
to 10 keV energy level, 10–0.10 nm wavelength). Moreover, x- seed inspection and soil analysis (Wang et al., 2018b) as well
ray computed tomography (CT) represents a powerful strategy as the determination of spatial distribution feature of the leaf
for the internal quality evaluation (Kotwaliwale et al., 2014). CT constituent contents (Wang et al., 2019c). Ultrasound imaging—
provides in fact non-disruptively a 3-dimensional measurement which implies mechanical waves at frequencies above 20 kHz,
of the attenuation coefficient of the tissues of the plants. has also been applied to plant imaging (Chen et al., 2013). It is
We show an example of the 3-dimensional view and the based on the principle that ultrasound velocity is related to the
transverse and longitudinal profiles of µ x, y, z in the leaf of material property or changes in material characteristics; it finds
Epipremnum Aureum in Figures 3A–C, respectively. We report wide application for food-quality and safety assessment (Chen
the distribution of the value of µ x, y, z expressed in Hounsfield et al., 2013). Non-contact resonant ultrasound spectroscopy (NC-
units (HU) across the entire leaf in Figure 3D. It is possible
RUS) allows determining surface mass, thickness and elastic
to distinguish two regions. In the first one µ x, y, z is in modulus of the leaves very rapidly, in-vivo and contactless
the range between −550 and 0 HU. By visualizing only the (Álvarez Arenas et al., 2016; Fariñas et al., 2019). It has been
region of the leaf with µ x, y, z in this range (Figure 3E), we also proposed the use of air-coupled and wide-band ultrasound
identify the vascular system. The second one has µ x, y, z in pulses (150–900 kHz) to continuously monitoring leaf properties
Frontiers in Plant Science | www.frontiersin.org 11 January 2021 | Volume 11 | Article 609155You can also read