METROPOLITAN HOUSTON REGIONAL
    WATERSHED ASSESSMENT

           DRAFT

          JUNE 2021
←
→
Page content transcription
If your browser does not render page correctly, please read the page content below
METROPOLITAN HOUSTON REGIONAL
WATERSHED ASSESSMENT
DRAFT
JUNE 2021
Page Intentionally Left Blank
Disclaimer: The information presented in this report is to provide a strategic framework of
potential options to address problems within the Metropolitan Houston Region and the 22
Watersheds within Harris County. Options identified will follow normal authorization and
budgetary processes of the appropriate agencies. Any costs presented are rough order
magnitude estimates used for screening purposes only.
Page Intentionally Left Blank
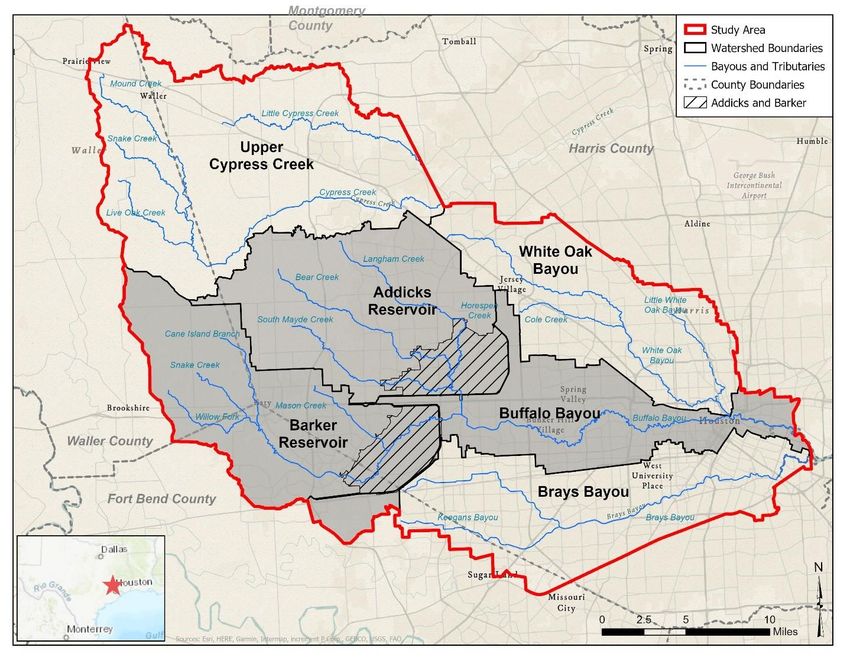
TABLE OF CONTENTS
1.     Introduction ...................................................................................................................... 1
     1.1.    Non-federal Sponsor.................................................................................................. 1
     1.2.    Purpose..................................................................................................................... 1
2.     Watershed Planning Guidance ......................................................................................... 2
     2.1.    Watershed Planning Approach................................................................................... 3
       2.1.1.       Planning goals:................................................................................................... 3
3.     Problems, Objectives and Constraints............................................................................... 4
     3.1.    Problems................................................................................................................... 4
     3.2.    Objectives and Constraints ........................................................................................ 5
     3.3.    Report Organization................................................................................................... 6
4.     Shared Vision Milestone and Coordination and Priorities/Roles ......................................... 6
5.     Study Area ....................................................................................................................... 7
     5.1.    Sub-Watersheds in the Region................................................................................... 9
       5.1.1.       Addicks Reservoir............................................................................................... 9
       5.1.2.       Armand Bayou.................................................................................................. 10
       5.1.3.       Barker Reservoir............................................................................................... 10
       5.1.4.       Brays Bayou ..................................................................................................... 10
       5.1.5.       Buffalo Bayou ................................................................................................... 11
       5.1.6.       Carpenters Bayou............................................................................................. 11
       5.1.7.       Cedar Bayou .................................................................................................... 12
       5.1.8.       Clear Creek ...................................................................................................... 12
       5.1.9.       Cypress Creek.................................................................................................. 12
       5.1.10.         Greens Bayou ............................................................................................... 13
       5.1.11.         Halls Bayou ................................................................................................... 13
       5.1.12.         Hunting Bayou............................................................................................... 13
       5.1.13.         Jackson Bayou.............................................................................................. 14
       5.1.14.         Little Cypress Creek ...................................................................................... 14
       5.1.15.         San Jacinto River .......................................................................................... 14
       5.1.16.         San Jacinto & Galveston Bay......................................................................... 15
       5.1.17.         Sims Bayou ................................................................................................... 15
       5.1.18.         Spring Creek ................................................................................................. 15

Metro Houston
Regional Watershed Assessment                                         i                                               Table of Contents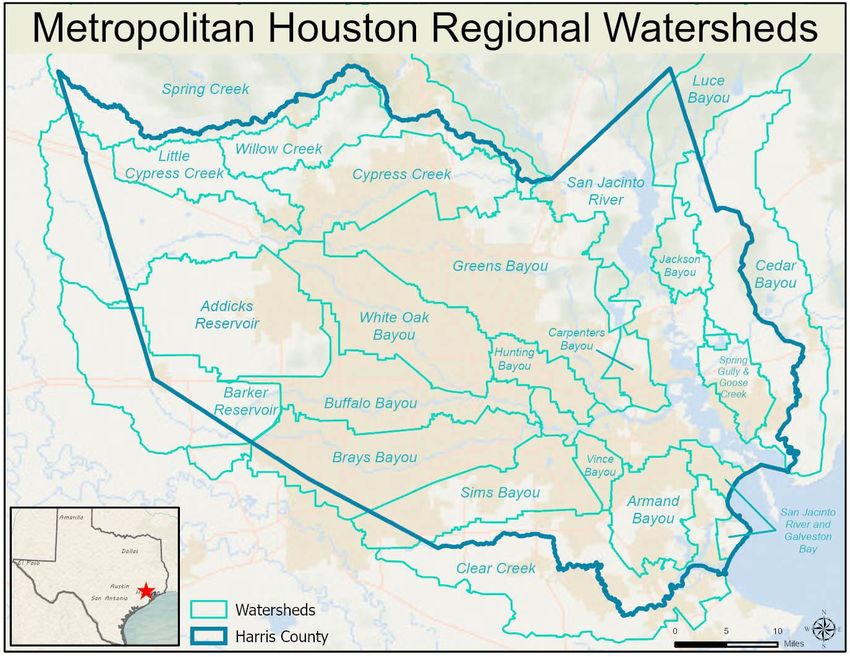
5.1.19. Spring Gully and Goose Creek....................................................................... 16
5.1.20. White Oak Bayou .......................................................................................... 16
5.1.21. Willow Creek ................................................................................................. 16
5.1.22. Vince Bayou.................................................................................................. 17
6. Regional Inventory and Findings..................................................................................... 17
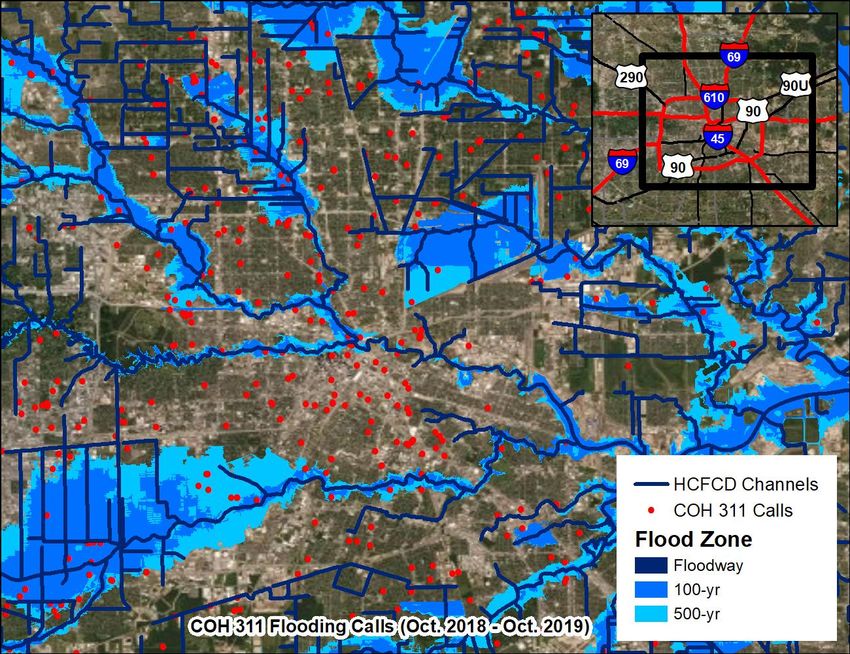
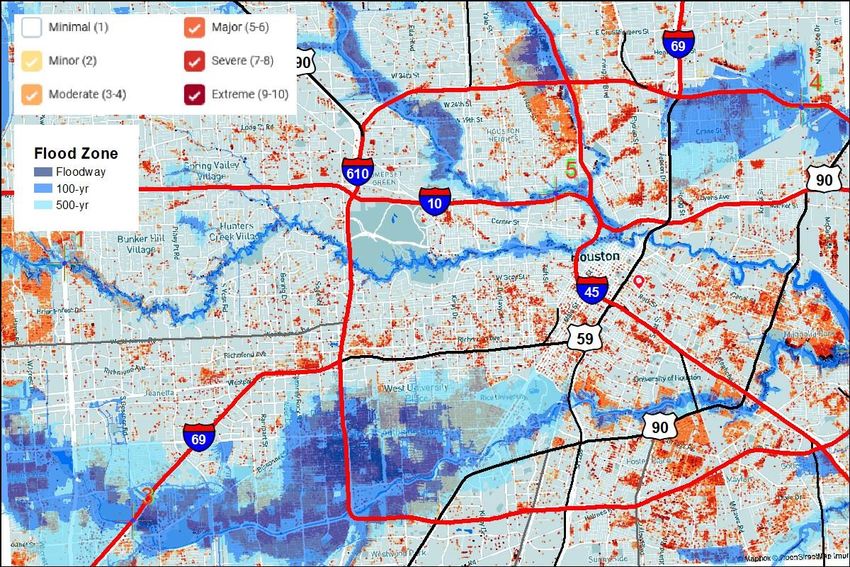
6.1. Regional Flood Hazard ............................................................................................ 18
6.2. Floodplains and flood hazard ................................................................................... 20
6.3. Factors contributing to flood risk............................................................................... 23
6.4. Flood Risk Discussion.............................................................................................. 33
7. Engineering approaches – Drain, Detain, Convey ........................................................... 36
7.1. Drain ....................................................................................................................... 37
7.2. Detain and Convey .................................................................................................. 37
8. Current FRM Activities.................................................................................................... 37
8.1. Federal Agencies..................................................................................................... 38
8.1.1. Federal Emergency Management Agency (FEMA) ............................................ 38
8.1.2. Housing and Urban Development (HUD) ........................................................... 38
8.1.3. US Geological Survey (USGS) .......................................................................... 38
8.1.4. National Oceanic and Atmospheric Administration (NOAA)................................ 39
8.1.5. US Environmental Protection Agency (USEPA) ................................................. 39
8.1.6. US Army Corps of Engineers (USACE) ............................................................. 39
8.2. Harris County Flood Control District (HCFCD) ............................................................ 3
8.2.1. HCFCD Technical Tools ..................................................................................... 4
8.2.2. Level of Service Analysis .................................................................................... 4
8.2.3. Model and Map Management (M3) System ......................................................... 4
8.2.4. HCFCD Tunnel Feasibility Study ......................................................................... 4
8.2.5. HCFCD Led Feasibility Studies ........................................................................... 5
8.3. City of Houston (CoH) ................................................................................................ 7
8.3.1. ReBuild Houston................................................................................................. 7
8.3.2. Resilient Houston ............................................................................................... 7
8.4. San Jacinto Region.................................................................................................... 8
8.5. League City and Dickinson – Silver Jackets ............................................................... 8
8.6. State of Texas ........................................................................................................... 8
Metro Houston
Regional Watershed Assessment ii Table of Contents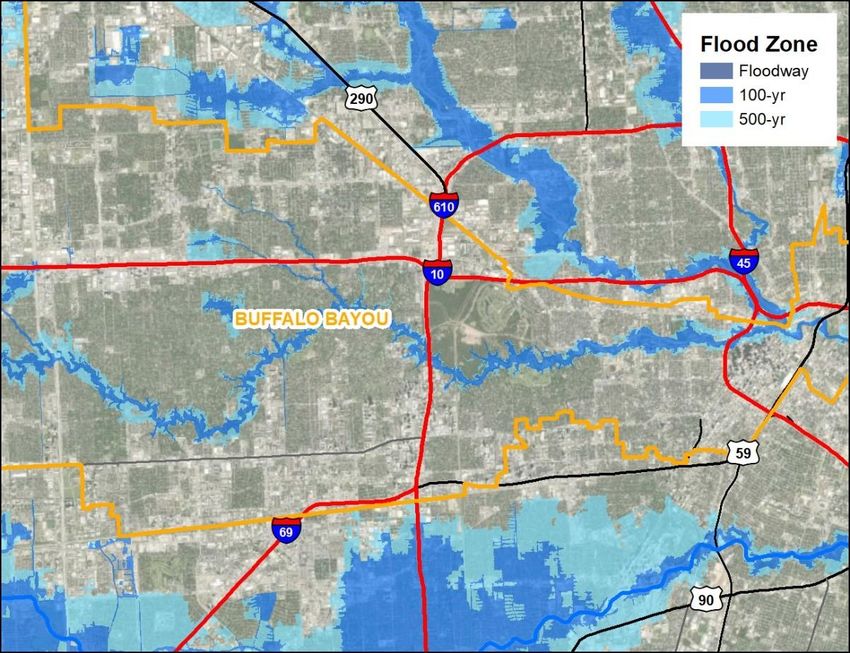
8.6.1.        General Land Office (TxGLO) ............................................................................. 8
       8.6.2.        Texas Water Development Board........................................................................ 9
9.     Post Harvey Recommendations ...................................................................................... 10
     9.1.      Greater Houston Strategies for Flood Mitigation ....................................................... 10
     9.2.      Houston a Year After Harvey: Where We Are and Where Do We Need To Be .......... 10
     9.3.      Living with Water ..................................................................................................... 11
     9.4.      West Houston 2060 (WH 2060)................................................................................ 11
     9.5.      Houston Stronger .................................................................................................... 12
10.         Broad Findings............................................................................................................ 13
     10.1.        Risk Communication ............................................................................................ 13
     10.2.        Regional Coordination .......................................................................................... 14
     10.3.        Equitable Distribution ........................................................................................... 14
     10.4.        Screening Tradeoffs............................................................................................. 14
       10.4.1.          Performance ................................................................................................. 15
       10.4.2.          Spatial Constraints ........................................................................................ 16
       10.4.3.          Naturalness................................................................................................... 17
       10.4.4.          Necessary Lead time..................................................................................... 18
11.         Impacts of Flooding ..................................................................................................... 18
     11.1.        Life Risk............................................................................................................... 19
     11.2.        Economic disruption ............................................................................................. 19
     11.3.        Household losses................................................................................................. 19
     11.4.        Community Impacts.............................................................................................. 19
     11.5.        Environmental impacts ......................................................................................... 20
     11.6.        Impacts of FRM as usual ...................................................................................... 20
12.         Federal Investment ..................................................................................................... 21
13.         Missed Opportunities................................................................................................... 22
14.         Recommendations ...................................................................................................... 23
15.         Conclusion.................................................................................................................. 28

Metro Houston
Regional Watershed Assessment                                         iii                                              Table of Contents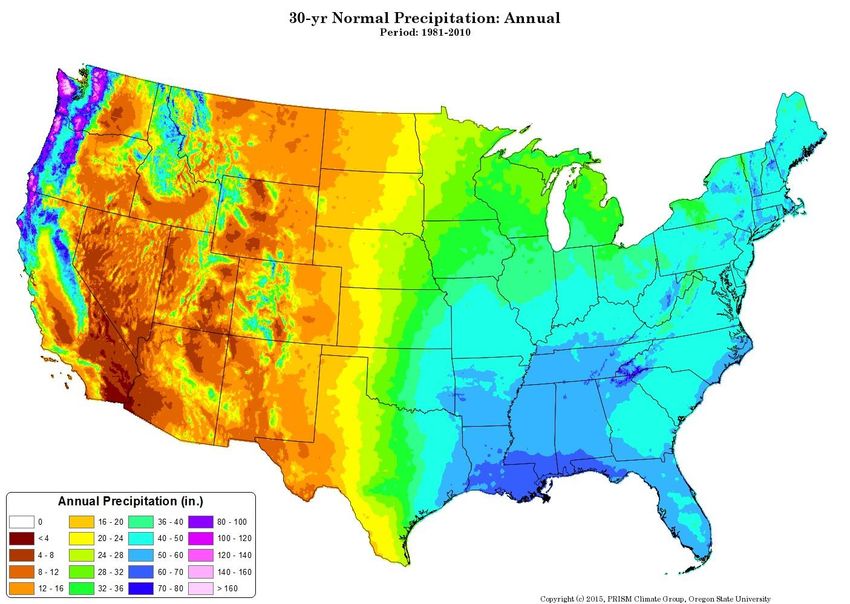
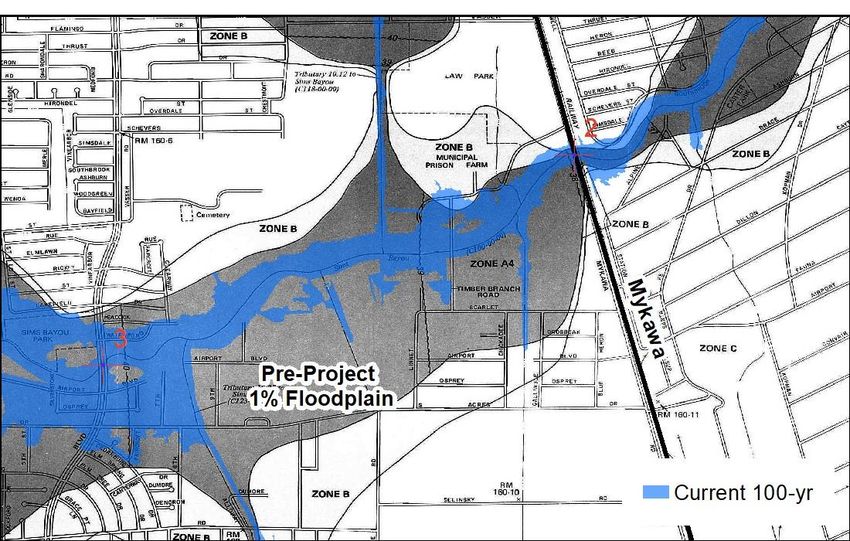
LIST OF FIGURES
Figure 1 - Watershed Assessment process and milestones ...................................................... 2
Figure 2 - Timeline of major weather events, regulatory or authority changes, and infrastructure
projects ................................................................................................................................... 6
Figure 3 – Counties adjacent to Metropolitan Houston Region .................................................. 8
Figure 4 – Watersheds within Harris County............................................................................. 9
Figure 5 - Observed water-surface elevation during the period April 17-25, 2016 on Cypress
Creek at Huffmeister Road (HCFCD Gage #1170) ................................................................. 18
Figure 6 - Flood zones from the National Flood Hazard Layer (NFHL) and City of Houston 311
complaints for flooding during the period October 2018-October 2019 .................................... 19
Figure 7 - Observed data for the period September 9-17, 2008 in Galveston Bay at the NOAA
Eagle Point gage (#8771013) ................................................................................................ 20
Figure 8 - Floodfactor.com scores on the west of downtown Houston (scores with minimal risk
are omitted). The current floodplain extents are overlaid. The methodology and risk matrix for
the flood score designation are available on the f loodfactor.com website. ............................... 21
Figure 9 - Observed and modeled water-surface elevations in and around Galveston Bay for
Hurricane Harvey (after Valle-Levinson et al., 2020) ............................................................... 23
Figure 10 - General topography of Metro Houston area .......................................................... 24
Figure 11 - 30-yr normal annual precipitation for continental US (PRISM) ............................... 24
Figure 12 - Atlas 14 rainfall for (A) the 24-hr 100-yr event throughout the continental US where
NOAA Atlas 14 data is available and (2) 24-hr rainfall depths as a function of average return
period for specific locations.................................................................................................... 25
Figure 13 - RSLC curves for Galveston Pier 21 gage ............................................................. 26
Figure 14 - Conceptualization of water balance based on level of development (after Federal
Interagency Stream Restoration Working Group, 1998) .......................................................... 27
Figure 15 - Effects of detention on runoff when implemented with development ...................... 28
Figure 16 - Parcels with structures colored by year the structure was built .............................. 29
Figure 17 - Current (2015) land use (HGAC, 2019)................................................................. 30
Figure 18 - Projected (2045) land use (HGAC, 2019) ............................................................. 31
Figure 20 - Projected land use in 2045 of parcels designated as "Vacant Developable (includes
Farming)" in 2015 (HGAC, 2019) ........................................................................................... 32
Figure 21 - Current floodplain extents in the Buffalo Bayou watershed .................................... 34
Figure 22 - Sims Bayou floodplain extents near Mykawa Rd. prior to implementation of the Sims
Bayou Federal Project, and after project implementation (current extent) ................................ 35
Figure 23 - Floodplain information in the Clear Lake area with the inundation extent from the
NOAA SLOSH model for a Category 3 hurricane.................................................................... 36

Metro Houston
Regional Watershed Assessment                                         iv                                                    List of Figures
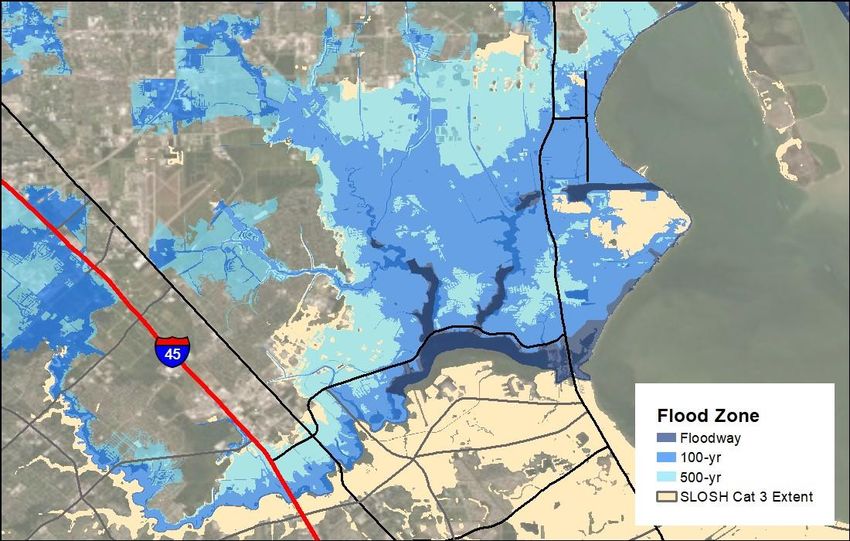
Figure 24 - Addicks and Barker Reservoirs and Buffalo Bayou, Texas Study Area Map ............ 3

Metro Houston
Regional Watershed Assessment                  v                                    List of Figures
APPENDICES:
A. Flood Risk Management Measures in Context
B. Climate Change Considerations in Flood Risk Management
C. Cultural Resources Considerations in Flood Risk Management

Metro Houston
Regional Watershed Assessment              vi                   List of Figures
Page Intentionally Left Blank

Metro Houston
Regional Watershed Assessment                vii                List of Figures
1. INTRODUCTION
The Houston Metropolitan Region experienced catastrophic flooding as a result of record -
breaking rainfall from Hurricane Harvey in August of 2017. Harvey made landfall on August 25th
about 30 miles northeast of Corpus Christi near the communities of Rockport and Fult on. The
Category 4 hurricane caused extensive damage as it moved north toward San Antonio and then
veered sharply east towards Houston and Louisiana. After stalling, Harvey dropped record
rainfall volumes in southeast Texas causing widespread flooding in the region.
The U.S. Army Corps of Engineers (USACE) is completing a Watershed Assessment
(Assessment) with specific focus on flood risk management (FRM) efforts within the
Metropolitan Houston Region. This draft assessment documents initial analyses conduc ted by
the project delivery team (PDT) and presents preliminary conclusions and recommendations to
achieve greater risk reduction and resiliency through agency coordination and strategic actions.
The final assessment will incorporate public, agency and technical comment to provide final
recommendations.

1.1. NON-FEDERAL SPONSOR
The Assessment is a collaborative effort between the USACE and Harris County Flood Control
District (HCFCD), as the non-federal sponsor (NFS). HCFCD is a special purpose district
created by the Texas Legislature in 1937 and governed by Harris County Commissioners Court.
HCFCD is described in greater detail in Section 8.2.
Primary content preparation is undertaken by the USACE and coordinated with HCFCD for
consistency and accuracy. The Assessment reflects the HCFCD’s ongoing planning efforts and
leverages, as appropriate, state agencies’ planning and investigation capabilities to ensure the
assessment is a broad analysis of current FRM resources. The NFS has created hydrologic and
hydraulic (H&H) models to support their efforts to assess and address flood risk in their
jurisdiction. These models are currently being updated through the MAAPnext program. The
MAAPnext program will update the existing hydrologic methodology to use a basin development
factor (BDF) and to use both one-dimensional and two-dimensional hydraulic models to better
resolve complicated hydraulic conditions. The updates will also include updated rainfall depths,
and the latest topographic data. MAAPnext will improve model accuracy and would render any
major modeling effort in this project duplicative. The existing models are available for use but
would provide information that will be outdated and inaccurate once the MAAPnext program is
completed. available for use but would provide information that will be outdated and inaccurate
once the MAAPnext program is completed.

1.2. PURPOSE
Section 729 of the Water Resources Development Act (WRDA) of 1986 (Public Law 99 -662), as
amended, allows the USACE to assess the water resources needs of entire r iver basins and
watersheds of the United States, in consultation with appropriate federal, state and local
agencies and stakeholders:
“The Secretary may assess the water resources needs of river basins and watersheds of the
United States, including needs relating to ecosystem protection and restoration; flood damage

Metro Houston
Regional Watershed Assessment                  1                                      Main Report
reduction; navigation and ports; watershed protection; water supply; and drought
preparedness.”
The focus of this Assessment was restricted to FRM because of the funding source and the
multiple regional investments in FRM improvements underway in response to Hurricane Harvey.
The Assessment considered the allocative and technical efficiency of improvements,
investments, and programs to reduce risk from flooding within the region. Broader objectives
such as environmental impacts, habitat, water quality, access and socioeconomic
considerations were evaluated where appropriate in FRM decision making and policy
considerations. The Vertical Team also specifically named this effort a watershed assessmen t,
rather than a watershed study.
The purpose of a watershed study is to develop a meaningful report to inform multiple
audiences and decision makers at all levels of government, local, state, federal, USACE,
Assistant Secretary of the Army, Civil Works (ASA/CW) and Congress. This Assessment
identifies the problems, opportunities, goals and constraints facing agencies with FRM
responsibility in the region and to develop a strategic roadmap acknowledging risk and
uncertainty and identifies recommended phases of implementation for greatest success to
inform future investment decisions by multiple agencies.

2. WATERSHED PLANNING GUIDANCE
The USACE guidance for watershed planning is Planning Bulletin No. PB 2019 -01 and
Engineering Circular 1105-2-411. Figure 1 presents the typical Watershed Study process.
Watershed studies are not project implementation documents. The level of detail is adequate for
making watershed-level resource assessments and recommendations. If specific projects are
identified for potential implementation under existing USACE authorities, separate feasibility
studies would be required to conduct detailed engineering and National Environmental Policy
Act (NEPA) documentation.

Figure 1 - Watershed Assessment process and milestones

Metro Houston
Regional Watershed Assessment                  2                                     Main Report
2.1. WATERSHED PLANNING APPROACH
This Assessment presents findings and recommendations for future efforts, including potential
future projects and studies in which the USACE could partner with the State of Texas, City of
Houston, HCFCD, partner agencies, or other non-federal entities.
The assessment developed the findings and recommendations following an inventory of current
conditions of land and water resources in the watershed. Essential steps included:
    •   Identify problems and opportunities within the watershed through continued stakeholder
        engagement and agency collaboration
    •   Inventory and forecast existing conditions related to identified water resource issues
    •   Evaluate and compare alternative approaches to address the problems and
        opportunities; and
    •   Select strategies and/or broad level plans for recommendation, based on the shared
        vision of the sponsor and project stakeholders which may address water resource issues
        in the basin.
The Assessment process complied with Planning Bulletin 2019-01 within the narrowed focus of
FRM. The PDT conducted an inventory of current activities and involved agencies, authorities,
jurisdictions and available tools and technologies to provide FRM in the region. The PDT
identified successes and missed opportunities or limitations to implementation of cost effective
FRM interventions across the region.
A stakeholder group was convened to support problem identification and to develop a Shared
Vision Statement to guide the development of objectives for the watershed. Recommendations
were developed for phased actions to overcome institutional barriers and solve technical
problems. A decision framework was developed to assess the potential recommendations and
identify priority actions that warrant federal participation and are appropriate for multi-agency
action.
The inventory ongoing efforts considered several prior reports and recommendations for FRM in
the region, and they have been incorporated into the recommendations.

        2.1.1.         PLANNING GOALS:
    •   Reduce the risk to public safety from flooding in the watershed
    •   Communicate risk to community members, elected and government leaders, business,
        and industry
    •   Reduce the risk of damages from flooding to residential, agricultural,
        commercial/industrial areas, utilities, and to roads and other critical infrastructure
    •   Characterize the generational community losses from persistent flooding, both in terms
        of wealth and cultural resources
    •   Maximize the effectiveness of FRM investments through efficient application of
        modeling, measurements and coordination

Metro Houston
Regional Watershed Assessment                     3                                        Main Report
• Broaden the recognition FRM measures and their appropriate application – the scale of
vulnerability will not be addressed without consideration of tradeoffs of space, funds,
aesthetics, environmental flows, and access.
The Assessment investigated an integrated approach to evaluate FRM efforts considering
allocative decisions and priorities, and the related impacts and tradeoffs, that may warrant
further analysis in the pursuit of engineered FRM solutions. The specific goal of th is
Assessment is to support the development of a broad management plan that will:
• Incorporate stakeholder input and involvement
• Assess existing watershed characteristics and conditions
• Identify watershed issues and concerns
• Develop, evaluate, and prioritize actions that could advance watershed goals and
objectives
• Identify potential “spin-off” and “off-shoot” projects that may fall under appropriate
Federal, State, and/or local authorities, and
• Identify potential regionally- or locally funded projects.
3. PROBLEMS, OBJECTIVES AND CONSTRAINTS
Flooding is a recurring challenge in Metropolitan Houston and has damaged or impacted billions
of dollars of private property and businesses, as well as public and critical infrastructure such as
roadways and hospitals. The Assessment considered the problems, objectives and constraints
for FRM efforts in the region to inform potential recommendations. Figure 2 presents a timeline
of past flood events and corresponding interventions in the region. The flood events are
represented as purple rectangles, regulatory responses are shown in yellow, and large
infrastructure projects are shown in green. Greater detail on the specific FRM interventions is
provided in Section 8 where specific agency efforts are described.
3.1. PROBLEMS
The Houston area is vulnerable to rainfall-related flooding and coastal surge flooding associated
with the landfall of tropical storms or hurricanes. This Assessment will focus on rainfall-related
flooding, with some consideration of the intersection with sea level change and climate change
impacts.
The primary problems are summarized below.
• Infrastructure upgrade needs exceed available agency resources
• Frequent flooding impacts communities with limited resources to rebuild, restart,
repurpose and drives loss of green space in the pursuit of solutions
• Habitat is lost as a result of new development
Metro Houston
Regional Watershed Assessment 4 Main Report• The adjacent or intertwined authorities of several agencies, in combination with the
economic incentive to minimize current expenditures for current developments create a
patchwork of regulations and therefore system quality
3.2. OBJECTIVES AND CONSTRAINTS
The goals and objectives for the Assessment recognize that local agencies are familiar with
flooding issues, and have a good understanding of impacts, and structural interventions. The
goal is to address flood solutions as part of a larger effort to be cost effective, to jointly consider
impacts, opportunities to reduce risk and the impacts on the larger economy and community.
Planning objectives include:
1. Supporting community resilience and recovery.
2. Reducing impacts to families, transit, government budgets, business investment, and
future resource availability for community needs
3. Increasing efficiency of FRM expenditures across agencies and waterways in the region
4. Increasing awareness of the scale of flood vulnerability and the necessary tradeoffs to
achieve risk reduction on an impactful scale.
Planning constraints include:
1. The built environment impedes some structural solutions
2. Physical conditions require different solutions where the water collects and flows, so
multiple interventions are required across the region
3. The scale of flood risk requires resources to retrofit or address, and funds are not
unlimited
4. Data analysis tool updates will not be completed until after the completion deadline for
the Assessment.
Metro Houston
Regional Watershed Assessment 5 Main ReportFigure 2 - Timeline of major weather events, regulatory or authority changes, and infrastructure
projects
3.3. REPORT ORGANIZATION
The Main Report characterizes the flood vulnerability in the region, reviews the current FRM
efforts underway, presents broad findings and opportunities and concludes with recommended
future actions to achieve greater efficiency in the implementation of flood risk reduction.
Appendices provide greater detail of the available tools and authorities to provide additional
context for the findings and recommendations within the Main Report.
Appendix A: FRM Measures in Context
Reviews typical FRM features and their relative effectiveness across multip le flood
events and community types,
Appendix B: Climate Change Considerations in FRM
Reviews the necessary considerations of climate change in the design and application of
FRM solutions in the region.
Appendix C: Cultural Resource Considerations in FRM
Reviews the potential impacts to cultural resources from flood events in the region, the
typical process to assess those impacts as structural solutions have been selected as
the recommended plan and assess alternative approaches to cultural resource benef its
and impact tradeoffs.
4. SHARED VISION MILESTONE AND COORDINATION AND PRIORITIES/ROLES
Metro Houston
Regional Watershed Assessment 6 Main ReportA Shared Vision Milestone was an initial decision point where the PDT to communicate the
regional priorities, areas of interest and a future vision for efficient water and related resources
within watershed to the USACE Vertical Team. The Shared Vision Statement (SVS) was
developed collaboratively with the non-federal Sponsor, stakeholders, and Galveston District
leadership. It also provided a preliminary opportunity to identify issues and opportunities, goals,
objectives, and constraints that were confirmed through stakeholder outreach including two in
person workshops.
While most watershed studies consider a broad range of water resource problems in the region,
the Metro Houston Regional Watershed Assessment was focused on FRM efforts. This limited
focus, and the severity of the flood risk in the region generated a SVS that is more specific than
a typical SVS. The Metro Houston SVS stipulated more about “how” we get to the ideal future
condition, not just an expression of what the ideal condition is. The stakeholders also felt that
specific terms should be defined in a glossary for the SVS, to ensure that the values and intent
of the statement was no misinterpreted.
The SVS for this assessment is more specific than a typical SVS, it stipulates more about “how”
we get to their ideal future condition, not just what the ideal condition is.
Growth and infrastructure investments in the region are equitable, risk informed,
coordinated, and determined through evidence-based, forward looking data and
modeling and a broad consideration of regional resources and community
values. Design objectives incorporate livability, resiliency, quality of life and
consider flood risk and mitigation needs for the life of the development, rather
than standards based on historic risk.
Shared Vision Statement Glossary:
“Infrastructure” means features of the FRM system that detain, convey, contain, transport or
receive water, including undeveloped floodplains.
“Resources” include economic resources such as agency and household costs and assets;
environmental and social resources include natural habitats, aesthetics, recreation, public
access, habitats.
“Forward looking data” means output from planning tools or engineering models that reflect
uncertainty and anticipate possible future events, conditions, etc.
“Equitable” means dealing fairly and equally with all concerned.
“Quality of Life” means the general well-being of individuals and societies, considering physical
health, family, education, employment, wealth, safety, and the environment.
5. STUDY AREA
The study area was identified as the Metropolitan Houston region, which contains dense urban
areas, large suburban communities, and some relatively rural areas that are anticipated to
transition to residential communities. Harris County has been delineated into 22 watersheds by
HCFCD. Portions of these watersheds encompass Metropolitan Houston and adjacent
communities within Montgomery, Waller, Fort Bend, Brazoria, Galveston, and Chambers
Counties, as shown in Figures 3 and 4.
Metro Houston
Regional Watershed Assessment 7 Main ReportTwo broad flood hazards are reflected in floodplain maps within the Metropolitan Houston area: rainfall runoff and storm surge. The threat of rising sea levels and storm surge should not be minimized; however, the focus of this assessment is on the rainfall runoff flood hazard. Flooding has been a persistent issue in the region. The combination of the physical conditions in the area and high annual rainfall create frequent and severe flood events. The flood vulnerability in the region increases as climate change brings more intense precipitation, and economic conditions draw increasing population and construction of new communities to house them. Figure 3 – Counties adjacent to Metropolitan Houston Region Metro Houston Regional Watershed Assessment 8 Main Report
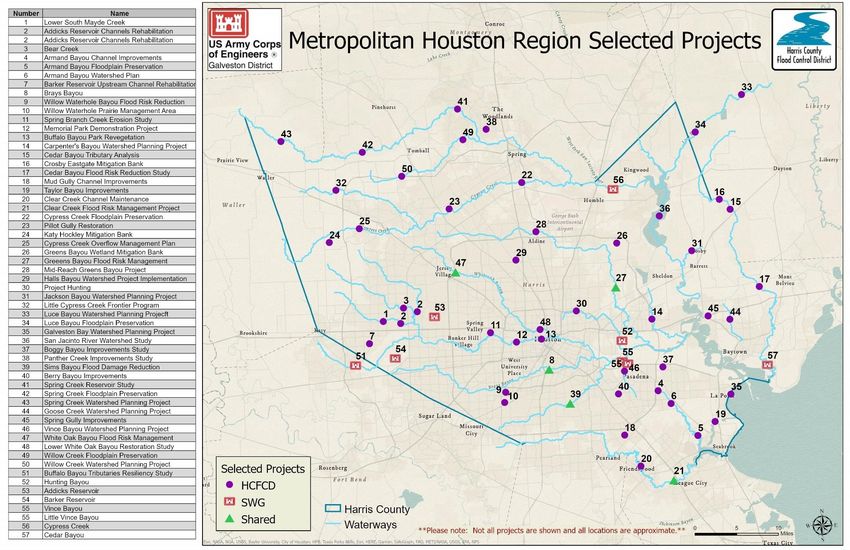
Figure 4 – Watersheds within Harris County

5.1. SUB-WATERSHEDS IN THE REGION
The region includes multiple waterbodies, large and small that collect stormwater and transports
it downstream into Galveston Bay and the Gulf of Mexico. These Harris County watersheds,
with the exception of the San Jacinto River and Galveston Bay, are not large, regional drainage
systems. They are relatively small geographic areas and the water in these creeks and bayous
can rise and fall relatively quickly, particularly in the developed core of Harris County and the
city of Houston.
Each sub watershed varies in the primary land use, density of development and flood
vulnerability. The most developed watersheds are highlighted here, as well as unique
watersheds that factor into key recommendations of the assessment.
The Greater Houston Flood Mitigation Consortium (GHFMC), which is discussed in more detail
in Section 9.1, produced a report in 2018 titled “Greater Houston Strategies for Flood Mitigation”
(2018 GHFMC document) which focused on strategies for flood mitigation. The summaries of
watersheds below include information from HCFCD and the 2018 GHFMC document.

       5.1.1.          ADDICKS RESERVOIR
The Addicks Reservoir watershed is located in western Harris County with a small portion
crossing into eastern Waller County. Rainfall within the 138 square miles of the Addicks
Reservoir watershed drains to the watershed’s primary waterway, Langham Creek. The Addicks
Reservoir watershed occasionally receives a significant amount of natural stormwater overflow

Metro Houston
Regional Watershed Assessment                   9                                      Main Report
from the Cypress Creek watershed during heavy rainfall events. Stormwater runoff from this
watershed drains through the Addicks Reservoir and eventually into Buffalo Bayou. Rural and
agricultural uses have historically dominated the upstream regions of the watershed, but
residential and commercial developments are rapidly growing. There are 159 miles of open
waterways in the Addicks Reservoir watershed, including Langham Creek and its major
tributaries, such as South Mayde Creek, Bear Creek and Horsepen Creek. Based on the 2010
U.S. Census, the estimated population of the Harris County portion of the Addicks Reservoir
watershed is 295,694. Together with Barker Reservoir, Addicks Reservoir was built in the 1940s
as part of a federal project to reduce flooding risks along Buffalo Bayou, which runs west to east
through downtown Houston. USACE completed construction of Addicks Dam and the outlet
facility in 1948. USACE owns, operates, and maintains the reservoir, including leases or permits
for some compatible recreational uses within the basin. Operation of the outlet facilities controls
discharges from the reservoir into Langham Creek, then into Buffalo Bayou. Environmentally
sensitive areas and a wide range of wildlife habitats exist within the reservoir boundaries and
along the upper tributary reaches that extend into the Katy Prairie.
5.1.2.ARMAND BAYOU
Armand Bayou flows southward into Clear Lake, draining 60-square-miles, including portions of
Pasadena, Deer Park and Houston and as of 2018 had a population of approximately 127,000.
It has sizable, flat floodplains that make it susceptible to flooding as well as storm surge. Much
of the watershed is developed, but considerable open space and natural habitat has been
preserved toward the south end of the basin, most notably the 2,000 -acre Armand Bayou Park
and Nature Center.
5.1.3. BARKER RESERVOIR
The Barker Reservoir watershed encompasses the area that drains into Barker Reservoir. This
reservoir, together with Addicks Reservoir, was created as part of a federal project to control
flooding on Buffalo Bayou and protect downtown Houston. USACE completed construction of
the Barker Dam and outlet facility in 1945 and continues to own, operate, and maintain the dam
and outlet facilities. The watershed is located in west Harris County and extends into Fort Bend
and Waller counties, encompassing portions of the cities of Houston and Katy. The Barker
Reservoir watershed covers approximately 126 square miles and includes two primary streams:
Mason Creek and Upper Buffalo Bayou. There are about 69 miles of open streams within the
watershed, of which approximately 51 miles are within Harris County. The estimated population
of the Barker Reservoir watershed is 169,000. The threat of flooding from high volumes of
stormwater draining into the reservoir from its natural watershed is a concern. The need to
control release rates from the reservoir during potential flood events causes concern for
developments along the fringes of the reservoir boundary and for major thoroughfares. These
concerns have prompted sub-regional planning on the major tributaries draining into the
reservoir.
5.1.4. BRAYS BAYOU
The Brays Bayou watershed is located in southwest Harris County and portions of Ft. Bend
County and drains parts of the cities of Houston, Missouri City, Stafford, Bellaire, West
University Place, Southside Place, and Meadows Place. The bayou flows eastwar d from Fort
Bend County to its confluence with the Houston Ship Channel. This heavily urbanized
Metro Houston
Regional Watershed Assessment 10 Main Reportwatershed covers approximately 127 square miles and includes three primary streams: Brays
Bayou, Keegans Bayou, and Willow Waterhole Bayou. There are about 121 miles of open
streams within the watershed, including the primary streams and tributary channels.
Comprehensive planning for flood protection in the watershed and construction of flood damage
reduction projects on and along Brays Bayou has occurred in the past and continues today.
Severe flooding in the watershed has occurred on average at least once every decade.
Because a majority of the urbanization occurred prior to the advent of floodplain regulations and
prior to delineation of the 1% (100-year) floodplain, thousands of structures are now known to
be in the currently mapped 1% (100-year) floodplain. Brays Bayou has had major flooding
problems, and more than 23,000 homes were flooded in Hurricane Harvey. Channelization
projects along Brays Bayou started in the 1950s and have continued since.
The 2018 GHFMC document describes Brays Bayou as one of Houston’s most flood prone
watersheds, which drains approximately 130 square miles of southwest Houston via 124 miles
of natural and man-made channels. As of 2018, it was home to 800,000 people and is highly
urbanized. Major tributaries include Keegans Bayou and Willow Waterhole Bayou. Brays Bayou
was originally a natural, meandering waterway, but as urbanization extended upstream of Kirby
Drive in the 1950s to 1960s, much of Brays Bayou was lined with concrete to address flooding
as part of a joint federal-HCFCD project. After completion of this first federal project, urban
growth continued, and, by the 1980s, over 95 percent of the watershed was developed. During
the late 1970s through 1990s, flooding caused damage to more than 1,000 homes during
Hurricane Alicia in 1983
5.1.5. BUFFALO BAYOU
The Buffalo Bayou watershed is primarily located in west-central Harris County with a small
portion crossing into Fort Bend County. Rainfall within the 102 square miles of the Buffalo
Bayou watershed drains to the watershed’s primary waterway, Buffalo Bayou. Buffalo Bayou
travels through heavily wooded residential areas and much of the bayou remains in a natural
state. Near downtown Houston, White Oak Bayou flows into Buffalo Bayou. Just east of
downtown Houston near the Turning Basin, Buffalo Bayou becomes the Houston Ship Channel.
There are 106 miles of open waterways in the Buffalo Bayou watershed, including Buffalo
Bayou and its major tributaries, such as Rummel Creek, Soldiers Creek, Spring Branch, and
Turkey Creek. The 2010 U.S. Census estimated the population of the Harris County portion of
the Buffalo Bayou watershed to be 444,602.
5.1.6.CARPENTERS BAYOU
The Carpenters Bayou watershed is located in east Harris County. Carpenters Bayou flows
southward from its headwaters just west of Lake Houston into the Houston Ship Channel. The
bayou parallels the East Sam Houston Tollway and passes through Channelview. The
watershed covers approximately 25 square miles, with Carpenters Bayou being the single
primary stream. There are about 44 miles of open streams within the watershed, including the
primary stream and tributary channels. The 2010 U.S. Census estimated the population of the
Carpenters Bayou watershed to be 57,249.
Under existing development conditions, the floodplain is not very extensive along Carpenters
Bayou. The lower end of Carpenters Bayou is tidally influenced and therefore vulnerable to
storm surge flooding.
Metro Houston
Regional Watershed Assessment 11 Main Report5.1.7. CEDAR BAYOU
The Cedar Bayou watershed is the easternmost watershed in Harris County, and Cedar Bayou
generally serves as the border for Harris County with Chambers and Liberty counties. The cities
of Baytown and Mont Belvieu are located within the watershed, which encomp asses nearly 200
square miles. Cedar Bayou flows in a southward direction from its headwaters in Liberty County
to its mouth at Galveston Bay. There are about 128 miles of open streams within the watershed,
including the primary stream and tributary channels. The main stem of Cedar Bayou is
approximately 40 stream miles in length and directly impacts Harris County, Chambers County,
Liberty County, and the City of Baytown. The 2010 Census data estimated the population within
the watershed to be just over 59,000. Although a large floodplain exists in the upper and middle
reaches of Cedar Bayou, this portion of the watershed is sparsely developed. Therefore, the
flooding is more threatening to roads and agriculture than structures like houses and
businesses. Flooding along the tributaries in the urbanized portions of the watershed is a
concern.
5.1.8. CLEAR CREEK
The Clear Creek watershed is located in southern Harris County. The watershed encompasses
portions of Harris, Galveston, Brazoria, and Fort Bend counties; 16 cities including Houston,
Brookside Village, Pearland, Friendswood, League City, Pasadena, the Clear Lake Area
communities, and four drainage/flood control districts. Clear Creek flows from west to east
through Clear Lake and into Galveston Bay. Armand Bayou is the largest tributary to Clear
Creek, and its drainage area is considered a separate watershed. The Clear Creek watershed
covers approximately 197 square miles and includes two primary streams: Clear Creek and
Turkey Creek. There are about 154 miles of open streams within the watershed, including the
primary streams and tributary channels. Based on the 2010 U.S. Census, the estimated
population of the Harris County portion of the Clear Creek watershed was 164,172. Flooding
occurs frequently along various reaches of the main channel and its tributaries. Storm surge has
also caused flooding within the watershed and has the potential to extend upstream to I -45.
The lower parts of the watershed, which surround NASA’s Johnson Space Center, were
developed in the 1960s through 1980s. The upper end of the watershed was largely agricultural
until the 2000s and has been rapidly developed since. However, significant undeveloped land
remains. The lower portion of the channel, from the Galveston/Brazoria county lin e to Clear
Lake, remains mostly natural.
5.1.9. CYPRESS CREEK
The Cypress Creek watershed is located in northwest Harris County and extends into Waller
County. Rainfall within the 267 square miles of the Cypress Creek watershed drains to the
watershed’s primary waterway, Cypress Creek. There are 250 miles of open waterways in the
Cypress Creek watershed, including Cypress Creek and its major tributaries. By size, the
watershed is one of the largest in Harris County. By population, it is the fifth largest of the
county’s 22 main watersheds, with an estimated population of approximately 347,000 (2010
U.S. Census). Like much of Harris County, the Cypress Creek watershed is flood prone. The
downstream or eastern portion of the watershed was developed prior to our cur rent
understanding of floodplains and restrictions on building in the floodplains. The upstream or
Metro Houston
Regional Watershed Assessment 12 Main Reportwestern portion of the floodplain was developed later, with more robust development regulations
requiring stormwater detention to prevent downstream flooding impacts.
5.1.10. GREENS BAYOU
The Greens Bayou watershed is located in north Harris County and encompasses portions of
the cities of Houston and Humble. The upper reach of Greens Bayou flows in an eastward
direction and the lower reach flows southward into the Houston Ship Channel. The watershed
covers about 212 square miles and includes four primary streams: Greens Bayou, Halls Bayou,
Garners Bayou, and Reinhardt Bayou. There are about 308 miles of open streams, including the
primary streams and tributary channels. Based on the 2010 U.S. Census, the estimated
population of the Greens Bayou watershed is 528,720. Flooding of homes and businesses
along Greens Bayou and its tributaries has occurred numerous times in the last two decades,
with devastating flood levels throughout the watershed brought on by Tropical Storm Allison in
2001 and Hurricane Harvey in 2017. Significant floodplains and high -density development have
combined to cause high damages during frequent flood events. Additionally, storm surges can
influence flooding levels along the lower 10 miles of the watershed.
5.1.11. HALLS BAYOU
Halls Bayou is a tributary of Greens Bayou in north central Harris County. Flooding along Halls
Bayou is a persistent hazard for area residents, businesses, and property owners, with flooding
documented 14 times since 1989. Tropical Storm Allison in 2001 is the storm of record for the
watershed, with more than 13,000 homes flooded. During Hurricane Harvey in 2017, an
estimated 11,830 homes flooded along Halls Bayou. Reducing flooding risks in the Halls Bayou
watershed is a priority for HCFCD. The Bond Program approved by voters in 2018 includes
more than $110 million for the Halls Bayou watershed, which has the potential to leverage more
than $346 million in total project value, depending on federal funding approval.
5.1.12. HUNTING BAYOU
The Hunting Bayou watershed is located in central Harris County within the city limits of
Houston, Galena Park, and Jacinto City. Rainfall within the 31 square miles of the watershed
drains to the primary waterway, Hunting Bayou. The bayou flows southeast from its headwaters
just east of the Hardy Toll Road to its confluence with the Houston Ship Channel near the City
of Galena Park. There are 45 miles of open waterways in the watershed, including Hunting
Bayou and its major tributaries, such as Turkey Run Gully and Schramm Gully. The 2010 U.S.
Census estimated the population of the Hunting Bayou watershed to be 75,908. The watershed
is highly urbanized with a mixture of residential, commercial, and industrial developments. The
largest open area is the City of Houston’s Herman Brown Park, which covers approximately 550
acres in the Hunting Bayou watershed and provides recreational amenities and environmental
habitat.
Hunting Bayou currently has a substantial f loodplain in its upstream end, upstream of Liberty
Road. This section is comprised primarily of single-family homes located in Kashmere Gardens
and Trinity Gardens on either side of Loop 610 North and east of Interstate 69 North. There is
more limited flooding along the immediate channel downstream of Liberty Road.
Metro Houston
Regional Watershed Assessment 13 Main Report5.1.13. JACKSON BAYOU
The Jackson Bayou watershed is located in east Harris County, just east of Lake Houston, and
serves the Crosby and Newport areas. The watershed covers about 25 square miles and flo ws
into the San Jacinto River below Lake Houston via Jackson Bayou. There are about 36 miles of
open streams within the watershed, including the primary stream and tributary channels. Gum
Gully is the largest tributary in the watershed and drains about 17 square miles, which is close
to 70% of the watershed. The 2010 U.S. Census estimated the population of the Jackson Bayou
watershed to be 14,014.
Although erosion problems exist along most of the length of the Jackson Bayou and its
tributaries, little or no regional planning has been done for Jackson Bayou due to the low
incidence of structural flooding. Jackson Bayou is relatively deep with steep side slopes and the
channel slope is relatively steep (for Harris County) which promotes rapid drainage of the
watershed. Some flooding of a few structures has occurred in the last twenty years, although
the mapped floodplain typically covers farmland and areas with scattered development. The
floodplain in the lower portion of the watershed results from the San Jacinto River.
5.1.14. LITTLE CYPRESS CREEK
Little Cypress Creek is usually considered the "22nd Watershed" within Harris County, although
it is actually a sub-watershed of the major Cypress Creek watershed. The Little Cypress Creek
watershed encompasses a mostly rural, undeveloped area of northwest Harris County. The
2010 US Census estimated the population of the Little Cypress Creek watershed to be 28,879.
Little Cypress Creek is not always delineated separately on HCFCD maps. Little Cypress Creek
comprises more than 15% of the larger Cypress Creek watershed, with a drainage area of about
50 square miles.
5.1.15. SAN JACINTO RIVER
The San Jacinto River watershed is a very large watershed that originates well outside of Harris
County. The San Jacinto River flows through much of eastern Harris County and join s with the
Houston Ship Channel before flowing into Galveston Bay along the southeastern edge of the
county. The watershed (within Harris County) extends through the cities of Houston, Galena
Park, Pasadena, Deer Park, Baytown, Humble, La Porte, Morgans Point, Shoreacres, and
Seabrook. The channels within the watershed drain all or part of Harris, Montgomery, Waller,
Walker, Grimes, Liberty, and San Jacinto counties, for a total drainage area of approximately
4,500 square miles. In Harris County, the San Jacinto River watershed covers about 487 square
miles and includes seven primary streams: The San Jacinto River, the Houston Ship Channel,
Cotton Patch Bayou, East Fork San Jacinto River, Boggy Bayou, Patricks Bayou, and Panther
Creek. There are about 310 miles of open streams within the watershed, including the primary
streams and tributary channels. Based on the 2010 U.S. Census, the estimated population of
the Harris County portion of the San Jacinto River watershed is 197,570. The San Jacinto River
flows from its headwaters near Huntsville, through Lake Conroe and Lake Houston. Lake
Houston was developed as a water supply reservoir and therefore does not provide significant
storage during flood events. The Port of Houston Authority operates the Houston Shi p Channel,
which originates at the Turning Basin and follows the original alignment of Buffalo Bayou to the
San Jacinto River. The Ship Channel continues through the San Jacinto River and San Jacinto
Bay to Galveston Bay, which is the ultimate outfall for all drainage in Harris County. Structural
Metro Houston
Regional Watershed Assessment 14 Main Reportflooding has occurred in low-lying areas adjacent to the water bodies. However, water surface
elevations in the Houston Ship Channel, the San Jacinto River and Galveston Bay are not
affected by the flow from any single watershed. These waterways are tidally influenced and can
be affected by storm surge.
5.1.16. SAN JACINTO & GALVESTON BAY
The San Jacinto Galveston Bay watershed is located at the southeastern edge of Harris County.
The watershed primarily drains the area that includes La Porte, Morgans Point and portions of
Pasadena. However, Galveston Bay is the ultimate outfall for all drainage in Harris County. The
Galveston Bay watershed covers about 20 square miles and includes two primary streams:
Little Cedar Bayou and Pine Gully. There are about 24 miles of open streams within the
watershed, including the primary streams and tributary channels. The 2010 U.S. Census
estimated the population of the Harris County portion of the San Jacinto Galveston Bay
watershed to be 14,952. Structural flooding has occurred in low-lying areas adjacent to the
water bodies. However, water surface elevations in Galveston Bay are not affected by the flow
from the bayou system. Water Surface elevations in Galveston Bay are tidally influenced and
can be affected by storm surge. The watersheds that drain into the San Jacinto River have a
population of over 1.2 million, with development occurring throughout the river basin, particularly
in northern Harris County and Montgomery County.
5.1.17. SIMS BAYOU
The Sims Bayou watershed is located in southern Harris County. Most of the watershed is
within the City of Houston. However, the upper reach of the watershed drains the City of
Missouri City and the lower reach of the watershed drains the cities of South Houston and
Pasadena. The Sims Bayou watershed covers about 94 square miles and includes two primary
streams: Sims Bayou and Berry Bayou. There are about 121 miles of open streams within the
watershed, including the primary streams and tributary channels. Based on the 2010 U.S.
Census, the estimated population of the Harris County portion of the Sims Bayou watershed is
284,727. Structural flooding has occurred numerous times along Sims Bayou and its tributaries.
The majority of the structures that are flood prone were built prior to the existence of detailed
floodplain maps and prior to floodplain management regulations.
5.1.18. SPRING CREEK
The Spring Creek watershed is located across northern Harris County. Most of the watershed is
located outside of Harris County. It extends across the southern area of Montgomery County
and into Waller and Grimes counties. The watershed serves about half of the City of Tomball
and the Woodlands/I-45 area in southern Montgomery County. It covers about 284 square
miles, of which only about 60 square miles are within Harris County. Spring Creek, the
watershed's single primary stream, forms the northern boundary of Harris County, west of its
confluence with the West Fork San Jacinto River. There are about 111 miles of open streams
within the watershed, including the primary stream and tributary channels. The 2010 U.S.
Census estimated the population of the Harris County portion of the Spring Creek watershed to
be 39,349.
Spring Creek is basically natural and therefore characterized by limited conveyance capacity in
the channel and a larger natural floodplain. However, the lack of development in much of the
Metro Houston
Regional Watershed Assessment 15 Main ReportYou can also read