ENHANCING EARLY WARNING SYSTEM IN THE UPPER BEKASI WATERSHED THROUGH THE EMPLOYMENT OF HYDROMETEOROLOGICAL MODEL - Nizam Mawardi S2454033 MASTER ...
←
→
Page content transcription
If your browser does not render page correctly, please read the page content below
MASTER THESIS

ENHANCING EARLY WARNING
SYSTEM IN THE UPPER BEKASI
WATERSHED THROUGH THE
EMPLOYMENT OF
HYDROMETEOROLOGICAL MODEL
Nizam Mawardi
S2454033

MASTER OF ENVIRONMENTAL & ENERGY MANAGEMENT

Dr. Kris Lulofs
Dr. Gül Özerol
Prof. Chay Asdak

2020/2021
ABSTRACT

Hydrometeorological disasters often occur around the world, including floods due to
overflowing rivers. One of them is the flood in urban areas in the Upper Bekasi watershed,
West Java Province, Indonesia. The selected flood-prone area is located between two
tributaries, namely the Cileungsi river and the Cikeas river. Early warning systems were
established to reduce the risk of flooding. However, the flood incident due to heavy rain
that lasted for a long time on 1 January 2020 was classified as very severe and caused
significant damages. To improve preparedness, this study uses a new
hydrometeorological model, WRF-Hydro. This study aims to provide insight into the
existing early warning in the study area, analyze the response to actions taken by the
community and local disaster management agencies, and test WRF-Hydro's ability to
simulate torrential rain. This study uses an exploratory approach to describe the early
warning system that existed and an experimental approach to test the model's
capabilities. This study shows how WRF-Hydro can be optimized for use by competent
authorities to improve the flood early warning system.

 ii
ACKNOWLEDGMENTS

First and utmost, all praise is to Allah for the blessing to accomplish this thesis throughout
difficult situations. I would like to thank my supervisor Dr. Kris Lulofs for relentlessly
supporting and providing me with his knowledge and generosity throughout the
development of this thesis. I would also like to express my gratitude to my supervisor
committee, Dr. Gül Özerol and Prof. Chay Asdak, for constant guidance. I would like to
thank Beasiswa Pusbindiklatren Bappenas, BMKG, and MIL Unpad for giving me this
excellent opportunity to study at the University of Twente. I would also like to thank you,
MEEM students and staff, for the friendship and hospitality. Last but not least, I would
also like to thank my family, whom I love the most, for their unwavering support.

 iii
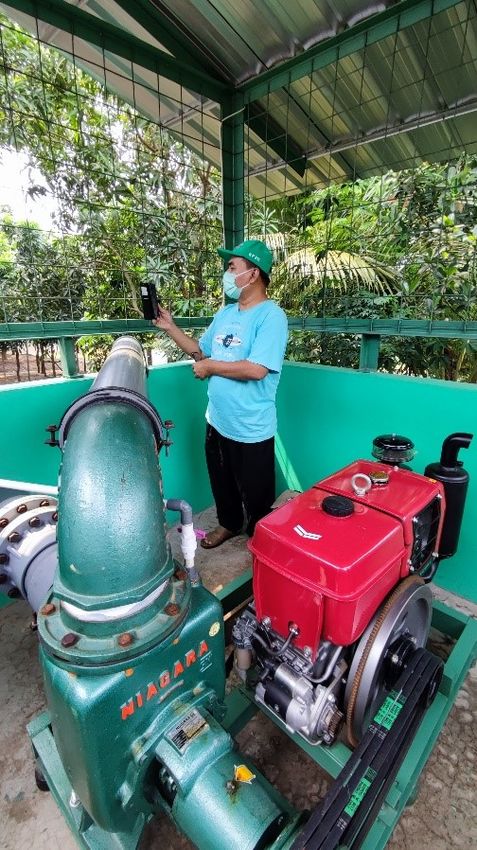
TABLE OF CONTENTS
ABSTRACT............................................................................................................................ ii
ACKNOWLEDGMENTS ........................................................................................................ iii
TABLE OF CONTENTS...........................................................................................................iv
LIST OF ABBREVIATIONS .....................................................................................................vi
LIST OF FIGURES .................................................................................................................vii
LIST OF TABLES .................................................................................................................. viii
CHAPTER I Introudction ...................................................................................................... 1
 1.1. Background .............................................................................................................. 1
 1.2. Problem Statement .................................................................................................. 4
 1.3. Research Objective .................................................................................................. 5
 1.4. Research Questions ................................................................................................. 5
 1.5. Thesis Outline........................................................................................................... 5
CHAPTER II Literature Review ............................................................................................. 6
 2.1. Extreme Rainfall ....................................................................................................... 6
 2.2. Urban Hydrometeorology ........................................................................................ 7
 2.3. The Elements of Early Warning and Flood Forecast ................................................ 8
 2.4. Early Warning Systems as Decision-making Tools ................................................. 10
 2.5. WRF and WRF-Hydro ............................................................................................. 10
 2.6. The Employment of WRF/WRF-Hydro ................................................................... 12
CHAPTER III Research Design ............................................................................................ 14
 3.1. Research Framework ............................................................................................. 14
 3.2. Research Strategy .................................................................................................. 16
 3.2.1. Running the Conventional WRF and WRF/WRF-Hydro .................................. 16
 3.2.2. Output Data Analysis and Verification ............................................................ 17
 3.2.3. Research Boundaries....................................................................................... 18
 3.2.4. Research Unit .................................................................................................. 18
 3.2.5. Selection of Research Unit .............................................................................. 18
 3.3. Data Collection ....................................................................................................... 19
 3.4. Data Analysis .......................................................................................................... 20
 3.5. Ethics Statement .................................................................................................... 21
CHAPTER IV Results and Discussion .................................................................................. 18
 4.1. Background Information about the Flood-Plain .................................................... 18

 iv
4.1.1. The Profiles of Cileungsi and Cikeas Watersheds ........................................... 18
 4.1.2. Administrative Areas between Watersheds ................................................... 20
 4.1.3. Flood Prone Areas ........................................................................................... 23
 4.2. Flood Risks and Costs ............................................................................................. 24
 4.3. Flood Preparedness and Response Actions ........................................................... 26
 4.3.1. Extreme Weather Early Warnings ................................................................... 26
 4.3.2. Flood Early Warnings ...................................................................................... 28
 4.3.3. Flood Response Actions .................................................................................. 33
 4.4. Meteorological Analysis ......................................................................................... 36
 4.5. Model Output Comparison .................................................................................... 40
 4.6. Best Use of WRF-Hydro .......................................................................................... 43
 4.7. Discussion............................................................................................................... 48
CHAPTER V Conclusions .................................................................................................... 51
 5.1. Answers to Research Questions ............................................................................ 51
 5.2. Directions for Future Research .............................................................................. 52
References ........................................................................................................................ 53
Appendices........................................................................................................................ 65
 Appendix A. Total Area and Demographics of Bogor Regency ..................................... 65
 Appendix B. Questionnaire ........................................................................................... 66
 Appendix C. Two Versions of Consent Form ................................................................. 69

 v
LIST OF ABBREVIATIONS
BMKG Indonesian Agency for Meteorology, Climatology, and Geophysics
BNPB Indonesian National Agency for Disaster Management
BPBD Regional Agency for Disaster Management
BBWSCC Centre for Ciliwung-Cisadane River Basin
GFS Global Forecasting System
GSMaP Global Satellite Mapping of Precipitation
GWP Global Water Partnership
IMC Indonesian Maritime Continent
KP2C Cileungsi-Cikeas River Care Community
NMHSs National Meteorological and Hydrological Services
NOAA National Oceanic and Atmospheric Administration
NWM National Water Model
NWS National Weather Service
PCC Pearson’s Correlation Coefficient
RMSE Root Mean Square Error
TRMM Tropical Rainfall Measuring Measure
WMO World Meteorological Organization
WRF Weather Research and Forecasting

 vi
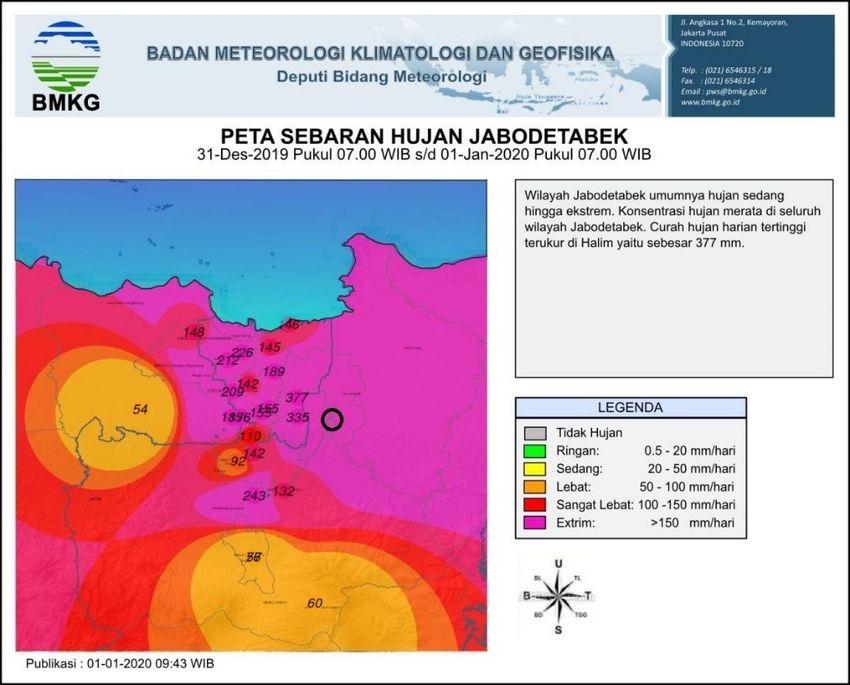
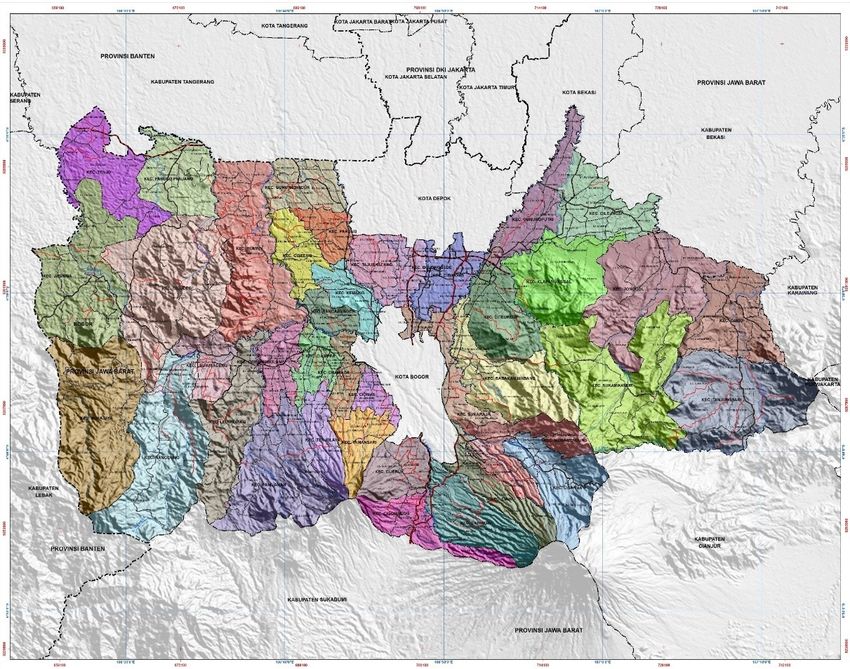
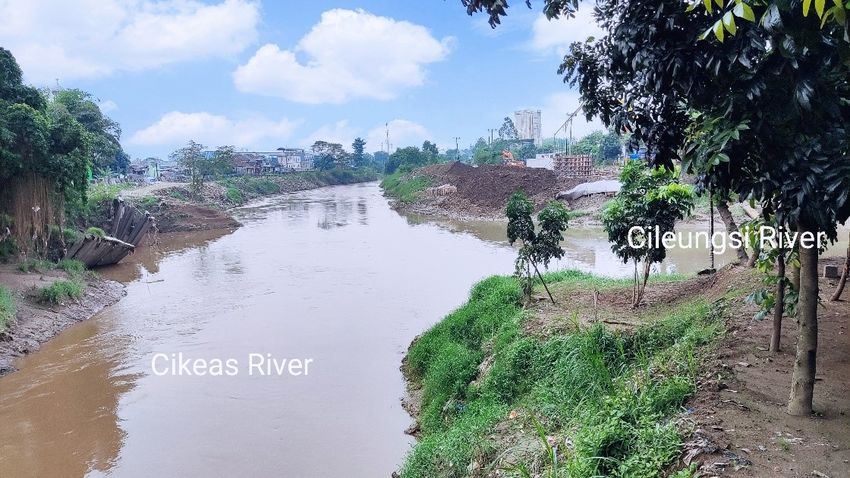
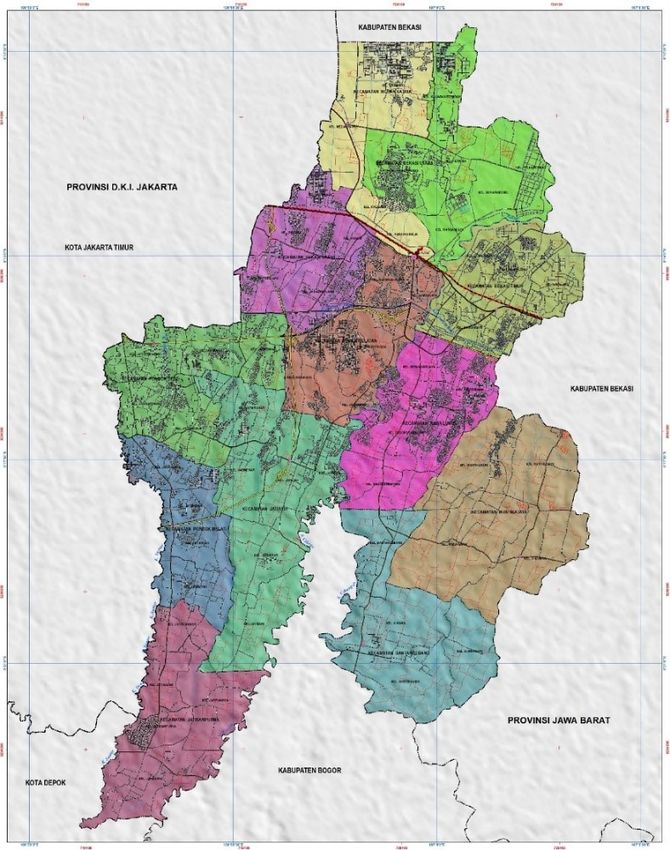
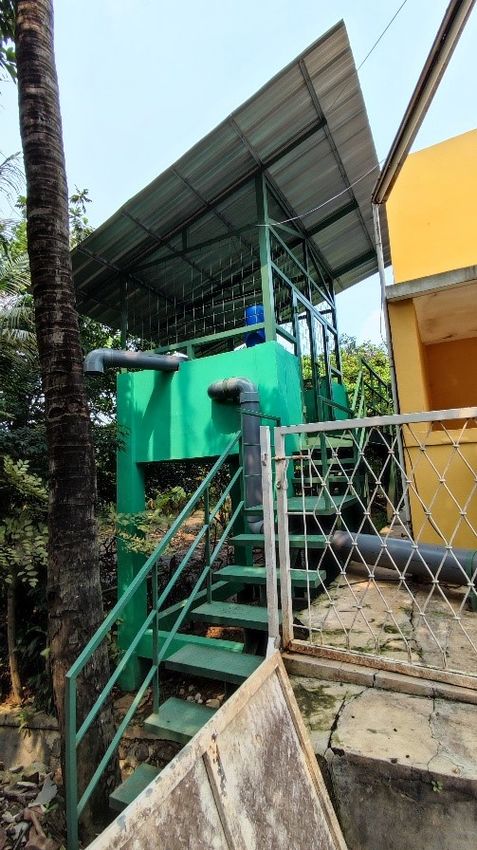
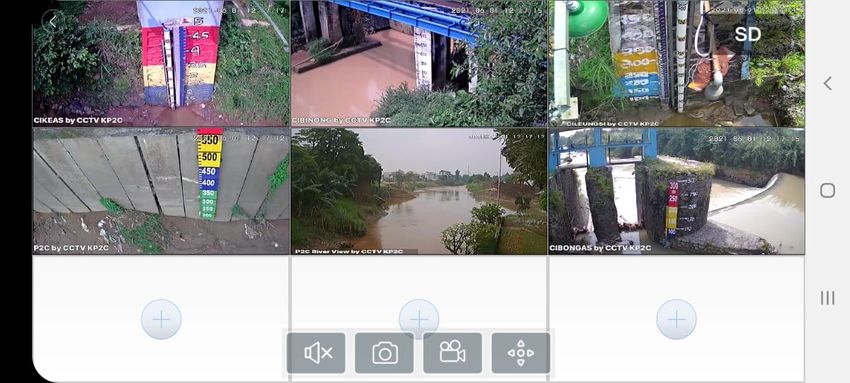
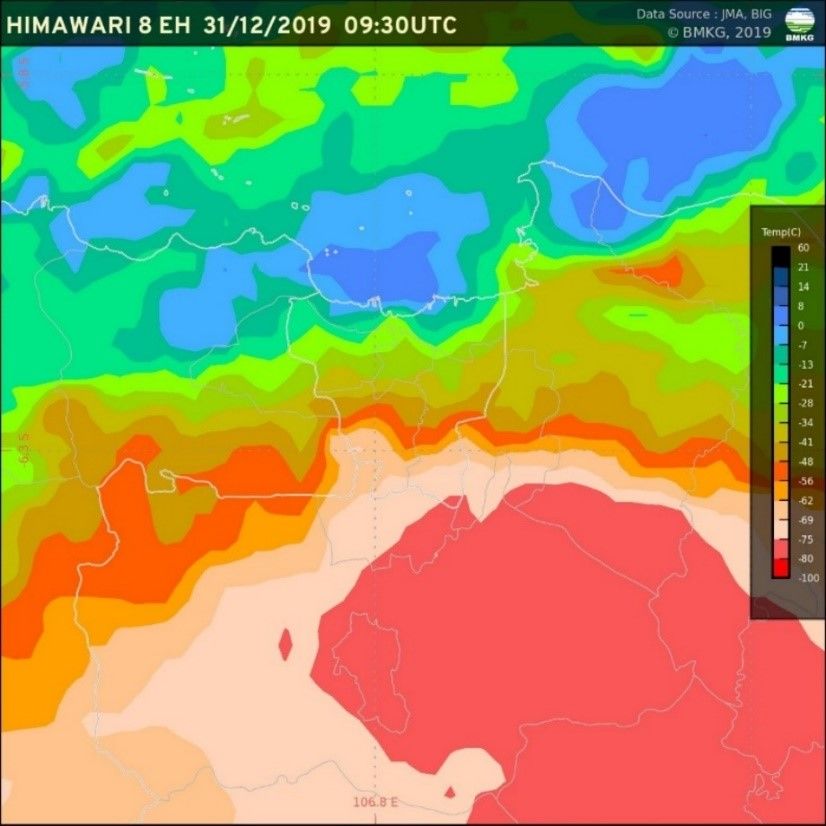
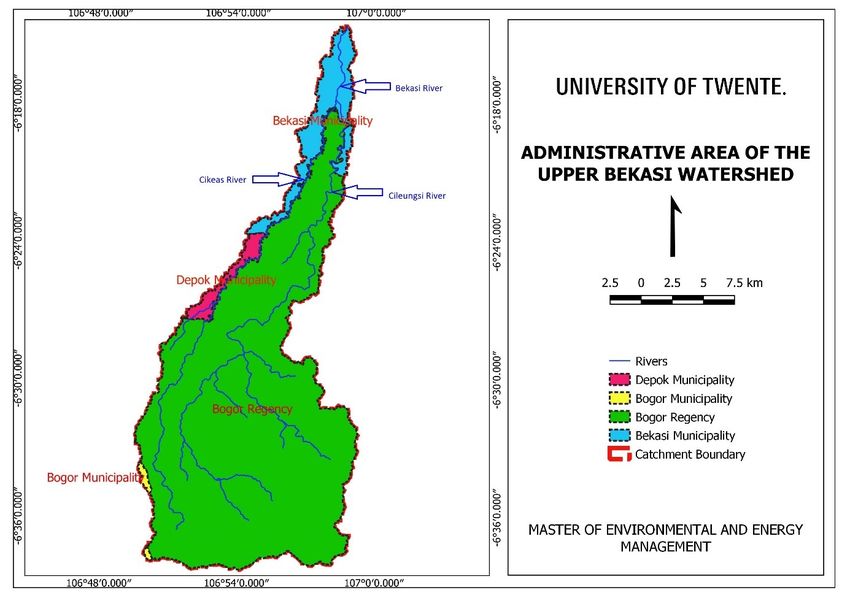
LIST OF FIGURES
Figure 1 Percentage of Natural Disaster Events in Indonesia between 2000 and 2020 .... 1
Figure 2 The Confluence of Cileungsi River and CIkeas River ............................................. 4
Figure 3 WRF Components ............................................................................................... 11
Figure 4 Research Framework .......................................................................................... 15
Figure 5 Catchment Area of the Upper Bekasi Watershed............................................... 19
Figure 6 Map of Bekasi Municipality................................................................................. 21
Figure 7 Map of Bogor Regency ........................................................................................ 22
Figure 8 Flood Depth on 1 January 2020 .......................................................................... 26
Figure 9 Extreme Early Warnings Disseminated Example in Indonesian ......................... 28
Figure 10 CCTV Monitored River Level ............................................................................. 30
Figure 11 One of pump stations installed ......................................................................... 34
Figure 12 Enhanced infrared image of the Himawari satellite ......................................... 37
Figure 13 24-hr Observed Precipitation from 31 December 2019 00 UTC until 01 January
2020 00 UTC ...................................................................................................................... 38
Figure 14 Vertical Wind Profile start from 30 December 2019 00 UTC until 2 January
2020 00 UTC ...................................................................................................................... 39
Figure 15 Vertical Relative Humidity Profile ..................................................................... 40
Figure 16 24-hr Rainfall Accumulation Forecasts of WRF/WRF-Hydro and Conventional
WRF ................................................................................................................................... 41
Figure 17 GSMaP Rainfall Accumulation .......................................................................... 42
Figure 18 PCC Values and RMSE Values between the Two Models and Observation Data
.......................................................................................................................................... 43
Figure 19 A Probabilistic Hydrograph Served by NOAA and NWS .................................... 46

 vii
LIST OF TABLES
Table 1 Meteorological forcing variables for Noah and Noah-MP ................................... 11
Table 2 Key concepts of the study .................................................................................... 15
Table 3 Parameterization Configuration of Conventional WRF and WRF/WRF-Hydro .... 16
Table 4 Interview codes and interviewees positions........................................................ 19
Table 5 Sources of data and accessing method................................................................ 20
Table 6 Data and method of analysis ............................................................................... 20
Table 7 Upper Bekasi Watershed Profile .......................................................................... 19
Table 8 Total Area and Demographics of Bekasi Municipality ......................................... 21
Table 9 Frequently Inundated Areas When Flooding ....................................................... 23
Table 10 Flood Potential Losses in Flood-prone Areas ..................................................... 25
Table 11 Summary of Empirical Characteristics based on KP2C Estimation .................... 32
Table 12 Response Actions Taken by Actors based on Prolonged Forecasts ................... 47

 viii

CHAPTER I INTROUDCTION
1.1. Background
Every year floods have severely damage infrastructure across the planet (Jonkman, 2005). According
to the disaster event database (EM-DAT), 3,751 natural disasters occurred during the last ten years
(2008-2017), of which 84 percent were weather-related disasters (Fisher et al. 2018). The number of
victims of these natural disasters reached around 2 billion people, and 95 percent of them were victims
of extreme weather events. Besides, the economic losses suffered by 141 countries due to natural
disasters during that period were expected at USD 1,658 billion, and 73 percent of these were disasters
related to extreme weather. Extreme weather events in Indonesia harm society and the environment,
and they can even lead to disasters. Hydro-meteorological events such as tornadoes, floods, landslides,
and drought are the major natural disasters that frequently occur in Indonesia. Based on the 2020
Indonesian National Agency for Disaster Management (BNPB) report, the number of disasters due to
hydro-meteorological events was 847 out of the 958 natural disasters that occurred from January to
March 26, 2020. As shown in Figure 1, of the 25,652 natural disasters that occurred from 2000 to the
beginning of 2020 in Indonesia, the incidence of hydrometeorological disasters reached more than 90
percent.

 0%
 1% 4% 1% 1%

 93%

 Hydro-meteorology Tidal Waves Forest Fires
 Earthquake Tsunami Volcanic Eruption

 Figure 1 Percentage of Natural Disaster Events in Indonesia between 2000 and 2020

 Source: BNPB (2020)

One of the hydrometeorological disasters that frequently occurs in Indonesia is flooding. Based on data
from BNPB, there have been 9,442 flood events from 2000 to early 2020. Because of the floods,
thousands of residences have been inundated, thousands of fatalities, tens of thousands of people
were injured, and nearly thirty million people suffered and were displaced. Not to mention the damage
to tens of thousands of various public facilities such as health, religious and educational facilities.

 1
Hirabayashi et al. (2013) stated that due to global warming an increase is projected in the frequency
of floods that can cause loss of both lives and properties.

One of the efforts that can reduce losses caused by flooding is to disseminate early warning. The early
warning systems have the main objective to empower individuals and communities to respond quickly
and appropriately to hazards in order to mitigate the risk of damage or loss of property and injuries
and even fatalities (UNISDR, 2006). The World Meteorological Organization / WMO (2008) highlighted
the vital role of the National Meteorological and Hydrological Services (NMHSs) and the WMO itself is
to contribute to efforts to protect human assets and lives by providing early guidance related to
hydrometeorological hazards and other information to reduce risks. To support an effective early
warning system, WMO (2015) promulgated impact-based forecasts program which aims to support
economic growth and sustainability. Therefore impact-based forecasts must be presented from the
perspective of the end-users such as local policy makers, disaster managers, and communities.

Conventional instruments such as rain gauges and river water level gauges can be used as input for
hydrological modeling in predicting floods. However, they are less effective in achieving early warning
objectives due to the relatively short time lag in reducing the flood risks. Contrarily, numerical weather
prediction is an essential model for forecasting long-term floods in a watershed (Rogelis & Werner,
2018). It is possible to produce long-term flood forecasts because the numerical weather prediction
can generate weather forecasts for the next few days so that disaster management agencies can
respond adequately to early warnings provided by National Meteorological and Hydrological Services.
Quantitative precipitation forecasting is one of the numerical weather prediction methods that has
been used in recent years as input for hydrological modeling (Seo et al., 2018). Therefore, the use of
quantitative precipitation forecasting for this purpose indicates the need for a qualitative shift in the
rain forecast paradigm (light or moderate or heavy rains) to quantitative weather predictions which
explains the numerical range of possible rainfall (WMO, 2016).

Weather Research and Forecasting (WRF) (Skamarock et al., 2008) is one of the numerical weather
predictions that are widely used around the globe, with dispersed applications for research and
operational weather forecasting (Powers et al., 2017). Based on the study by Li et al. (2017), the
quantitative prediction forecast produced by WRF can be used as a reliable reference for flood
warnings in a watershed. Reliable flood early warning requires accurate forecasts of when the flood
occur and how much it will occur to know the resulting runoff (Wehbe et al., 2018). Vivoni et al. (2008)
claimed that soil conditions at the regional scale can influence rainfall formation, river flow and
evapotranspiration. One of the newly developed features in the WRF application is WRF-Hydro, which
utilizes terrestrial and high-resolution hydrological data that can be run fully coupled with the WRF

 2
itself as well as stand-alone capabilities (Gochis et al., 2013). According to Senatore et al. (2015), WRF's
ability to predict soil moisture and rainfall is not sufficient compared to WRF-Hydro modeling (Gochis
et al., 2015), because WRF-Hydro has a smaller bias. The same thing was stated by Wehbe et al. (2018),
where WRF-Hydro has less bias and error when compared to conventional WRF. As a
hydrometeorological model, WRF-Hydro has the potential to be employed operationally as a tool to
predict floods (Sun et al., 2020).

WRF-Hydro has been employed widely by researchers to predict and analyze flood events in various
parts of the world (Zarekarizi, 2018; Ryu et al., 2017; Yucel et al., 2015; Avolio et al., 2019). However,
there has been no study on how to use WRF-Hydro in Indonesian maritime continent which has
complex geo-chemical-physical processes due to the strong land-sea-air interaction. Therefore, it is
necessary to compare the conventional WRF and coupled WRF-Hydro models which have important
value to determine which model is more reliable for predicting flooding at Indonesian maritime
continent.

This research focused on the early warning system by utilizing numerical weather prediction models
WRF and WRF-Hydro, which were used to analyze extreme rainfall events that occurred from 31
December 2019 to 1 January 2020. This extreme weather has resulted in the breakdown of one of the
embankments in the Cikeas River, which caused flooding in the surrounding area and resulted in the
loss of property and life. Based on data from BNPB, it was recorded that 9 people were killed and
366,274 residents had to be evacuated from their homes. The research focused on the downstream
area of the Upper Bekasi watershed because there are 2 sub-watershed confluences, namely the
Cileungsi sub-watershed and Cikeas sub-watershed. Figure 2 depicts the confluence of two rivers.
Apart from these reasons, the research location was chosen because the area is a densely populated
residential area and many economic sector activities are disadvantaged when there is a flood. Besides,
the downstream area of the Upper Bekasi watershed is also frequently flooded due to high rainfall.
(Prihartanto & Ganesha, 2019). Based on the research of Kadri & Kurniyaningrum (2019), this
happened because the area in the Upper Bekasi watershed experienced a land use change of 43
percent into built-up areas.

 3
Figure 2 The Confluence of Cileungsi River and CIkeas River
 Source: Personal Documentation

1.2. Problem Statement
The confluence of Cikeas sub-watershed and Cileungsi sub-watershed that are situated in Bekasi city
is considered as a densely populated urban area. This location is facing frequently natural hazards
during rainy season, causing floods induced by torrential rain. Floods in this area often bring not only
infrastructure damages and economy losses but they also threat human lives. As the landscape of this
area has been changing over time and the erratic weather extremes are increasing due to climate
change, the situation is also worsening. To minimize calamities because of urban flooding, an effective
early warning system crucial for the community at risk and the disaster management board to take
appropriate actions and make decisions. Therefore, the current situation of the urban flooding in
Bekasi, including early warning systems in place, and the capability of WRF-Hydro should be analyzed.
These situations need to be evaluated, diagnosed and improved in order to tackle and prevent flood
problems.

Early warnings that are disseminated several days before the occurrence of extreme weather events
have a vital role. Disaster management agencies and the community must respond to such
information. The question is whether such early warning systems and the warnings are in place, used
to their fullest potential and could be improved. There are three reasons to investigate the
employment of WRF-Hydro to reduce flood risk. Firstly, the ability of WRF-Hydro to predict torrential
rain at the Indonesian maritime continent is not yet known until now. Secondly, it is yet to be
elaborated whether in areas embryonal early warning systems are in place in local communities. Lastly,
the potential for improvement WRF-Hydro might offer is of interest, as is the receptivity of authorities

 4
and community to embrace and make the best use of WRF-Hydro. Furthermore, it is of interest to
address how that best could be arranged, and to elaborate what the gains might be.

1.3. Research Objective
This study aims to provide recommendations to the community at risk and disaster management
agencies for improvements on early warning system and flood forecasting in Bekasi. To achieve this
primary aim, three specific objectives will be pursued: 1) providing insights regarding embryonal early
warning system and flood forecast in Bekasi urban area; 2) analyzing response actions taken by
community at risk when early warnings were disseminated, 3) experimenting the capability of WRF-
Hydro to simulate and visualize the severe extreme weather event occurred in 1st January 2020.

1.4. Research Questions
Based on the state-of-the-art described above, the main research question is formulated as follows:

 To what extent and how could the hydrometeorological model WRF-Hydro improve society’s
 motivation to take flood preparedness and response action?

Sub research questions as follows:

1. What are the main characteristics in the selected flood-prone areas related to flood risks, flood
 preparedness and response action?
2. Is the meteorological and hydrological simulation-based WRF-Hydro model capable of providing
 better flood risk warnings and guidance to response action than systems in place? (cf. flood
 occurred on 1st January 2020).
3. How could WRF-Hydro best be embraced and implemented by authorities and communities in the
 selected flood prone areas?

1.5. Thesis Outline
The thesis is organized as follows: Chapter 1 describes the components of introduction the including
background of the research, problem statement, research questions, and research objectives. Chapter
2 elaborates literature reviews related to relevant theoretical background and information within the
scope of the research. Chapter 3 explains the research design, which comprises the research
framework, research strategy, research demarcation, and methods of collecting data. Chapter 4
provides findings in answering research questions using descriptive analysis of the existing early
warning systems and evaluative analysis of hydrometeorological modelling performance. Chapter 5
gives concluding remarks of this research project and recommendations for future research.

 5
CHAPTER II LITERATURE REVIEW
This chapter elaborates on the theories and concepts related with the research question. It consists of
three sections: The first section explains urban conditions associated with hydrometeorological
extreme events. The second section describes early warning systems as decision-maker tools. The last
section presents the weather models and the employment of WRF-Hydro in earlier research.

2.1. Extreme Rainfall
In the weather science, Indonesia is prominent as the Indonesian Maritime Continent because of the
strong interaction between air and sea, which resembles small-scale earth (Yamanaka, 2016). The
archipelagic country of Indonesia with its vast waters is located between two continents, namely the
Asian continent and the Australian continent. Indonesia is also located between the Pacific Ocean and
Indian Ocean and has approximately 17,000 islands. As a result of archipelagic topography and the
induction of sea surface temperatures, the influence of geographic features that become a large-scale
climate phenomenon varies throughout Indonesia (Aldrian & Susanto, 2003). The variation of climatic
and weather phenomena has become the concern of researchers and has produced a lot of literature
on Indonesian maritime continent including research, such as conducted by Ramage (1968) about
monsoon, McBride (1998) about inter-annual climate variability, Zhang (2013) regarding Indonesian
Throughflow that is related with intra seasonal variability or Madden-Julian Oscillation, and Pribadi et
al. (2012) that studied about diurnal weather variation. The variations in the climate and weather
phenomena mentioned above are closely related to extreme rain events. For instance, the
phenomenon of the active phase of the Madden-Julian Oscillation which occurred in conjunction with
the incidence of very heavy rain resulted in flooding in mid-January 2013 in Jakarta (Wu et al, 2013).

Severe rain events that caused flooding so that hundreds of thousands of people were evacuated and
claimed lives have also occurred in the Jakarta and surrounding areas in February 2007 (Voorst, 2014).
Subsequently, according to Wu et al. (2007), physical factors that induced this extreme rain events in
January and February 2007 are as follows:

1) Asian monsoons flowing from the north. In these months, the surface wind flows from the
 northern hemisphere across the equator towards the southern hemisphere while the wind in the
 upper layer blows inversely, from southern hemisphere to northern hemisphere.
2) A strong vertical shear.
3) Low relative humidity in the middle layer
4) The convection process that supports cloud development often appears during the day in
 mountainous areas located south of Jakarta, while at night the convection process occurs in the
 northern region.

 6
Moreover, based on Roca & Fiolleau, (2020) research, the amount of extreme rainfall that occurs in
the tropics is often an accumulation of rain due to a long duration mesoscale convection system. The
convective precipitation system on Earth is a mesoscale convection system with an area ranging from
tens to hundreds of kilometres (Dong et al, 2020). Extreme amounts of rainfall, long duration of events,
and slow movement of a mesoscale convection system are the main factors causing flooding (Houze,
2004).

2.2. Urban Hydrometeorology
The hydrometeorological physics process in urban areas is strongly influenced by the urban heat island
where the term urban heat island was first introduced by Balchin & Pye (1947). The term urban heat
island, which has appeared in the 1940s, indicates that the atmosphere in urban areas is warmer than
in rural areas. According to Stewart and Oke (2012), the warmer temperature of urban areas has two
effects, it can be positive or negative depending on the macro climate of the city. The positive impact
of urban heat island can be felt by cities that have a cold macro climate, where urban heat island has
benefits for human activities because urban heat island can reduce home heating costs, lessen the
amount of road icing that can cause slippery and become road threats to motorists, and make outdoor
activities more comfortable. Not only benefits humans, urban heat island in a city with a cold macro
climate also indulges plant growth and is also good for several animal habitats. Meanwhile, in a city
with a hot macro climate, urban heat island triggers negative impacts because urban life becomes
increasingly uncomfortable due to hotter weather, increases demand for energy due to increased use
of air conditioning, and can potentially increase heat stress and even death.

From a meteorological point of view, a densely populated urban area can affect the climate in the area
as explained by Oke (1982) as outlined below:

1) The density of buildings in urban areas where the sun's reflection and radiation is trapped causes
 the absorption of solar radiation to increase.
2) Industry, transportation and housing emit combustion waste thereby increasing the release of
 latent heat and sensible heat.
3) The surface of urban areas causes solar radiation to be converted to sensible heat rather than
 latent heat.
4) The surface of urban areas consisting of buildings and asphalt also causes greater heat absorption
 and longer heat dissipation.

Apart from that, urban areas also influence how the precipitation system is formed. Lin et al. (2011)
compared how the development of rain cloud systems in urban and rural areas using WRF modeling.

 7
Lin et al. revealed that the rain cloud system in urban areas is growing slower but the system is stronger
than if it is grown in rural areas.

Meanwhile, hydrologically, urban areas that are the destination areas for urbanization have
experienced changes in the landscape so that they tend to be separated, fragmented, and complex
due to there are many buildings. Based on Zhang et al. (2019) study regarding the effect of landscape
change in cities located in a watershed, it is stated that changes in the urban landscape exacerbated
by climate change cause an increase in the total amount of runoff. The influence of urban areas on
water distribution was also investigated by Liu & Shi (2017), where the results of these studies indicate
that there is a very strong correlation between river flow and the proportion of buildings in residential
areas. The denser the residential area, the higher the vulnerability of the area to flooding.

The area of study, which is an urban area located at the junction of 2 sub-watersheds, continues to
grow, both in terms of economy, population growth, and also experiencing land changes. How the
characteristics of the research area are important to be understood because urban areas are known
to have an influence on the hydrometeorological characteristics that occur in the area.

2.3. The Elements of Early Warning and Flood Forecast
In Indonesia, Law of the Republic of Indonesia Number 24 of 2007 concerning Disaster Management
states that the government is responsible for carrying out disaster relief management. One of the
efforts to manage disasters is to reduce disaster risk. To achieve this goal, one of the possible ways is
to disseminate early warning. In Government Regulation of the Republic of Indonesia number 21 of
2008 concerning the Implementation of Disaster Management (2008, p2), it is stated that early
warning is defined as "a series of activities to provide immediate warning to the public about the
possibility of a disaster occurring in a place by the competent institution." To cope with certain types
of disasters, this government regulation also stipulates that there are certain government agencies
authorized to observe disaster precautions. Heavy rain that can cause flooding can be classified as a
form of extreme weather event. Therefore, based on the Law of the Republic of Indonesia number 31
of 2009 concerning Meteorology, Climatology and Geophysics, an extreme rain warning is issued by
the Indonesian Agency for Meteorology, Climatology, and Geophysics (hereinafter referred to as
BMKG).

Particularly in urban areas, the risk of flooding has increased over time as a result of pressure of
population, property values and infrastructure. Therefore, to reduce the risk of disasters, especially
high rainfall that can cause flooding, building an effective early warning system is very important to
achieve community resilience. In 2006, UNISDR released a directive on the effective early warning
system which consists of four elements, among which are the following:

 8
1) Risk knowledge: Emerged risks is a combination of hazards and vulnerabilities in a particular area.
 Therefore, collecting data and analyzing it is a prerequisite for motivating people to take
 appropriate action against natural disasters. Learning and risk mapping are the main activities in
 this element.
2) Monitoring and warning services: These services are the essence of the system. Science-based
 knowledge must be strengthened to predict the occurrence of natural hazards. In addition,
 continuous 24-hour monitoring of natural hazard precedents should be undertaken. In addition,
 the impact of these hazards must be communicated and coordinated through existing networks.
3) Dissemination and communication: The effective early warning system emphasizes that warnings
 must reach communities at risk. Therefore, it is necessary to develop an identification level of
 communication and the establishment of an authority to respond to these risks. This system is
 expected to ensure that as many people at risk as possible receive a warning.
4) Response capacity: The appropriate actions that need to be taken when a natural disaster occurs
 can be implemented through response education by disaster management agencies. In addition,
 changing the behavior of vulnerable people is essential to build strong preparedness. Besides,
 rescue routes must also be available before natural disasters occur.

These principles can be applied to various types of disasters, including the incidence of heavy rains
that cause flooding. In 2013, The Associated Program on Flood Management (APFM) as an initiative of
the WMO and the Global Water Partnership (GWP) published guidelines for making flood forecasts. In
this guide, we should pay attention to several things related to flood prediction, such as hydro-
morphological characteristics, physical processes that occur during a hydrometeorological event, and
ensure that technically and economically services can be carried out as a mitigation effort. The
Associated Program on Flood Management (2013) stated the importance of the flood forecast lead
time before flood events occuring. Here, the flood forecast lead time is the minimum period required
by the affected community to take effective action against the risk of flooding some time after the
warning. In generating flood forecasts, several types of data are needed, such as hydrological data,
meteorological data, topographic data, and social data.

With current technological developments, the numerical weather prediction product in the form of
quantitative precipitation forecast is widely used for flood forecasting. However, to increase the level
of flood warning system confidence, one of the challenges that needs to be answered by the warning
system is increasing the capability of the numerical weather prediction (Cloke & Pappenberger 2009).
In this study, I will compare the skill of WRF/WRF-Hydro with conventional WRF to identify which
numerical weather prediction resulting the better atmospheric simulations in the study area.

 9
2.4. Early Warning Systems as Decision-making Tools
Hydrometeorological forecasts that can provide useful information about flood events support
decision-makers to formulate flood impact reduction strategies (Morss, 2010). Recently, numerical
weather predictions have been producing hydrometeorological forecasts with a forecast lead time of
up to several days before flood events. With prolonged forecast lead time, information about the
hazards that will occur will provide input to the disaster management agency to determine mitigation
measures for reducing the impact of the disaster. Also, the longer forecast lead time opens up
opportunities for greater dissemination of early warning information to local communities to take
proper action to save their lives and their property.

However, various sophisticated weather forecasting models that exist today are under-valued if the
forecast results are misunderstood, used inappropriately, or even ignored by the recipients of the
information (Demeritt et al., 2010). Besides, the majority of the hydrometeorological community also
lacks understandings of how communities and disaster management agencies interpret forecast
information and use it to make decisions (Morss, Lazo, & Demuth, 2010). Both of these indicate
ineffective warning communication. Furthermore, Parker et al. (2009) also explained that a lack of
understanding of warning information and how to take protective measures when receiving warning
information was one of the reasons for the ineffectiveness of early warnings. Therefore, how numerical
weather prediction outputs be best implemented to empower people at risk and disaster managers is
highly important.

2.5. WRF and WRF-Hydro
To generate flood forecasts for up to ten days, one of the varieties of tools that capable to produce
precipitation estimation is WRF. WRF is one of the open source-based numerical weather predictions
which is developed and employed by diverse communities such as universities, government
laboratories, and operational weather prediction (Skamarock et al., 2019). Not only WRF has been
used for weather research and forecasting but WRF also has been used to scrutinize other systems
that occur on earth such as air chemistry, hydrology, forest fires, tropical storms, and regional climates
(Powers et al., 2017). In simulating atmospheric conditions, WRF has flexibility and efficiency since it
can be employed using diverse computer systems ranging from laptops to clusters / super-
sophisticated computers. To get a more comprehensive weather simulations, WRF can be combined
with several other WRF features that represent real conditions on earth, such as WRF-Chem
(atmospheric chemistry), WRF-Fire (forest fire modeling), and WRF-Hydro (hydrological modeling).
Generally, the ARW framework can be seen in Figure 3. One of the advantages of WRF is that,
compared to global weather modeling, it has higher resolutions to simulate regional weather
conditions that cause floods (Asghar et al. 2019). This can be done by downscaling the global modeling.

 10
Figure 3 WRF Components
 Source: adapted from Skamarock et al. (2019)

WRF-Hydro is a model developed by the National Oceanic and Atmospheric Administration (NOAA)
and the National Weather Service (NWS) with several other agencies to predict flooding and
streamflow which is used nationally in the United States as the National Water Model (NWM)
(Krajewski et al., 2017). Furthermore, WRF-Hydro can generate streamflow prediction in certain areas
(White et al., 2019) because WRF-Hydro harnesses Noah surface terrain modeling, which is capable of
calculating the increasing complexity of the ground state, providing a physically consistent ground flux,
and providing channel flow information for use in hydrometeorological research (Gochis et al., 2015).
For the latest version of the WRF-Hydro, a new land surface model has been added, namely Noah-MP.
Improving capability has also been made in the latest WRF-Hydro to allow for more general mapping,
and on the use of irregularly shaped objects such as water catchments or hydrological response units
(Gochis et al., 2020). As land surface modeling, both Noah and Noah-MP require a meteorological
variable as forcing which can be seen in Table 1.

Table 1 Meteorological forcing variables for Noah and Noah-MP

 Meteorological Variable Units
 Incoming Longwave Radiation W/m2
 Incoming Shortwave Radiation W/m2
 Specific Humidity kg/kg
 Air Temperature K
 Zonal and Meridional Surface Wind m/s
 Surface Pressure Pa
 Liquid Water Precipitation Rate mm/s

 11
Both WRF and WRF-Hydro can be used as research tools because those tools provide many options for
physical configuration by parameterization. The parameterization of a numerical weather prediction
aims to depict a state of physical processes in nature that is too small, too short, too complex, too
difficult to understand, or too expensive to compute (Knievel, 2008). WRF and WRF-Hydro provide
various parameterizations including microphysics parameterization, cumulus parameterization,
shallow cumulus parameterization, surface layer, planetary boundary layer, atmospheric radiation.
The combination of parameterizations in the WRF will produce different rainfall simulations due to the
complexity of the physical process in the rain event (Mu, Zhou, Peng, & He, 2019). Therefore, the
selection of parameterization becomes important to simulate rainfall events accurately, both spatially
and temporally.

2.6. The Employment of WRF/WRF-Hydro
Several studies have been carried out employing WRF-Hydro in different fields of science, as
summarized below.

A study by Kerandi et al. (2017) on the employment of a fully coupled conventional WRF with WRF-
Hydro (hereafter “WRF/WRF-Hydro”) is used to study hydrometeorological conditions in the Tana river
basin in Kenya. Kerandi et al. (2017) stated that WRF/WRF-Hydro modeling results showed a slight
reduction in rainfall, evapotranspiration, groundwater storage but increased runoff compared to
conventional WRF. Although WRF/WRF-Hydro modeling produces precipitation far below satellite
observations, it is able to make an annual water discharge that is close to the observed result, which
is 323 mm per year and 333 mm per year, respectively.

Naabil et al. (2017) employed WRF/WRF-Hydro for planning, decision-making, and management of
water resources at the Tono dam in Ghana. WRF/WRF-Hydro modeling output is compared with
precipitation observations from the Tropical Rainfall Measuring Measure (TRMM) satellite and
available hydrological data. WRF/WRF-Hydro described the estimated streamflow attribute with a
Nash-Sutcliff efficiency (NSE) value of 0.78 and a Pearson correlation of 0.89. Naabil et al. (2017)
explained that improvements in model parameter calibration of WRF-Hydro have the potential to be
used in water resource planning, particularly estimating streamflow and dam levels.

In 2017, Verri et al. used WRF/WRF-Hydro to reconstruct the local water cycle in a small catchment in
Southern Italy. The research was conducted in the Ofanto River, a small catchment area, a porous
aquifer in the downstream area, and the Ofanto watershed is also an area that is often affected by
flash floods. In the study of Verri et al. (2017), several tests were carried out with various settings so
that the best results could result in a reduction in error / RMSE of 84 percent and an increase in

 12
correlation of 41 percent for the estimation of precipitation. Meanwhile, the runoff estimation results
in a 20 percent RMSE reduction and a 24 percent increase in correlation.

Research by Arnault et al. (2018) compared fully coupled WRF/WRF-Hydro with conventional WRF in
the Central European region. Arnault et al. (2018) consider that conventional WRF modeling does not
calculate soil moisture transport in a three-dimensional process, in contrast to WRF/WRF-Hydro, which
considers this. By activating lateral terrestrial water flow in WRF-Hydro, generally, there is an increase
in soil moisture, surface evaporation, and rainfall in the study area. Usually, in conventional WRF, these
variables are reduced by reducing the runoff partition – infiltration parameter. However, this good can
only occur under certain conditions such as moderate topography, high surface flux spatial variability,
and local weather formation processes dominating the weather regime. Arnault et al. (2018) explained
that WRF-Hydro is suitable for use in ensemble weather predictions.

Wehbe et al. (2019) employed WRF/WRF-Hydro to analyze extreme rain events that induced floods in
the United Arab Emirates. Then, for comparison, the results of surface observations and satellite
observations are used in the form of rainfall data, soil moisture, and satellite fractions to validate the
conventional WRF and WRF/WRF-Hydro outputs. This study indicated that the use of WRF/WRF-Hydro
in rainfall forecasts results in a reduction of 24 percent for RMSE, 13 percent for bias, and an increase
in Pearson's correlation by 7 percent compared to the conventional WRF.

 13
CHAPTER III RESEARCH DESIGN
This chapter elaborates on how the objectives of the study were achieved through a conducted
research project. The following sections elucidate the research framework, research strategy, data
collection, and research matrix.

3.1. Research Framework
According to Verschuren and Doorewaard (2010), a research framework is a schematic way of
answering research questions comprises of several steps taken to achieve it. Applying a stepwise
approach, therefore, activities carried out are as follows:

1) Characterize briefly the objective of the research project

The aim of this study is to identify flood risk and flood preparedness, analyze response actions taken
by communities and authorities, and compare the capability of WRF-Hydro and conventional WRF in
producing extreme rainfall forecasts in a case study. Having these aims achieved, I formulated
recommendations how the improved weather forecast can induce for a better decision-making and
response in the tropical urban catchment area.

2) Determine the objects of the research project

The objects of this research are the characteristics of the flood-prone area in Bekasi, the skill of WRF-
Hydro in the Bekasi catchment area compared to conventional WRF, and response action to flooding
by the governance and society after producing flood forecast with a long lead time.

3) Establish the nature of the research perspective

This research scrutinizes on flood risks and flood preparedness in the Bekasi floodplain. Thus, it is
practice-oriented research based on data gathered from governments, an NGO, and vulnerable
communities. Moreover, this study also employed a state-of-the-art hydrometeorological model to
examine its skill to generate extreme weather forecasts on the Bekasi flood prone area, therefore, it is
also an experimental study. Finally, this research performed a diagnostic gap review to make the best
use of prolonged flood forecast.

4) Determine the sources of the research perspective

In this study, reviewing scientific literature as well as studying existing documentation help to
develop theoretical framework. Table 2 below outlined the theories and concepts to be used in this
study.

 14
Table 2 Key concepts of the study

 Key Concepts Literature and Documentation
 Extreme rainfall WRF-Hydro employment
 Urban hydrometeorology Literature on urban characteristic
 Early warning system Literature and document on early warning
 Decision-making and response during flood Literature and document on flood early warning

5) Make a schematic presentation of the research framework

The research framework is depicted in the flowchart below:

 Figure 4 Research Framework

6) Steps that were followed during the research project are as follows:
a. Conducting analysis on theories regarding early warning system, WRF-Hydro, response action, and
 decision making. Also, preliminary research on flood plain area characteristics and the
 employment of WRF-Hydro are established.
b. Running both the conventional WRF and WRF/WRF-Hydro to simulate torrential rain events and
 carrying out assessments of flood risks, existing early warning system established by governments,
 and response actions were taken through interviews and document reviews.
c. Comparing the output between conventional WRF and WRF/WRF-Hydro and confronting the
 analysis results of the interviews to propose recommendation.
d. Recommendations for improving early warning systems so they can reduce losses caused by
 floods.

7) Check whether the model developed necessitates any changes to the research objective

As study is an iterative process, there is no indication of any changes required yet.

 15
3.2. Research Strategy
A case study approach is used in this research project. It used qualitative-quantitative mixed method
and evaluative analysis to study each research unit. Subsequently, this research underpins a desk
research that was combined with a literature review, interviews, and experimental running program.
The study analyzed explanatorily all gathered data to describe the implementation of early warning
system. Next to it, the successful prolonged flood forecast lead time is proposed to be employed in
generating flood forecast.

3.2.1. Running the Conventional WRF and WRF/WRF-Hydro
Above the research strategy is described in a condensed manner. There is one element that requires
more explanation in detail to foster clarity. That is the element of ‘experimental running program’ as
referred to in §3.2: In this research an experimental approach was applied in which to compare the
torrential rain simulation as based upon conventional WRF that is already employed in Indonesia and
the newly developed WRF-Hydro feature that is not yet to be employed in Indonesia. By comparing
conventional WRF and WRF/WRF-Hydro, it will be known which model that have a higher capability to
predict extreme rain events (cf. §2.4 and §2.5). This study employed WRF version 4.2 and WRF-Hydro
version 5.1.2.

Usually, the experimental approach used in running WRF is sensitivity tests by setting different WRF
configurations that aim to improve the prediction of catastrophic events (Avolio & Federico, 2018). In
this study, both conventional WRF and WRF/WRF-Hydro parameterization configuration used is
following settings suggested by Sun & Bi (2019) relating the validation of sensitivity test to the
operation of WRF in the tropical belt. Due to the study area that located in the urban area, this study
also used urban canopy model parameterization. The parameterization configuration can be seen in
Table 3.

Table 3 Parameterization Configuration of Conventional WRF and WRF/WRF-Hydro

 Parameterization Type Parameterization Used
 Physics suite “tropical”
 Microphysics WRF Single–moment 6–class Scheme (Hong & Lim, 2006)
 Cumulus parameterization New Simplified Arakawa–Schubert Scheme (Han & Pan 2011)
 Long wave atmospheric radiation RRTMG Shortwave and Longwave Schemes (Iacono et al., 2008)
 Short wave atmospheric radiation RRTMG Shortwave and Longwave Schemes (Iacono et al., 2008)
 Planetary boundary layer Yonsei University Scheme / YSU (Hong, Noh, & Dudhia, 2006)
 Surface layer Revised MM5 Scheme (Jiménez et al., 2012)
 Land surface Unified Noah Land Surface Model (Tewari et al., 2004)
 Urban Surface Options Urban Canopy Model (Chen et al., 2011)

 16
To produce weather predictions for up to several days, WRF uses Global Forecasting System (GFS) data
as input. In this study, the WRF forecast is a 72-hour forecast using GFS data. The GFS data that is
available every three hours is forecast data which has a resolution of 0.50 x 0.50 or approximately 56
km with the GRIB2 data format. The GFS data used in this study is forecast data starting on December
30, 2019 at 00 UTC until January 2, 2020 at 00 UTC which is freely downloaded at
https://rda.ucar.edu/datasets/ds084.1/ (NCAR, 2020). This data is used as input to make predictions
and early warnings three days before heavy rains and floods. Hopefully, disaster managers and
communities at risk will have sufficient time to prepare for hazards. The outputs of conventional WRF
and WRF/WRF-Hydro were verified by ground observation data.

3.2.2. Output Data Analysis and Verification
After the two models above are run, both produced output in meteorological data for WRF only and
meteorological data accompanied by river flow data for WRF-Hydro. The meteorological output of
both models has a time series of an hourly dataset so that there are 72 meteorological variable
datasets at the output. There are various meteorological variables from 1 output dataset, including air
temperature, humidity, air pressure, wind direction and speed, precipitation, and other variables.
From the meteorological variables generated from the model, the simulation of meteorological
phenomena can be analyzed. This study analyzed the meteorological data generated by the two
models to determine the cause of heavy rains on January 1, 2020.

The spatial distribution of precipitation results from the two models was compared with observation.
Two types of observation data were used: ground station observation and weather satellite
observation. Due to limited timeframe, the researcher used visual /eyeball verification when
comparing the spatial rainfall distribution. Also, a statistical test was conducted to know the reliability
of models. The statistical test used the forecast results and the observed data from the BMKG
automatic observation station in the modelling domain. The meteorological variables tested were
rainfall parameters at seven points, namely Jatiasih, Cibongas, Citeko, Jagorawi, Halim Perdana
Kusuma, and TMII. Forecasts from WRF and WRF-Hydro are deterministic forecasts. Then, this study
compares the hourly rainfall between the model output (denoted by the letter F) with the available
observations (denoted by the letter O). Therefore, the type of verification used in this study is
continuous verification, namely bias and association (F. Fundel, n.d.). This study carried out two
statistical tests as follows:

1) Pearson’s correlation coefficient (PCC) to see the relationship between the observed value and the
forecast value. The PCC value ranges from -1 to 1, where a value of -1 means that the relationship
between observations and predictions is inversely proportional. A value of 0 means that there is no
relationship. A value of 1 means that the relationship between observations and predictions is

 17
comparable. The PCC value is used to see the relationship between the observed values and the output
values of the model (Benesty, Chen, & Huang, 2008).

 ̅ )(F − F̅)
 ∑ =1(O − O
 =
 ̅ )2 x ∑ =1(F − F̅)2
 √∑ =1(O − O

2) Root mean square error (RMSE) is used to see the average error of the modelling output compared
to the observation results. This study uses RMSE because RMSE is sensitive to the probability of outlier
data occurrence (Chai & Draxler, 2014).

 ∑ =1(O − F )2
 = √

3.2.3. Research Boundaries
To ensure the objectives of the study are achieved within the limited timeframe, the research
boundaries are delicately determined. Research boundaries are outlined as follows:

1) The research analyzed one torrential rain event on 1st January 2020 that caused damages to
 embankments in Cikeas sub-watershed.
2) The study did not conduct intensive sensitivity tests that investigate multiple combinations of
 configurations to find out which combination has the best forecast skills.

3.2.4. Research Unit
The research units of this research were governmental authorities involved in early warning systems
in Indonesia, such as Regional Disaster Management Agency (in the future referred to as BPBD), BMKG,
Centre for Ciliwung-Cisadane River Basin (referred as BBWSCC), non-governmental organizations and
numerical model experts. Due to the limited time of finalizing this study, the selection of the research
unit was considered adequate to provide analysis regarding the early warning system in place,
response actions taken and implementing newly developed hydrometeorological model WRF-Hydro.
Additionally, the number of research units also depended on the availability of interviewees.

3.2.5. Selection of Research Unit
A combination of purposive and snowballing sampling was employed. On the one hand, purposive
sampling was adopted, as this technique is appropriate to explore specific informative cases (Neuman,
2014). On the other hand, snowball sampling (or respondent-driven sampling) was applied, because
the first respondent has interrelations with other respondents in achieving the same goal. Initially, the
researcher identified the first person related to early warning dissemination and numerical prediction
model expert. Subsequently, the first respondents connected to new respondents in their network.

 18
You can also read