The State of UK Peatlands: an update - IUCN UK Peatland Programme
←
→
Page content transcription
If your browser does not render page correctly, please read the page content below
The State of UK Peatlands: an update
Rebekka Artz (James Hutton Institute), Chris Evans (CEH), Ian Crosher (Natural England), Mark
Hancock (RSPB) Matt Scott-Campbell (Moors for the Future, MFTF). Mike Pilkington (MFTF) Peter
Jones (NRW), David Chandler (MFTF), Andrew McBride (SNH), Katherine Ross (Falklands
Conservation), Richard Weyl (NIEA).

In memory of Dr Richard Payne

September 2019

This review was commissioned by the IUCN UK Peatland Programme’s Commission of Inquiry on
Peatlands. The IUCN UK Peatland Programme is not responsible for the content of this review and
does not necessarily endorse the views contained within.
Update: The State of UK Peatlands

Rebekka Artz (James Hutton Institute), Chris Evans (CEH), Ian Crosher (Natural England), Mark
Hancock (RSPB) Matt Scott-Campbell (Moors for the Future, MFTF). Mike Pilkington (MFTF) Peter
Jones (NRW), David Chandler (MFTF), Andrew McBride (SNH), Katherine Ross (Falklands
Conservation), Richard Weyl (NIEA).

                                     In memory of Dr Richard Payne

                                     Draft version: 09 January 2020

Summary
This topic report provides an update on the 2011 JNCC report, focusing on new information obtained
since its publication in relation to mapping of peat soil extent, land cover, condition and change. The
report also outlines our current understanding of trajectories of change following restoration activities.

Mapping the UK peat resource
Since 2011, several major updates have been made to national peat maps for all of the UK countries
except England. In Scotland, the existing James Hutton Institute (JHI) peat map has been revised in
order to replace the existing ‘probabilistic’ map with a modelled spatially explicit map of peat
presence/absence, enabling the peat map to be combined with land cover data to support peat condition
assessment and monitoring. In Wales, the Welsh Government has supported the development of a
completely new peat map, utilising detailed mapping data from the British Geological Survey (BGS) and
Natural Resources Wales (NRW). In Northern Ireland, a new map has been produced by BGS based
on their own mapping data, augmented by data from the Agri-Food and Biosciences Institute (AFBI)
and the Northern Ireland Peat Survey data. In addition, BGS data have been used to map peat extent
in the Isle of Man, and to support a new (provisional) estimate of peat extent in the Falkland Islands.
This estimate will be refined during a new Darwin Plus project to create the first complete Falkland soil
extent and condition map, which is being led by the South Atlantic Environment Research Institute
(SAERI). Overall, peat mapping activities since 2011 have expanded the estimated peat extent in the
four UK countries to almost 3 million hectares, an increase of 276,500 ha over the 2011 estimate (Table
1 in Main Report). The estimated 282,000 ha of peat in the Falklands (larger than the total peat areas
of either Wales or Northern Ireland) represents a substantial further addition to the estimated area of
peat under UK jurisdiction.

Assessing peat condition

The assessment of peat condition in the 2011 JNCC report was largely based on land cover and habitat
maps. These maps use different classification systems, are based on ground and/or satellite survey
data collected at different times and cover all soil types so have only fairly coarse categories for peatland
areas. Subsequent national-scale mapping activities have used aerial photography to disaggregate
peatlands into different condition categories (England) or map drainage features (Wales, and in part for
Scotland), while more detailed mapping has been undertaken in individual peatland regions such as
Dartmoor and the South Pennines. Some of these more recent data were used in the recent
development of the UK BEIS Emissions Inventory for Peatlands project (hereafter called the BEIS
Inventory project), however inconsistencies between national and regional classification schemes,
variations in the ‘base year’ in which surveys were taken, and in particular the absence of comparable
repeat surveys still severely constrain the extent to which peat condition can be mapped and monitored
at a national scale. There is still a need to create a national baseline map of condition for all peatland
types across the whole UK that change can then be assessed against in future years. Even if a baseline
for 1990 cannot be accurately reconstructed, an appropriate and nationally consistent effort to create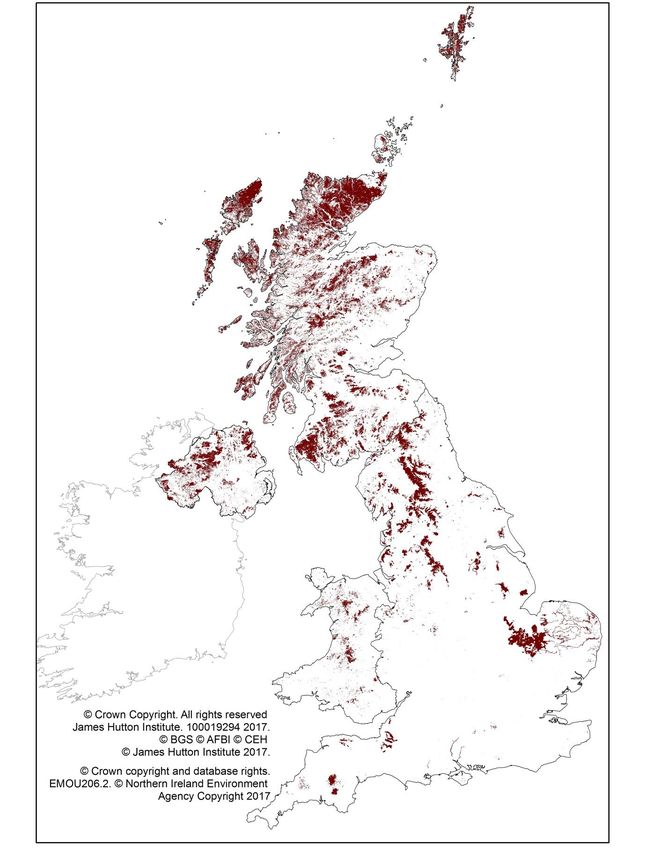
an accurate 2020 baseline map would help future generations assess progress towards the 2040 target
of the IUCN Peatland Strategy (“Two million hectares of peatland in good condition, under restoration
or being sustainably managed by 2040”).
The latest UK-wide update on trends in condition on peatland habitats was published in 2013 by the
Joint Nature Conservation Committee1. This report suggests overall bad condition for all nine peatland
habitat types under nature designation. Six of these habitats were considered to show an overall
improving trend in condition status. The majority of improving habitats, however, are fen type habitats,
which occupy a relatively small proportion of the total UK peatland habitat. The condition of most bog
habitats, including that of blanket bog, was declining. However, such ground-based condition survey
data place restrictions on consistent peatland assessment as there is a finite extent of peatland that
can be reasonably assessed in a single year given financial limitation and repeat surveys themselves
can cause a decline in local condition due to e.g. trampling. To increase the extent of monitoring and
reduce ecological pressure on the ground, several recent and ongoing initiatives have sought to make
greater use of Earth Observation (EO) data. The increasing spatial and temporal resolution of free of
charge satellite data such as the European Space Agency’s Sentinel 1 (radar) and 2 (optical) satellites
is providing new opportunities for consistent, detailed and frequent peat assessment, which were
explored as part of recent work for Defra and the Scottish Government (JNCC, unpublished). Case
study assessments for the Flow Country, Pennines and North Wales show that these data have high
potential to differentiate between different peat vegetation and condition categories, although the
infrequency of cloud-free imagery for the UK uplands limits the use of optical data (radar data are less
affected by cloud cover but provide less comprehensive information). A further constraint is the absence
of field data collected at an appropriate spatial resolution to train satellite classification algorithms, which
risks leading to inaccurate or regionally inconsistent assessments. Scottish Water also commissioned
a study through Rezatec to map peatland integrity and risks to water quality in a number of drinking
water catchments across Scotland and the Glastir Monitoring and Evaluation Programme as well as
other smaller-scale assessments have used mapping of peatland condition from high resolution aerial
photography sources, including drones.
Other relevant developments in the use of EO data include the use of Sentinel 1 radar data for i) crop
mapping, which could in future be used to assess and monitor lowland areas under arable agriculture,
ii) monitoring of near-surface soil moisture, as a proxy for drainage impacts or the resilience of restored
areas during extreme climatic events, and iii) monitoring the vertical movement of peatlands using
interferometry2, as a measure of peat growth or subsidence, and also an indicator of hydrological
functioning. As noted above, aerial photography data have already been used to map peat condition
and ditch occurrence, although such approaches are laborious, partly subjective and expensive to
repeat. High-resolution LiDAR elevation measurements have been used for ditch and erosion mapping,
but again the cost of surveys limits their repeatability. Finally, there has been substantial growth in the
use of Unmanned Aerial Vehicles (UAVs) for peat assessment. Given the limited extent and labour
costs of UAV mapping it is unlikely that they can be used for national-scale assessments, however they
represent a valuable tool for monitoring ecological change at the scale of individual restoration projects
and such data have the potential to be used to train larger scale models to improve accuracy of EO
outputs. A detailed and in-depth accurate assessment could be made of a variety of peatland areas,
which could then be used to interpret satellite data to extrapolate out over all the peatland areas to a
broader but slightly less accurate assessment of peat condition. The ecology, processes and threats
to peatlands in the UK’s Crown Dependencies and Overseas Territories, including the Falklands, are
poorly described and understood and will require fundamental effort on the ground to establish
appropriate baseline data.

Extent of restoration since 2011

The most recent UK-wide assessment of peat restoration activity, for the BEIS Inventory project,
covered the period 1990 to 2013, and was based on a collation of information from 409 individual
projects. This assessment gave an estimate that around 110,000 ha of peatland has been subject to
some form of restoration intervention, of which 73,200 ha included active re-wetting, while the remainder

1
  Joint Nature Conservation Committee. 2013. Habitat Conservation Status Reports - 3rd UK Habitats
Directive Reporting 2013 [online]. Available: http://archive.jncc.gov.uk/page-6563
2
  Interferometric synthetic aperture radar (InSAR) uses two or more SAR images to generate maps of
surface deformation/digital elevation, by utilising the phase differences in the waves returning to the
satellite. It can measure up to millimetre changes across a defined time period.
involved other forms of peatland management such as grazing reduction or scrub removal that may be
contributing to ‘passive’ re-wetting (e.g. by lowering evapotranspiration losses). An additional 1 million
ha of peatland has been included in some form of UK agri-environment scheme, but the evidence that
this led to any significant or sustained changes in peatland condition is weak at best, and these areas
cannot therefore be considered to have been ‘restored’. Relative to total peat areas, the largest
proportional areas of reported peatland re-wetting have been in England and Wales. These activities
have mainly occurred on upland bog, although some re-wetting of cropland and intensive grassland
has also taken place. In addition, there were small net reductions in the extent of forestry on peat in
England and Wales from 1990 to 2013, but in Scotland and Northern Ireland (and despite large recent
forest-to-bog restoration projects, particularly in Scotland’s Flow Country) there were net increases,
leading to an overall increase in UK peat under forestry of 24,000 ha during this period. There have
been reductions in the extent of industrial peat extraction, of around 7,900 ha, most of which has been
in Northern Ireland and England. Since 2013, there has been a step change in the rate of restoration
management in Scotland. Under the Scottish Government’s Peatland Action funding, a further total of
ca. 19,000 ha has been restored between 2013-2019 in Scotland. There are additional projects out with
Peatland Action, but we were not able to locate data on their extent. There have also been further
projects in Wales, England and Northern Ireland, but it has not been possible to compile these data for
this report. Data on restoration activities in the UK’s Crown Dependencies and Overseas Territories are
generally lacking, but the areas involved are thought to be small. In the Falklands, around 60 ha of
peatland have been restored or protected in the last five years (2014-2019), and work to increase this
area by Falklands Conservation, the Antarctic Research Trust, and private landowners is ongoing.

It is important to emphasise that current knowledge of both the extent and effectiveness of UK peatland
restoration activities is incomplete. The assessment of restoration activities described above was
heavily reliant on information provided by individual projects, which did not follow consistent reporting
protocols, was rarely spatially explicit, and was almost entirely based on reporting of actions (e.g. km
of ditches blocked) rather than measured outcomes (e.g. ha of peat over which water tables were raised
compared against unrestored controls). Furthermore, very substantial peat restoration has occurred in
the five years since 2013 via funding mechanisms such as the Scottish Government’s Peatland Action
Fund, Welsh Sustainable Management Scheme and a number of major EU LIFE programmes. More
recent grant schemes including the Defra Peat Restoration Fund will deliver additional peat restoration
within the next few years. At present the lack of a consistent, objective approach to reporting or
quantifying restoration outcomes, together with the absence of a robust satellite-based procedure for
monitoring peat condition change, severely limits our capacity to report on the extent, effectiveness or
therefore the overall benefits (such as GHG emissions reductions, amongst other ecosystem services)
of peat restoration activities supported by these substantial and continuing investments.

Restoration goals and gaps

Restoration goals vary, from mitigating losses of carbon to a desire to full ecosystem restoration to as
natural a state as possible. Consequently, there are no standard targets or standard methodologies to
assess effectiveness. There is also currently no agreed method on how to report on the extent of the
restored area and this needs to be clarified for national reporting in future. There is high resistance to
restoring areas of forestry on peat even when these are uneconomic; and despite efforts to have trees’
in the right places’, there have been cases of a direct policy conflict of the peatland restoration targets
and the woodland planting targets. Agriculturally-used peatlands are often seen as not being candidates
for restoration as the the income foregone is considered too high in relation to the value of the potential
payments for ecosystem services in a restored state. This needs to be further clarified (e.g. hidden
subsidies such as pumping costs), however in the interim, measures to at least reduce emissions from
agricultural peatlands through altered water management should be explored. Grouse moors often
present similar economic issues when assessed for restoration potential. Restoration goals can also
get confused in that some habitats on deep peat are designated for the degraded habitat that now exist
on top of the soils.

The vast majority of monitoring efforts address hydrological functioning or vegetation composition as
indicators of success. There are only a small handful of reports on the recovery of terrestrial and aquatic
fauna to date, a major data gap amongst global efforts to improve species monitoring. There is now a
significant body of evidence that shows mostly beneficial impacts of peatland restoration. Where
negative effects were observed, these were generally transient (disturbance) effects. However, if there
is potentially a short-term negative effect on an ecosystem service, this can reduce the willingness of
stakeholders to invest in projects which aim to protect the landscape in the longer term. Very few studies to date have reported the longer-term trajectory of restoration efforts, in many cases this is in part due to the limited duration of the restoration funding and compounded further by due to the short-term nature of funding for research and monitoring. The costs of peatland restoration are often not reported and hence there is still a relative lack of data, reducing the opportunity to assess cost effectiveness. Monitoring costs are generally not included in restoration funding, and therefore this lack of funding for research and monitoring is further hampering efforts to understand the potential benefits of restoration. Finally, the effect of nitrogen pollution and climatic change on the future success of peatland restoration remains to be examined. Wildfire incidence appear to be increasing in UK peatlands. Such fires not only destroy any carbon benefit accrued in the vegetation (and sometimes in deeper peat layers), but it is also unknown whether there are any longer-term impacts of wildfire that may adversely affect the condition of the UKs peatlands as a whole or limit the success of peatland restoration effort. Recommendations A major obstacle in measuring success is the lack of a common definition of a target state, and the lack of a common framework for monitoring and reporting. In terms of vegetation monitoring, the Common Standards Monitoring framework is the only common standard that can be applied at present, however it is generally only used for designated site monitoring. It does, however, use a standardised method to score degradation factors as part of the wider site condition assessment methodology. This lack of a common framework requires to be addressed. Currently there is no monitoring framework in place in relation to international obligations regarding restoration (Aichi 15) targets or the UK’s obligations to report GHG emissions under the UNFCCC and Kyoto Protocol. Biodiversity and wider condition monitoring are still limited to only having a framework for monitoring for designated areas, but reporting intervals are limited and are consistently being missed. There is therefore still no robust estimate of how much of the UK peatland resource is in good condition, poor condition, and/or deteriorating due to climate change. A wider UK peatland monitoring framework, that dovetails with international procedures and requirements should address these critical issues. Reporting on extent of ‘restored’ peatland. Methodologies to prove the extent of successful rewetting need to be developed to ensure a common (and possibly mandatory, in the case of publicly funded projects) future reporting protocol can be developed for national level reporting. Collation of these data may require a decision on an appropriate centralised body at UK or Devolved Administration level for data handling. Cost of peatland restoration needs to be reported better, using standardised methods. A better estimate of the cost of restoration in the light of the recommended targets by the Committee on Climate Change would enable better projections of overall cost and thereby allow better alignment of future policy instruments. Consider mapping benefits to multiple ecosystem services even if these cannot yet be fully quantified or monetarised. A common scalar could be developed for the systematic assessment of the various potential ecosystem service impacts and this would enable a critical comparison of inter-site restoration success. Raise the profile of the (substantive) peatlands in the UK’s Crown Dependencies and Overseas Territories and support their work to better describe and understand their ecology, processes, threats and practical restoration. Restoration grant aid should fund a level of on-site monitoring appropriate to the uncertainty of the outcome. Monitoring should take place in the restoration area and also in a comparable reference site in the same region, that represents a suitable target state for the restoration site. Reference sites do not need to be fully ‘natural’ or ‘pristine’ but could be (for example) intact designated nearby peatland sites at similar altitude and slope, assessed as being in good condition under statutory condition assessments. Reference sites should not contain any unrestored impacts (e.g. unblocked drains). This ground monitoring should be complemented by collating remote sensed indicators of vegetation and moisture conditions from the same sites for the monitoring years. Monitoring funding should be maintained long-term so that periodic (e.g. every few years), updated assessments can be made over many years, gradually building knowledge on long term responses of peatland sites to restoration management, as compared to suitable reference sites. Future policy development in Climate Change, Biodiversity, Planning and Agricultural arenas, especially post the (currently still ongoing) Brexit process, should explicitly regard the specific need of peatland restoration and conservation goals, given their importance for greenhouse gas emissions mitigation and in delivering UN Sustainable Development Goal 15.
Main Report

Contents

 Background.................................................................................................................................... 8
 Updates on mapping peat soil extent .............................................................................................. 8
    United Kingdom .......................................................................................................................... 8
    Crown Dependencies (CDs) and Overseas Territories (OTs) .................................................... 10
    Other advances in mapping peat extent .................................................................................... 15
 Updates on mapping peatland condition ....................................................................................... 15
    Use of aerial photography and LiDAR ....................................................................................... 18
    Satellite data-based condition assessments .............................................................................. 19
    Recommendations for future protocols ...................................................................................... 20
 Peatland restoration update ......................................................................................................... 21
    Definition of a restored area ...................................................................................................... 21
    Proxies for assessing the state of ecosystem services and functioning in restored peatlands .... 22
    Restoration effort to date .......................................................................................................... 24
    Additional projects completed since 2013 ................................................................................. 25
    Techniques used to restore peatland ........................................................................................ 29
    Restoration cost ....................................................................................................................... 29
 Restoration trajectories – current state of knowledge .................................................................... 31
    Data gaps in assessing restoration ........................................................................................... 37
 Future commitments to peatland restoration ................................................................................. 38
    Legislation and policies ............................................................................................................. 38
    Specific policy instruments ........................................................................................................ 39
    Policy barriers: .......................................................................................................................... 39
 Threats to peatland condition and restoration success .................................................................. 40
 Recommendations ....................................................................................................................... 41
Background
To complement the IUCN Commission of Inquiry Update, there is a need to refresh the information
presented in the Commission of Inquiry on Peatlands (2011) 3 in relation to the State of UK Peatlands.
Advances have been made in the use of remote sensing and mapping of peatlands for both national
assessment and project specific monitoring. This update specifically includes new information on the
peatland restoration and conservation activity that has taken place since 2011, as well as capturing
proposed peatland restoration going forward under new funding announcements (e.g. LIFE, agri-
environment funding) and new, UK component country-level, peatland actions plans such as those in
Scotland and England.
This report seeks to provide updates on the following key issues:
Outlining our understanding of peatland trajectories from a degraded > restoring > restored state,
and the external influences, such as land management practices, which may influence the path or
direction of the restoration trajectory
Briefly summarising the range of techniques being employed to map the peatland resource and
condition of peatlands in the UK and UKOTs. Include an overview of current remote sensing
projects and the types of peatland data these will generate
Summarising the extent of restoration activity that has taken place across the UK (inc. UKOTs)
since the last assessment report in 2011. Include detail (where available) on:
o The type of peatland restoration undertaken, and areas restored
o The techniques used to restore the peatland
o Management requirements post-restoration
o Restoration costs (per ha averages)
Summarising the scale of future peatland restoration that is committed to under existing
funding/project agreements across Government, statutory bodies, NGOs and private landowners
(where known). Indicate the delivery mechanism for this restoration and its funding source.
Updates on mapping peat soil extent
United Kingdom
There have been a number of additional efforts to map the extent of peat soils in the UK since the
2011 report (Table 1). Most of these efforts have focused on Scotland, where the previous peat soil
maps were largely derived from low resolution field surveys. These had resulted in a map output
where peat deposits in areas where these occur in mixed soil landscapes were attributed to an
estimated proportion for a given area (Chapman et al, 2009 4). Although it is possible to use this map
to calculate an estimated extent of peat soil as per the 2011 State of the UK Peatlands report, there
were many uncertainties with this approach as the proportion of peat in each area is estimated on the
basis of average statistics from soil series classifications within the National Soils Inventory for
Scotland. Work carried out by Scottish Natural Heritage subsequently improved this mapping effort by
including habitat (land cover) characteristics and higher resolution maps from the Soil Survey of
Scotland (1:25,000) to produce a map output that classified the peat extent into classes of different
likelihood categories to be priority habitats and/or containing high levels of soil carbon. The BEIS
Inventory project (2015-2017)5 then attempted to alleviate the limitations of the Chapman et al (2009)
mapping efforts by adding data sources from the British Geological Survey Digimap (v6) and higher
resolution maps from the Soil Survey of Scotland (1:25,000), applying a majority rule criterion for
3
Joint Nature Conservation Committee, 2011. Towards an assessment of the state of UK
Peatlands, JNCC report No. 445.
4
Chapman, S.J.; Bell, J.S.; Donnelly, D.; Lilly, A. (2009) Carbon stocks in Scottish peatlands., Soil
Use and Management, 25, 105-112.
5
Evans, C., Artz, R., Moxley, J., Smyth, M.-A., Taylor, E., Archer, N., Burden, A., Williamson, J.,
Donnelly, D., Thomson, A., Buys, G., Malcolm, H., Wilson, D., Renou-Wilson, F. (2017).
Implementation of an emission inventory for UK peatlands. Report to the Department for Business,
Energy and Industrial Strategy, Centre for Ecology and Hydrology, Bangor.88.pp. Available at:
http://naei.beis.gov.uk/reports/reports?section_id=3.peat-only areas. The extent of peat in mixed soil polygons was spatially limiting to the areas with slopes of less than 15%. This resulted in a model of peat soil extent that was spatially explicit and was verified against National Soil Inventory of Scotland point location data (Figure 1; Artz et al., 20196). Further improvements on the 2011 map were also made by Aitkenhead (2016)7 utilising Landsat8 data to produce a spatially discrete peat extent model for Scotland. Ongoing work is seeking to validate this model further using the peat depth database compiled from applications to the Peatland Action funding calls (see below). Although the Aitkenhead model7 output is a 100 m raster, which therefore may overestimate the size of small peat soil deposits or the margins of larger contiguous areas, it is at present the first digital soil model that does not solely rely on the Soils of Scotland survey data. A comparison of the mapped areas of peat extent in Scotland from the Aitkenhead (2016) modelling effort and the map produced for the UK Department for Business, Energy & Industrial Strategy (BEIS) project on Implementation of an emission inventory for UK peatlands (hereafter called the BEIS Inventory project) is shown in Figure 2. More recently, Poggio et al (2019)8 investigated the combined power of modelling peat extent in Scotland with radar and optical satellite data sources. The peat extent for England has not been revised since the 2011 report (Table 1). Although very slightly different area figures are shown in the Table 1, these are likely due to minor projection issues. As stated previously, these data were obtained from the attributes for peaty soils from data originating from the British Geological Survey and the National Soils Resources Institute (Cranfield University), and as compiled in the DiGMapGB (Digital Geological Map of Great Britain) Version 7.22 (British Geological Survey) database. For Wales, the BEIS Inventory project reported 20,000 ha more than stated in the 2011 report (Table 1). The 2011 report used the data from the ECOSSE report (Scottish Executive, 2007)9, whereas the UK BEIS Inventory project obtained the data generated by the Glastir Monitoring and Evaluation Programme (GMEP) which compiled a new unified peat map for Wales (Evans et al., 2015)10. These contained data from the British Geological Survey, Forestry Commission, and Natural Resources Wales. For Northern Ireland, the 2011 report used data from the Soils Map of Northern Ireland (Cruickshank 1997)11 to report on peat extent. Subsequent GIS intersections to generate land cover data on peat included the Northern Ireland Peat Survey data (NIPS, Cruickshank and Tomlinson, 198812). The UK BEIS Inventory project initially used a new peat basemap for Northern Ireland based on the BGS 1:10,000 superficial geology dataset, with gaps in coverage ‘infilled’ with mapped histosol polygons from the AgriFood and Biosciences Institute (AFBI) soil survey 1:25,000 scale. The NIPS land cover data source was also used for the BEIS Inventory report, however it also seemed to indicate that there are further peat deposits in addition to those mapped in the BGS/AFBI database. The BEIS Inventory project report therefore did include these additional areas as they were largely surrounding existing BGS/AFBI peat polygons. This, however, increases the potential area of peat soil in Northern Ireland by 36 kha (Table 1). Further work would be required to check whether these additional areas are all indeed peat soils, although aerial photography-based checks and inspection of attributes of the original NIPS database does suggest this to be the case for areas that were manually checked. Areas 6 Artz et al (2019) The potential for modelling peatland habitat condition in Scotland using long-term MODIS data. https://www.sciencedirect.com/science/article/pii/S0048969718352124?via%3Dihub 7 Aitkenhead (2016) Mapping peat in Scotland with remote sensing and site characteristics. Europ. J. Soil Sci https://onlinelibrary.wiley.com/doi/pdf/10.1111/ejss.12393 8 https://www.researchgate.net/publication/332058548_Modelling_the_extent_of_northern_peat_soil_a nd_its_uncertainty_with_Sentinel_Scotland_as_example_of_highly_cloudy_region 9 http://nora.nerc.ac.uk/id/eprint/2233/1/Ecosse_published_final_report.pdf 10 Evans, C., Rawlins, B., Grebby, S., Scholefield, P., Jones, P. (2015). Glastir Monitoring & Evaluation Programme. Mapping the extent and condition of Welsh peat. (Contract reference C147/2010/11), Centre for Ecology and Hydrology, Bangor. https://gmep.wales/resources. 11 Cruickshank, J.G. 1997. Soil and Environment: Northern Ireland. Agricultural and Environmental Science Division, DANI and The Agricultural and Environmental Science Department, the Queen’s University of Belfast. 12 Cruickshank, M.M. & Tomlinson, R.W. 1988. Northern Ireland Peatland Survey. Unpublished report to the Department of the Environment (Northern Ireland).
that the NIPS attributed as ‘thin’ or ‘rocky’ were excluded as these are more likely to be below the
country threshold depth for peat. The BGS dataset defines peat as locations where the depth is more
than one metre, and therefore the NIPS dataset may be a legitimate source of data where peat depth
is < 1m.

Table 1. Peat areas reported in JNCC (2011) and updated/additional area estimates based on more recent
mapping, where available, from the UK BEIS Inventory project (Evans et al., 20175). Note that only true peats
(not ‘peaty soils’) as per national definitions are included in the estimates, and that data are not available for
separating deep from ‘wasted’ peats in any country other than England. Peat areas in other UK Overseas
Territories and Crown Dependencies have not been quantified.
 Country/administration             2011 (ha)                 Updated (ha)              Change
 Scotland                           1,726,900                 1,947,750                 +220,850
 England (deep)                      495,828                  495,828                   -
 England (wasted)                   186,372                   186,372                   -
 Wales                              70,600                    90,050                    +19,450
 Northern Ireland                   206,400                   242,622                   +36,222
 UK Total                           2,686,100                 2,962,622                 +276,522
 Isle of Man                        No data                   475                       +475
 Falkland Islands                   No data                   282,100                   +282,100
 Combined total                     Not available             3,245,197                 +559,097

Crown Dependencies (CDs) and Overseas Territories (OTs)
Peat extent in the Crown Dependencies (the Channel Islands and Isle of Man) and Overseas
Territories has not yet been fully mapped. Within the CD’s, there may be small areas of peatland in
the Channel Islands. The only peat map currently available for the Isle of Man is the BGS 1:50,000
superficial geology map, which records a small area (476 ha, Table 1) as peat in lowland areas and it
is this figure that was used in the BEIS Inventory project (Table 1). A report by Sayle et al. (1995) 13
suggests that a similar area may be occupied by blanket peat in the uplands, but it is likely that this
area did not meet the 1 m depth threshold used in the BGS mapping. Weissert and Disney (2013) 14
estimated a much larger (> 5000 ha) peat area but were unclear with regard to their depth thresholds.
These two publications did not provide spatial datasets and therefore only the 476 ha in the lowlands
of the Isle of Man were reported in the BEIS Inventory project.

The UK Overseas Territories presently include Anguilla, British Antarctic Territory, Bermuda, British
Indian Ocean Territory, British Virgin Islands, Cayman Islands, Falkland Islands, Gibraltar, Montserrat,
St Helena and Dependencies (Ascension Island and Tristan da Cunha), Turk and Caicos Islands,
Pitcairn Island, South Georgia and South Sandwich Islands, and the Sovereign Base Areas on
Cyprus. Some updates on the Caribbean OTs can be found in the 2011 Brief Summary on the state of
peatlands in British Overseas Territories and Crown Dependencies 15, which highlighted that there are
peat deposits of unquantified extent and condition in Bermuda, Tristan da Cunha, Turks and Caicos
Islands and the Caiman Islands; with small areas on Anguilla, the British Virgin Islands and
Montserrat. There are currently no digital soil maps of these deposits available (Moxley et al, Date
unknown)16.

13
   Sayle, T., Lamb, J., Colvin, A., Harris, B. (1995) Isle of Man — Ecological Habitat Survey: Phase I
(1991–1994) Final Report. Department of Agriculture, Fisheries and Forestry, Isle of Man. Available
at: https://www.gov.im/media/60296/daffphaseiecologicalsurveyrepor.pdf
14
   Weissert and Disney (2013) Carbon storage in peatlands: A case study on the Isle of Man.
https://www.sciencedirect.com/science/article/pii/S0016706113001262?via%3Dihub
15
   IUCN (2011) OT/OC report of the state of peatlands. Brief summary of the state of peatlands in
British Overseas Territories and Crown Dependencies. UK Committee Peatland Programme.
16
   Moxley, J. (unknown date) Organic Soils in the UK Oversas Territories and Crown Dependencies.
Peat from Penguins to Palm Trees. Poster presentation at IUCJN UK Peatland Prgramme
Within the South Atlantic OT’s, the Falkland Islands have by far the largest peat extent of any of the
UK’s Overseas Territories, indeed they were previously assumed to be covered entirely in peat in the
UK emissions inventory assessment, but figures were not included in the 2011 report. Although not
100% peat covered, the islands nevertheless contain a significant fraction of the UK’s total peat area.
The Falklands peat base map that was produced for the BEIS Inventory project was derived from a
BGS superficial geology map produced as part of a geological survey of the islands by Aldiss and
Edwards (199917). Estimates of the peat extent in upland areas were produced using a 15% slope
threshold (based on results of a limited field survey), whilst lowland valley bottom areas were
assumed to be 100% peat soils. Further mapping work is currently ongoing through a Darwin+
project. Assessment, monitoring and restoration techniques for peatland ecosystems in the Falklands
are limited and will often differ significantly from those for the UK and other UK Overseas Territories18.
In other words, not all of the techniques and measures described below will be appropriate for the
Falklands. There are currently no digital soil maps of peatland extent for South Georgia and the South
Sandwich Islands or for St Helena and Ascension islands (Moxley et al, Date unknown).

conference. https://www.iucn-uk-peatlandprogramme.org/sites/www.iucn-uk-
peatlandprogramme.org/files/CEH%20-
%20Organic%20soils%20in%20the%20UK%20overseas%20territories%20and%20crown%20depend
encies.pdf
17
   Aldiss, D.T., Edwards, E.J. (1999). The geology of the Falkland Islands. British Geological Survey
Technical Report WC/99/10. British Geological Survey, Keyworth.
18
   Macadam and Upson (date unknown). Peatlands in the Falkland Islands. http://www.iucn-uk-
peatlandprogramme.org/sites/www.iucn-uk-
peatlandprogramme.org/files/12.06.27.1Peatlands%20in%20the%20Falklands_JMcAdam_0.pdf
Fig. 1. Updated map of the extent of peat in the United Kingdom. Reproduced from the BEIS
Inventory project (Evans et al., 20175), with permission.
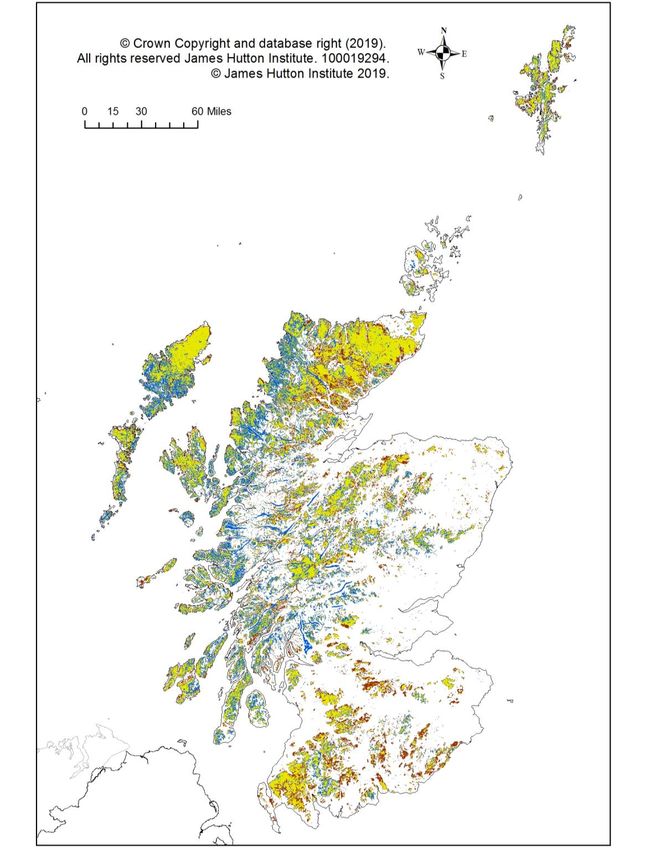
Fig. 2. Comparison of modelled peat extent in Scotland of two approaches (detailed in Aitkenhead
(2016)7 and Artz et al (2019)6, the latter of which formed the map in the BEIS Inventory project (Evans
et al., 20175). Areas where both models predict peat are shown in yellow. The Aitkenhead (2016)ibid.
model (blue) predicts additional peat coverage in Western Scotland; whereas the BEIS Inventory
approach predicted additional peat predominantly around areas of agreement between the two
models (brown). Area estimates based on the Aitkenhead (2016) ibid. model, however, inflate the total
peat extent to a higher value than the BEIS Inventory estimate due to the relatively low resolution
(100 m) of the model output. Future ground-truthing efforts should focus on areas of disagreement.
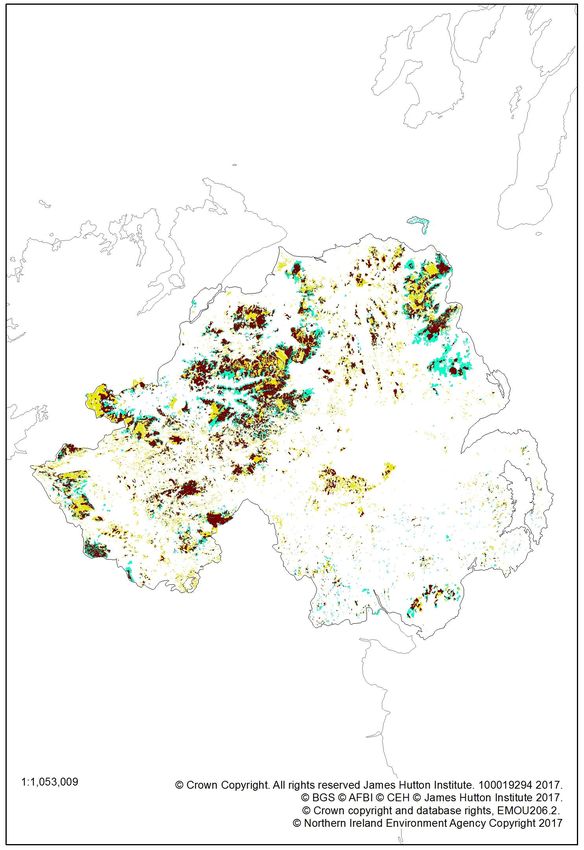
Fig 3. Uncertainties exist over the extent of peat soil in Northern Ireland. There are two datasets that
contribute to the full extent by the three colours shown in this figure. Areas in yellow are common to
both datasets. Additional areas that only appear in the dataset compiled by the northern Ireland Agri-
Food and Biosciences Institute (AFBI) are shown in brown, whilst further additional areas in blue
originate from the Northern Ireland Peat Survey (NIPS). Such areas are often described as peat
cuttings in the NIPS, so presumably are peat soils. It is possible that these constitute shallower areas
than the BGS 1 m threshold for mapping and therefore these were included in Evans et al., 20175.
Other advances in mapping peat extent
Peat depth mapping using ground-penetrating radar (GPR) is also beginning to be used across larger
areas. Parry et al (2014) assessed the relative accuracy of (hand-held) GPR against manual peat
depth probes in a blanket bog catchment and found that GPR may provide more accurate estimates
of peat depths, and therefore could also prove more accurate in determining the margins of peat
deposits. High resolution airborne gamma ray surveys are also being tested and show potential for
the determination of peat extent. Gamma ray surveys return a signal of a specific amplitude from the
bedrock underlying the soil, which is then attenuated by soil moisture and the density/porosity of the
soil, Peat soils are relatively easily identified due to their high moisture content and low porosity and a
number of case studies at a number of UK locations were able to recreate the peat extent of the
Digital Geological Map of Great Britain (e.g. Gatis et al., 201919).

Updates on mapping peatland condition

Peatland condition mapping was traditionally achieved through upscaling from field-based surveys,
such as the Common Standards Monitoring programme (CSM; JNCC, 200420, 200921) protocols on
designated sites. The latest UK-wide update on trends in condition on peat forming Priority Habitats
was the 2013 Habitats Directive Report22. This report suggests that, overall, all nine peatland habitat
types under nature designation are currently in bad condition. Six of the peatland habitats were
considered to show an overall improving trend in condition status. The majority of improving habitats,
however, are fen type habitats, which occupy a relatively small proportion of the total UK peatland
area. The condition of most bog habitats, including that of blanket bog, was declining. This is a worse
picture than suggested in the previous report published in 2007, and primarily due to changes
(improvements) in methodology, but in one instance, for active raised bogs, a genuine decline in trend
was identified. For non-designated areas, protocols are not harmonised. Blanket bog areas in
England that are managed under an Agri-Environment Schemes (AES) such as Higher Level
Stewardship agreements (HLS) are monitored using a system similar to CSM, where each feature
has a number of specific condition assessment targets which are used to indicate the initial condition
of the habitat. These attributes as defined in the Farm Environment Plan (FEP) Manual (Natural
England 201023) are most commonly used to indicate initial condition of habitat features, guiding
selection of appropriate objectives and management options during preparation of an HLS
agreement24. Other data sources are the Countryside Survey (2000) and SSSI/ASSIs (Sites/Areas of
Scientific Special Interest) and SACs (Special Areas of Conservation) site surveys on conservation
agencies in each country. Whilst data from such schemes are generally comparable if care is taken,
there is a lack of national coverage from these datasets which precludes mapping of peatland
condition at national scale. Additionally, the location of sites can vary between surveys or, in the case
of the Countryside Survey, be confidential, limiting the use of these data for upscaling.

The 2011 IUCN report utilised largely data from the Land Cover Map 2000 or the Land Cover of
Scotland 1988 where these were more detailed than in the LCM2000. The LCM2000 does not map

19
   Gatis, N. et al. (2019) Mapping upland peat depth using airborne radiometric and lidar survey data.
Geoderma 335: 78-87. https://www.sciencedirect.com/science/article/pii/S0016706118303495
20
   Joint Nature Conservation Committee. (2004) Common Standards Monitoring Guidance for
Lowland Wetland. JNCC, Peterborough [online]. Available: http://www.jncc.gov.uk/page-2235
21
   Joint Nature Conservation Committee.(2009) Common Standards Monitoring Guidance for Upland
Habitats. JNCC, Peterborough [online]. Available: http://www.jncc.gov.uk/page-2237
22
   http://archive.jncc.gov.uk/page-6387
23
   Higher Level Stewardship: Farm Environment Plan (FEP) Manual (NE264, 2010)
https://webarchive.nationalarchives.gov.uk/20150303063952/http://publications.naturalengland.org.uk
/publication/32037
24
   Penny Anderson Associates (2014) Improving the Evidence Based Guidance Relating to
Favourable Condition for Priority Habitats, SSSIs and SACs: Blanket Bog. Natural England
Commissioned Report.
drainage ditches, erosion, rotational burning or peat cutting and therefore additional data were sought
from Biodiversity Action Plan (BAP) inventory mapping sources for England (Natural England, 2010 25)
and Wales (Blackstock et al., 201026). Natural England (2012)27 also commissioned a study of aerial
photographs taken during 2002-2007 to map the extent of key visible peatland types within deep peat
areas above the Defra “moorland line”. This work, when combined with the LCM2000 and other
information held by Natural England, resulted in the peat condition figures presented in the 2011
IUCN report. The BEIS Inventory project (Evans et al, 20175) also compiled various national scale
land cover datasets to try to produce harmonised peatland condition maps across the UK. For
England, the NE257 dataset (Natural England, 2010) was used in conjunction with the Land Cover
Map 2007 (LCM2007) and the most up to date information on woodland cover from the National
Forest Inventory (2013 data). The results are not compatible as the categories have changed
between the different reports, and because the data presented in the 2011 IUCN report included land
with overlapping management in each category (i.e. the sum exceeds the total peat extent area). The
data from the aerial photography-based mapping for England’s peatlands (Natural England, 2012)
could not be integrated into the BEIS mapping work as there was incomplete coverage across
England’s peat soils. A more recent mapping effort of the forestry resource on peat soil in England
was produced by Forest Research (2014)28 which also includes decision support material for whether
restoration should be considered.

For Scotland, the 2011 IUCN report did not include figures on areal extent of land cover on peat, but
referred to the Land Cover of Scotland (1988) classification as the primary data source available. The
BEIS report (Evans et al, 20175) also used this dataset, but information was augmented where more
recent information was available, for example on forestry on peat via 2013 National Forest Inventory
data, on active peat extraction from CEH LULUCF datasets, on drainage from recent estimates from
Artz et al (2017)29 and on the area of bare peat within eroded areas on the basis of a limited aerial
photography assessment completed within the project. Therefore, the BEIS Inventory report presents
a more up to date, although still incomplete, picture of Scotland’s peatland condition.

For Wales, the 2011 IUCN report did not report broken down figures for different condition categories
due to a mismatch of areal extent between the peat soil mapping in the ECOSSE project and the
habitat mapping data from the Phase 1 Habitat Survey of Wales (Blackstock et al., 2010)21, although
a map of the condition classes from the Phase 1 Habitat survey was provided. The BEIS Inventory
project used the same Phase 1 Habitat survey data in a GIS intersection with the new unified peat
map (which was partly based on Phase 1 data), which resolved this former areal mismatch. The only
figures that can be compared between the reports are the areas of unmodified (near-natural) land in
the two reports, which are 24,000 ha in the JNCC 2011 report and 23,548 ha in Evans et al (20175).

For Northern Ireland, as for Wales, the 2011 IUCN report did not report broken down figures for
different habitat classes but did include a map of condition classes based on the Northern Ireland
Peatland Survey (NIPS, Cruickshank and Tomlinson, 1988 10) and the Landcover Map 2000 (CEH,
2002)). The BEIS Inventory report updated this using information from the LCM2007 instead of the
LCM2000 and used the combined peat extent map as discussed earlier. The BEIS Inventory project
updated this using information from the LCM2007 and the National Forest Inventory (2013).

Data on condition categories for the OTs/CDs were largely missing or relied on the LCM2000.

25
   Natural England. (2010) England’s peatlands: Carbon storage and greenhouse
gases. Report NE 257, Natural England, Sheffield. ISBN 978-1-84754-208-3 [online].
Available from: http://publications.naturalengland.org.uk/publication/30021 .
26
   Blackstock, T.H., Howe, E.A., Stevens, J.P., Burrows, C.R. and Jones, P.S.
2010. Habitats of Wales: a comprehensive field survey, 1979-1997. University of Wales
Press, Cardiff. 229 pp.
27
   Natural England (2012) Mapping the status of upland peat using aerial photographs
http://publications.naturalengland.org.uk/publication/369581
28
   Anderson et al (2014) An assessment of the afforested peatland in England and opportunities for
Restoration. https://www.forestresearch.gov.uk/tools-and-resources/peatland-restoration/
29
   Artz et al (2017) Comparison of remote sensing approaches for detection of peatland drainage in
Scotland.
https://www.climatexchange.org.uk/media/1483/comparison_of_remote_sensing_approaches_for_det
ection_of_peatland_drainage_in_scotland.pdf
Overall, the BEIS report data suggested a not dissimilar picture to the narrative in the UK Commission
of Inquiry report (2011). Forestry conversions on peat occupy around 18% of the UK’s peatlands.
Agricultural conversion affects around 7% of the peatland, with much of the cropped areas and
intensive grassland on so called ‘wasted’ peat (Figure 4). Wasted peat are former peatland areas that
have been so degraded that their depth no longer meets the minimum depth definition but which in
many cases still retain an upper layer of peat soil and may therefore produce emissions approaching
those from deeper peatlands. Around 40% of the peatlands has been modified through erosion or
conversion to a more grass- or heather-dominated vegetation, around 8% is converted to grassland,
and just under 5% has been used for peat extraction for domestic or horticultural use. Only around
23% remains in a near-natural state. However, it is critical to acknowledge the reports caveats that
these estimates are not very robust, due to the assumptions that had to be made in order to compare
land cover across different mapping sources. These may cause classification errors and a
recommendation was therefore made to improve the mapping of peatland condition using a
harmonised UK protocol.

Fig. 4. Best estimate of current distribution of condition of peatlands (UK average, from Evans et al.,
20175) Rewetting data from best estimate until 2013.

Even with the latest effort to map condition across the UK peatlands, a significant number of
challenges were encountered. As is evident from the list of data sources mentioned above, there is no
single spatial dataset currently available that captures all of the required information to calculate up to
date figures for the extent of peatlands in different condition classes. Several of the data sources on
habitat classification are only updated at irregular intervals (e.g. LCM), whereas others are much
more up to date (e.g. National Forest Inventory). This can cause discrepancies such as sizeable
areas in the latest Land Cover Map (2015) still being classified as forestry when they were felled for
restoration some time previously. There were also a number of important data gaps, notably in the
locations of drained peatlands in Scotland (see also below) and data on the spatial extent of rewetting
(also further detailed below). There remains an urgent need for a harmonised monitoring framework
across the whole of the UK that encompasses both designated and non-designated sites. Due to the
large land area involved, it is highly likely that remotely sensed data sources are required to be
included in such efforts. Clutterbuck et al (2018)30 discussed some of the potential of these methods
in a recent book chapter.

Use of aerial photography and LiDAR
Remote sensing can take various forms, ranging from aerial photography to the various satellite data
sources available at present. Lees et al (2018)31 summarised these various techniques for use on
peatlands in the context of monitoring carbon emissions but the same tools can be applied to map
condition (and often condition is used as a proxy for emissions). Resolution of aerial photography can
range between
sampling of the manually mapped drainage was sufficient to determine a reasonably robust estimate
of the percent of drainage in Scotlands’ peatlands, however the satellite data-based modelling of
drainage was unsuccessful. Drainage channels can often be obscured by overhanging dwarf shrubs,
making it sometimes difficult to detect old drains on aerial imagery. A recent PhD studentship (E.
Cole)36 developed the use of very high resolution hyperspectral aerial imagery to study restoration
effects at sites spanning an age gradient of four years on the Bleaklow plateau and nearby Blackhill in
the Peak District National Park.

Satellite data-based condition assessments
Satellite data sources range in spectral and spatial resolution, overpass frequency and time since
data became available, There is now much more choice of freely available satellite data sources than
was the case in 2011, specifically with the launch of the Sentinel-1 and 2 series of satellites, which
produce radar and optical data, respectively, at better resolution and higher frequency than some of
the longer-running satellite programmes such as Landsat and MODIS. Commercially available
imagery such as Worldview produces potentially high spatial resolution data but has not been widely
used in the scientific community due to the purchase cost.

The recently completed Defra pilot project37 used Sentinel-2 optical and Sentinel-1 synthetic aperture
radar (SAR) data to test a peatland condition classification scheme in 5 peatland areas of 100 km 2
across the UK. This project used the classification developed for the BEIS Inventory project and
tested a supervised classification method to detect these classes, using ground observations to
develop the models. The project showed encouraging results for the detection of the majority of the
peatland condition classes in the five UK test, although confidence for some of the semi-natural
condition classes was relatively low, in part due to the lack of appropriate ground observations.
Ground observations that match the resolution of the satellite data sources are relatively rare. Most
vegetation or habitat condition surveys are performed on plots of < 4 m 2, sometimes in conjunction
with line of sights indicators, and using such data without additional checks may erroneously assume
that the remaining proportion of the corresponding satellite pixel is covered with peatland in the same
condition. Additionally, such surveys often include elements that a satellite signal would not be able to
detect (e.g. “understorey” moss and liverwort species, or indicators of browsing). A very common
issue is lack of appropriate sampling effort across all of the desired condition categories, or indeed,
insufficient spatiotemporal coverage. Finally, ground observation data that are georeferenced with
handheld GPS systems have a location error margin of several metres. Notwithstanding these
limitations, Williamson et al (2019)37 were able to produce reasonable models of peatland condition
for categories where good ground observations were in existence.

The Glastir Monitoring and Evaluation Programme for Wales (2015) 29 evaluated net primary
productivity mapping from Landsat 5 data within Wales and produced a woody cover product from a
combination of airborne radar and optical satellite data, combined with data from the National Forest
Inventory.

Natural England have been running a pilot project with Manchester University on using Sentinel-2
data on the Bowland Fells to look at blanket bog condition.

Recent work at University of Reading and James Hutton Institute via a PhD studentship (K.Lees) 38
developed a model using MODIS satellite data to assess the gross primary productivity in restored
peatland sites in the Flow Country, Scotland, and this suggested that the photosynthetic fixation
potential of formerly afforested peatlands could be restored as soon as 5-10 years after restoration

36
   Elizabeth Cole PhD (2012).
https://www.research.manchester.ac.uk/portal/files/54528488/FULL_TEXT.PDF
37
   Williamson et al (2019) The role of earth observation in an integrated framework for assessing
peatland habitat condition and its impact on greenhouse gas accounting. Not yet publicly available.
38
   Lees et al (2019) A model of gross primary productivity based on satellite data suggests formerly
afforested peatlands undergoing restoration regain full photosynthesis capacity after five to ten years.
Journal of Environmental Management 246,594-604.
https://www.sciencedirect.com/science/article/pii/S0301479719303421
You can also read