Cloud Down Impacts on the US economy - Emerging Risk Report 2018 Technology - Lloyd's of London
←
→
Page content transcription
If your browser does not render page correctly, please read the page content below

Emerging Risk Report 2018
                 Technology

Cloud Down
Impacts on the
US economy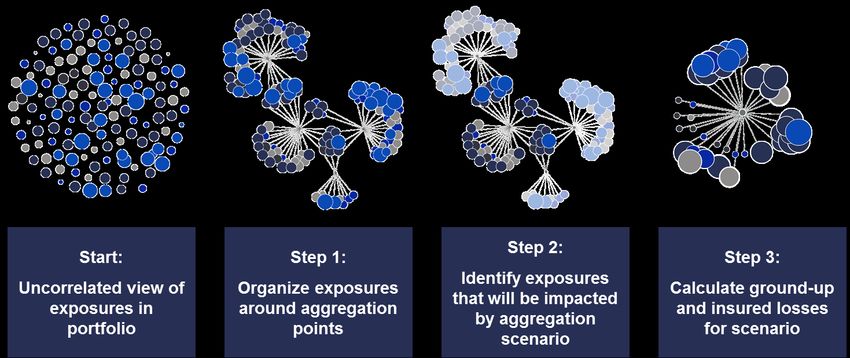
02

Lloyd’s of London disclaimer                                    About Lloyd’s
                                                                Lloyd's is the world's specialist insurance and
This report has been co-produced by Lloyd's and AIR             reinsurance market. Under our globally trusted name,
for general information purposes only. While care has           we act as the market's custodian. Backed by diverse
been taken in gathering the data and preparing the              global capital and excellent financial ratings, Lloyd's
report Lloyd's does not make any representations or             works with a global network to grow the insured world –
warranties as to its accuracy or completeness and               building resilience of local communities and
expressly excludes to the maximum extent permitted by           strengthening global economic growth.
law all those that might otherwise be implied.
                                                                With expertise earned over centuries, Lloyd's is the
Lloyd's accepts no responsibility or liability for any loss     foundation of the insurance industry and the future of it.
or damage of any nature occasioned to any person as a           Led by expert underwriters and brokers who cover more
result of acting or refraining from acting as a result of, or   than 200 territories, the Lloyd’s market develops the
in reliance on, any statement, fact, figure or expression       essential, complex and critical insurance needed to
of opinion or belief contained in this report. This report      underwrite human progress.
does not constitute advice of any kind.
                                                                About AIR Worldwide
© Lloyd’s 2018
All rights reserved
                                                                AIR Worldwide (AIR) provides risk modeling solutions
                                                                that make individuals, businesses, and society more
AIR disclaimer                                                  resilient to extreme events. In 1987, AIR Worldwide
                                                                founded the catastrophe modeling industry and today
This report has been co-produced by Lloyd's and AIR             models the risk from natural catastrophes, terrorism,
Worldwide (AIR) for general information purposes only.          pandemics, casualty catastrophes, and cyber attacks,
While care has been taken in gathering the data and             globally. Insurance, reinsurance, financial, corporate,
preparing the report AIR makes no representations or            and government clients rely on AIR’s advanced science,
warranties as to its accuracy or completeness and               software, and consulting services for catastrophe risk
expressly excludes to the maximum extent permitted by           management, insurance-linked securities, site-specific
law all those that might otherwise be implied. AIR              engineering analyses, and agricultural risk
accepts no responsibility or liability for any loss or          management. AIR Worldwide, a Verisk
damage of any nature occasioned to any person as a              (NASDAQ:VRSK) business, is headquartered in Boston
result of acting or refraining from acting as a result of, or   with additional offices in North America, Europe, and
in reliance on, any statement, fact, figure or expression       Asia. For more information, please visit www.air-
of opinion or belief contained in this report. This report      worldwide.com.
does not constitute advice of any kind.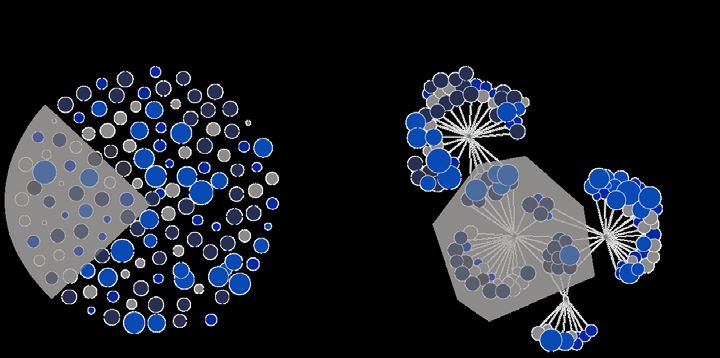
03

Key contacts                                              Lloyd's Market Association
                                                          − Mel Goddard, Market Liaison Director
Trevor Maynard                                            − Tony Ellwood, Senior Technical Executive –
Head of Innovation                                        Underwriting
trevor.maynard@lloyds.com
                                                          The following people took part in workshops or
Scott Stransky                                            roundtables, or commented on earlier drafts of the
Assistant Vice President & Principal Scientist            report; we would like to thank them all for their
sstransky@air-worldwide.com                               contributions:
For general enquiries about this report and Lloyd’s       Insurance industry workshops and consultation
work on emerging risks and innovation, please contact
innovation@lloyds.com                                     − Tom Allen, Channel 2015
                                                          − Scott Bailey, Markel
Acknowledgements                                          − David Baxter, Barbican
                                                          − Marcus Breese, Hiscox
AIR project team and area of expertise                    − Stephanie Bristow, Hiscox
− Dr Carol Aplin, Senior Scientist, Cyber                 − Robert Brown, Neon
− Mark Banks, Business Development Executive              − Wesley Butcher, Atrium
− Gian Calvesbert, Senior Product Marketing Manager       − Danny Clack, Pembroke
− Dr Eric Dallal, Scientist, Cyber                        − Jason Clark, Faraday
− Vineeta Gabriel, Scientist, Cyber                       − Nils Diekmann, MunichRe
− Dr Tomas Girnius, Manager & Principal Scientist,        − Daniel Fletcher, QBE
Cyber                                                     − Matt Harrison, Hiscox
− Dr Jayanta Guin, Executive Vice President & Chief       − Matthew Hogg, Liberty
Research Officer                                          − Adam Holdgate, AM Trust
− Catherine Jeannette, Senior Technical Writer            − Jerry Hyne, Aegis
− Nan Ma, Marketing Strategist                            − Laila Khudairi, Tokio Marine Kiln
− David Pigott, Senior Risk Consultant                    − Nick Leighton, Aegis
− Patricia Stevens, Risk Consultant                       − Alessandro Lezzi, Beazley
− Scott Stransky, Assistant Vice President & Principal    − Ben Maidment, Brit
Scientist, Cyber                                          − Kelly Malynn, Beazley
                                                          − Phil Mayes, Talbot
AIR external partners                                     − Alastair Nappin, MunichRe
− Frank Cilluffo, Associate Vice President & Director,    − Raheila Nazir, Aspen
Center for Cyber and Homeland Security, George            − Matt Northedge, AM Trust
Washington University                                     − Andrew Pearson, Barbican
− Nate Lesser, Senior Fellow, George Washington           − Scott Sayce, AXA
University                                                − David Singh, MS Amlin
                                                          − Dan Trueman, Novae
Lloyd’s project team                                      − Stephen Wares, MS Amlin
− Dr Trevor Maynard, Head of Innovation
− Dr Keith Smith, Innovation team
− Anna Bordon, Innovation team
− Linda Miller, Marketing and Communications
− Flemmich Webb, Speech and Studies
− Nathan Hambrook-Skinner, Marketing and
Communications
− Lizzie Lowe, Marketing and Communications

Further thanks go to the following for their expertise,
feedback and assistance with the study:

Verisk cyber team
− Prashant Pai, Vice President, Cyber Strategy
− Caitlin Plunkett, Cyber Lead, Commercial Lines
Coverage Products
− Stephen Whelan, Director, Product Management
Insurance Coverages
Executive summary 04 Contents Executive summary............................................................................................................................................................... 5 1. Cloud computing trends .................................................................................................................................................... 9 2. Modelling approach......................................................................................................................................................... 13 3. Industry exposures .......................................................................................................................................................... 17 4. Scenario classes description .......................................................................................................................................... 21 5. Analysis ........................................................................................................................................................................... 27 6. Implication of cloud failure on (re)insurance ................................................................................................................... 43 7. Applicability of modelling methodology for other scenario analyses .............................................................................. 46 8. Conclusion ...................................................................................................................................................................... 49 Appendix A. Historical cloud events ................................................................................................................................... 51 Appendix B. Cloud resilience .............................................................................................................................................. 53 Appendix C. E-business factors .......................................................................................................................................... 56 References .......................................................................................................................................................................... 57
Executive summary                                                                                                     05

Executive summary

The use and adoption of cloud computing services is          Methodology and approach
proliferating throughout society and it is no coincidence
that cyber risk is increasing as well. Not only there are    Unlike natural disaster risk, which can be aggregated
more companies relying on “the cloud” to operate their       using easily verifiable information such as geographic
businesses but economies of scale have creating a select     location, cyber risk aggregates around sources of risk
few cloud service providers that dominate the market.        such as third-party IT providers or software vulnerabilities
This reliance on a relatively small number of companies      present in the organisation’s systems. This information is
has resulted in systemic risk for businesses using their     hard to capture at the point of underwriting and may not
services. In the event of sustained downtime of a top        be transferred to the portfolio management level.
cloud service provider, simultaneous damage for all its      Technologies are now available that can use external
clients and dependents could lead to catastrophic            data sets to evaluate a company’s exposure to cyber risk.
financial losses. According to McKinsey & Company
(Elumalai, Starikova, and Tandon, 2016), as of 2015,         This paper provides estimates of e-business interruption
77% of global companies used traditionally built IT          costs to the full set of United States companies and the
infrastructure (i.e. with computers and servers set up on    subset of Fortune 1000 companies that arise from the
premises) as the primary environment for at least one        sustained loss of access to a business service, namely a
workload (i.e. a computing task); this is forecast to drop   cloud service provider. These e-business interruption
to 43% in 2018. While only about 25% of companies in         costs are modelled using data from the US Census
2015 used public infrastructure as a service as the          bureau and include costs from e-commerce
primary environment for at least one workload, that          sales/turnovers, e-shipments, m-commerce
percentage is expected to rise to 37% in 2018.               sales/shipments and electronic order management
                                                             systems. The US Census Bureau states that: “E-
Following Lloyd’s previous study, Counting the cost:         commerce sales/turnovers are sales of goods and
Cyber risk decoded, this study analyses cloud service        services where the buyer places an order, or the price
provider failure risk and specifically highlights the        and terms of the sale are negotiated over the Internet,
expected financial impact of such an event on 12.4           mobile device (m-commerce), Extranet, Electronic Data
million businesses in the US, the most established cyber     Interchange (EDI) network, electronic mail, or other
insurance market for this emerging line of business.         comparable online system. E-commerce shipments (e-
                                                             shipments) are online orders accepted for manufactured
The insurance industry has been asked by Lloyd’s,            products from customers, including shipments to other
regulators, and its own senior management to                 domestic plants of the same company for further
understand its exposure to this type of cyber risk. To       manufacture, assembly, or fabrication where price and
address this, AIR has developed a comprehensive              terms of sale are negotiated over the Internet, Extranet,
database of industry exposures that provides the             EDI network, electronic mail, or other online system.
information insurers need for accurate modelling and has     Payment may or may not be made online.” (US Census
used it to form the basis of the alternative modelling       Bureau, 2016.) The term “e-business”, as used in this
approach described in this report.                           paper, is defined in Appendix C.

The results of this cloud downtime scenarios analysis        The results published in this report are based on the top
could help insurance managers gain insights into how to      15 cloud providers in the US, which account for a 70%
grow their cyber business in a controlled and prudent        market share.
manner.
Executive summary 06
This report describes another approach to modelling Key findings
cyber aggregation risk that uses company specific risk
attributes. Detailed accumulation approaches differ from This report draws the following key conclusions about the
market share approaches because the underlying various approaches to estimating systemic risk and the
database of exposures means the modelled loss reflects losses that can be expected from the sustained downtime
the true risk insurers are exposed to. By identifying which of a major cloud service provider:
insureds companies would be impacted by the scenario
and omitting those that would not, detailed accumulation − The cyber insurance market is still
approaches are distinct from other approaches that only developing, and can be characterised by
use broad assumptions such as a provider’s industry relatively low take-up rates and coverage
market share. These market share statistics give no limits. As a result, there is a significant
indication as to which organisations are at risk, meaning difference between the ground-up losses and
that only generic scenarios can be created. By contrast, industry insured losses. This means there is
the scenario classes presented in this report considers an opportunity for the insurance industry to
the impact of disruption to several key cloud service help society to prepare for and recover from
providers for different periods of time. Losses can be split extreme scenarios of cyber risk aggregation.
accordingly, providing a deeper understanding of the
− The business interruption losses associated
actual risk. One benefit of this approach is that it provides
with the disruption of a cloud service provider
a framework for measuring the systemic risk associated
are varied and depend on how many
with any vulnerability that may be common across a
businesses use its services in the US market
group of organisations; it is not limited to the analysis of
and the duration of the downtime event.
service provider business interruption.
Given the state of the cyber insurance
industry today, a cyber incident that takes a
A multiple scenario approach top three cloud provider offline in the US for
3-6 days would result in ground-up loss
This report examines multiple scenarios that completely
central estimates between $6.9 and $14.7
disrupt a cloud service provider in the US, leaving all their
billion and between $1.5 and $2.8 billion in
clients with no access to the information technology
industry insured losses. A cyber incident that
services their businesses rely on. The previous report
takes offline a cloud provider that has
looked in detail at one scenario leading to cloud provider th th
between the 10 and 15 highest market
service failure. This report provides four threat sources
share in the US for 3-6 days, would result in
and more than 30 additional vectors that could lead to a
ground-up loss central estimates between
cloud service provider failure. There are multiple ways to
$1.1 billion to $2.1 billion and between $220
bring down a cloud service provider, and some attacks
million and $450 million in industry insured
can be combined assaults (e.g. DDoS attack plus
losses. These insured loss values are based
malware plus theft). However, this analysis is agnostic to
on affirmative cyber policies only.
the causes of downtime – it may arise from
environmental, adversarial, accidental, or structural − Fortune 1000 companies will carry 37% of
vectors. This report provides some commentary on the the ground-up losses and 43% of the insured
causes of such events but its focus is on what happens in losses arising from a 3-6 days downtime
the aftermath. The detailed accumulation approach event. Smaller companies might be more
provides estimates for a number of scenario variants, likely to use the cloud in order to avoid
each representing a specific cloud service provider and building the business infrastructure in-house,
different outage durations. but insurance take-up is low compared to the
Fortune1000 companies. As the cyber
insurance market grows rapidly, the
distribution of risk will have to be monitored
carefully.
− A cyber incident that takes down a top three
cloud service provider for 3-6 days would
result in $4.2-$8.6 billion of groud up losses
for the manufacturing industry, followed by
$1.4-$3.6 billion for the wholesale and retail
trade industry. These two industries will be
the most affected, which holds true for the
Fortune 1000 companies as well.07
− A comparison of the loss estimates obtained Conclusion
by using the detailed accumulation and
market share approaches indicates there is Cyber insurance is an emerging market that is
agreement between them at the broad outperforming most existing lines of business but this
industry level. However, as the scope of growth track can only be sustained if society’s
organisations evaluated becomes narrower, understanding of the nature of risk continues to grow as
differences become apparent. well.
Identifying these is critical for risk
management purposes. For a hypothetical This report’s findings suggest that disruption of a cloud
cyber portfolio and a 3-6 day downtime event, service provider in the US market will significantly impact
ground-up losses could be in the range of the manufacturing and retail trade industry, due to their
$640 million - $1 billion (mean: $850 million) heavy reliance on cloud services, and that Fortune 1000
for the detailed accumulation and companies would carry almost half of the insured losses.
$870 million - $1.4 billion (mean: $1.1 billion)
for the market share approaches, The analysis methodology outlined in this report can be
respectively, a 32% difference. For other used by the insurance sector to standardise and improve
specific insurance portfolios or sectors, the risk selection and portfolio management processes in
difference could be even larger. order to inform decisions such as setting underwriting
guidelines, deploying capital, and identifying risk transfer
needs.
The detailed accumulation report highlights the
importance and value of collecting high quality exposure
data and having it at hand at the point of exposure
management and portfolio analysis. Although there are
use cases where market share approaches are viable,
(re)insurers who are looking to differentiate their view of
the risk should strive to invest in processes for collecting
and incorporating detailed exposure risk data.
Lloyd’s and AIR hope this report and the discussion it will
provoke are a further step towards creating an insurance
sector that is more resilient to systemic cyber risk.Cloud computing trends Emerging Risk Report 2018 Technology
1. Cloud computing trends                                                                                                              09

1. Cloud computing trends

Introduction                                                           These technology trends have given rise to a booming
                                                                       industry of companies offering cloud computing services
In this paper, the term “cloud” refers to the technologies             in exchange for usage fees or for permissions or rights
that allow people to access computing resources from                   over the data being uploaded.
anywhere through the internet. The National Institute of
Standards and Technology (NIST) describes the cloud as                 Cloud computing service models
a model for enabling convenient, on-demand network
access to a shared pool of configurable computing                      There are several options for providing cloud computing
resources (e.g., networks, servers, storage, applications,             resources through a service model that does not require
and services) that can be rapidly provisioned and                      the acquisition of the necessary hardware and software.
released with minimal management effort or service                     Each model is unique in that it provides varying degrees
provider interaction” (Mell and Grance, 2011).                         of access and control over the underlying software and
                                                                       hardware. The three main cloud service models are:
The growth of cloud computing has been driven by
improvements in internet availability, reliability and
performance, the commoditisation of the required
hardware components, and the adoption of design
practices such as hardware virtualisation and service-
oriented software architectures.

Software as a Service (SaaS)                Platform as a Service (PaaS)                   Infrastructure as a Service (IaaS)
Clients are given access to software        The cloud infrastructure is provided as a      The client is provided with computing
applications using a thin user interface,   foundation for the client to deploy            resources, such as processing, storage
such as a web-browser that are              applications that were acquired or created     and network capabilities, where they have
supported in the backend by the service     using programming languages, libraries,        the choice of deploying their desired
provider’s cloud infrastructure.            services, and tools supported by the           software applications and operating
                                            provider.                                      systems.
The service provider is responsible for
managing or controlling the underlying      Control of the underlying cloud                Management or control of the underlying
cloud infrastructure including network,     infrastructure of networks, servers,           cloud infrastructure is the service
servers, operating systems, storage, or     operating systems, and storage is the          provider’s responsibility with the user
even individual application capabilities,   responsibility of the service provider, with   having control over operating systems,
with the possible exception of limited      the user having control over the deployed      storage, and deployed applications; and
user-specific application configuration     applications and possibly configuration        possibly limited control of certain
settings.                                   settings for the application-hosting           networking components (e.g. host
                                            environment.                                   firewalls).
1. Cloud computing trends 10
Underlying every cloud solution is a network of physical In order to meet the different requirements an
servers located within a single site or across multiple organisation may have, several types of cloud
locations. Who owns this infrastructure or can access the deployment models have taken shape:
data within it is determined by the chosen cloud
deployment model.
Private cloud Community cloud Public cloud Hybrid cloud
The cloud infrastructure is used The cloud infrastructure is used The cloud infrastructure is The cloud infrastructure is
exclusively by one organisation. exclusively by a specific group made available to the general deployed using a combination
That same organisation may of organisations who may own public with ownership and of private or community and
own and manage the cloud and manage the cloud management responsibility of public resources. The
infrastructure and/or may infrastructure and/or may the cloud infrastructure falling resources are separate but are
outsource that responsibility to outsource that responsibility to on one organisation, typically accessed by the user
a third party. The infrastructure a third party. The infrastructure for commercial interests. The organisation using technology
itself may exist on or off the itself may exist on or off the infrastructure resides on the or other internal processes.
client organisation’s premises. client community’s premises provider’s premises
A cloud solution is typically architected with multiple Cloud computing adoption trends
regions, where a region is a geographical location where
users can run their resources, and is typically made up of Enterprises are shifting from a "build" to a "consume"
multiple zones. All major cloud providers have multiple paradigm for their information technology (IT) needs and
regions, located across the globe, with Rackspace having that is driving the increasing adoption of cloud computing
the fewest at 7 regions and Microsoft Azure having the services. According to the McKinsey & Company
most at 36. Additionally, all major cloud providers have (Elumalai, Starikova, and Tandon, 2016), as of 2015,
multiple regions within the United States. 77% of companies used traditionally built IT infrastructure
(i.e., with computers and servers set up on premises) as
A typical user sets up resources and data within one the primary environment for at least one workload, a
zone of a region, with failover capabilities to another zone percentage expected to drop to 43% in 2018.
within the same region. For added resiliency, a user may
also set up resources to failover to another region, should While only about 25% of companies in 2015 used public
their region experience a downtime event. Most cloud infrastructure as a service as the primary environment for
providers architect their cloud such that regions are at least one workload, that percentage is expected to rise
independent of each other and zones within a region are to 37% in 2018.
isolated from each other.
These business decisions are fuelling the growth of the
public cloud service industry and it is projected that this
industry’s turnover will grow at a compound annual
growth rate of 36% between 2014 and 2026. (Note that
“turnover” and “revenue” are synonymous for the
purposes of this paper.) See Figure 1 for turnover
projections for the three cloud service model types, and
Figure 2 for the top clouds as measured by adoption rate.1. Cloud computing trends 11
Figure 1: Public cloud vendor turnover projections
$500
$450
Turnover (USD Billions)
$400
$350
$300
$250
$200
$150
$100
$50
$0
IaaS PaaS SaaS
Source: Wikibon’s Public Cloud Market Forecast 2015-2026 report (Finos, 2015)
Figure 2: Adoption of the top four enterprise public clouds
AWS
Azure
2017
Google Cloud
2016
IBM
0 20 40 60 80
Cloud Adoption %
Source: 2017 State of the Cloud report (Rightscale, 2017).Modelling approach Emerging Risk Report 2018 Technology
2. Modelling approach                                                                                                      13

2. Modelling approach

Cyber risks accumulate around sources of risk such as           Detailed accumulation
cloud providers. These sources of risk are challenging to
identify because most insurers do not know which cloud
                                                                In Figure 3, the circles represent hypothetical companies
vendors their insured customers use or to what extent. In
                                                                in an insurance portfolio. Circle colours indicate different
a scenario where a cloud provider is disabled, a
                                                                industry types and circle sizes indicate total insured
traditional market share approach provides a broad,
                                                                values. The market share approach illustrated on the left
relatively uncertain view of the risk. It assumes that if the
                                                                shows the segment of the portfolio that might experience
cloud provider has 30% market share, 30% of the
                                                                business interruption if a cloud vendor goes down, based
insurer’s portfolio is affected. This might be true, or the
                                                                on the market share of that cloud vendor. The segment
portfolio might have more or fewer insured customers
                                                                includes companies of all industry types and all sizes
who use that cloud provider. Unless the insurer has
                                                                because the market share approach does not consider
painstakingly gathered this data, there is no way of
                                                                actual relationships of these companies to the disabled
knowing which companies would be affected by the
                                                                cloud vendor.
outage or how much.
                                                                The detailed accumulation approach illustrated on the
                                                                right provides a more accurate view of the risk by using
                                                                data in the industry exposure database to identify
                                                                relationships between specific vendors and insured
                                                                companies. With this data, the same portfolio of
                                                                seemingly unassociated exposures can be aggregated
                                                                around four separate cloud providers.

Figure 3: The detailed accumulation approach identifies aggregation points
2. Modelling approach 14 Figure 4 shows the process for this aggregation analysis. accumulated ground up losses for each scenario. This First, the model uses the Industry Exposures to paper presents the impact of downtime on financial determine which common vendors are used by the losses to the economy and the insurance industry. insured companies. (The example shows that there are Finally, the model applies insurance terms to the ground- four common vendors.) Next, the model runs various up losses to determine the gross loss. periods of down time against each vendor to determine Figure 4: Detailed accumulation approach process
2. Modelling approach                                                                                                       15

This process is important because most portfolios do not             While using a market share analysis would indicate that
behave like the market as a whole. As an example,                    exactly four companies in every 100 company sample
consider the Dyn DNS (Domain Name System) outage of                  use Dyn, the analysis found that this was the case in only
October 2016. This was not a cloud downtime example,                 about 20% of the samples. In fact, about 20% (11% + 5%
but it is nonetheless useful to illustrate the advantage of          + 3% + 1%) of the samples (see dotted area in Figure 5)
using a detailed accumulation approach. Dyn has an                   included six or more companies that used Dyn, making
approximately 4% market share among DNS providers,                   an underestimation of 50% or more just as likely as
represented by the blue bar in Figure 5.                             getting the correct result in a market share analysis.
                                                                     Figure 5 illustrates the study. The chart was formed by
From a large set of companies with DNS provider                      tabulating the number of companies that used Dyn for
information, researchers repeatedly took random                      each random sample of 100 companies. For each
samples of 100 companies (a number chosen to be                      number from 0 to 100, we determined the proportion of
representative of a small cyber portfolio), and counted the          the random samples that contained exactly that number
number of those companies in each sample which used                  of companies using Dyn. The probabilities in the chart are
Dyn as their DNS provider.                                           simply these proportions.

Figure 5: Hypothetical distribution of companies impacted by Dyn outage
                          25%
                                                                         Dyn Market Share
                                                     20%     21%
                          20%
                                                                     17%
            Probability

                          15%                14%

                                                                             11%
                          10%
                                     6%
                                                                                      5%
                          5%
                                                                                              3%
                                2%
                                                                                                        1%     0%
                          0%
                                0    1       2        3      4        5         6       7       8       9       10
                                          Number of companies out of portfolio of 100 impacted by Dyn
Industry exposures Emerging Risk Report 2018 Technology
3. Industry exposures                                                                                                 17

3. Industry exposures

To demonstrate the detailed accumulation approach, a           AIR clients in the London and US markets have provided
rich set of nearly 12.4 million cyber-specific exposures       valuable exposure and claims data that helped AIR better
were used. This dataset includes information on US             understand insurance policy conditions.
businesses such as industry, turnover, employee count,
and location details, along with details on service provider   This exposure set represents a comprehensive view of
usage and insurance policy terms like limits and waiting       affirmative-only cyber insurance in the United States.
periods. The industry exposures were developed using           Non-affirmative covers are not accounted for in this
data from the following companies:                             paper, though the proposed framework could equally be
                                                               applied to them.
Risk Based Security™ (RBS) provides historical privacy
breach and incident data on more than 26,000 breaches,         BitSight Discover
including industry-specific details on threat vectors and
vulnerabilities and data breach information on business,       Data from BitSight Discover is a key component of the
industries, and geographies.                                   industry exposures used in this study. BitSight pinpoints
                                                               connections between an organisation, its vendors, and
BitSight Technologies™ provides BitSight Security              their vendors’ service providers, mapping their
Ratings and supply chain or network connectivity data.         connections to domains and companies associated with
The company's Security Rating Platform continuously            each domain to reveal the level of reliance on a common
analyses vast amounts of external data on security             set of service providers among all insureds within a
behaviours to provide objective, evidence-based security       portfolio.
ratings on thousands of companies by industry, company
size, and company headquarters location. BitSight              Data collected by BitSight is sourced from extensive
Discover is a key element, as described below.                 analysis of a company’s externally observable webpage
Nielsen provides turnover, headcount, and other data on        content, source IP addresses, public filings, DNS
businesses in the U.S.                                         (Domain Name Server) records, and mentions of
                                                               technologies using NLP (Natural Language Processing)
U.S. Census freely makes available data on technology          in a company’s job postings.
spending by industry and data on percent of turnover
from e-business by industry (US Census Bureau, 2015).          BitSight Discover observes DNS records to identify third
                                                               and fourth party connections. It is common for
Verisk Analytics collects and analyses billions of             organisations to setup CNAME (canonical name) records
records, drawing on unique data assets and deep domain         to point to third party solutions for support, hiring,
expertise. Verisk offers predictive analytics and decision     management of legal documentation, content delivery
support solutions to customers in rating, underwriting,        networks, and more. If an organisation has a CNAME
claims, catastrophe and weather risk, global risk              record pointing to .madgexjb.com, for example, it
analytics, natural resources intelligence, economic            indicates that the company is using Madgex Job Board
forecasting, and many other fields. Verisk has                 Technology as a vendor.
information on cyber policies that was used in this report.

Yahoo Finance offers diverse financial information for
many companies throughout the world. Yahoo Finance
was used for turnover estimates for large companies.
3. Industry exposures 18
As time goes on, more granular data on how the clouds and most accurate results. Table 1 shows the turnover
are being used by organisations will become available, bands and associated turnover ranges used to determine
for example, whether they are solely hosting their website industry averages.
on the cloud or are running numerous critical business
functions on it. Table 1: Turnover bands and associated ranges
Turnover band Range ($)
BitSight continuously monitors service provider
connections from outside each organisation, identifying A >= 2 Billion
new connections daily. BitSight provides visibility into
B 50 Million – 2 Billion
more than 70 different types of service providers,
including web hosting, analytics, content delivery C 10 Million – 50 Million
networks, mapping providers, domain name servers,
payment processors, shopping (storefront providers), D < 10 Million
SSL certificate authorities, security services, and others.
Using industry averages to derive Exposure statistics for the Fortune
vendor information 1000 companies and all US
If the industry exposures do not include data for a industry exposures
particular organisation, the model can derive an expected
value using industry averages based on market share for The occurrence limits and Business Interruption (BI)
different providers in different industry turnover bands. sublimits for the US Exposures were estimated using the
Separate turnover bands are used for each 2-digit NAICS limit derivation procedure presented in Section 5. The
code (North American Industry Classification System). In breakdown of limits by industry for both the Fortune 1000
this way, even if vendors are not known for all and the US Exposures are shown below in Figure 6.
organisations, the aggregated data shows the most likely
Figure 6: Cyber business interruption (BI) limits by industry
BI limits by industry
20.00%
15.00%
10.00%
5.00%
US Exposures
0.00%
Fortune 1000
Wholesale Trade
Professional, Scientific, and Technical
Manufacturing_33
Management and Remediation Services
Manufacturing_31
Educational Services
Health Care and Social Assistance
Real Estate and Rental and Leasing
Manufacturing_32
Accommodation and Food Services
Utilities
Management of Companies and
Construction
Arts, Entertainment, and Recreation
Industries not classified
Agriculture, Forestry, Fishing and Hunting
Finance and Insurance
Mining, Quarrying, and Oil and Gas
Retail Trade
Other Services (except Public
Transportation and Warehousing
Public Administration
Information
Administrative and Support and Waste
Administration)
Enterprises
Extraction
Services3. Industry exposures 19
NAICS classifies certain industry sectors using multiple compostion by industry between the Fortune 1000 and
two-digit codes. For instance, the manufacturing industry the full US Exposures. The Fortune 1000 companies
is defined by NAICS codes 31, 32 and 33 as seen in account for around 50% of the total turnover in five
Figure 6. The limits shown in this figure are broken down industries: Mining, Quarrying, Oil and Gas Extraction,
by subsectors when there is enough data available. The Utilities, Transport and Warehousing, Manufacturing, and
significant disparity for industries such as manufacturing Information. See Figure 7.
and finance is a direct consequence of the difference in
Figure 7: Ratio of turnover, Fortune 1000 to US industry exposures
1
0.8
0.6
0.4
0.2
0
Information
Professional, Scientific, and
Wholesale Trade
Management of Companies and
Retail Trade
Transportation and Warehousing
Other Industries
Mining, Quarrying, and Oil and
Educational Services
Utilities
Finance and Insurance
Accommodation and Food
Administrative and Support and
Manufacturing
Real Estate and Rental and
Waste Management and
Technical Services
Remediation Services
Gas Extraction
Services
Leasing
EnterprisesScenario classes description Emerging Risk Report 2018 Technology
4. Scenario classes description                                                                                      21

4. Scenario classes description

In this paper, three variants of a cloud outage scenario   Some of these ways, or “vectors”, are described in Table
classes affecting a leading cloud services provider by     2, mapped to the NIST Taxonomy of Threat Sources. A
market share are considered. The variants are:             combination of multiple vectors is also possible. For
                                                           example, a DDoS attack may be used as a
     −     0.5 - 1 day                                     “smokescreen” for an attack involving a zero-day exploit.
     −     3 - 6 days
     −     5.5 - 11 days                                   A zero-day vulnerability is a security hole in software that
                                                           is unknown to software creators or antivirus vendors,
The actual duration of losses for companies lasts beyond   while a zero-day exploit is the code used by attackers to
the initial point of service recovery. Although a 1-day    take advantage of a zero-day vulnerability. “Zero-day”
downtime is commensurate with recent experiences, it is    refers to the number of days that a software vendor has
AIR’s considered professional judgement that any           known about the vulnerability, meaning no patch is yet
continuous downtime longer than a week is extreme, but     available to fix it. Zero-day vulnerabilities and associated
not impossible. Cyber aggregation events have been         exploit codes are extremely valuable, not only to criminal
increasing in both frequency and severity.                 hackers, but to nation-state spies (Wired, 2014).

Clouds can fail or be brought down in many ways. Likely    Indeed, it was found that 50% of companies targeted in a
causes of interrupted cloud service include malicious      DDoS attack were also victims of some form of theft
cyber-attacks by external agents, errors by internal       during the event, and that 36% of companies were also
workers, as well as hardware and software failures.        infected by malware during the event (Neustar, 2015).
                                                           While not every vector listed could bring down a cloud
                                                           provider in its entirety, some vectors have led to an all-
                                                           region downtime event. For example, in February 2013,
                                                           Microsoft Azure experienced an all-region event when
                                                           updated HTTPS certificates were not pushed out prior to
                                                           the expiration of the existing certificates. And in October
                                                           2013, Microsoft Azure again experienced an all-region
                                                           event when an update pushed out to all their data centres
                                                           exposed an underlying bug.
4. Scenario classes description 22
Table 2: Vectors that could lead to cloud downtime
Threat Source Vector
Lightning strike on data centre
Flooding of data centre
Solar flare damages electronics
Earthquake near data centre
Bombing of data centres by terrorists or nation state actors
Nearby hazardous materials facility explodes, damaging data centre
Accidental cutting of buried power lines, leading to power outages that tax the back-up power systems,
which eventually fail
Environmental
Accidental cutting of fibre line of ISP
Destruction of data centre via kinetic attack (i.e., crashing a truck or flying a plane into the data centre)
Localised or widespread use of EMP
Intentional destruction of power grids on which a data centre depends
Intentional destruction of nearby dam, flooding a data centre
Destruction of network cables by vandals stealing copper, leading to loss of network access
Intentional destruction of power grid, leading to widespread power outages that tax the back-up power
systems, which eventually fail
Distributed denial of service attack on a cloud service provider
Intentional deletion of a large number of virtual machines by a malicious insider
Adversarial
Intentional stoppage of a core cloud service by a malicious insider, such as storage
Use of zero-day exploit by hackers to compromise the hypervisor
Accidental deletion of a large number of virtual machines
Accidental stoppage of a core cloud service, such as storage*
Accidental simultaneous rebooting of all servers within an availability zone*
Use of incorrect configuration settings during routine upgrades leads to loss of availability of front end
servers*
Accidental
Insufficient capacity of backup servers during routine maintenance*
Errors introduced during routine maintenance leads to a cascading failure and a flood of internal traffic,
resulting in a self-caused denial of service type incident (see Box 1)*
Human errors introduced during routine maintenance or upgrades interact with the underlying complex
system to lead to large-scale downtime events
Expiration of HTTPS certificates when renewed certificates were not released as part of routine
maintenance*
Improperly tested updates expose underlying bugs*
Failure of environmental management systems*
Loss of primary, secondary, and back-up power systems*
Short-circuit of power distribution panel
Failure of networking devices
Structural Failure of file servers
Data server with an undetected severe capacity constraint continually crashes and reboots, until
automated failure detection systems take the server offline. The loss of server capacity puts increased
pressure on remaining data servers until they degrade and fail, leading to cascading failures*
Undiagnosed errors masked by automated failure detection systems lead to catastrophic failure of core
systems and large-scale downtime events
*Previously encountered vectors that have led to any cloud downtime4. Scenario classes description 23
Cloud downtime analysis The data set consists of twelve events that lasted for half
a day or longer, five events that lasted 1.5 days or longer,
and no events that were greater than five days. Of the
To understand the likelihood of an extreme cloud events in the data set, the longest was a 3.5 day outage
downtime event, it is useful to consider both the way a affecting AWS in 2011, in which their utility provider
cloud offering is architected and events that have led to suffered a failure of a transformer. Additionally, two all-
cloud outages in the past. Appendix A gives an overview region events are included in the data set: a nearly half-
of a number of events that lead to cloud downtimes, and day downtime event experienced by Microsoft Azure in
Appendix B discusses cloud architecture and resiliency. February 2013, and an 8-hour downtime event
Additionally, Gunawi, et al (2016), conducted an in-depth experienced by Microsoft Azure in October 2013.
review of past cloud outages. Their cloud outage study
looked at events from a subset of cloud providers (e.g. Cloud service providers implement new technologies,
AWS, Microsoft Azure) and cloud based services (e.g. controls, and automations in an effort to reduce both the
Netflix, Blackberry) from 2009 through 2015. number and severity of any future cloud downtime
events, which could potentially limit the utility of historical
Taking a further subset of their data to include only cloud data as a predictor of future cloud performance.
providers and events for which the downtime is However, industry experts acknowledge that while
documented results in 74 distinct downtime events over technology continues to improve, legacy cloud
the seven year period. Four cloud service providers are deployment may not keep pace with this change, and
represented in the dataset: AWS, Google, Microsoft that in order to minimize risk in a rapidly evolving
Azure, and Rackspace. The number of downtime events technological space continuous improvement of
is plotted against the length of the event in Figure 8 architectural processes is also required. In short,
below. improving technology or increasing the number of data
centres cannot prevent cloud downtime events without
Figure 8: Cloud downtime events, 2009-2015 additional advances in cloud architecture and
deployment. This is illustrated in the October 2013
Microsoft Azure downtime event, where an update to a
module called Red Dog Front End (RDFE) caused a
50 worldwide outage of the Azure compute service. Because
of the way that Azure is architected, only a single version
45
of RDFE can run on the entirety of the Azure cloud,
40 meaning that Azure engineers were unable to deploy the
updated RDFE to a subset of Azure data centres to fully
35
Number of events
test the update. Instead, the update had to be deployed
30 across all Azure regions, at which point an underlying
2 days
3 days
1 day
bug was exposed, leading to the outage (Availability
25 Digest, 2013).
20
15
10
5
0
12-16
16-20
20-24
24-28
28-32
32-36
36-40
40-44
44-48
48-52
52-56
56-60
60-64
64-68
68-72
72-76
76-80
>80
≤4
4-8
8-12
Downtime, hours4. Scenario classes description 24
Recovery schedule Figure 9: The percentage of companies with service
recovered as a function of time since the beginning of the
The scenarios assume that the service provider in scenario, for a 3-6 days scenario
question goes down in its entirety, i.e., in all regions. The
final component of the scenario description is a recovery Percent of companies with
schedule describing the percentage of the provider’s
services that are recovered as a function of the elapsed service recovered
time since the beginning of the outage. Lacking sufficient 100
past examples of cloud downtime (and especially of
80
lengthy downtime) to derive such a curve from data, we
have instead produced the recovery curve shown in 60
Figure 9 based on of two assumptions:
40
1. It will take time to diagnose the cause of 20
downtime, come up with a plan to mitigate it, and 0
begin executing it. 0 1 2 3 4 5 6
2. Given the distributed nature of the cloud and the Day
(mostly) independent nature of the servers that
constitute it, service recovery will progress
incrementally.
Curves for other scenario durations follow the same form,
with a linear recovery beginning at half the time it takes
for all companies to have recovered service. In particular,
the AWS outage of February 2017 satisfied both of the
above assumptions, with recovery constituting a multi-
step process in which services were restored at distinct
times.
Likely causes of interrupted cloud service include
malicious cyber-attacks by external agents, errors by
internal workers, as well as hardware and software
failures.4. Scenario classes description 25
Box 1: April 2011 Amazon Web Services outage
st
On April 21 2011, a widely used storage service within AWS (the Elastic Block Store, or EBS) went down, leading to
widespread service disruptions in the Amazon US East Region. The outage affected many popular websites, such as
Reddit, Quora, and Foursquare (Bright, 2011).
The outage began during a routine configuration change that AWS was making to an Availability Zone within the US
East Region as part of an upgrade to the primary network capacity. At 12:47 AM PDT, the EBS cluster in the
Availability Zone was moved from the primary router (Amazon, 2011). While the cluster was supposed to be moved to
a redundant router, it was instead moved to a secondary lower-capacity router. This lower-capacity router could not
handle the volume of traffic between the EBS nodes. With the primary network offline and the secondary network
overburdened, the result was that each EBS node was effectively isolated from all other EBS nodes (Bright, 2011).
EBS nodes in the AWS cloud all have partner nodes, with each node pair storing exact replicas of their data. Should
an EBS node lose communication with its partner node, the EBS node immediately begins searching for a new node
to on which to replicate its data, a process managed by the EBS control plane. In normal operations, this node
behaviour is beneficial, as it ensures that data is not lost. However, during the outage this behaviour led to further
issues within the Availability Zone. Once AWS brought the primary network back online, all the EBS nodes
immediately began replicating their data onto new partner nodes. This replication behaviour meant that all available
storage capacity was quickly filled, leaving many nodes “stuck,” searching for free storage space that was not
available (Amazon, 2011).
Up to this point, the failures were restricted to a single Availability Zone within the US East Region. However, the
“stuck” EBS nodes continued to make requests for partner nodes to the EBS control plane, which operates across all
Availability Zones within a region. The control plane, which in addition to handling EBS partner node requests, also
processes requests for new volumes, became backed up with requests that it could not fulfil. By 5:30 AM PDT, the
control plane began failing all requests, not just within the originally affected Availability Zone, but in all zones within
the region. Eventually, Amazon engineers had to disable communications between the affected EBS clusters and the
EBS control plane to minimize impact on the other Availability Zones within the region. By 12:04 PM PDT, the outage
was confined to only the originally affected Availability Zone (Amazon, 2011).
To address the original problem of “stuck” EBS nodes, Amazon had to install additional capacity in the affected
Availability Zone, which meant physically moving and then installing additional servers in the Availability Zone.
Amazon then gradually restored communications between the affected EBS nodes and the EBS control plane. The
rd
process of restoring communications took the entire day of April 23 . By then, the majority of affected EBS nodes
were functional, a minority of which required a manual recovery process. The manual recovery process was
th
completed by 3:00 PM PDT on April 24 , at which point all but 0.07% of affected nodes were fully restored (Amazon,
2011).Analysis Emerging Risk Report 2018 Technology
5. Analysis                                                                                                                  27

5. Analysis

This section presents a detailed analysis of both ground-          This can be done through either a market share
up and gross losses for the modelled scenarios,                    approach, or a detailed accumulation approach. In the
specifically, three combinations of ground up, gross               market share approach, the set of impacted companies is
insurable, and gross insured losses using the detailed             determined by randomly sampling a population of
accumulation approach described in the preceding                   companies. A particular company is deemed to be
section. Because of the very low take-up rates of cyber            impacted by a cloud’s downtime with probability p, where
policies outside the US, this analysis focuses on the              p is equal to the market share of the cloud service
nearly 12.4 million companies in the US. The same                  provider. To obtain a more accurate estimate of losses,
analysis is also applied to the Fortune 1000 companies.            the population may be sampled multiple times, with
The results will also be split by a number of variables,           losses averaged over the various samples to create a
allowing for a comparison of losses by:                            sensible estimate, or to infer the degree of uncertainty in
                                                                   loss estimates.
     −        Industry
     −        Company size (Fortune 1000 vs. industrywide)         In the detailed accumulation approach, the set of
                                                                   impacted companies is known precisely using data from
                                                                   an external source or the insured themselves. Because
Additionally, this report provides a comparison of loss            current market practice for insurers is generally not to ask
numbers using the detailed accumulation approach to                potential insureds for a detailed list of service providers,
those loss numbers that would be obtained using a                  many insurers do not have such data available.
market share approach.                                             Additionally, small companies may not be tracked by
                                                                   external sources. Therefore, the market share approach
                                                                   is also used to supplement the detailed accumulation.
                                                                   The analysis in this paper compares both approaches. In
Ground-up loss computation                                         the future, systematic collection of this type of data will
The preceding section fully describes the downtime of the          enable a better understanding of the technology at risk
modelled cloud service provider. However, additional               from cyber-attacks.
parameters are required to model the impact of the
above scenario on U.S. businesses:                                 Business interruption losses from lost cloud
                                                                   access
     −        Set of affected companies
                                                                   Once the set of affected companies has been
     −        Business interruption and contingent business        determined, it is necessary to determine what business
              interruption losses due to inability to access the   interruption losses are incurred as a consequence of a
              cloud                                                failure to access the cloud. Clearly, different companies
                                                                   use the cloud for different purposes, and a single
     −        Backup plans and recovery process
                                                                   company may use the cloud for different purposes that
This section describes and provides values for these               are not equally important to its operations. In this paper,
parameters, and briefly discusses how they were                    business interruption losses are computed using an
obtained.                                                          industry dependent set of factors equal to the percentage
                                                                   of a company’s turnover from e-business. These factors
Set of affected companies                                          are found in Figure 10.

The first step is to determine how many companies are
affected by the cloud’s downtime.
5. Analysis 28
Figure 10: E-Business factors by industry
1
0.75
0.5
0.25
0
Wholesale Trade
Retail Trade
Information
Real Estate and Rental and Leasing
Arts, Entertainment, and Recreation
Other Services (except Public
Professional, Scientific, and Technical
Finance and Insurance
Manufacturing
Educational Services
Accommodation and Food Services
Transportation and Warehousing
Other Industries
Management and Remediation Services
Administrative and Support and Waste
Administration)
Services
Source: US Census Bureau, 2015
Business interruption estimation factors E-commerce shipments (e-shipments) are online orders
accepted for manufactured products from customers,
The numeric factors used to calculate daily business including shipments to other domestic plants of the same
interruption losses are computed as percentages of company for further manufacture, assembly, or
turnover that would be affected by downtime for a given fabrication where price and terms of sale are negotiated
industry. Figure 10 considers both business to consumer over the Internet, Extranet, EDI network, electronic mail,
(B2C) and business to business (B2B) e-business or other online system. Payment may or may not be
transactions. Business to consumer e-business is made online” (US Census Bureau, 2016). The data in this
primarily found in the retail sector, while business to study includes the components mentioned above. The
business e-business is found in manufacturing and term e-business, as used in this paper, is defined in more
wholesale industries. In fact, the data show that B2B e- detail in Appendix C.
business far exceeds B2C commerce, with B2B e-
business projected to achieve $12 trillion in sales The business interruption estimation factors in this paper
worldwide by 2020, for a compound annual growth rate of are calculated by using the US e-commerce data source
8.11% (Frost & Sullivan, 2017). 2014 U.S. Census data (US census, e-commerce) that includes shipments, sales
shows that as a percentage of total shipments, sales, and and revenues from various sectors of the economy:
turnover, manufacturing e-business leads the way at manufacturing, wholesale, services and retail. The
60.9%, followed by merchant wholesale trade at 27.7%, services sector includes industries like utilities, finance
and trailed by total retail trade at 6.4%. The US Census and insurance, educational services, information,
Bureau indicates that “E-commerce sales/turnovers are healthcare, etc.
sales of goods and services where the buyer places an
order, or the price and terms of the sale are negotiated AIR has calculated the business interruption estimation
over the Internet, mobile device (m-commerce), Extranet, factors for the other industries including agriculture,
Electronic Data Interchange (EDI) network, electronic mining and quarrying, by assuming the e-business factor
mail, or other comparable online system. to be the minimum of the set of all available e-business
factors.You can also read