SIZE-BASED ASSESSMENT OF DATA-LIMITED INLAND FISH STOCKS - REVIEW AND APPLICATIONS - FAO Fisheries and Aquaculture Circular NFIF/C1214 (En)
←
→
Page content transcription
If your browser does not render page correctly, please read the page content below

NFIF/C1214 (En)

                                                 FAO
                                       Fisheries and
                                 Aquaculture Circular

                                            ISSN 2070-6065

SIZE-BASED ASSESSMENT OF DATA-LIMITED INLAND
FISH STOCKS – REVIEW AND APPLICATIONS
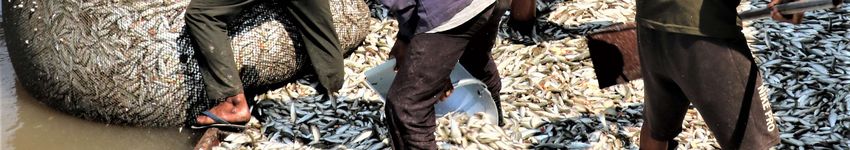
Cover image: Composite graphics from this issue, photograph showing sábalo fisheries in the Paraná
River. © FAO/Claudio Baigún.
FAO Fisheries and Aquaculture Circular No. 1214                                     NFIF/C1214 (En)

 SIZE-BASED ASSESSMENT OF DATA-LIMITED INLAND
 FISH STOCKS – REVIEW AND APPLICATIONS

 Samuel Shephard
 Senior Research Officer
 Inland Fisheries Ireland
 Dublin, Ireland

 John Valbo-Jorgensen
 Fishery Resources Officer
 FAO Fisheries Division, Rome, Italy

 Jorge Abadía
 Biologist
 Dirección General de Investigación y Desarrollo
 Autoridad de Recursos Acuáticos de Panamá, Panama City, Panama

 Claudio Baigún
 Principal Investigator
 CONICET-Universidad Nacional de General San Martín, Buenos Aires, Argentina

 Carolina R. C. Doria
 Laboratory Coordinator
 Universidade Federal de Rondônia, Porto Velho, Rondônia, Brazil

 Nidia N. Fabré
 Principal Investigator
 Universidade Federal de Alagoas, Maceió, Alagoas, Brazil

 Victoria J. Isaac
 Full Professor
 Universidade Federal do Pará, Belém, Pará, Brazil

 Ngor Peng Bun
 Fish Community Ecologist
 Inland Fisheries Research and Development Institute
 Fisheries Administration, Phnom Penh, Cambodia

 Mauro L. Ruffino
 Interim Coordinator
 Permanent Secretariat, Amazon Cooperation Treaty Organization, Brasilia, Federal District, Brazil

 Simon J. Funge-Smith
 Senior Fishery Resources Officer
 FAO Fisheries Divison, Rome, Italy

   FOOD AND AGRICULTURE ORGANIZATION OF THE UNITED NATIONS
                         Rome, 2020
Required citation:
Shephard, S., Valbo-Jorgensen, J., Abadía, J., Baigún, C., Doria, C.R.C., Fabré, N.N., Isaac, V.J., Ngor, P.B., Ruffino, M.L. and
Funge-Smith, S.J. 2020. Size-based assessment of data-limited inland fish stocks – Review and applications. FAO Fisheries
and Aquaculture Circular No.1214. Rome, FAO.

The designations employed and the presentation of material in this information product do not imply the expression of any opinion
whatsoever on the part of the Food and Agriculture Organization of the United Nations (FAO) concerning the legal or development
status of any country, territory, city or area or of its authorities, or concerning the delimitation of its frontiers or boundaries. The
mention of specific companies or products of manufacturers, whether or not these have been patented, does not imply that these
have been endorsed or recommended by FAO in preference to others of a similar nature that are not mentioned.

The views expressed in this information product are those of the author(s) and do not necessarily reflect the views or policies of
FAO.

ISBN 978-92-5-133502-4

© FAO, 2020

Some rights reserved. This work is made available under the Creative Commons Attribution-NonCommercial-ShareAlike 3.0 IGO
licence (CC BY-NC-SA 3.0 IGO; https://creativecommons.org/licenses/by-nc-sa/3.0/igo/legalcode).

Under the terms of this licence, this work may be copied, redistributed and adapted for non-commercial purposes, provided that
the work is appropriately cited. In any use of this work, there should be no suggestion that FAO endorses any specific organization,
products or services. The use of the FAO logo is not permitted. If the work is adapted, then it must be licensed under the same
or equivalent Creative Commons licence. If a translation of this work is created, it must include the following disclaimer along with
the required citation: “This translation was not created by the Food and Agriculture Organization of the United Nations (FAO).
FAO is not responsible for the content or accuracy of this translation. The original [Language] edition shall be the authoritative
edition.”

Disputes arising under the licence that cannot be settled amicably will be resolved by mediation and arbitration as described in
Article 8 of the licence except as otherwise provided herein. The applicable mediation rules will be the mediation rules of the
World Intellectual Property Organization http://www.wipo.int/amc/en/mediation/rules and any arbitration will be conducted in
accordance with the Arbitration Rules of the United Nations Commission on International Trade Law (UNCITRAL).

Third-party materials. Users wishing to reuse material from this work that is attributed to a third party, such as tables, figures or
images, are responsible for determining whether permission is needed for that reuse and for obtaining permission from the
copyright holder. The risk of claims resulting from infringement of any third-party-owned component in the work rests solely with
the user.

Sales, rights and licensing. FAO information products are available on the FAO website (www.fao.org/publications) and can be
purchased through publications-sales@fao.org. Requests for commercial use should be submitted via: www.fao.org/contact-
us/licence-request. Queries regarding rights and licensing should be submitted to: copyright@fao.org.

i
PREPARATION OF THIS DOCUMENT
The preparation of this circular was funded by FAO’s regular programme. In 2016, the Thirty-second
Session of the Committee on Fisheries (COFI) inter alia recommended “the development of an effective
methodology to monitor and assess the status of inland fisheries ... to support their management”. COFI
requested that FAO develop such an assessment methodology. This was echoed by the first Advisory
Roundtable on the Assessment of Inland Fisheries, which FAO organized in 2018 in partnership with
the United States Geological Service and Michigan State University to provide guidance on possible
ways to proceed with the assessment of inland fisheries. The roundtable highlighted the need for tools
to assess the status of inland fisheries that take into consideration the data-poor situation, and the
constraints on human and financial resources that characterizes many of the countries most reliant on
inland fisheries resources.
Following the advice of the roundtable, a study was initiated to review and test length-based assessment
methods that are based on fish life-history parameters and require few types of data that can be obtained
with low effort and cost, and that have already been successfully tested on tropical marine small-scale
fisheries, but only to a limited extent in freshwater fisheries. This should be considered a first step
towards developing indicators that are intuitive and easily understood by different stakeholders, and can
inform the managers about the performance of the management plan developed under an ecosystem
approach to fisheries management, which is the tool that FAO is promoting as the most appropriate for
the management of inland fisheries,
The literature review and data analysis were performed by Samuel Shephard, Inland Fisheries Ireland
Dublin, Ireland. The following researchers and their institutions provided data for analysis, participated
in the interpretation of the results, and wrote an introduction for each case study:
Nile tilapia, Lago Bayano, Panama: Jorge Abadía, Dirección General de Investigación y
Desarrollo, Autoridad de Recursos Acuáticos de Panamá, Panama City, Panama.
Sábalo, Paraná Basin, Argentina: Claudio Baigún, Instituto de Investigación e Ingeniería
Ambiental, CONICET-Universidad Nacional de General San Martín, Buenos Aires,
Argentina.
Goliath catfishes, Amazon Basin: Carolina Doria, Laboratório de Ictiologia e Pesca,
Departamento de Biologia, Universidade Federal de Rondônia, Porto Velho, Rondônia,
Brazil; Nidia Fabré, Institute of Biological Sciences and Health, Universidade Federal de
Alagoas, Maceió, Alagoas, Brazil; Victoria Isaac, Núcleo de Ecologia Aquática e Pesca da
Amazônia, Universidade Federal do Pará, Belém, Pará, Brazil; and Mauro Ruffino,
Permanent Secretariat. Amazon Cooperation Treaty Organization, Brasilia, Federal District,
Brazil.
Dai fishery, Tonlé Sap River: Ngor Peng Bun, Inland Fisheries Research and Development
Institute, Fisheries Administration, Phnom Penh, Cambodia.
The outcomes of the work were presented to a panel of international experts in 2019 at a second
roundtable for constructive feedback and identification of the limitations.
John Valbo-Jorgensen, Simon Funge-Smith and Valérie Schneider, FAO, coordinated the work, and
edited and formatted the document.
ABSTRACT
Assessment of data-limited fish stocks is a rapidly evolving topic in marine fisheries, and is supported
by an increasing focus on the socio-economic and ecological importance of small-scale fisheries. The
challenges in such systems can be compounded in inland fisheries, which are often complex, spatially
dispersed and difficult to monitor. This publication reviews the application of empirical indicators and
simple size-based models usually used in marine fisheries, but also applicable in inland systems. It
presents case study applications for important fisheries in the Amazon River (Brazil), Tonlé Sap River
(Cambodia), Paraná River (Argentina) and Lago Bayano (Panama). These studies consider issues
including spatial separation of life-history stages, strong modality in population size structure, and
fishing gear selectivity. Local scientific experts interpreted trends in stock state. Empirical indicators
showed strong decline in size structure and relative abundance for one of the four assessed Tonlé Sap
stocks. The length-based spawning potential ratio model suggested that two of the three assessed
Amazon Goliath catfish stocks, and the sábalo stock in the Paraná River, were below sustainable
spawning potential ratio reference points. The Lago Bayano tilapia stock appeared healthy. The review
concludes that data-limited assessment methods developed for marine stocks may provide guidance for
the sustainable management of important target species in inland fisheries. The methods tested are
probably less applicable in non-selective fisheries where small species are preferred, or in river fisheries
with extreme dependence on flood pulses. Important considerations are species life history and spatial
distribution, environmental variability, and fishery sampling strategy.

iii

CONTENTS

Preparation of this document........................................................................................................................................i
Abstract ................................................................................................................................................................................ ii
Acknowledgements ......................................................................................................................................................... v
Abbreviations and acronyms ..................................................................................................................................... vii
1        Introduction .............................................................................................................................................................. 1
2        Empirical indicators............................................................................................................................................... 2
3        Indicators from size-based models ................................................................................................................. 6
4        Expert knowledge ................................................................................................................................................... 7
5        Hydroecological pressures................................................................................................................................10
6        Case studies .............................................................................................................................................................11
    6.1           “Dai” (fixed bagnet) fishery, Tonlé Sap, Mekong River (Cambodia) ......................................18
         6.1.1             Introduction to the Tonlé Sap system and Dai fishery .......................................................18
         6.1.2             Data collection on length ................................................................................................................20
         6.1.3             Analysis ..................................................................................................................................................21
         6.1.4             Results ....................................................................................................................................................21
         6.1.5             Interpretation......................................................................................................................................22
    6.2           Goliath catfish, Amazon River (Brazil) ...............................................................................................23
         6.2.1             Introduction to the Amazon system and fisheries ...............................................................23
         6.2.2             Data collection ....................................................................................................................................25
         6.2.3             Analysis ..................................................................................................................................................27
         6.2.4             Results ....................................................................................................................................................30
         6.2.5             Interpretation......................................................................................................................................34
    6.3           Nile tilapia, Lago Bayano (Panama).....................................................................................................35
         6.3.1             Introduction to the Lago Bayano system and fishery .........................................................35
         6.3.2             Analysis ..................................................................................................................................................36
         6.3.3             Results ....................................................................................................................................................36
         6.3.4             Interpretation......................................................................................................................................38
    6.4           Sábalo, Paraná River (Argentina) .........................................................................................................39
         6.4.1             Introduction to the Paraná River system and fishery ........................................................39
         6.4.2             Analysis ..................................................................................................................................................40
         6.4.3             Results ....................................................................................................................................................41
         6.4.4             Interpretation......................................................................................................................................43
7        Discussion ................................................................................................................................................................44
iv

    7.1       Applications in inland small-scale fisheries .....................................................................................44
    7.2       Using data-limited assessment in management .............................................................................46
    7.3       Summary .........................................................................................................................................................48
8     References................................................................................................................................................................49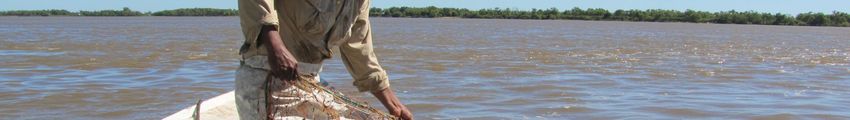
v

ACKNOWLEDGEMENTS
In addition to the authors, the following people reviewed the work during the Second Advisory
Roundtable on the Assessment of Inland Fisheries, organized in Rome, Italy, on 25–27 November 2019:
Ian G. Cowx and Rachel Ainsworth, Hull International Fisheries Institute, School of Environmental
Sciences, University of Hull, United Kingdom of Great Britain and Northern Ireland; William Taylor
and Devin M. Bartley, Department of Fisheries and Wildlife, Michigan State University, United States
of America; T. Douglas Beard, Jr, and Abigail Lynch, National Climate Change and Wildlife Science
Center, United States Geological Survey, United States of America; Michael Cooperman, Omega
Advisors, New York, United States of America; Jeppe Kolding, Department of Biological Sciences,
University of Bergen, Norway; David Lymer, Sötvattenslaboratoriet, Sweden; Alexis Peña, Dirección
General de Investigación y Desarrollo, Autoridad de Recursos Acuáticos de Panamá, Panama; Gretchen
Stokes, National Science Foundation Graduate Research Fellow School of Natural Resources and
Environment, University of Florida, United States of America; Paul van Zwieten, Aquaculture and
Fisheries Group, Wageningen University, Netherlands; Derek Vollmer, Betty and Gordon Moore
Center for Science, Conservation International, United States of America; Olaf Weyl, DST/NRF
Research Chair in Inland Fisheries and Freshwater Ecology, South African Institute for Aquatic
Biodiversity, South Africa; and the following FAO Fisheries and Aquaculture Department staff
members: Felix Marttin, Cherif Touelib, Nicolas Gutierrez and Rishi Sharma.

vi
vii

ABBREVIATIONS AND ACRONYMS
BOFFFF        big old fat fecund female fish
CPUE          catch per unit of effort
EAFm          ecosystem approach to fisheries management.
F             fishing mortality
F/M           relative fishing mortality
GTG LB-SPR length-structured version of the LB-SPR model that uses growth-type groups (GTG)
           to account for size-based selectivity
HCR           Harvest control rule.

K             growth coefficient (expresses the rate at which the asymptotic length [L∞] is
              approached)

L∞/Linf       asymptotic body length (the length that the fish of a population would reach if they
              were to grow indefinitely)
Lc            length at first capture

LF=M          length-based proxy for MSY where LF=M = 0.75Lc+ 0.25 L∞
Lmat          length of a species at maturity in a population
Lmat50%       size at which 50 percent of the population of a given species becomes sexually mature
Lmat95%       size at which 95 percent of the population of a given species becomes sexually mature
Lmax          maximum length of a given species in a population
Lmax5%        mean length of largest 5 percent of the individuals of a species in a population
Lmean         mean length of individuals larger than the length at first capture (Lc)

Lopt          length that maximizes fishery yield (= 2/3 L∞)
LB-SPR        length-based spawning potential ratio (approach that compares the observed length
              composition of a fishery catch and the theoretical length distribution of the stock in an
              unfished state and calculates the spawning potential ratio)
LBI           length-based indicator
LEK           local ecological knowledge
LFI           large fish indicator
M             natural mortality (M = Z - F).
M/K           ratio of natural mortality to growth rate
MP            management procedure
MSE           management strategy evaluation
MSFD          European Union Marine Strategy Framework Directive.
MSY           maximum sustainable yield
Pmat          proportion of fish in the catch that are larger than Lmat
Pmega         proportion of fish larger than Lopt + 10 percent
viii
Pobj composite indicator of population size structure (Pobj = Pmat + Popt + Pmega)
Popt proportion of fish larger than Lopt
RP reference point
SL standard length (i.e. length of the fish excluding the caudal fin)
SPR spawning potential ratio (the proportion of unfished reproductive potential left
at any given level of fishing pressure)
SSB spawning stock biomass
TL total length (i.e. length from the most anterior to the most posterior part of the fish)1 1 INTRODUCTION Constraints on fisheries survey infrastructure (Costello et al., 2012) or time (Bentley, 2015) mean that many fish stocks remain “data-limited”. According to FAO, slightly more than 10 percent of the world’s commercially fished marine fish stocks are assessed (FAO, 2010), and unassessed stocks may be in a generally worse state (Costello et al., 2012). Many stocks supporting small-scale and subsistence coastal or inland fisheries are unassessed. Inland fisheries are extremely important to numerous rural communities (Smith, Khoa and Lorenzen, 2005; Lynch et al., 2016), and make a critical dietary contribution in low food-security regions (Kawarazuka and Béné, 2010; McIntyre, Liermann and Revenga, 2016). However, despite their socio-economic relevance, inland fisheries are often poorly monitored, resulting in unreliable catch estimates, which limit understanding of the status of fished stocks (Welcomme et al., 2010; Beard et al., 2011; Bartley et al., 2015; Fluet-Chouinard, Funge-Smith and McIntyre, 2018). There is now an imperative to develop and apply appropriate methods for the assessment of data-limited inland fish stocks (Cooke et al., 2016). There is much to be gained by sharing ideas between marine and inland fisheries systems (Cooke et al., 2014), and also between commercial and recreational fisheries (Cooke and Cowx, 2006). Data-limited stock assessment methods are well developed in the marine environment, but many inland fisheries scientists and managers are unaware of their availability and potential (Lorenzen et al., 2016). Management using reference points is correspondingly much less prevalent in inland fisheries (Welcomme, 2001). The science of small-scale fisheries encompasses inland waters, but addressing the complex, persistent or reoccurring (Khan and Neis, 2010) problems of these highly complex social- ecological systems will require a broadening of perspectives that cuts across academic disciplines (Jentoft and Chuenpagdee, 2019). The desirable outcome of biologically sustainable fisheries depends on maintaining spawning stock biomass (SSB) and preventing significant truncation of age structure (Hsieh et al., 2006). Size-selective fishing pressure typically depletes a population and simultaneously curtails the upper end of the size distribution. In situations of limited data, empirical (“model-free”) indicators can capture trends in both components: abundance indices (e.g. catch per unit of effort [CPUE]), and demography (McDonald et al., 2017). Such indicators are not typically data- or expertise-hungry (Geromont and Butterworth, 2015) and can be derived for important stocks in many data-poor fisheries (Chrysafi and Kuparinen, 2016). Depending on data availability, they can provide anything from a robust state assessment down to “a rough indication of the state of a fishery” (Lorenzen et al., 2016). These characteristics suggest that simple empirical indicators offer a tractable starting point for assessment of important single stocks within assemblages supporting very data-poor inland fisheries. Empirical indicators are frequently used for single species and stocks, but have also been incorporated into broader frameworks to support an ecosystem approach to fisheries management (EAFm). Indicators that are close to raw observational data and require limited permutations and few assumptions were selected as preferable for an EAFm on Lake Malawi (van Zwieten, Banda and Kolding, 2011). A well-developed marine example is the European Union’s Marine Strategy Framework Directive (MSFD), which has implemented a broad suite of ecological indicators to monitor the state of the marine environment across the whole of the Northeast Atlantic. The MSFD identifies “population age and size distributions” as indicators of the health of a stock (Probst, Kloppmann and Kraus, 2013), and applies the large fish indicator (LFI; Greenstreet et al., 2010; Shephard, Reid and Greenstreet, 2011) as an indicator of community size distribution. The LFI captures the proportion of “large” fish in the assemblage, and thus reflects both size-selective fishing and recruitment of small fish/species. Community-level indicators are probably the only realistic option where many species are harvested together and their management cannot be separated, e.g. in inherently multispecies tropical fisheries (Kolding and van Zwieten, 2014; Lorenzen et al., 2016). Ecological indicators (e.g. of fish population or community state) can be used “operationally”, having well-understood pressure–state relationships and objective management reference points (RPs). Model- free management procedures (MPs) using empirical indicators have the potential to be effective as the
2

basis for decision-making in data-limited fisheries (Dowling et al., 2015; McDonald et al., 2017) and
may be a good starting point for single-species fisheries that may later move towards management using
simple models (Babcock et al., 2013; Bentley, 2015). Empirical MPs based on relative abundance or
mean length have shown considerable promise by consistently satisfying conservation performance
metrics (Geromont and Butterworth, 2015; Sagarese et al., 2018). Alternatively, indicators may take a
“surveillance” role in tracking ecological state, providing complementary information (including
warning signals) that inform and support science, policy and management (Shephard et al., 2015).
Surveillance indicators may be an accessible tool for acquiring basic understanding of the state of
currently unassessed fish stocks in diverse inland systems (Shephard et al., 2019a). Users could be co-
management groups that need only an approximate impression of state to inform technical measures or
“nudges” in fishing behaviour (Mackay et al., 2018), or “barefoot ecologists” (Prince, 2003) working
at the local level in complex small-scale systems (Andrew et al., 2007).
Empirical and reference direction approaches should not mask the fact that “there is no substitute for
better data” (Dowling et al., 2018). Where applicable, model-based methods can strongly reduce
assessment uncertainty in data-limited situations, and potentially have the significant advantage of
incorporating management RPs. A promising single-species assessment tool is the length-based
spawning potential ratio (LB-SPR) model (Hordyk et al., 2015a, 2015b, 2016). The spawning potential
ratio (SPR) is defined as the proportion of unfished reproductive potential left at any given level of
fishing pressure (Goodyear, 1993; Walters and Martell, 2004), and is commonly used to set target and
limit RPs for fisheries. The unfished length distribution of a fish population can be predicted from the
ratio of natural mortality to growth rate (M/K), when the von Bertalanffy asymptotic length (L∞) is
known. Inputs of length at maturity (Lmat) then allow unfished spawning potential to be estimated from
expected numbers of fish at size (Hordyk et al., 2015b). The LB-SPR approach uses maximum
likelihood methods to find the values of relative fishing mortality (F/M) and selectivity-at-length that
minimize the difference between the observed length composition of a fishery catch and the expected
(predicted) length distribution, and calculates the resulting SPR. The estimated SPR can then serve as
an indicator of the status of the stock for management of the fishery. The LB-SPR approach has been
applied convincingly to assessment of tropical reef fisheries (Prince et al., 2015; Babcock, Tewfik and
Burns-Perez, 2018), where fishers have participated in data collection, but has yet to be widely tested
in freshwater environments.
There have been several authoritative reviews of data-limited fish stock assessment and management
frameworks (e.g. Dowling et al., 2015; Geromont and Butterworth, 2015), but these works typically
focus on marine systems. The aim of this review is to provide a brief summary of available empirical
indicator frameworks that can be applied at fish-stock and assemblage levels, with the objective of
evaluating the potential for application in resource- and capacity-constrained inland fisheries. Size-
based indicators are considered because these may be most accessible in tropical multispecies fisheries,
where even basic life-history information may be lacking. A simple framework for visual presentation
of size-based surveillance metrics is applied; this approach supports elicitation of expert knowledge of
stock trends (Shephard et al., 2019a). The LB-SPR approach is then implemented for stocks where input
life-history parameters are available. Case study applications are provided for inland fish stocks in
Southeast Asia, and Central and South America.

2 EMPIRICAL INDICATORS
Some data-limited fisheries are monitored using landings records and estimates of CPUE. Harvest
control rules (HCRs) based on CPUE are used to manage at least 13 marine stocks in Australian
scalefish and shark fisheries (Little et al., 2011) as well as rock lobster fisheries (Punt et al., 2012).
However, a common problem with catch information is misreporting at various levels, from individual
vessels up to national statistics. Bartley et al. (2015) discuss the range of issues that affect the reliability
of inland fisheries data. In inland systems, CPUE-based assessments have so far been most successful
in the recreational fisheries of developed countries, where there is adequate funding and infrastructure
to support rigorous data collection and analysis. The context is completely different in developing
3

countries with complex subsistence fisheries, where investment in monitoring is limited and there is
little or no understanding of stock status (Bartley et al., 2015). Capacity building in sample design and
application is essential to avoid statistical errors (Cowx et al., 2003; De Graaf et al., 2015). In large
rivers, for example, even if catch can be assessed at main landing ports, effort is difficult to estimate as
fish are collected and landed by intermediaries, and effort data can therefore not be easily computed. In
these systems, household surveys (Neiland et al., 2000; Beard et al., 2011; Fluet-Chouinard, Funge-
Smith and McIntyre, 2018) have been used to indirectly estimate catch volumes, but are rarely able to
give an idea of catch trends or stock status.
Size-based approaches may work better than CPUE in such systems. Fishing is typically size-selective,
removing the largest individuals and species. This impact can change the size and trophic structure of
individual populations and of the whole fish community, and has been widely observed, including in
tropical river fisheries (Fabré et al., 2017; Doria, Lima and Angelini, 2018; Van Damme et al., 2019).
A large number of ecological indicators have been proposed for the evaluation of fishing-induced
change in fish population and community size structure (Rochet and Trenkel, 2003; Shin et al., 2005).
These indicators can track fishing pressure even in changing environmental conditions, including
climatic variation (Blanchard et al., 2005; Shin et al., 2018). An important advantage of length-based
indicators (LBIs) is that they require only a representative length frequency for the sampled stock or
assemblage. This information can be derived from fisheries-independent surveys or from catch. Local
fishers have participated in some surveys, providing reliable and cheap length-frequency data for
assessment (Ticheler, Kolding and Chanda, 1998; Prince et al., 2015; Van Damme et al., 2019).
Often, LBIs are combined with information on life-history characteristics, such as Lmat, to compare
empirical length-structure and size-based fishing rate with theoretical values that could represent RPs.
Froese (2004) suggested a “simple” set of three LBIs: Pmat (the proportion of fish in the catch that are
larger than Lmat); Popt (the proportion of fish larger than optimal harvest length [the length that
maximizes fishery yield, Lopt = 2/3 L∞]); and Pmega (the proportion of fish larger than Lopt + 10 percent).
However, a simulation study by Cope and Punt (2009) showed that the three Froese (2004) LBIs are
not always sufficient to ensure protection from overfishing. They combined the LBIs to provide a new
measure that they call Pobj (Pobj = Pmat + Popt + Pmega) that can distinguish the fishery selection pattern
and that informs a decision tree to determine whether SSB is above a target RP. The Froese (2004)
indicators have subsequently been extended into a suite of LBIs (Table 1) that have associated RPs for
assessment of stock status relative to proxies for maximum sustainable yield (MSY; ICES, 2015), and
which support a traffic-light framework (Caddy et al., 2005).

.
4

Table 1: Length-based indicators and maximum sustainable yield proxy reference points suggested
by WKLIFE V

                                                                        Current
 Statistic         Calculation           Threshold       Indicator     reference       Property
                                                                         point

 Lmax5%      Mean length of largest          L∞          Lmax5% /L∞      > 0.8     Conservation of
             5%                                                                    large individuals

 L95%        Ninety-fifth percentile         L∞           L95% /L∞       > 0.8
             of length

 Pmega       Proportion of                 0.3–0.4          Pmega        > 0.3
             individuals above Lopt +
             10%

 L25%        Twenty-fifth percentile         Lmat        L25% /Lmat      > 0.3     Conservation of
             of length distribution                                                immature
                                                                                   individuals
 Lmean       Mean length of                  Lmat        Lmean/Lmat       >1
             individuals larger than
             Lc

 Lc          Length at first catch           Lmat          Lc /Lmat       >1
             (length at 50% of
             mode)

 Lmean       Mean length of              Lopt = 2/3L∞    Lmean /Lopt      ≈1       Optimal yield
             individuals larger than
             Lc

 Lmean       Mean length of                 LF=M=        Lmean/LF =M      ≥1       Maximum
             individuals larger than      (0.75Lc +                                sustainable yield
             Lc                            0.25L∞)

Source: Adapted from ICES, 2015.

The Froese (2004) indicators and Cope and Punt (2009) decision tree have been applied effectively to
some important stocks in a number of small-scale reef fisheries in Belize (Babcock et al., 2013;
Babcock, Tewfik and Burns-Perez, 2018) and Haiti (Karnauskas et al., 2011). These studies were able
to produce informative estimates of fish-stock state, which concurred with estimates from simple
model-based assessments (see below).
However, even using the Cope and Punt (2009) approach, it remains difficult to define robust stock-
specific RPs. Empirical methods are good at providing insight into the direction of stock status, but
cannot provide an objective indication of whether a stock is currently healthy or sustainably fished. The
ability to use objective RPs is an advantage of model-based methods (see below).
In inland systems, the ICES (2015) LBIs and the Cope and Punt (2009) decision tree have been applied,
as far as this review found, only to assessment of resident (Fitzgerald, Delanty and Shephard, 2018; and
Table 2) and migratory (Shephard et al., 2018; 2019a) trout (Salmo trutta) stocks.
5
Table 2: Annual assessments using length-based indicators calculated for an inland fish (Salmo
trutta) stock
Length-
Lmean/ Lc/ L25%/ Lmean/ Lmean/ L95%/ Lmax5%/
based Pmega
LF=M Lmat Lmat Lmat Lopt L∞ L∞
indicator
Reference
≥ 1.0 > 1.0 > 0.3 > 1.0 ≈ 1.0 > 0.8 > 0.8 > 0.3
point
1978 1.01 0.70 0.87 1.04 0.78 0.68 0.72 0.02
1994 1.09 0.70 0.87 1.12 0.84 0.83 0.85 0.13
1998 1.15 0.63 0.73 1.12 0.84 0.90 0.96 0.25
2001 1.15 0.70 0.90 1.18 0.88 0.87 0.93 0.24
2005 1.11 0.77 0.93 1.20 0.90 0.85 0.89 0.18
2006 1.13 0.83 0.93 1.27 0.95 0.97 1.01 0.25
2013 1.12 0.70 0.93 1.15 0.86 0.82 1.00 0.16
Notes and sources: The reference points (RPs) for each indicator are from ICES (2015). Green indicates that the
LBI value reaches or exceeds the RP in the assessment year (adapted from Fitzgerald, Delanty and Shephard,
2018).
In the latter case, it was found that the RPs proposed by ICES (2015) should be adjusted for sea trout
and perhaps other diadromous fish in order to account for differences in life history, such as survival to
old age, which shape resilience to fishing. This study did not consider how indicators might be
combined, e.g. “one out, all out”, to produce an overall evaluation of state, which complicates reaching
decisions on the state of a stock.
Length-based indicators have also been applied to assessment of lamprey stocks sampled as juveniles
(Shephard et al., 2019b), and this concept may have some application in inland fisheries targeting
juvenile potamodromous fishes. Size-based indicators have been combined with CPUE to support a
model-free fisheries assessment framework (McDonald et al., 2017). Harvest control rules based on
RPs for mean length in the catch can achieve certain management objectives (Klaer, Wayte and Fay,
2012; Jardim, Azevedo and Brites, 2015), although accounting for uncertainty in length at age is
important, and the HCRs may not be effective for stocks, or assemblages (see below), fished well before
size at maturity.
At the community and ecosystem level, size-based metrics show relatively consistent responses to
selective fisheries, and “unfished” indicator RPs may be predicted (Rochet and Trenkel, 2003; Jennings
and Dulvy, 2005). Selection and application of size-based indicators (Rochet and Rice, 2005; Shin et
al., 2005) have been advanced by the ongoing IndiSeas Working Group (e.g. Shin et al., 2010). Size-
based indicators for ecological monitoring have been implemented at a large scale under the European
Union’s MSFD. The most developed example is the LFI, which is listed under MSFD Descriptor 4
Food Webs. The LFI describes the proportion of large fish in the community (Greenstreet et al., 2010),
mainly reflecting change in abundance of large species rather than large individuals within species
(Shephard et al., 2012). The LFI can be interpreted for different communities (Shephard, Reid and
Greenstreet, 2011) and can robustly track fishing pressure in size-selective fisheries (Halouani et al.,
2019). Such an approach has been proposed to assess the health of inland fisheries based on the capture
of large migratory species (Baigún, 2015).6 A contrasting situation can be evident in multispecies fisheries using non-selective gear, e.g. in the African Great Lakes. In this case, there is no obvious curtailment of length structure, and the fishery approximates to balanced harvesting (Kolding and van Zwieten, 2014; Kolding et al., 2016). In these systems, small fish can be preferred by consumers, and so fishery activity may occur rather evenly across the fish-community size spectrum. This pattern of fishing does not curtail the size distribution, but rather maintains the size-spectrum slope while diminishing overall biomass. Size-based indicators will not capture fishing impacts at the species or assemblage level in these situations. A similar case may be found in floodplain fisheries where the juveniles of annually recruiting species are caught by non-selective traps as the annual flood pulse contracts back into the main river channel. In inland systems, Welcomme (1999) reviewed the use of assemblage-level LBIs for monitoring tropical floodplain river fish communities, where fisheries can still be size- and species-selective (Hallwass and Silvano, 2016; Doria, Lima, and Angelini, 2018). Length-based indicators were included in a diverse suite of indicators evaluated for an EAFm framework in Lakes Malawi and Malombe, where strong temporal shifts from larger to smaller species have been observed (van Zwieten, Banda and Kolding, 2011). Mean length of fish declined across species with successive de-watering events (deliberate draining of small ponds and swamps for irrigation and/or fish harvesting) in wetlands of the lower Mekong River (Martin et al., 2011). A set of empirical indicators was shown to capture fishing- induced changes in the fish community of the Tonlé Sap (Ngor et al., 2018). The Tonlé Sap study is of interest because it successfully demonstrates the use of indicators based on size and life history to describe temporal change in relative abundance of large and small fish species in a heavily fished multispecies inland fishery. Changes in mean length in the sábalo fishery were also demonstrated by Baigún, Minotti and Oldani (2013) in the Paraná River in response to increased fishing pressure resulting from a growth in export of fish products. The diminishing stocks of larger fish species (and compensation effects among smaller species) observed in this study are in common with observations from other large inland systems (Welcomme, 1999; García Vásquez et al., 2009), although not in some African artisanal fisheries systems such as Lake Kariba (Kolding and van Zwieten, 2014; Kolding et al., 2016). 3 INDICATORS FROM SIZE-BASED MODELS A key limitation of size-based indicators is the difficulty involved with defining RPs that can be used to guide management actions. Modelling approaches can address this problem by specifying the population parameters associated with a healthy stock, and comparing observed parameters with this good-state expectation. The size-based LB-SPR model estimates the SPR for a stock (Hordyk et al., 2015a, 2015b). The LB-SPR model has been applied convincingly to assessment of tropical reef fisheries (Prince et al., 2015; Babcock, Tewfik and Burns-Perez, 2018), where fishers have participated in data collection. The case study of Babcock, Tewfik and Burns-Perez (2018) is of particular relevance as it applies a set of empirical indicators and the LB-SPR to a group of valuable species within a fish assemblage that supports small-scale spear and hook-and-line fisheries. Species sample size in Babcock, Tewfik and Burns-Perez (2018) was often small (≥ 60) due to limited data, and the issue of gear selectivity pattern (see below) is discussed. Both empirical and LB-SPR assessments provided similar estimates of stock state that were consistent with expert expectation. This successful implementation for individual species that are commonly caught suggests potential for application in inland systems where length data are available for particularly important species. The LB-SPR requires inputs of the M/K ratio (natural mortality M / von Bertalanffy growth coefficient K), mean asymptotic length L∞, and descriptions of size at maturity specified as Lmat50% and Lmat95% (the sizes at which, respectively, 50 percent and 95 percent of the population mature). The model is sensitive to misspecification in these life-history parameters, which can be difficult to estimate for some stocks (Hordyk et al., 2015a). Monte Carlo simulations with random draws of parameters over a range of likely values for each parameter have been suggested as a useful way to capture some of the uncertainty arising from poorly understood biology (Hordyk et al., 2016).
7

This review did not encounter any applications of LB-SPR to inland fish stocks. This may be partly
explained by the model assumption of asymptotic selection, which is characteristic of trawl fisheries.
In contrast, most inland fisheries operate gillnet or hook-and-line gear, which typically show dome-
shaped selection curves where the smallest and largest fish are not retained. It is expected that LB-SPR
will overestimate F/M and underestimate the SPR when confronted with data from a fishery with dome-
shaped selectivity, because the “missing” large fish will be assumed to have been caught. Simulation
testing showed that the method did indeed underestimate the SPR in some test species (Hordyk et al.,
2015a), and this issue was discussed but remained unresolved in Babcock, Tewfik and Burns-Perez
(2018). The extended growth-type group (GTG) LB-SPR approach (Hordyk et al., 2016) can
incorporate information on selectivity in cases where this has been estimated by gear trials. Recent work
has extended the GTG LB-SPR model to include the option of dome-shaped selection (Hommik et al.,
2020), for case study assessments of brown trout (Salmo trutta) stocks in four Irish lakes. Bayesian
Monte Carlo methods were used to include uncertainty around estimates of life-history parameters for
each stock. This ongoing example shows that the LB-SPR can be applied to data-limited inland fish
stocks sampled by standardized gillnet surveys. Estimates of the SPR (with RPs) could be combined
with empirical indicators in visual plots to support expert evaluation of stock state (see above).

4 EXPERT KNOWLEDGE
Quantitative assessment of fish stocks typically includes subjective decisions that can be strongly
informed by different forms of expert knowledge (Francis, 2011). The problems and priorities in small-
scale fisheries require a broadening of perspectives that cuts across academic disciplines and bridges
division between scientific and local knowledge (Jentoft and Chuenpagdee, 2019). Integrating scientific
and other knowledge is challenging but productive for environmental management (Raymond et al.,
2010; Drescher et al., 2013); it can provide information about model parameters (McDonald et al.,
2017) and become the basis for conservation decisions (Martin et al., 2012). Stakeholders targeting a
stock can acquire valuable knowledge of the commercial fishing and ecological history and status of
the stock (Chrysafi, Cope and Kuparinen, 2017), and expert judgement of ecological state can result in
similar classifications to quantitative metrics (Pasquaud et al., 2012; Feio et al., 2016).
Dichmont and Brown (2010) pooled knowledge of scientists, industry and managers in a cooperative
environment to implement simple decision rules based on catch rates. McDonald et al. (2017)
documented the process of implementing a fisheries management system with limited information, from
design to application in public policy. They proposed an adaptive system of multiple indicators and RPs
with a focus on fishers’ participation. In inland fisheries, there are many examples of co-management
(see review in Béné and Neiland, 2006). These initiatives imply scope to integrate expert knowledge as
a “data-less” (Johannes, 1998) narrative with simple empirical indicators in interpretation of status.
However, some co-managed systems would benefit from a systematic framework for using LBIs for
decision-making and setting HCRs, especially where a stock is overfished, but not yet critically
depleted. This highlights the need for some technical support from fisheries agencies to co-management
groups.
It is unlikely that dedicated surveys and associated analytic assessments will become available for
diverse data-limited stocks of inland fishes. This is simply because of the resources required. Relying
on appropriate indicator trends may be the most efficient and transparent approach, although it must be
acknowledged that this can be still demanding and potentially expensive (Dowling et al., 2008).
Parallel use of biological (e.g. size-based) indicators alongside stock abundance (e.g. CPUE)
assessments allows for a trajectory from single-species assessments towards a future indicator-based
EAFm that can inform co-management processes (Cotter et al., 2009). A comprehensive set of
environmental, CPUE and size-based indicators were selected by van Zwieten, Banda and Kolding
(2011) to assess the fisheries of Lake Malawi, where there is ongoing work to apply an ecosystem
approach (Njaya, 2018). Using only length-based HCRs may not be sufficient to recover depleted
stocks, but combining mean length with CPUE can succeed in recovering an overfished stock (Miethe
and Dobby, 2018; ICES, 2018).
8

Accessible model-free assessment frameworks can combine size-based indicators with CPUE and local
ecological knowledge (LEK) of trends over time to support appropriate HCRs (including spatial
management) and achieve specified social, ecological and economic objectives (Dowling et al., 2008;
McDonald et al., 2017; 2018; Shephard et al., 2019a).
It is important that any data-limited method should not be applied as a low-risk or technically trivial
exercise, and the process, uncertainties and outcomes must be critically confronted (Dowling et al.,
2018). This goal will be facilitated in developing inland fisheries if the selected indicators are intuitive
and can be understood by different stakeholders, potentially including those responsible for data
collection and local fishers who may have to implement, or comply with, associated simple HCRs.
Simple and sensitive empirical indicators were preferred in the Malawi case study (van Zwieten, Banda
and Kolding, 2011). Degnbol (2001) listed certain desirable properties for sustainability indicators,
which are adapted and listed in Table 3.
Empirical indicators of CPUE and size structure can fulfil most of these requirements, as they are
conceptually simple and are likely to reflect fisher’s understanding that commercially fished stocks and
assemblages will probably show reduced abundance and loss of larger individuals and species. It is
important that indicators be presented in a way that is intuitive and visually appealing, and that clearly
shows positive or negative changes in state.
Table 3: Desirable properties for sustainability indicators (after Degnbol, 2001)

 Property                                                  Description

 Observable              Within affordable/sustainable economic resources for research

 Self-evident            To all stakeholders – either directly or by transparency in the observation
                         process

 Understandable          They should have a research-based substance, and reflect analytical
                         soundness
                         They should reflect features according to stakeholders’ understanding of the
                         resource system

 Acceptable              By fishers
                         By the public at large

 Related to              They should indicate a direction of action – qualitatively or through
 management              associated reference points (RPs)
                         They should respond to management measures

This review implemented a recent format for plotting pairs of CPUE and size-based indicators to
illustrate trends towards or away from expected better or poorer state (Figure 1a; Shephard et al.,
2019a).
9
Figure 1a: Presenting surveillance indicators for data-limited inland fish stocks
RP Length
Abundance/biomass indicator
RP abundance/biomass
Length-based
Notes: The x-axis is an appropriate length-based indicator, and the y-axis is an associated CPUE indicator.
indicator
Coloured regions refer to poor (red), moderate (amber) and good (green) states. The dashed thresholds are
potential management reference points (RPs) that may be defined by expert knowledge, although a reference
direction approach is simpler.
Figure 1b: Conceptual trajectory for length and biomass/abundance indicators following overfishing
and subsequent recovery10 The plot in Figure 1a supports evaluation of well-understood reference directions (Rochet and Trenkel, 2003; Jennings and Dulvy, 2005), which may be sufficient for some individual target stocks and also for assemblages targeted by species- and/or size-selective fisheries. Indicator trends could be related to the starting condition and to the history of the stock, as understood from expert narrative (Canales, Hurtado and Techeira, 2018) and LEK. Stocks that were impacted before the available time series might be expected to show movement in a positive direction, while stocks that started in good state should not move in a negative direction (Rochet et al., 2005). It is possible to anticipate likely trajectories as fishing mortality curtails abundance and size structure, followed by possible recovery following management (Figure 1b). Relying on reference direction rather than RPs allows some constraints to be relaxed, although indicator direction and response time may be influenced by the life-history stage that is sampled for a given stock. This empirical and reference approach should not mask data limitations, or the reality that model-based methods can strongly reduce assessment uncertainty. However, the proposed plots are flexible because they present information simply, and this could extend to more robust model outputs such as size-based fishery indicators, e.g. the SPR from the LB-SPR (Hordyk et al., 2015a). An appropriate combination of empirical and modelled indicators would be informative as additional data become available (Babcock, Tewfik and Burns-Perez, 2018). New assessment approaches should be explicitly structured to accommodate and employ expert information (Kuhnert, Martin and Griffiths, 2010). The contribution of expert knowledge may be particularly important with a reference direction approach, both to understand the likely starting condition of a fishery and also to interpret apparent patterns in the quantitative stock history (Fazey et al., 2006; Stratoudakis et al., 2015). Experts can make reasonable prior predictions about fish stock status, although some bias should be anticipated (Chrysafi, Cope and Kuparinen, 2017). The value of fishers’ knowledge is now well established, and has the capacity to reject or challenge implausible results of assessment models (Duplisea, 2018). Notably, there is high value in additional information regarding historical stock depletion or fishing effort (Carruthers et al., 2014); where such information is available in an unprocessed state, it should also be leveraged. 5 HYDROECOLOGICAL PRESSURES Considering stakeholder engagement in management objectives and broader sustainability goals, a final issue is that inland fisheries systems differ in a fundamental aspect to most marine small-scale fisheries. There are frequently higher-level issues, such as hydropower dam building, disconnection, flow alteration and pollution, which contribute to multiple interacting anthropogenic pressures (Beard et al., 2011). Most of these issues are mediated through flow, which represents the main driver of biotic and abiotic conditions in large river systems (Naiman et al., 2008). Fish abundance and assemblage structure change with the seasonal flood cycle (Winemiller and Jepsen, 1998; Arrington, Winemiller and Layman, 2005; Arrington and Winemiller, 2006). Hydrology and related variables associated with flood pulses thus strongly influence fisheries performance (Halls and Welcomme, 2004; Castello, Isaac and Thapa, 2015; Rabuffetti et al., 2016). Welcomme (1985) and MRAG (1993) demonstrated strong global-scale relationships between flooded area and catch for large floodplain rivers. However, catch responses to flood pulses could be species-specific (Lima, Kaplan and Doria, 2017). Flood pulses may represent the main force governing fish recruitment and cohort strength in large floodplain rivers, particularly for periodic species (Winemiller and Rose, 1992). In the Paraná River, there is a strong relationship between high flood events and the recruitment of migratory species (Gomes and Agostinho, 1997; Bailly, Agostinho and Suzuki, 2008; Suzuki et al., 2009; Oliveira et al., 2015; Lozano et al., 2019). Baran, Van Zalinge and Ngor (2001) demonstrated that fish production was closely related to the flood levels in the Mekong River Basin, and particularly in the Tonlé Sap system. Hydroecological indices can be derived from river attributes such as flow. Baigún, Minotti and Oldani (2013) developed two habitat hydrological indices (the Channel Connectivity Index and the Floodplain Connectivity Index) as proxies of nursery habitat accessibility and permanence during the sábalo larval
11

growth period. Such approaches take advantage of hydrological attributes (Welcomme, 1985; Neiff and
Neiff, 2003), and can be used to predict performance in data-limited fisheries. From the perspective of
size-based indicators, fish community modelling studies could help anticipate likely trajectories of
population size structure under certain pressure scenarios, e.g. impaired recruitment due to loss of
floodplain spawning habitat. Length-based indicators might then become useful in understanding the
impact of fisheries versus other pressures.
At present, fishery effects on size structure have an extensive theoretical basis, but effects of
hydrological pressures are much less understood. Even so, the importance of hydrological processes for
large river fisheries production highlights the diverse potential pressures imposed on inland fisheries.
The complex environment requires that inland systems be managed at a social-ecological watershed
scale using ecosystem approaches to ensure long-term sustainable and resilient fisheries (Nguyen et al.,
2016). Addressing these issues will typically require a transdisciplinary approach (Bower et al., 2019).

6 CASE STUDIES
Inland fisheries vary considerably between regions in terms of ecosystem type, fishing methods and
target assemblage. The appropriate assessment approach and management framework will also differ,
partly in response to the local social-economic situation. Characterizing key fishery types helps to
clarify important management knowledge needs, and identify cases where size-based methods are most
likely to succeed (Table 4).
Size-based stock assessments, based on empirical indicators or models such as the LB-SPR, are
uncommon in inland systems. Fürst, Volk and Makeschin (2010) suggested that “Appropriate
(ecosystem) management requires (i) harmonizing and integrating different data sets, (ii) selecting the
right indicators, (iii) fitting the right models to the right scale, and (iv) integrating data, indicators and
models into systems that allow both a high level of participation and flexibility in application to different
questions.” This framework was used to inform a set of assessment case studies, which are presented
here to provide a template for other users. The intention is to provide a hierarchy of approaches, which
can be applied depending on data availability, where the starting point is expert knowledge only, moving
up to empirical indicators, and then to the LB-SPR where life-history parameter estimates are available.
The review above suggests that size-based assessment may be applicable to fisheries that target one or
a few single stocks, but that these approaches are likely to be less valuable in non-selective multispecies
fisheries. The case studies thus focus on ecologically important target species, or species that form the
bulk of the catch in a fishery. Previous inland fishery applications of LBIs (Fitzgerald, Delanty and
Shephard, 2018; Shephard et al., 2018; 2019a) and the LB-SPR (Hommik et al., 2020) have focused on
temperate salmonids, but there is a pressing need to evaluate these techniques in data-limited tropical
and temperate systems for non-salmonid species. Case studies were thus chosen for fish stocks in the
Tonlé Sap (Mekong River Basin, Cambodia), the Amazon River Basin (Brazil), Paraná River
(Argentina) and Lago Bayano reservoir (Panama). Each case was evaluated for data quality, and the
availability of supporting life-history information. An empirical indicator approach or model (the LB-
SPR) was then selected and applied. Challenges identified in each case were highlighted and discussed.
You can also read