Vulnerability Assessment of the North East Atlantic Shelf Marine Ecoregion to Climate Change - West Coast Energy Limited Trevor Baker, Project Manager
←
→
Page content transcription
If your browser does not render page correctly, please read the page content below
Vulnerability
Assessment of the
North East Atlantic
Shelf Marine Ecoregion
to Climate Change
West Coast Energy Limited
Trevor Baker, Project Manager

August 2005
CONTENTS

1     Introduction                                                                                                                                    6

2     Scope of work                                                                                                                                   8

3     Method                                                                                                                                  10
3.1   Workshop programme.............................................................................................................. 10
3.2   Environmental assessment ....................................................................................................... 11
3.3   Data confidence........................................................................................................................ 13

4     Existing Physical and chemical conditions and predicted changes                                                                             14
4.1   Sea surface temperature ........................................................................................................... 14
4.2   North Atlantic Oscillation ........................................................................................................ 15
4.3   Ocean circulation ..................................................................................................................... 17
4.4   Sea level rise ............................................................................................................................ 20
4.5   Storm surges............................................................................................................................. 21
4.6   Ocean acidification................................................................................................................... 21
4.7   Air temperature amplitude ....................................................................................................... 22
4.8   Catastrophic scenarios.............................................................................................................. 22

5     Ecological baseline and current trends                                                                                                          24
5.1   Plankton.................................................................................................................................... 24
5.2   Benthos..................................................................................................................................... 28
5.3   Fish........................................................................................................................................... 31
5.4   Birds ......................................................................................................................................... 35
5.5   Marine mammals...................................................................................................................... 38
6     Predicted effects and significance                                                                                                              40
6.1   Nutrients and pollutants ........................................................................................................... 41
6.2   Plankton.................................................................................................................................... 42
6.3   Benthos..................................................................................................................................... 48
6.4   Fish........................................................................................................................................... 56
6.5   Birds ......................................................................................................................................... 62
6.6   Marine mammals...................................................................................................................... 64
7     In-combination effects                                                                                                      68
7.1   Examples of in-combination effects......................................................................................... 68
7.2   Summary of in-combination effects......................................................................................... 69
8     Vulnerability Analysis                                                                                                                     70
8.1   Conclusions .............................................................................................................................. 72
9     Bibliography                                                                                                                                  72

                                                                        2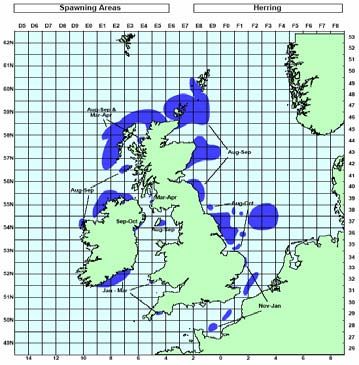
TABLES

2.1   Climate change characteristics considered in the assessment scenario for the end of century
      time horizon. ..........................................................................................................................9
3.1   Impact assessment components and the scoring criteria......................................................12
3.2   Levels of significance. .........................................................................................................13
3.3   Definitions of levels of confidence in impact assessment forecasts. ...................................14
5.1   Distribution of fish species assessed....................................................................................32
5.2   Tern species distribution in the NEAME and breeding habitat preferences........................35
6.1   Impact assessment for plankton. ..........................................................................................47
6.2   Impact assessment for benthic fauna and flora. ...................................................................55
6.3   Impact assessment for marine fish. ......................................................................................61
6.4   Impact assessment for marine predators (birds and marine mammals). ..............................66

                                                                      3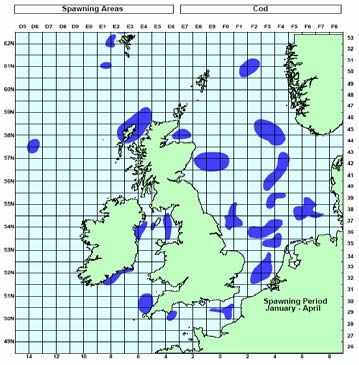
FIGURES
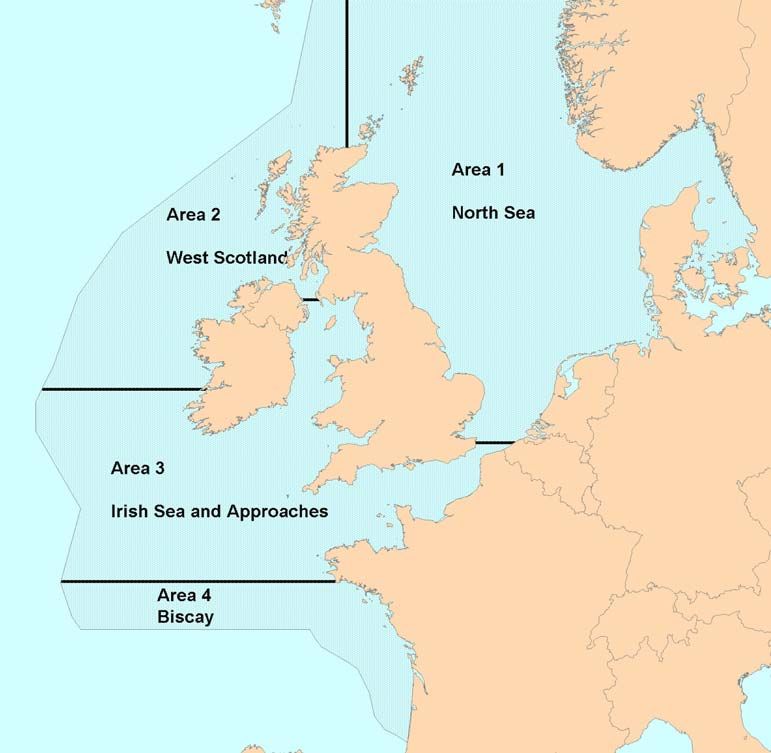
1.1 The NEAME and sub-division (Areas) used in the vulnerability assessment .......................7
4.1 Changes in annual average sea-surface temperatures by the 2020’s (left), 2050’s (middle) and
2080’s (right) with respect to model-simulated 1961-1990 average, for the High Emission
scenario; results from the original model HadRM3.............................................................15
4.2 Simple schematic of the atmospheric conditions over the North Atlantic associated with the
NAO. ....................................................................................................................................15
4.3 The Hurrell Winter (DJFM) Index from 1880 to 2005........................................................16
4.4 A simplified picture of the surface circulation of the North Atlantic. .................................17
4.5 A simplified picture of the surface circulation of the NEAME. ..........................................18
4.6 Predicted changes (by the 2080s) in storm surge return periods at Immingham for the
UKCIP02 Medium High Emissions scenario in comparison with the baseline (1961-90)
period. ..................................................................................................................................21
4.7 The relationship between temperature and pressure for the stability of methane in seawater
and freshwater. .....................................................................................................................23
5.1 Maps showing the changing biogeogrpahic distributions of a warm temperatue (top) and sub –
Arctic assemblage (bottom) of planktonic copepods between the years 1960-63 and 1960-99
(Beaugrand et al., 2002).......................................................................................................24
5.2 The abundance of Calanus populations in the North Sea from 1960 to 2003. ....................25
5.3 Monthly means of phytoplankton colour in the north Sea (1956 – 2004). ..........................27
5.4 Herring (left) and Atlantic cod (right) spawning areas in British waters (from Coull et al.,
1998). ...................................................................................................................................33
5.5 Sandeel spawning areas in British waters (from Coull et al., 1998)....................................34
6.1 Changes to coccolith form as a consequence in experimental alterations of CO2
concentrations. .....................................................................................................................45
6.2 Present (left) and predicted (right) distribution in the UK, for a 2oC increase in sea
temperature, of the snakelocks anemone Anemonia viridis.................................................50
6.3 Changes in 50-year storm surge height (m) due to changes in storminess, mean sea-level rise
and vertical land movement. ................................................................................................53
4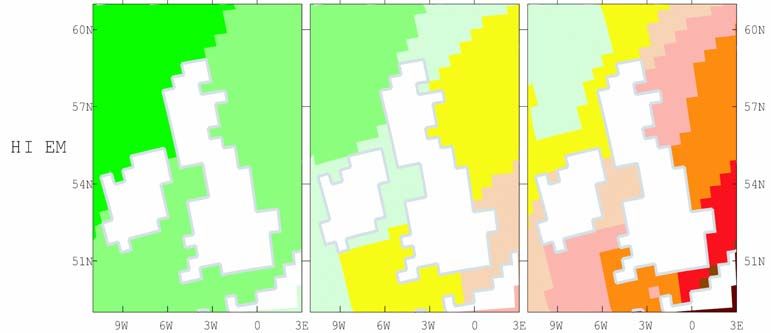
CONTRIBUTIONS

In addition to contribution from all delegates during and subsequently to the workshop, this report
has been compiled with contributions from the following individuals:
    •   Dr Sarah Hughes and Prof Bill Turrell, Marine Laboratory, Aberdeen
        Sections 4.1 to 4.3 Ocean circulation and North Atlantic Oscillation
    •   Dr Jason Lowe, Met Office
        Section 4.4 and 4.5 Storm surges and sea level rise
    •   Dr Keith Hiscock, Marine Biological Association
        Section 5.2 Benthic Fauna
    •   Dr David Long, British Geological Survey
        Section 4.9.1 Methane hydrates
    •   Dr Martin Edwards and Dr David Johns, Sir Alistair Hardy Foundation for Ocean Sciences
        Section 5.1 Plankton
    •   Mr Peter Barfield, Sea Nature Studies
        Assistance in collating baseline information in Section 5 and additional background literature
        for Section 6

ACKNOWLEDGEMENTS

WWF would like to thank the lead author for his dedication and ability; all the participants of the
workshop for their hard work and expertise; those who have offered additional contribution to this
report for their continued input and excellence, the facilitators for their foresight, talent and effort,
and to colleagues and others who offered editorial and other support for the production of this
workshop and report.

The views expressed in this report are the summation of a multi disciplinary gathering of expertise,
collated to represent the views expressed and that in scientific journals, rather than the views of
WWF.

                                                     5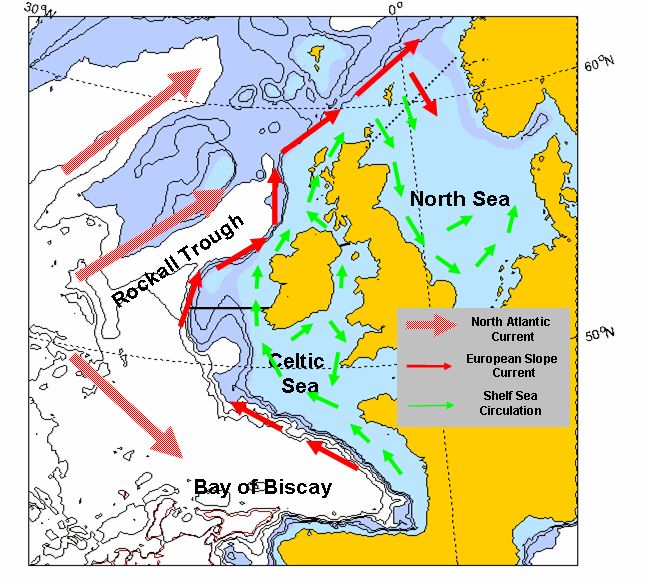
1. Introduction

The North-East Atlantic Shelf has been identified as a priority ecoregion by WWF. The
NEAME (North-East Atlantic Marine Ecoregion (Figure 1.1) has been recognised for its
diverse range of coastal and offshore marine habitats including tidal mud flats, fjords
and steep cliffs - from the shallow North Sea to the continental shelf break and deep sea.
Millions of migratory waterfowl and waders depend on feeding and breeding grounds
along the East Atlantic Flyway. The sea is rich in marine wildlife - sharks, seals,
cetaceans and seabirds as well as commercially important fish stocks. There are highly
productive plankton and bottom-dwelling communities, kelp forests, sea grass beds and
even cold water coral reefs.

However, this fragile marine environment is at risk from a number of threats not least
climate change. This will have many impacts on the marine environment, particularly
upon fisheries and protected areas; but also when considering eutrophication, alien
species and hazardous substances. In addition to addressing climate change per se,
WWF considers it necessary to better understand climate change in order to devise
comprehensive and robust work plans in its conservation work and to attempt to support
the entire marine ecosystem by building resistance and resilience to climate change.

Consequently, WWF has commissioned a multi-phase project to predict and evaluate
the threats to the NEAME from climate change and consider whether it is useful to
determine what level of climate change will constitute an acceptable level of threat to
coastal and marine environments. In the longer term, the results from this work will
inform the development of an adaptation strategy, to build on natural resistance and
resilience.

The project’s first phase, the scoping study (Baker and Reidy, 2004), reviewed available
literature and concluded that the vulnerability assessment would be best achieved by
convening a workshop of delegates with substantial scientific and stakeholder expertise
from a broad range of relevant disciplines and, over a two day period, consider what are
the key potential impacts by focussing on:
•   A comparison between the current environmental situation with predicted effects of the
    UKCIP02 high emissions scenarios where atmospheric CO2 concentration would rise to 810
    mgl-1;
•   Focus the assessment on the current century only;
•   Consider the NEAME as four Areas (Figure 1.1);
•   Focus on seven principal characteristics (or pressures), for example sea level rise and as
    listed below (Section 2.2);
•   Consider five principal threats to the ecoregion posed by these characteristics, for example
    changes to species distributions and as listed below (Section 2.3);
•   Concentrate the vulnerability assessment using 19 receptors, representative of the
    ecoregion’s fauna and flora, such as common seal and as listed below (Section 2.4); and
•   Include a catastrophic scenario, presented as two separate potential effects.

                                                6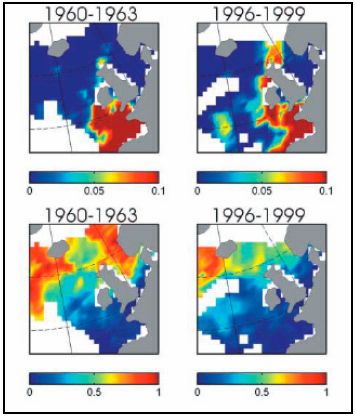
The workshop consisted of a series of presentations summarising the current state of
knowledge of the NEAME environment and climate change predictions to enable a full
and consistent understanding of the issues that would then be subject to an assessment
of climate change threats by applying the tools of environmental impact assessment.
This approach therefore encouraged the use of professional judgement in determining
best current thinking to predict the effects in the absence of certain scientific
knowledge. This workshop took place in June 2005 and was attended by a wide range of
experts and specialists as well as key stakeholders (see Appendix 1).
It should be noted that the workshop process developed the ideas of the scoping report,
for example simplifying the scenario analysis, and these differences are covered in the
following sections.

The remainder of this report describing the workshop, the assessment and the
conclusions drawn, should be viewed as part of an ongoing process rather than an end
product. Future progression of our understanding of the issues highlighted in this report
will, hopefully, add clarity, resolution and quantification to the analysis. In this way, the
means of managing and mitigating the effects described here, and in future, will be
identified and developed to achieve successful outcomes in, and for the NEAME.

         Figure 1.1 The NEAME and sub-divisions (areas) used in the vulnerability assessment. The Areas
         broadly correspond to ICES regions.

                                                  7
2. Scope of work

2.1 DEFINITIONS

For the purpose of this report, the following terminology has been applied:
•   Characteristic: an aspect of environmental change attributable to climate change, typically
    the characteristic is either a physical or chemical variation from the current (or recent)
    value. One example would be sea level rise;
•   Threat: As a consequence of the changing characteristic, some or all components of the
    ecoregion may be subject to an impact. It is the features of this impact that is described as a
    threat. One example would be loss of breeding habitat for terns;
•   Receptor: Those species, habitats and other environmental components subject to
    consideration with respect to assessing the relative significance of the effects that the threats
    might have, in terms of the parameters of the characteristics covered in the assessment.
    These have been listed below; and
•   Area: the NEAME was subdivided into four areas (Figure 1.1) to allow incorporating
    regional variation into the assessment.

2.2 CHARACTERISTICS

The scoping phase of this project (Baker and Reidy, 2004) rationalised the preferred
approach to the vulnerability assessment and its focus. The workshop phase (see below)
further refined this approach and, in so doing, it was determined that the assessment
should concentrate on a change in characteristics over the remainder of the 21st century
as follows:
•   Ocean circulation and the NAO (North Atlantic Oscillation index);
•   Sea surface temperature;
•   Sea level rise;
•   Storm surges;
•   Air temperature amplitude;
•   Acidification; and
•   Nutrient and pollutant inputs, as a consequence of changes patterns of, for example,
    increased freshwater discharges.
Additionally, the potential for a catastrophic scenario was considered, whereby the
effects of a low probability, high risk situation might arise. The characteristics of this
were:
•   Slowdown of the Gulf Stream; and
•   Release of methane from methane hydrates.
The parameters considered for these characteristics are presented in Table 2.1, along
with their source and the confidence in their accuracy (see Section 3.1 for further
discussion on data confidence). The assessment was based on a comparison of existing
conditions (Sections 4 and 5) and the likely effects of these characteristics which in
general are from the UKCIP02 High Emissions scenario (Hulme et al., 2002) or

                                                 8
approximately similar. This scenario is characterised by the predicted atmospheric CO2
concentration at the end of the century of 810 mgl-1 (Hulme et al., 2002).

Table 2.1: Climate change characteristics considered in the assessment scenario for end of
century time horizon.

                Characteristic                             Basis: model and scenario             Level of
                                                                                                 confidence

                Average annual sea surface                 HadRM3 model, High                    High
                temperature:                               Emission scenario.                    (UKCIP02)
                1-4 oC rise
                Regional net sea level rise:               HadCM3 model, High                    High
                                                           Emission scenario.                    (UKCIP02)
                60-85 cm rise

                1.5 m storm surges:                        HadRM3 driving a separate             Medium
                                                           high resolution model from
                1 in 7 years (from 1 in 120                                                      (UKCIP02)
                                                           POL, High Emission
                years)
                                                           scenario.
                Ocean circulation and NAO:                 Field observations being              Medium
                                                           extrapolated (Visbeck et al.,
                Tendency to more positive
                                                           2001)
                NAO index mode.
                Ocean acidification:                       The Royal Society (2005).             Not stated
                                                           Projection for 840 mgl-l              in report
                pH decreases by 0.4 (pH 8.2-
                                                           atmospheric C021.
                7.8)
                Air temperature amplitude:                 HadRM3 model, tested                  High
                                                           against measured trends in            (UKCIP02)
                Greater range and increased
                                                           historic data
                frequency of extremes
                Nutrient and pollutant inputs:             Hypothetical forecasts                Low
                Increased runoff                                                                 (workshop
                                                                                                 consensus)
                Plankton seasonality:                      Field observations                    High
                                                                                                 (SAFHOS)
                4-6 weeks extension

2.3 THREATS

For this assessment, it was necessary to focus attention on representative threats. The
scoping report and subsequent refinement at the workshop resulted in the following
principal threats being identified and taken forward:
•      Changing trophic status with focus on the changes to phytoplankton abundance and
       composition (also effects of carbonate biochemistry);

1                                                                                           -1
    The UKCIP02 High Emission Scenario is for an atmospheric CO2 concentration of 810 mgl

                                                          9
• Changes to growing season, particularly with respect both to plankton (especially Calanus)
and asynchrony of interactions (phenology);
• Species redistribution, particularly with respect to regional extinctions, alien species with
capacity to cause multiple-species impacts and/or have nuisance effect and decline of
keystone and economically important species;
• Decline in biodiversity, as a consequence of the above (and others), with a focus on
increased community vulnerability to perturbations; and
• In-combination pressures resulting in population crashes/local extinctions.
2.4 RECEPTORS
The focus during the assessment of these threats was on the following key or
representative receptors of the NEAME:
• Plankton: diatoms and dinoflagellates, Calanus finmarchicus and C. helgolandicus,
carnivorous zooplankton and meroplankton;
• Fish: Atlantic cod, sandeel (all species), salmon and herring;
• Birds: Waders (collectively) and terns;
• Marine mammals: Harbour porpoise, bottlenose dolphin, fin whale, common seal and grey
seal ; and
• Benthos: Representative fauna or biotopes for rocky shore and sublittoral benthic habitats
including:
• Calcifying species;
• Biogenic reefs such as maerl, Modiolus and Serpula;
• Saltmarshes; and
• Others for specific threats such as kelp forests (storm surges) and isolated water bodies
(sea temperature rise).
3. Method
3.1 WORKSHOP PROGRAMME
The two day event initially considered and refined the scope and focus for the
assessment after presentation and discussion of the scoping report. A series of
presentations, by experts on the characteristics, and discussions followed that in seeking
to identify the significant potential effects. Recognition of the most concerning of them
was facilitated to enable the vulnerability assessment to progress. Thus, the current level
of understanding with respect to the principal characteristics and the threats they pose to
the NEAME was discussed (see Appendix 2 for workshop presentations). This was
followed by the impact assessment sessions that have provided the basis for the
following analysis (see Appendix 2 for workshop notes).
103.2 ENVIRONMENTAL ASSESSMENT
The application of Environmental Impact Assessment (EIA) practices to climate change
impacts was considered an appropriate approach in an effort to reconcile the level of
concern about the environment with our currently incomplete understanding of both the
scale of climate change and the nature of the environmental response. In gathering the
best available existing knowledge of the environment and prediction, the EIA approach
was applied to consider the implications. The significance of identified environmental
impacts can be broad ranging from the trivial to those that are of major concern. The
EIA process seeks to identify and focus on those that are considered to be most
significant and attempts to address them. In normal application, this would enable a
proposed development to evolve its design to limit the degree or extent of an
environmental impact and provide decision makers with sufficient information to
determine whether the proposals potential significant impacts are acceptable in the face
of other benefits (social, economic or other) accrued from consenting the project. In this
instance, the output from the EIA process is the identification of the greatest impacts to
the NEAME that might arise and inform the process of determining where and if
measures can be implemented to mitigate against them. Judging the relative significance
of an impact is often a subjective and imprecise to a greater or lesser degree. In order to
manage these potentially contentious areas, key factors that inform the impact are
considered individually. In this assessment, in an effort to maintain a straightforward
approach, only four components of impact were considered as follows:
• Receptor sensitivity to change;
• Importance of the receptor to the ecosystem;
• Spatial scale of impact/change; and
• Magnitude of change.
To establish a consensus on the relative significance of impacts and identify key
vulnerabilities, each of these four assessment components was scored on a scale of 1 to
3, with respect to the receptors and their predicted responses to each (where applicable)
climate change characteristic. The scoring criteria are defined in Table 3.1.
11Table 3.1: Impact assessment components and the scoring criteria
Component Score Definition Note
Sensitivity 1 Low The environmental component’s
to change response to an impact is manifest at low,
2 Medium
medium or high levels of change in a
3 High characteristic. In particular, sensitivity is
considered relative to responses to even
low levels of incremental change in
characteristics.
Importance 1 Low The impact affects an environmental
to factor that has minimal ecological
ecosystem importance with respect to ecological
functionality or community structure.
2 Medium The impact affects an environmental
component has some ecological
importance with respect to ecological
functionality or community structure likely
to have consequential effects on other
parts of the ecosystem.
3 High The impact affects an environmental
component that is of critical ecological
importance with respect to ecological
functionality or community structure.
Spatial 1 Local Impacts occur on a scale less than
scale of encompassed by a NEAME Area.
impact
2 Area- Impacts occur across at least one
wide NEAME Area.
3 NEAME- Impacts occur across the whole NEAME
wide region.
Magnitude 1 Low Changes unlikely to be substantially
of change greater than natural variation within the
NEAME.
2 Medium Change apparent but not critical to
functionality/continued occurrence within
the NEAME.
3 High Change substantial – functionality
compromised, continued presence in the
NEAME at risk/ceased.
Application of a simple, unweighted, scoring system for each of these components has
provided an assessment of the significance of the potential impact as classified by Table
3.2 where:
• Significance = sensitivity + importance + spatial scale + magnitude.
12Table 3.2: Levels of significance
Significance score
Minor 3–6
Moderate 7–9
Major 10 - 12
3.3 DATA CONFIDENCE
In trying to forecast future changes in climate and the subsequent environmental
response, it is inevitable that the accuracy of the predictions require consideration. In
this assessment we have to consider both the level of confidence in the future climate
change predictions that are the basis of our assessment and also our expectations of the
response. The following two sub-sections outline the approach taken in highlighting this
issue.
Climate change predictions
Predictions of how future climate change will develop are continually being improved
in both their resolution and the extent to which climate change experts have confidence
in those predictions. As part of the climate change prediction process, reports are now
publishing the degree of confidence in the reliability and accuracy of the prediction to
assist the process of considering their potential impacts. Statements on confidence in the
predicted changes in characteristics considered in this report are presented in Table 2.1
alongside the parameters used for this vulnerability assessment.
In essence, for there to be a high degree of confidence in the predictions, one needs:
• Models to agree with present day observation and trends;
• Different models agree; and
• The underlying science is sound.
Environmental impact assessment
The robustness of predictions such as those being presented here will be subject to the
confidence in the scientific basis of the information used and conclusion drawn. This
applies not only to the predicted changes to the environment (the climate change
characteristics) but also to the knowledge concerning the receptor, including its natural
history, distribution and likely response to changes in the characteristic being
scrutinized. As such, in this report we have highlighted the confidence that we have in
the accuracy of our predictions (Tables 5.1 to 5.4).
The criteria applied when considering the level of confidence in the assessment are
presented in Table 3.3.
13Table 3.3: Definitions of levels of confidence in impact assessment forecasts
Confidence Definitions
Low Inferred from knowledge of the characteristics of a factor and/or
general biology and distributional information of a species or
evidence from a similar species.
Moderate Derived from sources from recognised bodies that consider the
likely effects of a particular factor and through extrapolation
from similar events or experimental studies on ecological
processes.
High Derived from peer-reviewed sources that specifically deal with
the issue under consideration and/or conclusions based on
evidence including from experimental studies.
4. Existing Physical and chemical conditions,
current trends and predicted changes
The assessment requires a baseline against which the potential impacts are considered.
Comparison between the baseline conditions and the predicted changes provides the
opportunity to assess the significance of the potential impact. This baseline, described
below, as a necessity, needs to take into account climate change effects already
considered to be occurring. This section, therefore, summarises the existing physical,
chemical and biological environment in the NEAME. It also proceeds into a
commentary on the predicted changes used in the subsequent impact assessment based
on the scoping report (Baker and Reidy, 2004) and the information presented by the
workshop speakers (Appendix 2 Workshop presentations).
4.1 SEA SURFACE TEMPERATURE
Sea surface temperatures in the NEAME range widely from 0oC to more than 21oC
(OSPAR Commission 2000b, 2000c, 2000d) in both space and time. The mean sea
surface temperature presented at the workshop for the NEAME (see Appendix 2) were:
• Area 1: 9.5 - 11oC;
• Area 2: 9.5 - 12oC;
• Area 3: 11 -13oC; and
• Area 4: 12 - 13oC.
The predicted future climate change for mean sea surface temperature for the UKCIP02
High Emissions scenario suggest that temperatures will increase by as much as 3 or 4oC,
particularly in the south east of the NEAME (Figure 4.1). From this figure, it is evident
that the temperature rise gradient has a northeast-southwest angle.
14Figure 4.1 Changes in annual average sea-surface temperatures by the 2020’s (left), 2050’s (middle) and 2080’s
(right) with respect to model-simulated 1961-1990 average, for the High Emission scenario; results from the
original model HadRM3. Source: UKCIP02 Climate change scenarios funded by DEFRA, produced by
Tyndall and Hadley Centres for UKCIP.
4.2 NORTH ATLANTIC OSCILLATION
Normally, in the atmosphere over the North Atlantic, a low pressure area is situated in
the north, near Iceland, and a high
pressure area is situated in the south of
the region near the Azores. This
pattern of sea-level pressure causes
westerly winds to blow across the
northern North Atlantic and hence
explains why winds in the NEAME are
predominantly westerly. L
It has long been observed that winter L
conditions across the North Atlantic
seem to follow a seesaw pattern. For
example, when a colder than normal
winter is experienced in Greenland it is H H
often true that there is a warmer than
normal winter on the opposite side of Figure 4.2: Simple schematic of the atmospheric
the North Atlantic in Scandinavia and conditions over the North Atlantic associated with the
vice versa. A similar seesaw pattern NAO. During the NAO’s positive phase (indicated by
red), the Icelandic Low and Azores High are
can be seen in the winter rainfall intensified, producing strong westerlies (red arrow)
across the North Atlantic. This seesaw that are shifted to the north. When the NAO is in the
pattern in climate variability is now negative phase (blue), the difference between the
pressure centers is diminished and both shift to the
known as the North Atlantic west. The westerly winds are weakened and shift to
Oscillation (NAO). The ‘oscillation’ is the south (blue arrow).
a change in the intensity of the low and
high pressure areas, which in turn affects the strength and location of the westerly winds
blowing across the North Atlantic.
15In the NEAME, when the NAO Index (NAOI), a measure of the winter sea level
pressure difference between the low and high pressure areas, is positive, westerly winds
are intensified and move further north, bringing warmer and wetter than average
conditions (Figure 4.2). When the NAOI is negative, westerly winds are weaker and
displaced further south. This causes cooler and drier than average conditions.
Although the NAO is an atmospheric phenomenon, there is also a strong link between
conditions in the atmosphere and those in the ocean, particularly through the driving
forces of wind, surface heating and rainfall. The NAOI can be correlated with sea
surface temperatures across the North Atlantic and changes in the NAOI have been used
to explain observed changes in many aspects of the marine ecosystem, from plankton to
fish.
The NAO appears to vary on a decadal timescale. During the 1960s the NAOI was
mainly negative and during the 1990s the NAOI was mainly positive (Figure 4.3). The
NAO is thought to have a natural mode
of variability, and so would be
expected to continue with this decadal
pattern in the future (Visbeck et al.,
2001).
The upward trend in the NAOI
between 1960 and 1990 accounts for
much of the warming observed over
that period and so it is possible that
anthropogenic climate change is also
influencing the NAO. It was therefore Figure 4.3: The Hurrell Winter (DJFM) Index from
suggested that the positive phase of the 1880 to 2005. Annual values are shown by dots. The
NAO might continue into the future. think line is a 3-year running mean, shaded red to
indicate positive values and blue to show negative
However, since 2000 the NAOI has values.
been weak and variable, as the pattern NAO Index available:
of sea level pressure anomaly across ww.cgd.ucar.edu/~jhurrell/nao.stat.winter.html
the North Atlantic has not fitted with
what we think of as a typical NAO pattern. Despite the weakened, NAOI, during this
time sea surface temperatures over the whole North Atlantic have continued to rise and
warmer than normal conditions have been observed on both sides of the North Atlantic.
Future predictions for the North Atlantic Oscillation
Present thinking suggests that in the future, decadal variability in the NAOI will
certainly continue, though there is the possibility of a trend towards a more positive
mode.
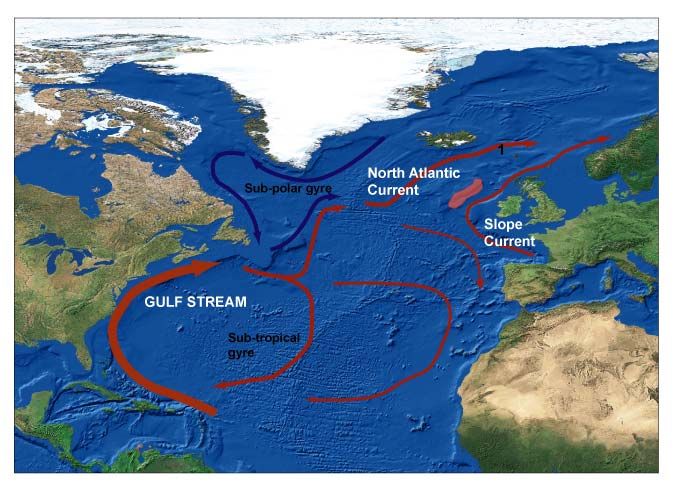
164.3 OCEAN CIRCULATION
In terms of ocean circulation, conditions on the western continental shelf (NEAME
Areas 2, 3 and 4) can be described as a single unit whereas conditions in the North Sea
(NEAME Area 1) are slightly different.
The Gulf Stream
In order to understand ocean circulation on a regional level, it is first necessary to take a
step back and look at ocean currents in the wider North Atlantic. The surface circulation
of the North Atlantic has two main parts as shown in Figure 4.4; a clockwise rotating
southern gyre of warm and quite salty water (sub-tropical gyre) and a cooler fresher
anti-clockwise gyre further north (sub-polar gyre).
The sub-tropical gyre is driven
by the pattern of winds blowing
over the oceans. The effect of
the earth’s rotation intensifies
the strength of the current on
the western boundary of the
ocean, therefore the sub-
tropical gyre bunches up
against the coast of North
America and is more diffuse on
the African coast. The strong
intensified current flowing
northward along the American
coastline is known as the Gulf
Stream.
Figure 4.4: A simplified picture of the surface circulation of the
North Atlantic. The cooler, fresher waters of the sub-polar gyre
The strength and position of the are shown in blue with the warmer saltier waters of the sub-
Gulf Stream can vary, and this tropical gyre shown in red. The shallow ridge that runs between
is thought to be linked to the Greenland, Iceland and Scotland and forms a barrier to the flow
of deep waters between the Arctic basin and the North Atlantic
strength of the NAO. The Gulf basin is marked as (1).
Stream Index (a measure of the
northward extension of the Gulf Stream) is sometimes used as an indicator of conditions
in the NEAME. A positive NAO has been linked to a more northward position of the
Gulf Stream.
The North Atlantic Current
A large percentage of the Gulf Stream water re-circulates around the Sargasso Sea.
Some of the water makes it across to the eastern North Atlantic. Some of this flow turns
south towards the Bay of Biscay, some of it takes a more northerly route. The current
flowing from the tail end of the Gulf Stream across the Atlantic toward northern Europe
is called the North Atlantic Current. It is not a well defined stream, and is still the
subject of much research. This current is partly wind driven and partly driven by the
density differences between the warmer southern water and the cooler northern water.
About 10-20% of water delivered to the Flemish Cap, on the east coast of Canada, by
the Gulf Stream makes it to the latitude of Scotland.
17The European Slope Current
The western margin of the NEAME
is marked by a sharp change in the
depth of the seabed, from less than
250m, the continental slope drops
rapidly into water deeper than 2000
m (Figure 4.5). A jet-like current,
known as the European Slope
Current (ESC) flows in a poleward
direction along the edge of the
continental slope. Some of the North
Atlantic water that reaches the Bay
of Biscay joins the ESC. The waters
in the slope current also originate
from the Iberian region.
Figure 4.5: A simplified picture of the surface circulation
The steep bathymetry itself acts as a of the NEAME
barrier, reducing the amount of water
that can travel from the deeper
waters of North Atlantic into the shallower waters of the continental shelf. As the slope
current flows along the bathymetry, it can mix with waters from the Atlantic. The slope
current sometimes changes direction, because of winds or other physical processes and
these fluctuations help to bring Atlantic waters onto the continental shelf. The slope
current is thought to have a very important role bringing Atlantic Waters into the
northern part of the North Sea.
The ESC is important as it brings warmth, nutrients and plankton. Changes in the
intensity of the ESC are thought to be linked to recent marked changes in the ecosystem
of the North Sea (Reid et al., 2001). The slope current appears to vary with the seasons,
and can be stronger in winter than in summer. Its strength and direction can be affected
by local winds.
Shelf sea circulation
Over most of the NEAME region, water depths are less than 250m, and average at
around 100m. Currents on the continental shelf, in water depths less than 250m shelf are
mainly driven by winds and tides, although narrow coastal currents and jets along
seasonal fronts can be driven by density gradients. Tidal currents are reliable and
predictable and stronger than the residual current in many areas. Tidal currents cause
mixing in the water column and, particularly in the shallower areas in the Celtic Sea and
southern North Sea, are the most important control on the location of stratification.
However, when we consider the way water circulates around the NEAME, the overall
effect of the tides is quite small as tidal currents mainly move water back and forth. The
residual current, which has an overall effect of moving water around the shelf areas of
the NEAME region, is mainly driven by winds and density driven coastal currents and
frontal jets.
18The overall pattern of circulation is therefore quite variable, but over a year would
average to give a pattern similar to that shown in Figure 4.5. Circulation in the North
Sea (Area 1) is predominantly anti-clockwise. Circulation on the shelf west of Scotland
(Area 2) is mainly northwards. There is a clockwise circulation in the Celtic Seas (Area
3). In the south of the NEAME region (Area 4) there is again a northward current flow.
When the dominant wind direction becomes more south-easterly, the circulation in the
North Sea becomes weaker and the dominant direction is less well defined, circulation
on the shelf west of Scotland (Area 2) may be intensified and circulation in the south of
the NEAME (Areas 3 and 4) becomes predominantly northward (Pingree et al., 1980).
Thermohaline circulation
Whilst previous sections have discussed the effect of global climate change on regional
ocean circulation, it is also necessary to consider the effects of changing global
circulation on regional climate.
The bathymetry of the North Atlantic can be simplified by considering it as one deep
basin connected to the shallower Nordic/Arctic basin by an even shallower sill, a ridge
that goes all the way from Greenland to Scotland (Figure 4.4). This ridge plays an
important part in the thermohaline circulation (THC).
The thermohaline circulation (THC) is that part of the ocean circulation that is driven by
density differences. In contrast to the wind driven circulation, the thermohaline
circulation is not confined to the surface waters. In the North Atlantic, in simple terms,
the important aspects of the thermohaline circulation are:
• Cooling and sinking of water at high latitudes in the Nordic/Arctic basin.
• Flow of deep water over the Greenland-Scotland ridge from the Nordic/Arctic basin into the
Atlantic basin.
• Flow of warm and salty surface waters northward into the Nordic/Arctic to replace the
water leaving the Nordic/Arctic basin.
There is often confusion between the thermohaline circulation and the Gulf Stream.
This is partly because in that region of the North Atlantic, the circulation of the Gulf
Stream and the THC are linked and follow the same path. It is estimated that the THC
contributes only 20% of the Gulf Stream flow. Another reason for the confusion is that
in order to make it easier to get the message across to the audiences, who know about
the Gulf Stream, the terms are often mixed up by scientists.
The salinity of the ocean is very important when considering this circulation; if water is
fresh (less saline) it won’t sink even if it gets very cold. Freshening of surface waters
can, therefore, disrupt the whole process.
Over the last few decades there has been increasing evidence that the flow of deep water
over the Greenland-Scotland ridge has decreased and that the cooling and sinking of
water at high latitudes has decreased or even stopped. This suggests that some changes
to the northward flow of warm and salty surface waters should be expected.
Investigation of ice core data has shown that, in the geological past, the THC has been
19weakened or even stopped and this has had a marked impact on the climate of the
NEAME.
Ocean climate models have shown that if the THC stops, the annual average
temperatures over Scandinavia and Britain could drop by between 5-10°C. However,
the ocean-atmosphere system is complex and linked which means that our
understanding is incomplete and the models available today are still an
oversimplification.
A total collapse of the THC can be simulated with ocean-climate models, but with our
current understanding, although this would have a high-impact it is currently an unlikely
scenario. A more likely scenario is a weakening of the THC, reducing it by 20-50%.
This scenario is already included in future climate models that still predict warming in
the NEAME over and above the cooling effect of a reduced THC.
Future predictions for ocean circulation
The following predicted future changes with respect to ocean circulation represent the
current scientific thinking as presented at the workshop:
• Predicted changes in the wind patterns in the North Atlantic may change slightly but it will
not be enough to alter the clockwise flow of the Gulf Stream;
• With respect to the North Atlantic Current, changes in the pattern of winds and changes in
density gradient by the end of the century may have a minor impact on the strength and
location of the North Atlantic Current, although it will continue flowing towards the
NEAME;
• Any changes in temperature and salinity distribution in the North Atlantic will affect the
north-south density gradient and this may have an impact on the strength of the European
Shelf Current;
• For Shelf Sea Currents, predicted changes in the mean sea level in the NEAME will be
insufficient to have a significant impact on the strength or patterns of tidal currents. Any
changes in the strength and direction of wind will have an effect on the residual circulation
patterns, as will changes in freshwater runoff from the land;
• There is a remote possibility of total collapse of thermohaline circulation caused by global
climate warming. This would lead to regional reduction in air and sea temperatures; and
• The more likely scenario would be of reduced THC caused by global climate warming with
no overall regional reduction in air and sea temperatures as these will rise due to future
climate change by an amount greater than the predicted fall from the THC shutdown.
4.4 NET SEA LEVEL RISE
The amount of net sea level rise in the North East Atlantic is presently 1 mm yr-1 but
forecast to increase by as much as 86cm by the end of the 21st century (Hulme et al.,
2002). Even if greenhouse gas emissions were stabilised today, sea level rise will
continue for the next 1000 years.
20Predicted changes in sea level rise are varied, particularly on a regional scale, depending
on the model used, the amount of isostatic adjustment in land elevation2 and the
regional variation in the extent of ocean warming and thermal expansion. UKCIP
reports a global average sea level rise by the end of the century, relative to the 1961-
1990 average, of an increase by upto 69cm for the High Emissions scenario. Taking this
into account, a rise in sea level was considered of between 60 to 85cm. This value is the
global-average mean sea level rise and isostasy.
4.5 STORM SURGES
Storm surges are temporary increases in sea level,
above the level of normal tides, caused by low
atmospheric pressures and strong winds. The
change to the incidence of 1.5m storm surges is
predicted to increase as the century progresses.
For the purpose of this work, we have taken a
change in probability of such an event occurring
in 1 in 7 years, from the current situation of 1 in
120 years such as predicted at Immingham
(Figure 4.6). This predicted change is given by the
UKCIP02 Medium High Scenario (Hulme et al.,
2002).
Figure 4.6. Predicted changes (by the 2080s) in storm
4.6 OCEAN ACIDIFICATION surge return periods at Immingham for the UKCIP02
Medium High Emissions scenario in comparison with the
A recently published report (The Royal Society, baseline (1961-90) period. (From Hulme et al., 2002)
2005) summarised the current level of
understanding with respect to how the pH of the ocean is changing as a consequence of
an increase in the concentrations of atmospheric CO2. CO2 concentrations are currently
at a level of 380 mgl-1, compared with the pre-industrial level of 280 mgl-1. Ocean
surface waters have a pH of 8.2 ± 0.33 and are already 0.1 pH units below pre-industrial
levels. Notably, this is equivalent to a 30% increase in concentration of hydrogen ions in
the water and is a consequence of the absorption, each year, of some 2 Gt C into the
oceans. Presently, some 6 Gt C yr-1 are released into the atmosphere by human
activities.
Some forecasts suggest that by 2100, atmospheric CO2 levels might reach 1000 mgl-1
unless emissions are substantially reduced. Present trends in emissions will lead to a
decrease in pH of up to 0.5 units by 2100 in ocean surface waters. This is outside of the
natural range and, critically, the rate of change is at least 100 times greater than any
experienced during the previous several hundreds of thousands of years. Because of this
unprecedented rate of change and substantial drop in pH value, the scientific community
is greatly concerned about this threat, not just to the NEAME. As will be seen in Section
5, ocean acidification generated a great deal of concerned debate across the ecological
disciplines at this workshop.
2
Post-glacial regional land movements, where changes in land elevation, are occurring as a consequence of the weight
-1
of ice being removed. For example in Scotland it is rising by 0.7/1.0 mm yr and in Southern England it is falling by 0.6
-1
to 1.5 mm yr (Hulme et al. 2002).
3
Where temperatures are lower and deep water upwellings occur, pH will be lower.
21For the purpose of this assessment, a fall in pH by the end of the century was predicted
to be from the current pH of 8.2 to 7.8. This corresponds to the published predictions
assuming current trends with respect to CO2 emissions continues for the remainder of
the 21st Century, resulting in an atmospheric concentration of 840 mg l-1 (The Royal
Society, 2005). This is the best approximation to the UKCIP02 High Emissions
scenario, of 810 mg l-1 by 2100 (Section 2).
4.7 AIR TEMPERATURE AMPLITUDE
Changes in diurnal temperature range are forecast as a consequence of climate change.
This is primarily driven by variation in cloud cover. For a High Emissions scenario,
UKCIP02 forecasts, by the end of the century, a UK-wide increase of more than 1oC in
the summer diurnal range except around the coasts of Scotland and Northern Ireland.
Data for other parts of the NEAME were not acquired or discussed in this regard.
The predicted changes are summarised as follows:
• Nights warm by more than days during winter;
• Days warm by more than nights during summer;
• During autumn and spring, changes would be less marked; and
• In the northwest UK, there would be decreases in diurnal range whilst in the southeast UK
experiencing increases.
During the workshop assessment, this parameter was considered to be a potential impact
only upon intertidal invertebrate fauna and flora. No quantification was applied to the
assessment, although consideration of the effect of an increase in mean annual air
temperature was included (Section 5.2)
4.8 CATASTROPHIC SCENARIOS
The scoping report assessed the necessity to consider potential non-incremental and
high impact characteristics of climate change, The scoping exercise considered it
appropriate to consider, as a catastrophic scenario, the threat of a Gulf Stream
slowdown, where the decline in this process would result in a multi-degree decline in
temperature over a very short time period (a few decades at most). Though the scoping
study dismissed the scenario of the mass release of methane trapped in methane hydrate
reservoirs, this scenario was presented and discussed at the workshop. The main reason
for this was that though the scoping study identified the lack of evidence for substantial
and vulnerable reservoirs of methane hydrate in the NEAME, the large amounts in
adjacent regions, particularly in the Arctic, suggested a potential risk to the NEAME
might remain. The following sub-sections summarise the presentations and discussions
at the workshop and explain why it was concluded that neither posed a significant threat
to the NEAME within this century.
Methane release from methane hydrate sources
Methane hydrate is an ice-like substance that has molecules of methane trapped within a
cage of water molecules. This cage allows the methane molecules to be held close
together, much closer than in a free gas. There is up to 164m3 of gas at standard
temperature and pressure, and 0.8m3 of water, in 1m3 of solid hydrate. However,
methane hydrate is not stable at normal temperatures and pressures. Methane hydrate
22exists at higher pressures and generally lower temperatures (Figure 4.7). Such
conditions exist on the continental slopes around the world and under permafrost in the
northern hemisphere. Current estimates of global reserves of methane hydrate are
2x10¹⁴ m3 of methane in natural gas hydrate (Soloviev, 2002). This is about 30 times the
amount of methane in the present atmosphere, where it is a powerful greenhouse gas. As
well as being found in water depths generally greater than 500m on virtually all
continental margins, hydrates associated with permafrost have been encountered in
Siberia, Alaska and the Canadian Arctic 40
(Kvenvolden and Lorenson, 2001). 35 Methane hydrate
However unlike other resources, their 30
occurrence and relationship with host
Pressure MPa
25 methane in seawater
sediments is poorly understood, and it is
only with improvements in this that their
20
Methane gas and water
input to the global carbon cycle will be 15
4
better understood . 10
methane in pure water
5
Generally in the NEAME, there is a 0
paucity of evidence for the presence of -10 0 10
Temperature °C
20 30
methane hydrates, even in the deep waters Figure 4.7. The relationship between
west of the UK, despite the extensive temperature and pressure for the stability of
surveys conducted as part of hydrocarbon methane hydrate in seawater and freshwater.
exploration, as well as numerous academic
studies. Adjacent to the NEAME,
however, methane hydrates are known to occur in the Arctic, both terrestrially in
permafrost and in marine sediment layers.
Methane hydrates trapped under pressure in marine sediments are not likely to be
exposed to conditions resulting in their release in the coming centuries, given that sea
levels (and hence pressure) is not predicted to fall. As such, it has been concluded that
the potential for large-scale release of methane from a hydrate source in a catastrophic
manner in or adjacent to the NEAME is too remote a possibility to consider further in
this assessment.
Methane is around 25 times as effective a greenhouse gas as carbon dioxide, thus,
methane from the global hydrate reservoir reaching the atmosphere represents a
significant potential contributor to global warming. Already, the extent of permafrost is
decreasing as it melts due to inundation by water (at temperatures above freezing) and
air temperature rises. The loss of this permafrost (in arctic and other regions) that is
trapping methane hydrate is already leading to the release of methane direct to the
atmosphere. With climate change further increasing air and sea temperature as well as
sea level rise, there is the probability of an increase in the amount of permafrost being
melted. Thus, there is the real potential to develop a significant positive feedback
system in which gas hydrate release responds to, and accentuates, global warming. It is
striking that the melting of permafrost and the consequential release of methane at
present seems to be unmeasured and is not being monitored.
4
Similarly, the potential for their exploitation as a carbon-based energy source is being researched.
23Gulf Stream slowdown
As described above (Section 4.3), the ocean circulation of the NEAME in general and
the Gulf Stream specifically (including, in this scenario thermohaline circulation),
indicate that climate change impacts may be characterised by some directional and
strength changes over the coming decades. However, these changes are relatively small
and there remains only the remote possibility of a dramatic and rapid decline in the
stream.
As such, for the purpose of this assessment, the potential for this catastrophic scenario
being realised is considered not to be a likely threat to the NEAME.
5. Ecological baseline and current trends
5.1 PLANKTON
Over the last decade there has been a progressive increase in the presence of warm-
water/subtropical species into the more temperate areas of the north-east Atlantic, with
2003 continuing with this trend. Sea Surface Temperature (SST) was very high in the
North Sea during 2003, particularly in August and September (Edwards et al., 2005). In
the north-east Atlantic, over the past four decades, plankton characteristic of warmer
water have advanced northwards by
10° latitude. In similar fashion cold
water plankton assemblages have
retreated north. There is no
equivalent to this in terrestrial
studies (Beaugrand et al., 2002;
Beaugrand, 2003; Edwards and
Johns, 2005).
Beaugrand and Ibanez (2004)
identify a regime shift for North Sea
planktonic ecosystems during the
period 1958-1999 (Figure 5.1). From
1962-1982 the regime is, ‘cold-
biological’, from 1984-1999 it is,
‘warm biological’. This regime shift
was forced by local and regional
hydroclimatic (wind and
temperature) changes in conjunction
with the change in the location of the
Figure 5.1: Maps showing the changing biogeographic
oceanic biogeographical boundary in distributions of a warm temperate (top) and sub-arctic
the North-East Atlantic. The results assemblage (bottom) of planktonic copepods between
of Beaugrand and Ibanez (2004) the years 1960-63 and 1996-99 (Beaugrand et al., 2002).
Reproduced with permission of Martin Edwards,
indicate a strong dependence of SAHFOS.
ecological processes in the North Sea
24to both hydro-climatic and biological variability in the north-east Atlantic Ocean. With
current climatic warming, further regime shifts are possible, which may confound
attempts to predict future responses of North Sea pelagic ecosystems.
Calanus finmarchicus and C. helgolandicus
The most abundant zooplankton species in the North East Atlantic are copepods
(DEFRA, 2005c). In the NEAME, an estimated 90% dry weight of the total biomass of
zooplankton may be attributable to species of the genus Calanus (OSPAR QSR 2000).
Against the backdrop of inter-annual variations, the Continuous Plankton Recorder
(CPR) records show an overall downward trend in copepod abundance in much of
Areas 1, 2 and 3 with the decline particularly evident on the Malin Shelf and to the west
of Ireland in this latter region (OSPAR QSR 2000, 2000c). More recent analysis
(Edwards et al., 2005) of North Atlantic CPR data from 1946-2003 shows that copepod
abundance is in long-term decline in many areas to the east of Iceland.
The ratio of the cold-temperate Calanus finmarchicus to the warm-temperate Calanus
helgolandicus is a useful indicator of the warming trend in the North Sea (Figure 5.2).
The dominance of C. helgolandicus over the last decade is clear. It should also be noted
that the overall abundance of Calanus in the North Sea has considerably declined. This
has important implications for other trophic levels (Edwards and Johns, 2005). A similar
pattern has been observed in the Celtic seas (Nash and Geffen, 2004), with C.
helgolandicus becoming more numerically abundant during warmer conditions (such as
a positive NAOI).
The relative abundance of the two Calanus
species has been shown to reflect both the
northerly movement, by 10° latitude, of
warmer water plankton in the last 40 years
(as mentioned above) and changing
patterns of inflow of oceanic water into the
North Sea (DEFRA 2003, Reid et al.,
2003).
Calanus finmarchicus over-winter at
depths of 500 to 1500m in the Norwegian
Sea, Faroe-Shetland Channel and other
seas. During mid-late summer, pre-adult
Figure 5.2: The abundance of Calanus
stages become dormant and sink out of the populations in the North Sea from 1960 to 2003.
surface waters. For up to six months they The percentage ratio of Calanus finmarchicus
exist in a state of hibernation or, timing (blue) and Calanus helgolandicus (red) are shown
in relation to total Calanus abundance in each
their return to near surface waters to annual bar. Reproduced with permission of
coincide with the spring phytoplankton Martin Edwards, SAHFOS.
bloom (OSPAR 2000; Heath et al., 2004
and FRS 2004).
In the north east Atlantic, Calanus finmarchicus emerge from dormancy in early
February and over a period of about one month ascend to the surface waters. On arrival
25You can also read