The State of Birds in Switzerland - Special Issue on the Breeding Bird Atlas 2013-2016 - PECBMS
←
→
Page content transcription
If your browser does not render page correctly, please read the page content below
The State of Birds in Switzerland
Special Issue on the Breeding Bird Atlas 2013–2016
Breeding Bird Atlas 2013–2016:
Key findings
Specialists are in decline and generalists
on the rise, increasing the potential for
conflict with unpopular species.
page 6
Many long-distance migrants have lost
ground. Insectivores in particular are in
steady decline.
page 14
Several birds of prey have made a long-
term recovery. These popular, iconic birds
are well protected by law. page 16
The effects of global warming are clearly
visible and have caused several species to
move to higher ground. Many birds are at
risk from climate change, but only few
stand to benefit. page 18
2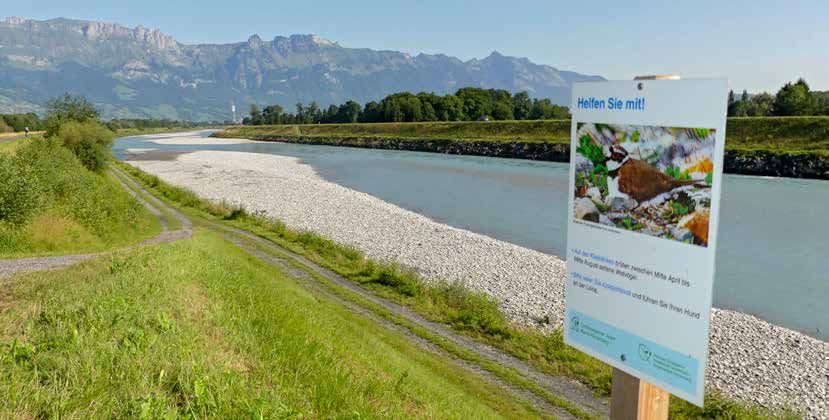
Farmland birds have suffered the greatest
losses. While the lowlands are most affect-
ed, pressure is increasing in the mountains
as well. page 20
Several woodland species have increased
in number. The growing forest area,
nature-friendly forest management and
more deadwood have given woodland
birds a boost. page 24
Conservation action has become essential.
Recovery measures have succeeded in
reversing the trend for several threatened
species. page 34
Contents
Editorial ..................................................................................................... 4
Birds as environmental indicators ........................................................... 6
Overview ................................................................................................... 8
Recent trends .......................................................................................... 14
Situation in the habitats ......................................................................... 20
Further information
Human disturbance ................................................................................. 32
Visit our website for a review of
Species conservation .............................................................................. 34 2017, including population trends of
breeding birds, results of the water-
Fieldwork & analyses .............................................................................. 36 bird census and additional analyses:
Acknowledgements ................................................................................ 40 www.vogelwarte.ch/state
3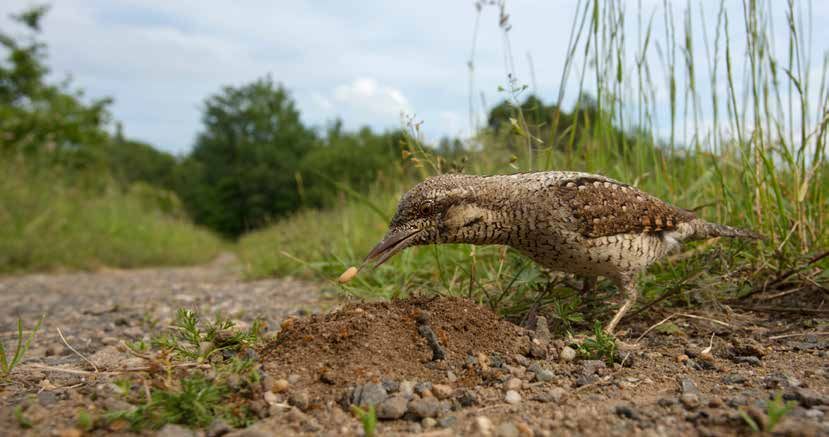
EDITORIAL
The atlas – a milestone
The 2018 report on «The State of Birds all parts of the country. This atlas, the
in Switzerland» is a very special one. fourth in a series of atlases published
For once, our report does not present at 20-year intervals, again triggered a
the results of the latest annual counts wave of enthusiasm among our volun-
of breeding birds and wintering water- teers, who responded with countless
birds; rather, it summarises the key find- hours of skilled fieldwork. Their tremen-
ings of the «Swiss Breeding Bird At- dous effort is acknowledged on pag-
las 2013–2016» and in doing so takes es 40–43.
stock of the developments of the past But the Swiss Breeding Bird Atlas
20 years. 2013–2016 is a momentous event for
For the next 20 years, the Swiss the Swiss Ornithological Institute as
Breeding Bird Atlas 2013–2016 will be well: from planning and preparation to
the standard work of reference when it the printing of the book, the creation
comes to assessing the state of our na- of the website and, finally, the publi-
tive bird communities and how they are cation of journal articles, the atlas will
changing over time. Its findings paint a have kept us busy for almost ten years.
clear picture of how we impact our en- Our atlas team set its goals high, fig-
vironment. For example, the atlas re- ured out how to achieve them, direct-
veals that woodland birds (with some ed the volunteer collaborators, prepared contributions from institutions or small
exceptions) are doing well. In contrast, all the materials, checked the data, clar- and large amounts from individuals
birds that breed in farmland have suf- ified uncertainties, sent annual progress who sponsored a species account or ex-
fered further dramatic declines, leading reports to the observers in charge of the pressed their recognition for this unique
to the disappearance of some species at atlas squares, analysed the data, mod- project in other ways.
a regional scale or – in the case of the elled distribution and the change in We hope that the Swiss Breeding
Woodchat Shrike – from all of Switzer- distribution, generated the maps, pro- Bird Atlas 2013–2016 will not remain a
land. We explain the reasons for the duced population estimates, wrote, ed- simple documentation, but will give rise
various trends and suggest ways to pre- ited and translated the texts so that the to targeted measures in support of our
serve and promote our native birdlife. atlas could be made available in four bird communities and, in turn, benefit
Indeed, urgent action is called for to languages. All of this was only possible nature and the environment.
support our bird communities. thanks to a remarkable degree of com-
In Switzerland, breeding birds are mitment and enthusiasm for this collab-
the best monitored group of wild an- orative project. Prof. Dr. Lukas Jenni
imals, thanks to the tireless, dedicated Last but not least, we are grateful to Chairman of the Board of Directors
and often decade-long effort of more our numerous donors for their gener- and Scientific Director
than 2000 volunteer collaborators in ous support, be it in the form of larger
Atlas historique des oiseaux nicheurs
Historischer Brutvogelatlas
Die Landschaften in der Schweiz haben sich in Ces dernières décennies, les paysages de Suisse
den letzten Jahrzehnten stark verändert, was ont subi d’importantes mutations qui se sont
tiefgreifende Auswirkungen auf die Vogelwelt fortement répercutées sur l’avifaune. Ce livre
hatte. Dieses Buch illustriert diesen Wandel illustre cette évolution, en s’appuyant sur la ré-
anhand der Verbreitung der Brutvögel in den
Jahren 1950–59, 1972–76 und 1993–96. Die
Darstellung der verflogenen Vielfalt ist ein Plä-
partition des oiseaux nicheurs dans les années
1950–59, 1972–76 et 1993–96. La présenta-
tion de cette diversité révolue constitue un plai-
Historischer Brutvogelatlas
doyer für einen nachhaltigeren Umgang mit doyer en faveur d’une gestion durable de la Die Verbreitung der Schweizer Brutvögel seit 1950
dem Naturreichtum der Schweiz. nature et de ses richesses en Suisse.
Atlas historique des oiseaux nicheurs
La répartition des oiseaux nicheurs de Suisse depuis 1950
1950–1959
Knaus et al. 2011
1972–1976
Schifferli et al. 1980
Documenting trends in bird communities in Switzerland is one of the 1993–1996
Swiss Ornithological Institute’s core missions. The 2013–2016 breeding Schmid et al. 1998
bird atlas is a further milestone that has earned the institute interna- 2013–2016
tional recognition. Knaus et al. 2018
4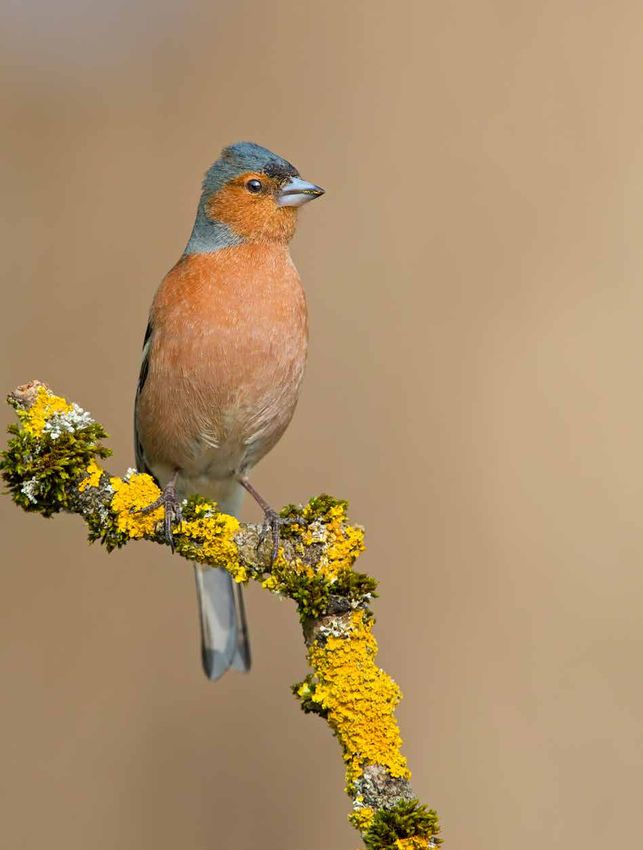
Territories/km2                                                    >79
                                                                   >79

                                                                   60   60
                                                                   40   40
                                                                   20   20
                                                                   0     0

   The Chaffinch is the most common breeding bird in Switzer-
   land, with about one million breeding pairs. Its density map
   shows that it occurs in high densities in wooded areas across
   the country.

                                                                   5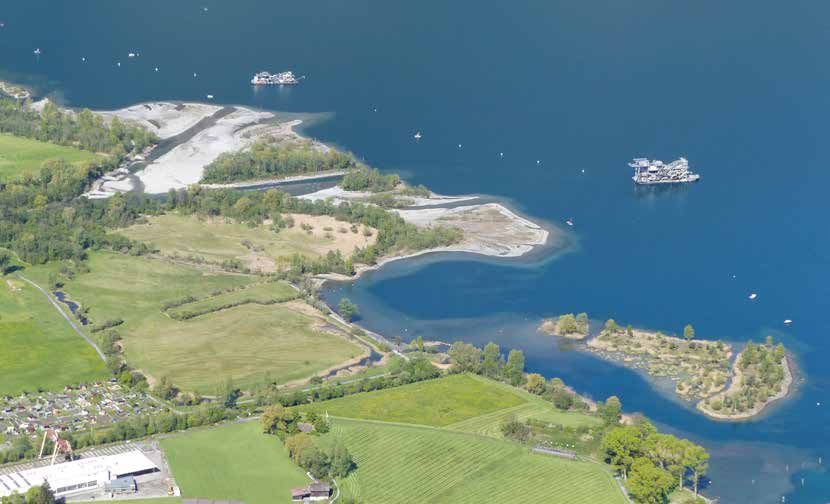
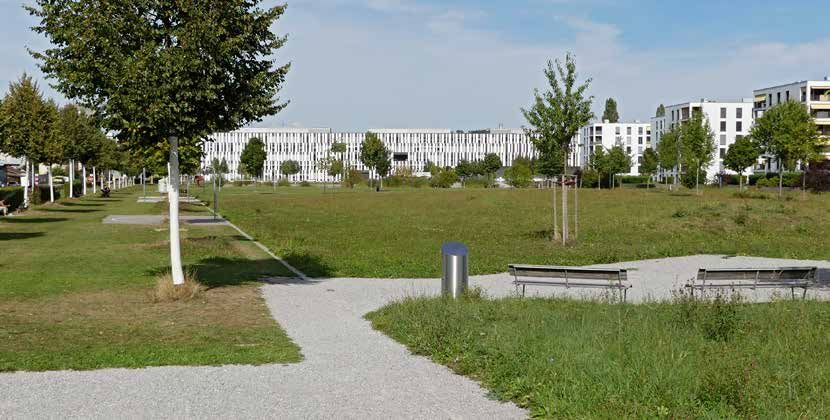
The pressure of urbanisation and the Swiss preference for «tidy» landscapes: unfavourable conditions for many bird species with special requirements.

Birds reflect the state of
the environment

Birds delight us with their colour-                  mercury from industrial waste and to                • Birds are easier to observe than most
ful plumage, their song, their feats of              other toxins, and observations of mi-                 other animals: they are fairly large,
flight and their behaviour. But they are             grant birds arriving earlier in the sea-              quite prominent, mostly active dur-
also excellent bioindicators, meaning                son were among the first signs of global              ing the day, can be identified from
that they provide information on the                 warming. Birds are therefore general-                 a distance, and the number of spe-
state of the environment and our im-                 ly considered important indicators for                cies is manageable.
pact on nature. In some ways, birds re-              the state of the environment. There are             • Therefore, birds are comparatively
semble us: they share our living space               good reasons for this:                                easy to monitor and count. We have
and have similar requirements in terms
of soil, water, air, vegetation and food.
In fact, our kinship with birds has of-
ten served us well. Take, for example,
the proverbial canary in the coal mine.
Coal miners used to carry a canary into
the mine. If there was any danger from
toxic gasses, the canary would fall si-
lent, warning the miners to leave the
coal mine and make their way to safety.
    The most sensitive creatures are the
first to signal an imminent threat to the
entire system. In the early 1970s, the
collapse of Peregrine Falcon and Bald
Eagle populations revealed the dan-
gerous effects of the insecticide DDT
before it could harm human health.                      Peregrine Falcons are not only among the world’s fastest animals, they are also top predators.
Birds have drawn our attention to the                   Because many pesticides accumulate in the food chain, these birds are early indicators of environ-
                                                        mental toxins.
environmental pollution caused by

 6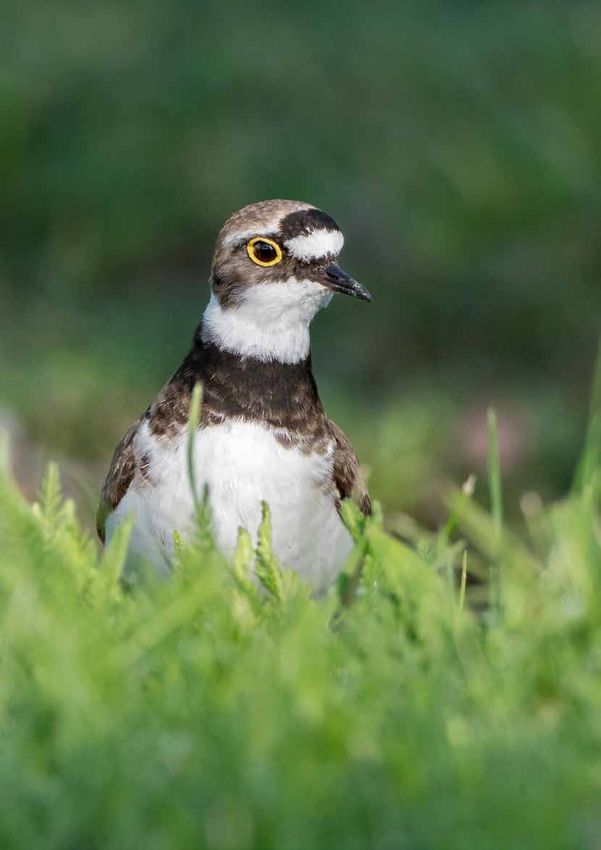
B I R D S A S E N V I R O N M E N TA L I N D I C AT O R S

The Common Cuckoo shows a marked decline below 1500 m asl, drawing our attention to the fact that butterflies are in great difficulty, as the Cuckoo is a
specialist that feeds largely on caterpillars. Butterflies and Cuckoo need more tapered, semi-natural forest edges and adjacent flowery meadows.

  documented their distribution and                  • Birds occupy almost all habitats.                    nature conservation and environmental
  abundance for decades and have ex-                    Changes in the populations of dif-                  protection should therefore not only be
  cellent data that allow us to identify                ferent species point to changes tak-                measured by the number of implement-
  changes.                                              ing place in their respective habitats.             ed management plans or the amount of
• Birds respond with sensitivity to                  • To a certain degree, birds are repre-                money invested – though both these
  changes in our shared environment.                    sentative of other groups of organ-                 things are undoubtedly very important
  They are at the top of the food chain                 isms; moreover, they orient them-                   – but also by the state of bird commu-
  (just like us), where negative influ-                 selves at a spatial scale that is relevant          nities. This will show us how hospita-
  ences can accumulate.                                 in terms of our spatial planning.                   ble landscapes and habitats are for an-
• We know a lot more about birds                     In short, birds convey a detailed picture              imals and humans and where there is
  than about most other groups of                    of the state of the environment and al-                cause for alarm.
  animals and plants. We know their                  low us to detect changes in habitat con-
  life histories and their habitat re-               ditions at an early stage. Understand-
  quirements, which allows us to                     ing birds allows us to read the signs of                        Further information
  correctly interpret changes in bird                the times. Birds are a reliable measure                         www.vogelwarte.ch/atlas
  communities.                                       of sustainability. Our future efforts in

Habitat structures like hedges have been removed from our landscapes, and the land has been built up and overused, leaving less space for birds with particu-
lar requirements. Less specialised, highly adaptable species, so-called generalists, are the ones that benefit, such as Yellow-legged Gull, Rook and Common
Woodpigeon. Their populations have grown since 1993–1996, and they increasingly occupy habitats in proximity to humans, increasing the risk of conflict.

                                                                                                                                                           7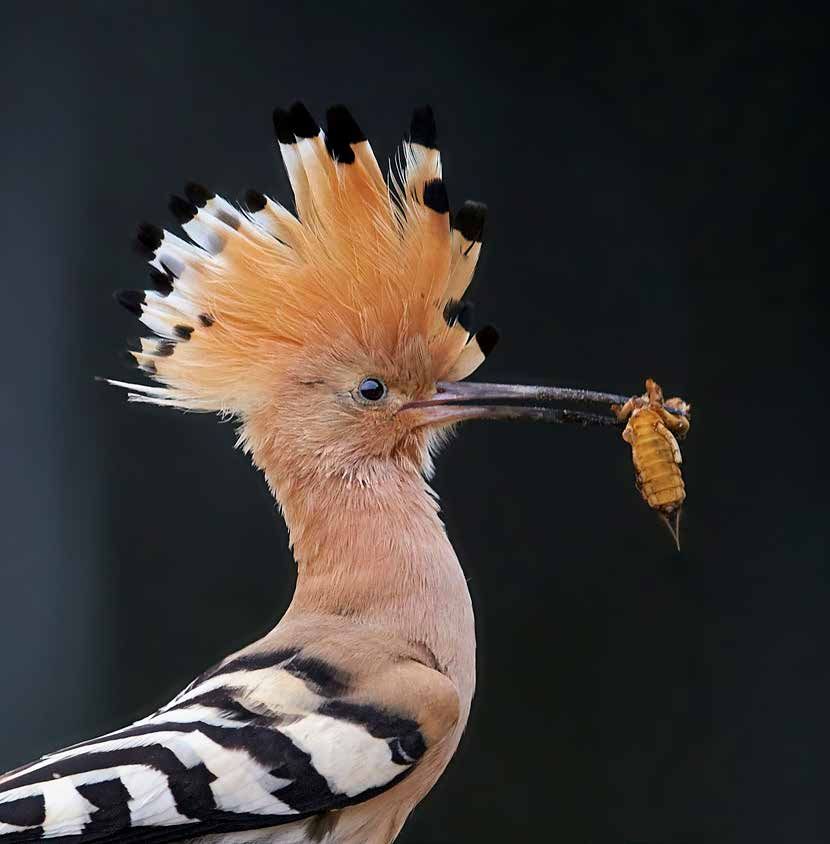
Number of species/10 × 10 km                                                          99 100
     140
     140                                                                          91 104 109 105 111 126
     120
     120                                                101 96           110 100 106 104 98 108 97 97 95 73
     100
     100
                                                   101 103 112 100 91 96 105 114 103 90 91 87 89 89 91 85 124
     80
      80
                                  103 110 97 96 101 101 84 93 97 110 100 96 107 88 80 81 85 86 90 87 112
     60
      60
                                   91 93 97 95 93 90 93 102 95 95 105 110 92 110 99 79 76 78 81 94 110
     40
      40

     20
      20
                                   88 92 89 95 97 114 112 99 82 89 92 107 84 98 111 121 91 92 92 131 104

     0   0                     97 90 93 106 118 109 99 79 86 111 97 95 99 99 102 116 124 110 99 107 123 90
                          106 107 109 125 108 101 90 81 72 79 97 94 101 103 111 103 105 93 101 92 106 125 78 78
                   95 99 99 112 124 120 109 97 104 84 81 82 84 95 118 111 107 112 96 87 95 86 83 118 124 94 76                                     72 88
                   88 95 119 111 120 104 104 83 106 86 78 88 94 93 115 98 115 102 88 88 79 87 73 120 123 96 87 62                              60 107 94
                   97 122 122 111 105 104 89 87 94 91 85 96 100 112 95 92 69 99 69 62 104 110 101 117 96 93 85 59 98 104 100
               101 112 109 86 88 94 101 93 95 113 133 118 123 107 105 94 80 79 92 98 98 92 96 93 113 102 96 58 88 92 67 71
             98 101 110 99 78 81 87 104 100 97 98 104 121 109 93 70 81 34 91 83 85 58 77 87 84 96 102 82 73 101 59 65 101 89
     104 101 108 96 104 97 87 100 109 97 98 94 96 87 90 32 8                  90 84 83 94 90 94 49 71 75 77 86 44 102 60
     91 104 104 82        73 90 107 103 92 98 98 87 79 66 23 93 105 76 70 78 90 91 69 82                             64 61 100 77 76 75
     113 103 93                140 132 94 93 89 82 104 95 78 109 95 73                80 78 76 100 76 91 87              95 78        54 90
106 99 104 94                  116 111 96 96 121 109 135 120 112 106 47           85 84 91 80 98 101 91                                   92
115 109 104                    94 111 113 123 107 85 86 76 77 78 80                   83 99 123 124 101 71
                               65 98 116 92 70 88 71 78 73 71 70                           92 92 91 85
                                   85 91 84 66 65 55 81 20 19                                  80 90 73
                                       79 76 28                                                    80 87
                                                                                                   75 77

2013–2016 breeding bird atlas: the number of recorded species per atlas square (10 × 10 km). The most species-rich squares are in areas where all impor-
tant types of habitat occur, from lowland wetlands to Alpine habitats.

Swiss birdlife in numbers
The main objective of the 2013–                      species of breeding birds were found                species were counted per kilometre
2016 atlas is to document the cur-                   in 2013–2016 (on Swiss territory: 204               square. In total, 745 428 territories
rent distribution and population num-                as well as six non-native species), 13              were detected during the surveys. The
bers of breeding birds in Switzerland                more than during the last atlas sur-                most abundant species is the Com-
and Liechtenstein. Equally important                 veys. However, four of these new spe-               mon Chaffinch, with an estimated
is showing the changes in distribu-                  cies are not native to Switzerland. On              0.9–1.1 million breeding pairs. The
tion over the past decades. The goals                average, 93 species were recorded per               Black Redstart remains our most uni-
are therefore similar to those of the                atlas square. The most species-rich at-             versal bird: it was recorded in 94.7 %
1993–1996 atlas:                                     las square was Vouvry VS with 140                   of all surveyed 1-km squares, mak-
                                                     species; only eight species were re-                ing it the most widespread, though
1. to document all breeding bird spe-                corded in the atlas square in the Fin-              not the most abundant bird species.
   cies present in each atlas square                 steraarhorn area BE/VS, due to the                  Woodland birds like Common Chaf-
   (10 × 10 km), as far as possible,                 natural topography, making it the                   finch, Eurasian Blackcap and Com-
2. to determine the abundance of                     square with the smallest number of                  mon Blackbird, present in forests at
   breeding birds using territory map-               species.                                            all altitude levels, are the ones with
   ping surveys, and                                                                                     the largest populations. The number
3. to record rare and colonial species               Results in the kilometre squares                    of species and territories decreases
   as comprehensively as possible.                  The territory mapping surveys in 2318                with increasing altitude: at 600 m asl,
                                                    kilometre squares, which make up                     a kilometre square on average held
Country-wide results                                about 5 % of the total area within the               50 species with 396 territories; at
A total of 467 atlas squares measur-                atlas perimeter, provide a comprehen-                1200 m, 48 species with 351 territo-
ing 10 × 10 km were surveyed in Swit-               sive and representative data set with a              ries were found, and 38 species with
zerland and Liechtenstein as well as                huge potential for analysis, especially              209 territories at 1800 m.
in areas just beyond the Swiss bor-                 of common and widespread species.
der. Within the atlas perimeter, 216                On average, 239.6 territories of 35.4

 8
OVERVIEW

Territories/km2
    1000
    1000

    800
     800

    600
     600

    400
     400

    200
     200

    0   0

                                                                                                          Total number of modelled breeding bird territo-
                                                                                                          ries in the kilometre squares. The habitats with
                                                                                                          the most abundant birdlife are found in the low-
                                                                                                          lands north of the Alps as well as in Valais and
                                                                                                          Lower Engadine

 Overview of the 2013–2016 atlas data                                           Most abundant & widespread species
                                                                                                               Present in % of          Population size
   Total number of records                                       3 169 412      Species                         surveyed km2              (territories)
   of which records from territory mapping surveys               1 524 429      Black Redstart                          95 %        300 000–400 000
   Number of kilometre squares with at least one record      36 002 (77 %*)      Common Chaffinch                        88 %       900 000–1 100 000
   Surveyed kilometre squares                                  2318 (5 %*)      Eurasian Blackcap                       80 %        700 000–800 000
   * = in percent of the entire survey area (46 202 km2)                         Common Blackbird                        81 %        500 000–700 000
                                                                                 European Robin                          81 %        450 000–650 000
                                                                                 Coal Tit                                72 %        400 000–600 000

 Surveys in kilometre squares                                                   Atlas squares with highest and lowest species richness

   Average number of species                                           35.4      Vouvry (square 55/13)                                     140 species
   Min./max. number of species                                         2 / 69    Pfynwald (61/12)                                          135 species
   Average number of territories                                        240      Thun (61/17)                                              133 species
   Min./max. number of territories                                   3 / 742     Leysin (56/13)                                            132 species
   Total number of territories                                      745 428      Sennwald (75/23)                                          131 species
   Average survey time (per kilometre square)                   10 h 49 min.     .....
   Number of survey visits                                             9095      Mattmark (64/9)                                             19 species
   Total survey effort                                     3.9 working years     Finsteraarhorn (65/15)                                       8 species

                                                                                The atlas square «Vouvry» at the eastern end of Lake Geneva accommo-
                                                                                dates diverse habitats and is therefore the most species-rich area.

                                                                                                                                                           9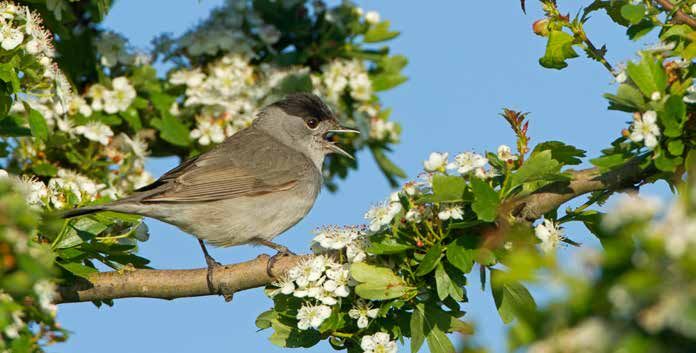
Number of species/km2
2.002
1.001
0,5
0.50
0.25
0.000
−0.25
–0,5
−0.50
–1
−1.00
–2
−2.00
Distribution change of Red-List species (2001/2010) since 1993–1996. The map combines the change maps of 27 species with sufficient data to model the
occurrence probability for both atlas periods (most of the remaining 50 species are extremely rare).
Number of species remains
constant, but...
To come straight to the point: the «bare increased from one atlas to the next, our of many areas have changed fundamen-
figures» in the breeding bird atlas must level of knowledge has grown, the effort tally. On the other hand, the geographic
be interpreted with great care. On the put into the surveys increased enormous- scale of the maps plays a critical role: al-
one hand, the number of observers ly, and mobility as well as the accessibility though many species that are moderately
White-backed Woodpecker
Western Yellow Wagtail
New breeders
Short-toed Snake Eagle
Eurasian Collared Dove
Red-crested Pochard
Black-necked Grebe
Common Rosefinch
European Bee-eater
Mediterranean Gull
Common Shelduck
Melodious Warbler
Yellow-legged Gull
Common Pochard
Bearded Reedling
Great Cormorant
Bearded Vulture
Barred Warbler
Common Eider
Cetti’s Warbler
Savi’s Warbler
Purple Heron
Tufted Duck
Tawny Pipit
Pallid Swift
Bluethroat
Mew Gull
Fieldfare
Gadwall
Rook
1910 1920 1930 1940 1950 1960 1970 1980 1990 2000 2010
– – – – – – – – – – –
1919 1929 1939 1949 1959 1969 1979 1989 1999 2009 2018
Western Orphean Warbler
Disappeared
Common Redshank
Lesser Grey Shrike
Great Grey Shrike
Woodchat Shrike
Eurasian Curlew
Ortolan Bunting
Crested Lark
Osprey
Overview of species that have appeared in Switzerland since 1910 and have established themselves as breeders (top) and traditional breeding birds that
have disappeared from Switzerland (bottom). The Bearded Vulture was reintroduced.
10OVERVIEW
Swiss breeding bird communities are (too) dynamic
No more records: the Woodchat Shrike, once a Dwindling numbers: the Ortolan Bunting occu- Brief appearance: a pair of Black-winged Stilts
widespread breeding bird, has disappeared from pied 150–250 territories 20 years ago, but there attempted to breed in 2013.
Switzerland. have been no breeding records since 2014.
New breeder: the European Bee-eater has bred Gaining a foothold: following the first breeding Unwanted invasive species: the Ruddy Shelduck
in Switzerland since 1991 and exceeded the record in 2012, 3–5 Short-toed Snake-eagle and more recently the Egyptian Goose (image)
threshold of 100 breeding pairs in 2017. pairs have now become established. have established breeding populations.
common or scarce have decreased, this species require larger habitats, are sensi- surveys in the 1990s. Most affected are
change is often not visible on the distri- tive to human disturbance, rely on large those 40 % of our native breeding birds
bution maps at the 10 × 10 km scale. For insects for food, or are ground breed- that are quite rare or whose populations
example, if there used to be one hun- ers exposed to the threats of farming are declining. For example, it is already
dred pairs in a given atlas square, but machinery and predation. For many of clear that several species will have to be
only one now remains, the atlas square them, conditions in Switzerland have be- added to the new Red List when it is pub-
will still appear as occupied on the map. come even more precarious since the last lished in 2020.
For this reason, we decided not to pub-
lish the number of occupied atlas squares
per atlas period for any species direct- Probability of occurrence/km2
ly. Comparisons of the detailed results 1.0 1
from those kilometre squares that were
0,5
0.5
surveyed in both 1993–1996 and 2013–
2016 are much more informative. 0.0 0
–0,5
−0.5
Homogenisation continues
−1.0
–1
The few species that bred in Switzer-
land for the first time – mostly concern-
ing just a handful of pairs – produce a
positive overall balance in the num-
ber of current breeding species in pure-
ly arithmetic terms. But the populations
of many breeding birds in Switzerland
are in marked decline and often show
range contractions as well. Overall, we
face a situation that is more unstable
than necessary. The groups most affect-
ed by declines are wetland birds, birds
No more dove talk? The results of the 2013–2016 atlas surveys do not bode well for the European
that breed in low-intensity farmland, and/ Turtle-dove. Even in its former hotspots in Geneva, Vaud and Ticino, the species is in marked decline
or long-distance migrants. Often, these (red areas).
11OVERVIEW
Population trend, status and population size of breeding birds in Switzerland in 1950–1959, 1972–1976, 1993–1996 and
2013–2016
Each of the following 216 species bred in Switzerland in at least one of the four atlas periods in the 1950s, 1970s, 1990s
and/or the 2010s. ● = annually, ○ = irregularly, ♦ = exceptionally. (=) population largely constant or fluctuating, or no signifi-
cant trend; ++ = strong increase, X = no trend could be calculated. Trends can only be determined for 174 species currently
classed as regular breeders. The maximum decline is –100, while an increase can exceed +100.
pairs/broods)
pairs/broods)
in 2013–2016
in 2013–2016
(territories/
(territories/
Population
Population
1990–2017
2008–2017
1950–1959
1972–1976
1993–1996
2013–2016
1990–2017
2008–2017
1950–1959
1972–1976
1993–1996
2013–2016
Trend
Trend
Trend
Trend
Species Species
Common Quail (=) (=) ● ● ● ● 500–2 000 Grey Heron 32 36 ● ● ● ● 1 600–1 800
Rock Partridge –57 (=) ● ● ● ● 2 500–4 500 Purple Heron ++ ++ ● ● ♦ ● 6–17
Common Pheasant X X ● ● ● ● 40–60 Great White Egret X X ♦ 0–1
Grey Partridge (=) (=) ● ● ● ● 5–10 Little Egret X X ♦ 0–1
Hazel Grouse (=) 26 ● ● ● ● 3 000–5 500 Great Cormorant ++ 462 ● 1 200–2 100
Rock Ptarmigan –33 (=) ● ● ● ● 12 000–18 000 Black-winged Stilt X X ♦ 0–1
Western Capercaillie –35 (=) ● ● ● ● 360–470 Eurasian Dotterel X X ♦ ○ 1–3
Black Grouse (=) 14 ● ● ● ● 12 000–16 000 Little Ringed Plover (=) (=) ● ● ● ● 90–120
Mute Swan X X ● ● ● ● 590–720 Northern Lapwing –55 89 ● ● ● ● 140–180
Greylag Goose X X ● ● 45–60 Eurasian Curlew –97 X ● ● ● 0
Common Eider X X ● ● 1–5 Common Snipe –93 X ● ● ○ ♦ 0–1
Common Goldeneye X X ♦ ♦ 0 Eurasian Woodcock –12 (=) ● ● ● ● 1 000–4 000
Red-breasted Merganser X X ♦ ♦ 0–2 Common Sandpiper (=) 73 ● ● ● ● 70–90
Goosander 109 22 ● ● ● ● 600–800 Black-headed Gull –62 (=) ● ● ● ● 560–800
Egyptian Goose X X ● 8–13 Mediterranean Gull ++ (=) ♦ ○ ○ 0–5
Ruddy Shelduck X X ● ● 10–15 Mew Gull (=) –94 ● ● ○ 0–3
Common Shelduck X X ♦ ● 1–4 Yellow-legged Gull ++ 54 ● ● ● 1 240–1 430
Wood Duck X X ♦ ♦ 0–1 Arctic Tern X X ♦ 0–1
Mandarin Duck X X ♦ ♦ ● ● 10–20 Common Tern 149 (=) ● ● ● ● 580–760
Red-crested Pochard 973 65 ● ● ● ● 210–300 Common Barn-owl –19 (=) ● ● ● ● 200–1 000
Common Pochard (=) (=) ♦ ● ● ● 6–9 Eurasian Pygmy-owl (=) (=) ● ● ● ● 800–2 000
Ferruginous Duck X X ♦ ♦ 0–1 Little Owl 181 84 ● ● ● ● 115–150
Tufted Duck 78 (=) ♦ ● ● ● 160–280 Boreal Owl (=) (=) ● ● ● ● 1 000–3 000
Garganey X X ♦ ♦ ♦ ♦ 0–1 Eurasian Scops-owl 172 (=) ● ● ● ● 30–40
Northern Shoveler X X ♦ ♦ ○ 0–1 N. Long-eared Owl 15 (=) ● ● ● ● 2 000–3 000
Gadwall 137 (=) ♦ ♦ ● ● 5–10 Tawny Owl (=) (=) ● ● ● ● 6 000–8 000
Common Teal X X ○ ○ ○ ○ 0–2 Eurasian Eagle-owl (=) (=) ● ● ● ● 200–230
Mallard 24 (=) ● ● ● ● 20 000–30 000 Europ. Honey-buzzard 20 (=) ● ● ● ● 500–1000
Little Grebe –19 (=) ● ● ● ● 800–1 300 Bearded Vulture ++ 433 ● 9–15
Black-necked Grebe (=) 405 ○ ○ ○ ○ 3–4 Golden Eagle 16 (=) ● ● ● ● 350–360
Great Crested Grebe –26 (=) ● ● ● ● 3 500–5 000 Short-toed Snake-eagle X X ○ 3–5
Feral Pigeon X X ● ● ● ● 20 000–35 000 Western Marsh-harrier X X ○ ♦ ♦ 0–3
Stock Dove 58 32 ● ● ● ● 2 000–4 000 Montagu’s Harrier X X ○ ♦ 0
Common Woodpigeon 215 40 ● ● ● ● 130 000–150 000 Eurasian Sparrowhawk 26 (=) ● ● ● ● 3 500–6 000
European Turtle-dove –43 –29 ● ● ● ● 150–400 Northern Goshawk (=) 17 ● ● ● ● 1 300–1 700
Eurasian Collared-dove 50 (=) ● ● ● ● 15 000–25 000 Red Kite 552 64 ● ● ● ● 2 800–3 500
European Nightjar –18 –18 ● ● ● ● 40–50 Black Kite 112 (=) ● ● ● ● 2 000–3 000
Alpine Swift 107 (=) ● ● ● ● 1 800–2 300 Eurasian Buzzard 33 (=) ● ● ● ● 15 000–20 000
Pallid Swift 165 (=) ● ● 29–36 Common Hoopoe 56 (=) ● ● ● ● 180–260
Common Swift (=) (=) ● ● ● ● 40 000–60 000 European Bee-eater ++ 414 ● ● 53–72
Common Cuckoo (=) (=) ● ● ● ● 15 000–25 000 Common Kingfisher 51 (=) ● ● ● ● 400–500
Western Water Rail (=) (=) ● ● ● ● 500–800 Eurasian Wryneck (=) 42 ● ● ● ● 1 000–2 500
Corncrake 205 (=) ● ● ● ● 15–40 Grey-faced Woodpecker –73 –46 ● ● ● ● 300–700
Spotted Crake (=) (=) ● ● ● ● 10–20 Eur. Green Woodpecker 75 (=) ● ● ● ● 10 000–17 000
Little Crake X X ● ● ● ● 1–5 Black Woodpecker 171 39 ● ● ● ● 6 000–9 000
Baillon’s Crake X X ♦ ♦ ♦ 0–1 Three-toed Woodpecker (=) 56 ● ● ● ● 1 000–2 500
Common Moorhen (=) 46 ● ● ● ● 1 000–2 000 Middle Sp. Woodpecker 216 57 ● ● ● ● 1 700–2 100
Common Coot 31 26 ● ● ● ● 5 000–8 000 Lesser Sp. Woodpecker 21 26 ● ● ● ● 1 500–3 000
White Stork 220 118 ● ● ● ● 370–460 White-b. Woodpecker X X ♦ ● 20–30
Common Little Bittern (=) (=) ● ● ● ● 90–120 Great Sp. Woodpecker 102 (=) ● ● ● ● 70 000–90 000
Black-cr. Night Heron X X ♦ ♦ ♦ 0–1 Common Kestrel 138 34 ● ● ● ● 5 000–7 500
12OVERVIEW
pairs/broods)
pairs/broods)
in 2013–2016
in 2013–2016
(territories/
(territories/
Population
Population
1990–2017
2008–2017
1950–1959
1972–1976
1993–1996
2013–2016
1990–2017
2008–2017
1950–1959
1972–1976
1993–1996
2013–2016
Trend
Trend
Trend
Trend
Species Species
Eurasian Hobby 12 (=) ● ● ● ● 500–1 000 Wallcreeper –33 (=) ● ● ● ● 1 000–2 500
Peregrine Falcon 106 (=) ● ● ● ● 260–320 Northern Wren 61 (=) ● ● ● ● 400 000–550 000
Eurasian Golden Oriole 50 (=) ● ● ● ● 3 000–4 500 White-throated Dipper 36 (=) ● ● ● ● 6 000–8 000
Red-backed Shrike –50 (=) ● ● ● ● 10 000–15 000 Common Starling (=) (=) ● ● ● ● 120 000–140 000
Lesser Grey Shrike X X ● ○ 0 Mistle Thrush 31 (=) ● ● ● ● 130 000–150 000
Great Grey Shrike X X ● ● 0 Song Thrush 40 49 ● ● ● ● 300 000–350 000
Woodchat Shrike –100 (=) ● ● ● 0 Eurasian Blackbird 41 13 ● ● ● ● 500 000–700 000
Red-billed Chough 150 (=) ● ● ● ● 70–80 Fieldfare –44 (=) ● ● ● ● 40 000–45 000
Yellow-billed Chough (=) (=) ● ● ● ● 11 000–21 000 Ring Ouzel –35 (=) ● ● ● ● 50 000–75 000
Eurasian Jay 22 (=) ● ● ● ● 60 000–75 000 Spotted Flycatcher –35 (=) ● ● ● ● 35 000–55 000
Eurasian Magpie 157 (=) ● ● ● ● 35 000–40 000 European Robin 38 20 ● ● ● ● 450 000–650 000
Northern Nutcracker (=) (=) ● ● ● ● 20 000–25 000 Red-spotted Bluethroat 395 (=) ♦ ● ● 5–12
Eurasian Jackdaw 71 35 ● ● ● ● 1 250–1 500 Common Nightingale 58 33 ● ● ● ● 1 700–2 200
Rook ++ 113 ● ● ● 5 800–7 300 Eur. Pied Flycatcher 49 (=) ● ● ● ● 17 000–22 000
Common Raven 69 (=) ● ● ● ● 2 000–3 000 Collared Flycatcher X X ● ● ● ● 15–25
Carrion Crow 123 (=) ● ● ● ● 80 000–120 000 Black Redstart 13 (=) ● ● ● ● 300 000–400 000
Hooded Crow X X ● ● ● ● 2 000–3 000 Common Redstart (=) (=) ● ● ● ● 12 000–18 000
Coal Tit 530 (=) ● ● ● ● 400 000–600 000 Rufous-t. Rock-thrush –28 36 ● ● ● ● 2 000–3 000
Crested Tit 72 (=) ● ● ● ● 90 000–110 000 Blue Rock-thrush (=) (=) ● ● ● ● 15–25
Marsh Tit 45 (=) ● ● ● ● 70 000–100 000 Whinchat –56 –29 ● ● ● ● 7 000–9 000
Alpine or Willow Tit 100 (=) ● ● ● ● 70 000–95 000 Common Stonechat 91 25 ● ● ● ● 1 500–2 000
Eurasian Blue Tit 107 (=) ● ● ● ● 200 000–300 000 Northern Wheatear 31 (=) ● ● ● ● 40 000–60 000
Great Tit 31 (=) ● ● ● ● 400 000–550 000 Goldcrest 58 (=) ● ● ● ● 200 000–400 000
Eurasian Penduline-tit X X ○ ○ ○ ♦ 0–1 Common Firecrest (=) 104 ● ● ● ● 250 000–400 000
Woodlark (=) (=) ● ● ● ● 250–300 Alpine Accentor (=) (=) ● ● ● ● 25 000–40 000
Eurasian Skylark –43 –20 ● ● ● ● 25 000–30 000 Dunnock 20 22 ● ● ● ● 200 000–250 000
Crested Lark X X ● ○ 0 House Sparrow 18 (=) ● ● ● ● 450 000–550 000
Bearded Reedling (=) (=) ● ● ● 80–110 Italian Sparrow X X ● ● ● ● 20 000–25 000
Zitting Cisticola X X ♦ ♦ ♦ 0–2 Eurasian Tree Sparrow 66 (=) ● ● ● ● 80 000–95 000
Melodious Warbler 27 47 ● ● ● ● 300–350 White-w. Snowfinch –12 (=) ● ● ● ● 6 000–9 000
Icterine Warbler –74 (=) ● ● ● ● 100–150 Tree Pipit –49 (=) ● ● ● ● 50 000–70 000
Moustached Warbler X X ♦ ♦ 0–1 Meadow Pipit –54 (=) ● ● ● ● 500–800
Sedge Warbler X X ♦ 0 Water Pipit (=) (=) ● ● ● ● 150 000–200 000
Marsh Warbler (=) (=) ● ● ● ● 3 000–6 000 Tawny Pipit X X ♦ ♦ ○ ○ 1–3
Common Reed-warbler (=) (=) ● ● ● ● 9 000–11 000 Western Yellow Wagtail 21 (=) ● ● ● ● 300–340
Great Reed-warbler 67 92 ● ● ● ● 270–320 Grey Wagtail (=) (=) ● ● ● ● 17 000–20 000
Savi’s Warbler 49 (=) ● ● ● ● 280–310 White Wagtail –11 –14 ● ● ● ● 90 000–110 000
C. Grasshopper-warbler 36 (=) ● ● ● ● 150–250 Common Chaffinch 31 (=) ● ● ● ● 900 000–1 100 000
Northern House Martin –29 (=) ● ● ● ● 70 000–90 000 Hawfinch (=) (=) ● ● ● ● 13 000–17 000
Barn Swallow (=) 23 ● ● ● ● 70 000–90 000 Common Rosefinch (=) 173 ● ● 50–70
Eurasian Crag Martin 55 51 ● ● ● ● 7 000–9 000 Eurasian Bullfinch (=) (=) ● ● ● ● 40 000–75 000
Collared Sand Martin –44 61 ● ● ● ● 2 300–3 000 European Greenfinch (=) –38 ● ● ● ● 90 000–120 000
West. Bonelli’s Warbler 110 38 ● ● ● ● 40 000–60 000 Common Linnet (=) (=) ● ● ● ● 25 000–30 000
Wood Warbler –64 (=) ● ● ● ● 5 000–7 500 Redpoll (=) (=) ● ● ● ● 15 000–20 000
Willow Warbler –67 –34 ● ● ● ● 4 000–5 000 Red Crossbill 123 (=) ● ● ● ● 25 000–35 000
Common Chiffchaff 52 (=) ● ● ● ● 250 000–300 000 European Goldfinch –36 (=) ● ● ● ● 50 000–70 000
Greenish Warbler X X ♦ 0–1 Citril Finch –37 (=) ● ● ● ● 10 000–20 000
Cetti’s Warbler X X ○ ○ ○ 0–2 European Serin –15 (=) ● ● ● ● 35 000–45 000
Long-tailed Tit 117 (=) ● ● ● ● 20 000–35 000 Eurasian Siskin (=) (=) ● ● ● ● 10 000–16 000
Eurasian Blackcap 65 19 ● ● ● ● 700 000–800 000 Corn Bunting –39 (=) ● ● ● ● 80–110
Garden Warbler –39 –24 ● ● ● ● 35 000–50 000 Rock Bunting (=) (=) ● ● ● ● 7 000–10 000
Barred Warbler –87 –87 ● ● ● ● 0–5 Ortolan Bunting –98 –90 ● ● ● ○ 1–5
West. Orphean Warbler X X ♦ ○ ○ 0 Cirl Bunting (=) (=) ● ● ● ● 1 000–1 500
Lesser Whitethroat (=) (=) ● ● ● ● 17 000–23 000 Yellowhammer (=) –16 ● ● ● ● 65 000–75 000
Subalpine Warbler X X ♦ ♦ 0–1 Reed Bunting –27 (=) ● ● ● ● 1 700–3 000
Greater Whitethroat 31 32 ● ● ● ● 1 800–2 500
Short-toed Treecreeper 37 (=) ● ● ● ● 45 000–55 000
Eurasian Treecreeper 161 (=) ● ● ● ● 75 000–100 000
Eurasian Nuthatch (=) (=) ● ● ● ● 110 000–170 000
13The Eurasian Wryneck inhabits open, light-flooded deciduous woods, gardens and traditional orchards and relies on sites with nutrient-poor soils and low,
patchy ground vegetation. This is where it finds its favourite food, ants and their larvae and pupae, which it extracts from nests in the ground with a rapid
extension of its tongue.
Long-distance migrants in decline
Overall, the numbers of long-distance specialised, the former are more affected important food source for many long-dis-
migrants are declining, while those of by habitat changes in the breeding and tance migrants. About 40 % of Swiss
short-distance migrants and residents wintering grounds and therefore more breeding bird species feed almost exclu-
appear to be increasing. Being more vulnerable. In addition, insects are an sively on insects. A further 25 % have a
mixed diet, but rely mainly on insects to
feed their young. Insectivores therefore
need an ample supply of suitable insects
Territories/km2 that also have to be easy to catch. The
+3+3 steep decline of insects in farmland in
particular is a major problem for our na-
+1,5
+1.5
tive breeding birds.
+0,5
+0.5
–0,5
−0.5
–1,5
−1.5 Many dangers in many places
Long-distance migrants travel between
−3–3
several completely different locations,
spending 4–5 months in the breeding
grounds, two months on spring and au-
tumn migration, and 5–6 months in the
wintering sites. Certain species move
considerable distances within their win-
tering range in a single season. Habitat
changes at one of the sites frequented
in the course of the year can quickly put
them under pressure. They need to be in
certain places at certain times, in keeping
with their tight annual schedule. More
The Red-backed Shrike feeds mainly on large insects. While there were some local increases, e.g.
near Geneva, the species has declined significantly in its former strongholds in the Jura, Valais and over, many species face a high risk of
Ticino (red areas on the density change map, see p. 38 for more details on this map type). mortality during migration.
14RECENT TRENDS
3500 140
2013–2016
1993–1996
3000
120
Bestandsindex
2500
Altitude (m asl)
Index
2000
100
1500
1000 80
500
60
0 2 4 6 1992 1996 2000 2004 2008 2012 2016
Main number of species of long-distance migrants per km 2
Comparing the altitudinal distribution of long-distance migrants in 1993– The populations of long-distance migrants (red) are in marked decline,
1996 and 2013–2016 shows that significant losses only occurred below while short-distance migrants and residents (blue) are faring much better.
1500 m, which suggests that many declines are «home-made».
The fact that long-distance migrants manure of these animals attract sig- only 20 years. The proportion of ex-
have above all disappeared from the nificantly fewer insects. tremely dense meadows increased con-
Swiss lowlands, where the impact of ● Use of pesticides in private gardens as siderably during the same period. The
human activity is especially strong, is well. Pesticide-free gardening would wheat yield per hectare has tripled in
an indication that the decline is largely be an easy measure to implement. Switzerland since 1940, thanks to heavy
«home-made». nitrogen fertilisation and closely spaced
Insects are poorly accessible crop varieties. Insectivores like Eurasian
Causes of insect decline Many crops and meadows are much Hoopoe, Eurasian Wryneck, Little Owl
Although data are scarce throughout denser than they used to be. Sparse, and Common Redstart are unable to
central Europe, it is safe to say that few- low-nutrient meadows, for instance, forage in such densely vegetated mead-
er insects exist today than a few decades declined by 20 % in the Engadine in ows and fields.
ago. This loss is documented for several
areas in Germany, where insect biomass
decreased by 75 % in the past 27 years.
While there are no data from Switzerland, Territories/km2
there are plenty of signs that indicate a +10
+10
similarly large loss. The reasons for the +7+7
decline are diverse: +4+4
+1+1
● Loss of habitats such as semi-dry and −1 –1
dry grassland, wetlands and semi-nat- −4 –4
ural waterbodies. −7 –7
–10
−10
● Farming methods that are hostile to
insects: Semi-natural embankments
are often mulched during the peak
flowering period. Baled silage has
become widespread right up to the
sub-Alpine zone. Meadows are cut up
to six times a year.
● Herbicides reduce the supply of plant
food for many insects.
● Use of insecticides: beneficial organ-
isms are decimated as well as harm-
ful ones.
The Barn Swallow is a familiar harbinger of spring. Its population has declined significantly in large
● Use of medication to control para- parts of the country. During bad weather especially, the insufficient food supply can lead to brood
sites in farm animals: The dung and loss. In addition, the decline of farms with livestock has caused breeding sites to disappear.
15The Golden Eagle is present throughout the Swiss Alps; all suitable territories are occupied. The breeding success of the approximately 350 pairs is quite
low, putting a natural limit on population growth. However, an increasing number of breeding attempts now fail due to disturbance by humans.
Recovery of raptor populations
For centuries, raptors and owls were di- large-scale use from 1940, was a se- The – intentional – decimation of in-
rectly persecuted by humans. The last vere threat. As it accumulates at the sects also had serious consequences.
Bearded Vulture in the Alps was shot in top of the food chain, it hit birds of The reduced food supply affects
1913, and the last Osprey pair bred in prey particularly hard, causing them to many species, including raptors, the
Switzerland in 1911. The populations of produce eggs with thin shells. In conse- final links in the food chain, which ei-
Red Kite and Golden Eagle were severe- quence, only a single Peregrine Falcon ther hunt insects themselves or prey
ly depleted. Despite the ban on hunting pair bred successfully in Switzerland on small, insectivorous mammals like
introduced for several species in 1926, outside of the Alps in 1971. Follow- shrews.
many raptor populations were slow to ing a ban on persistent chlorinated hy- Various human activities have had
recover. Golden Eagle, Eurasian Hobby drocarbons (including DDT and PCB) in a positive effect on certain species: in-
and Peregrine Falcon were not protect- most western countries in the 1970s, tensively managed grassland, where
ed until 1953, Northern Goshawk and the affected species started to recov- grass is mowed several times a year,
Eurasian Sparrowhawk not until 1963. er. But poisoning by carbofuran, only appears to benefit less specialised
banned in Switzerland in 2013, contin- birds of prey, such as Red and Black
Fatal pesticides ued to occur regularly in farmland are- Kite and Eurasian Buzzard. Targeted
Besides direct persecution, the use as well into the 1990s, affecting Eura- conservation measures have boosted
of pesticides such as DDT, put to sian Buzzards and Red and Black Kites. the Red Kite population, for example,
1950–1959 1972–1976 1993–1996 2013–2016
In the Middle Ages, the Red Kite was a widespread and common species in central Europe. Its area of distribution shrank considerably with the spread of
firearms and as a result of poisoning. The species has since recovered and extended its range far into the Alps.
16RECENT TRENDS
The reintroduction of the Bearded Vulture in the Alps is a particularly notable success. The species has bred again in Switzerland since 2007 and occupied as
many as 16 atlas squares in Switzerland in 2013–2016. Such reintroduction schemes require a huge effort and should remain an exceptional measure.
and nest boxes have helped the Com- raptors’ southern migration and win- the protection of nest sites for sensi-
mon Kestrel. tering grounds. tive cliff breeders. Timber should be
Today, the populations of almost all harvested outside of the breeding sea-
birds of prey are comparatively large Need for action son. To protect migrating birds, impor-
– in some cases, such as the Red Kite, Migratory raptors in particular, such tant migration routes such as mountain
numbers are probably higher than ever as Red and Black Kite, European Hon- passes and ridges should remain unob-
before. But several species are in de- ey-buzzard, harriers and falcons, are ex- structed by infrastructure. Other desir-
cline once more. The Peregrine Falcon posed to a number of threats, reaching able measures include the monitoring
is a particularly critical case (due in from direct persecution to drought and of breeding populations and breeding
part to illegal persecution), and North- rainforest deforestation. Many of these success, especially for secretive wood-
ern Goshawk and Eurasian Sparrow- problems are hard to address. Howev- land species.
hawk populations appear to be unsta- er, the replacement of dangerous pow-
ble again. er pylons in Switzerland is feasible and
long overdue. We could also improve
Trends can easily reverse
Most raptors are long-lived, reach sex-
ual maturity late and have a low repro-
ductive rate. Therefore, even a small in- Probability of occurrence/km2
crease in adult mortality can affect the 1.0 1
population trend. Current threats in-
0,5
0.5
clude habitat loss, increasing human
disturbance, electrocution on power 0.0 0
pylons, collisions with overhead pow- –0,5
−0.5
er lines, cables, vehicles, trains and win-
–1
−1.0
dows, pesticide contamination, lead
poisoning from fragments of ammu-
nition in the carcasses of game animals
(affecting carrion eaters) and finally, il-
legal persecution.
Human leisure activities such as
rock climbing, paragliding and nest
photography also increasingly affect
breeding success in several species,
e.g. the Golden Eagle. The growth
of wind energy will result in breeding
birds disappearing from certain areas
and also cause casualties among mi- Clear positive trend: the Common Kestrel occurs in almost every atlas square. Numbers decreased
grating raptors. Currently, collisions significantly in the 1980s. Compared to the 1990s, populations have recovered throughout the
lowlands.
with wind turbines mostly occur in the
17RECENT TRENDS
Climate change forces birds upwards
Not only are glaciers in retreat, but the vegetation cover around and above the tree line is also changing. As a result, many breeding birds of mountain for-
ests and Alpine habitats move to higher ground while at the same time deserting the lower-lying regions.
Mediterranean species such as the whose western or southern range However, climate change in
Melodious Warbler, which reach limit lies in Switzerland appear to Switzerland affects the Alps first
their northern distribution limit in be retreating northwards, among and foremost. The atlas results
Switzerland, have increased since them Grey-faced Woodpecker and show how related environmental
1993–1996 and extended their rang- Willow Warbler. Climate warming changes already impact breeding
es to the north. In contrast, cen- is presumably a driving force behind bird communities today, directly or
tral and northern European species these trends. indirectly.
Ringdrossel
3500
Territories/km2 3000
Altitude (m asl)
2500
+10
+10
+7+7 2000
+4+4
1500
+1+1
−1–1
1000
−4–4
−7–7 500
–10
−10
0 2,5 5 7,5 10 −2,5 0
Percentage of population (%) Change
2013–2016 since 1993–1996
Switzerland has an international responsibility for the Ring Ouzel. It has lost
ground in the western Jura and along the northern Pre-Alps (red areas).
This is particularly alarming as these areas are the species’ strongholds.
18RECENT TRENDS
200 +200
Change in mean altitude per species (m)
Change in mean altitude per species (m)
+160
+120
100
+80
Bestandsindex
Bestandsindex
+40
0
0
–40
–80
–100 –120
–160
500 1000 1500 2000 0 4 8 12 16
Mean altitude per species 1993–1996 (m asl) Number of species
Average altitudinal distribution per species between 1993–1996 and 2013– Between 1993–1996 and 2013–2016, 16 breeding species showed no
2016. Mountain birds have experienced a more pronounced upward shift change in average altitudinal distribution (red). 40 species shifted upwards
than lowland species. (in some cases significantly), 15 species downwards.
Two thirds of common bird species their average altitudinal distribution. What does the future hold for our
move to higher altitude The remaining 27 species either show mountain birds?
Swiss breeding birds are distributed only increases at higher altitudes or The changes in altitudinal distribution
along an altitudinal gradient of more only losses in lower areas. Only in the suggest that the Alps may serve as a
than 3000 m. The atlas data allows us case of four species did we find loss- refuge in the future, when even more
to determine the shift in altitudinal es at high altitudes and gains in the pronounced environmental changes
distribution for 71 common species lowlands. are expected to occur. But they will
with density change maps for the pe- The upward shift between the only be able to fulfil this function if
riod between 1993–1996 and 2013– two atlas periods is particularly pro- biodiversity is taken into account in
2016; 40 of these are woodland birds. nounced in species whose popula- the development of tourist infrastruc-
The average altitudinal distribution of tions are concentrated at high alti- ture or agriculture.
all 71 species has shifted upwards by tude. The ten species with the highest There are limits to this shift to high-
24 m in the past 20 years. Almost two altitudinal distribution in 1993–1996 er ground. On the one hand, the sur-
thirds of all species moved to high- experienced an average upward shift face area of suitable habitats decreas-
er altitude between the two atlas of 51 m. es with increasing altitude simply due
periods. Of the species whose aver- to topography. On the other hand,
age change in altitudinal distribution Trends with various causes habitats respond to climate warm-
was more than 50 m, only four shift- Other reasons, such as changes in ing with a certain time lag, especial-
ed downwards, while 22 species ex- farming practices, probably also play ly forests. How the resulting ecologi-
perienced an upward range shift. a part. But we assume that climate cal imbalances will affect the species
change is the main reason for the up- occupying these habitats is impossi-
A common pattern: losses down ward range shift of breeding birds in ble to predict. One thing is clear: the
below, gains up high Switzerland. Because climatic factors Alps will play an even more critical
Among the 47 species whose range have a greater limiting influence on role in the conservation of breeding
has shifted upwards, 20 show a sim- mountain birds than on lowland spe- birds in Switzerland than they have
ilar pattern: their populations have cies, and because climate change is done so far. Unfortunately, it is also
decreased at lower altitudes while more pronounced at higher altitudes, clear that the process underway will
increasing in the upper reaches of climate change could also explain the produce more losers than winners in
their distribution, independent of above-average upward range shift of the long term.
their ecological requirements and mountain birds
19New techniques lead to increasingly intensive farming. For example, the large-scale use of protective fleece or plastic tunnels prevents farmland birds from
breeding in their traditional habitats.
Monotonous farmland
The situation of farmland birds has industrial machinery. Farming practices gradually being driven out by intensi-
worsened since the 1990s, in the have changed dramatically since 1950. fied land use.
mountains in particular. If you keep your Land consolidation, drainage of wet- The federal government reacted by
eyes and ears open on a walk in the lands, the clearing of traditional or- introducing policy instruments to stop
countryside, you will notice some ubiq- chards and hedgerows, mechanisation the impoverishment of nature. In order
uitous species like the Carrion Crow but and the use of pesticides and artifi- to qualify for direct payments, farmers
very few other birds. Where farming cial fertilisers have reduced the biolog- now have to provide «proof of ecolog-
families used to cultivate a diverse mo- ical quality of farmland. In the last at- ical performance», one of the require-
saic of cornfields, flowery meadows, las published 20 years ago, the Swiss ments being the creation of biodiversity
hedgerows and traditional orchards, Ornithological Institute already con- promotion areas (BPA). The federal gov-
Feldlerche
agricultural land is now managed with cluded that many farmland birds were ernment also developed a system with
measurable goals, presented in the re-
port «Environmental Objectives in Agri-
140 culture (EOA)». But despite significant
effort, none of these objectives has been
120 achieved so far; on the contrary, the gap
has actually widened. For example, the
Bestandsindex
population size of EOA target species
Index
100
has declined by half since 1990.
Such results are frustrating – not
80
only for conservationists, but also for
the farmers that have shown genuine
60 commitment and made a huge effort.
1990 1995 2000 2005 2010 2015 So what are the reasons for the failure
of our current agricultural policy, which
The Eurasian Skylark, once a widespread and common species throughout Switzerland, has be- is backed by more than 2.7 billion Swiss
come a symbol for the decline of farmland birds. It has already disappeared from large parts of the francs annually in the form of direct
Jahr
country, and its population trend continues to decrease.
payments and other public funds? Since
20S I T U AT I O N I N T H E H A B I TAT S
the 1990s, the intensification of agricul- Number of species/km2
ture has continued to progress. The im- 4.04
port of feed concentrates continues to 3.03
2.02
grow, leading to the increased produc- 1.01
0.5
tion of manure and slurry. Faster ma- 0.00
−0.5
–1
−1.0
chinery means that larger expanses of –2
−2.0
land can be managed in less time. Mod- –3
−3.0
–4
−4.0
ern harvesting and forage-conservation
techniques (baled silage) resulted in the
further rationalisation of intensive grass-
land management as many as 20 years
ago. The amounts of pesticides have re-
mained constant at a high level, but the
substances used today are much more
toxic. New livestock-fattening units are
built and roads are constructed to ac-
cess remote areas. Many of these eco-
logically harmful developments are sup-
ported by the federal government. Only
about one fifth of the direct payments In the red: change map for species included in the «Environmental Objectives in Agriculture» (the
invested in agriculture target the pro- map combines target and characteristic species).
motion of biodiversity whereas the ma-
jority of the funds are used to further
intensify production, promoting a form
of agriculture that is harmful to the sufficient quality; in the valley and hill Many farmers have a profound inter-
environment. Thus, agricultural policy regions, high-quality BPA account for est in nature. However, most of them
thwarts its own efforts for more biodi- only 5.1 % of the total area of cultivat- are out of their depth when it comes
versity. The system of direct payments ed land. The situation is even worse on to biodiversity-friendly practices and do
needs to be greatly improved if agricul- arable land, where wildflower strips and not have the necessary knowledge to
ture is to be brought onto a more sus- rotational fallows make up only 1.3 % apply them. This is not surprising, as bio
tainable track. Only sustainable systems of the area. diversity and ecology are given far too
should receive support, but this support Another critical measure would be little attention in education and training
needs to be wholehearted. the effective implementation of existing and in the existing advisory services for
The most important single measure regulation. At present, numerous viola- farmers. The Swiss Ornithological Insti-
would involve the creation of sufficient tions of existing laws go unsanctioned. tute was able to show that farmers who
high-quality biodiversity promotion ar- Such practices not only harm nature, have benefited from advice and train-
eas (BPA). There is ample evidence that they also put those farmers that culti- ing implement more potent and more
breeding birds, but also other animals vate the land in an environment-friend- diverse measures, thus promoting bio-
and plants, benefit from such valua- ly way at a disadvantage compared to diversity in an effective way.
ble areas. But only a part of BPA are of those farming intensively.
100
80
Bestandsindex
60
Index
40
20
0
1992 1996 2000 2004 2008 2012 2016
The Corn Bunting inhabits richly structured farmland and the edges of wet- Way off target: the Swiss Bird Index SBI «Target species EOA» shows an
®
lands, but has few special requirements. The fact that we have been unable uninterrupted decline.
to sustain even this species reflects the complete failure of our agricultural
policy.
21The bright green colours are a tell-tale sign: mountain farmland that is easily accessed with machinery receives large amounts of fertiliser and is used inten- sively. As a result, meadow birds barely stand a chance in this mountain valley in Grisons at 1700 m. Intensification in the mountains While farmland birds came under farmland is only observed in relative- change is slow and goes almost un- pressure on the Central Plateau sever- ly few areas. noticed. Nevertheless, it leads to the al decades ago, many species contin- Agriculture in the mountains has loss of habitat for countless small ued to maintain substantial popula- undergone major changes in the past animals as well as breeding sites for tions in mountain areas. The situation decades. Mountain farmers are work- birds. A recent development is the has worsened considerably since the ing increasingly large areas of land use of stone crushers to transform 1990s. Due to the intensification of and as a consequence can use more large expanses of richly structured agriculture, many bird populations, powerful, faster and larger equip- meadows into intensively used grass- especially ground breeders, have col- ment. Small structures are an obsta- land, a process that completely de- lapsed in mountain regions as well. cle for these machines, so rocks and stroys the value of the land as habi- In contrast, a decline in species rich- bushes are gradually removed and in- tat for Woodlark, Northern Wheatear ness due to the abandonment of clines are levelled. In general, such and Tree Pipit. These two images from Gadmen BE are a striking illustration of the ongoing process of homogenisation in the mountains. On the left, an image from 1950, on the right, one from 2003. And yet this development goes largely unnoticed. 22
You can also read