2.1 Structure - Pearson ...

Page created by Tony Walsh
 
CONTINUE READING
2.1 Structure - Pearson ...
2     THE ecosystem

                                   2.1      Structure

                                 Assessment statements
                                 2.1.1 Distinguish between biotic and abiotic (physical) components of an ecosystem.
                                 2.1.2 Define the term trophic level.
                                 2.1.3 Identify and explain trophic levels in food chains and food webs selected from
                                       the local environment.
                                 2.1.4 Explain the principles of pyramids of numbers, pyramids of biomass, and
                                       pyramids of productivity, and construct such pyramids from given data.
                                 2.1.5 Discuss how the pyramid structure affects the functioning of an ecosystem.
                                 2.1.6 Define the terms species, population, habitat, niche, community and
                                       ecosystem with reference to local examples.
                                 2.1.7 Describe and explain population interactions using examples of named
                                       species.

                                 Biotic and abiotic components
                                     Biotic refers to the living components within an ecosystem (the community). Abiotic refers to the
                                     non-living factors of the ecosystem (the environment).

                                 Ecosystems consist of living and non-living components. Organisms (animals, plants,
                                 algae, fungi and bacteria) are the organic or living part of the ecosystem. The physical
                                 environment (light, air, water, temperature, minerals, soil and climatic aspects) constitute
                                 the non-living part. The living parts of an ecosystem are called the biotic components
                                 and the non-living parts the abiotic (not biotic) components. Abiotic factors include the
                                 soil (edaphic factors) and topography (the landscape). Biotic and non-biotic components
                                 interact to sustain the ecosystem. The word ‘environment’ refers specifically to the non-
                                 living part of the ecosystem.

                                     To find links to hundreds of environmental sites, go to www.pearsonhotlinks.com, insert the express
                                     code 2630P and click on activity 2.1.
                                     To learn more about all things environmental, go to www.pearsonhotlinks.com, insert the express
                                     code 2630P and click on activity 2.2.

                                 Trophic levels, food chains and food webs
                                 Certain organisms in an ecosystem convert abiotic components into living matter. These are
   The term ‘trophic level’      the producers; they support the ecosystem by producing new biological matter (biomass)
   refers to the feeding level   (Figure 2.1). Organisms that cannot make their own food eat other organisms to obtain
   within a food chain. Food     energy and matter. They are consumers. The flow of energy and matter from organism to
   webs are made from
                                 organism can be shown in a food chain. The position that an organism occupies in a food
   many interconnecting
   food chains.                  chain is called the trophic level (Figure 2.2). Trophic level can also mean the position in the
                                 food chain occupied by a group of organisms in a community.
   14

02_M02_14_82.indd 14                                                                                                                       15/04/2010 08:53
2.1 Structure - Pearson ...
solar                                                                            Figure 2.1
                                                                     energy                                                                           Producers covert sunlight
                                                                                            some light is reflected
                                                                                                                                                      energy into chemical energy
                                                                                                                                                      using photosynthetic
                                                                                                                                                      pigments. The food produced
                      some wavelengths are unsuitable                                                                                                 supports the rest of the food
                                                                                                                                                      chain.

                                  some light is transmitted                                                                energy lost
                                                                                      photosynthesis changes               through
                                                                                      solar energy to chemical             respiration
                                                                                      energy
                                                                     biomass stores
                                                                     energy

                                                                                                                                                      Figure 2.2
                                                                                                                                                      A food chain. Ecosystems
                                                                                                                                                      contain many food chains.

                   producer                       primary                 secondary                      tertiary                    quaternary
                                                 consumer                 consumer                      consumer                     consumer
                  autotroph                      herbivore           omnivore/carnivore                  carnivore                    carnivore

           Ecosystems contain many interconnected food chains that form food webs. There are a
           variety of ways of showing food webs, and they may include decomposers which feed on
           the dead biomass created by the ecosystem (Figure 2.3). The producer in this food web for
           the North Sea is phytoplankton (microscopic algae), the primary consumers (herbivores)
           are zooplankton (microscopic animal life), the secondary consumers (carnivores) include
           jellyfish, sand eels, and herring (each on different food chains), and the tertiary consumers
           (top carnivores) are mackerel, seals, seabirds and dolphins (again on different food chains).
                                                solar energy                                                                                          Figure 2.3
                                                                                                                      puffins, gannets
                                                                                                                                                      A simplified food web for the
             sea surface                                                                                                                              North Sea in Europe.

                                                         phytoplankton use
                                                                                                   zooplankton                                seals
            light available for                          disolved nutrients
            photosynthesis                               and carbon dioxide
                                                                                                                                      mackerel
                                                         to photosynthesise
                                                                                jellyfish                               sand eels

                                                                                                                                    herring

                                                                                      dolphins

                                                                                                                         squid
                                              cod, haddock

            continental shelf                                   crustaceans feed on decaying organic material

            sea bed

           Diagrams of food webs can be used to estimate knock-on effects of changes to the
           ecosystem. During the 1970s, sand eels were harvested and used as animal feed, for fishmeal
           and for oil and food on salmon farms: Figure 2.3 can be used to explain what impacts a
                                                                                                                                                                                  15

02_M02_14_82.indd 15                                                                                                                                                      15/04/2010 08:53
2.1 Structure - Pearson ...
2              THE ECOSYSTEM

                                      dramatic reduction in the number of sand eels might have on the rest of the ecosystem.
    Food chains always
    begin with the producers
                                      Sand eels are the only source of food for mackerel, puffin and gannet, so numbers of these
    (usually photosynthetic           species may decline or they may have to switch food source. Similarly, seals will have to rely
    organisms), followed              more on herring, possibly reducing their numbers or they may also have to switch food
    by primary consumers              source. The amount of zooplankton may increase, improving food supply for jellyfish and
    (herbivores), secondary
                                      herring.
    consumers (omnivores
    or carnivores) and then           An estimated 1000 kg of plant plankton are needed to produce 100 kg of animal plankton.
    higher consumers                  The animal plankton is in turn consumed by 10 kg of fish, which is the amount needed by
    (tertiary, quaternary, etc.).
    Decomposers feed at
                                      a person to gain 1 kg of body mass. Biomass and energy decline at each successive trophic
    every level of the food           level so there is a limit to the number of trophic levels which can be supported in an
    chain.                            ecosystem. Energy is lost as heat (produced as a waste product of respiration) at each stage
                                      in the food chain, so only energy stored in biomass is passed on to the next trophic level.
      Examiner’s hint:                Thus, after 4 or 5 trophic stages, there is not enough energy to support another stage.
    You will need to find an
    example of a food chain from
    your local area, with named                                                      The earliest forms of life on Earth, 3.8 billion years ago,
    examples of producers,                                                           were consumers feeding on organic material formed
    consumers, decomposers,                                                          by interactions between the atmosphere and the
    herbivores, carnivores, and top                                                  land surface. Producers appeared around 3 billion
    carnivores.                                                                      years ago – these were photosynthetic bacteria and
                                                                                     their photosynthesis led to a dramatic increase in the
                                                                                     amount of oxygen in the atmosphere. The oxygen
                                                                                     enabled organisms that used aerobic respiration to
    Stromatolites were the
                                                                                     generate the large amounts of energy they needed.
    earliest producers on the
                                                                                     And, eventually, complex ecosystems followed.
    planet and are still here.
    These large aggregations of
    cyanobacteria can be found
    in the fossil record and alive
    in locations such as Western
    Australia and Brazil.

    Pyramids are graphical
    models showing the
    quantitative differences
    between the tropic levels         Pyramids of numbers, biomass and productivity
    of an ecosystem. There are
    three types.
                                      Pyramids are graphical models of the quantitative differences that exist between the trophic
    • Pyramid of numbers              levels of a single ecosystem. These models provide a better understanding of the workings
       – This records the             of an ecosystem by showing the feeding relationship in a community.
       number of individuals
       at each trophic level.         Pyramids of numbers
    • Pyramid of biomass              The numbers of producers and consumers coexisting in an ecosystem can be shown
       – This represents the
       biological mass of             by counting the numbers of organisms in an ecosystem and constructing a pyramid.
       the standing stock at          Quantitative data for each trophic level are drawn to scale as horizontal bars arranged
       each trophic level at a        symmetrically around a central axis (Figure 2.4a). Sometimes, rather than counting every
       particular point in time.
                                      individual in a trophic level, limited collections may be done in a specific area and this
    • Pyramid of productivity
       – This shows the flow          multiplied up to the total area of the ecosystem. Pyramids of numbers are not always
       of energy (i.e. the rate       pyramid shaped; for example, in a woodland ecosystem with many insect herbivores
       at which the stock             feeding on trees, there are bound to be fewer trees than insects; this means the pyramid is
       is being generated)
                                      inverted (upside-down) as in Figure 2.4b. This situation arises when the size of individuals
       through each trophic
       level.                         at lower trophic levels are relatively large. Pyramids of numbers, therefore, have limitations
                                      in showing useful feeding relationships.

    16

02_M02_14_82.indd 16                                                                                                                               15/04/2010 08:54
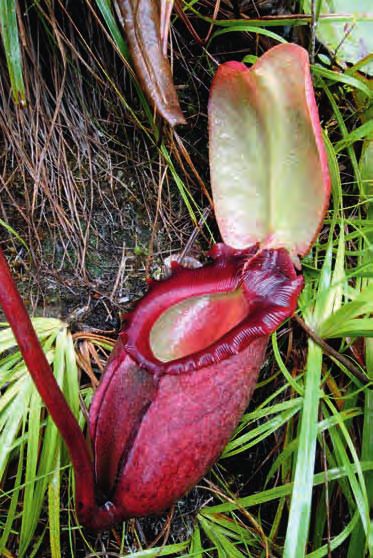
2.1 Structure - Pearson ...
(a)
            (a)                                                                 (b)(b)                     Figure 2.4
                                                                                                           Pyramids of numbers. (a) A
                                                             top carnivores
                                                                                                           typical pyramid where the
                                                                                                           number of producers is high.
                                                               carnivores                                  (b) A limitation of number
                                                                                                           pyramids is that they are
                                                               herbivores                                  inverted when the number of
                                                                                                           producers is fewer than the
                                                            primary producers                              number of herbivores.

           Pyramids of biomass
           A pyramid of biomass quantifies the amount of biomass present at each trophic level at a
           certain point in time, and represents the standing stock of each trophic level measured in
           units such as grams of biomass per metre squared (g m–2). Biomass may also be measured
           in units of energy, such as joules per metre squared (J m–2). Following the second law of
           thermodynamics, there is a tendency for numbers and quantities of biomass and energy to
           decrease along food chains so the pyramids become narrower towards the top.
           Although pyramids of biomass are usually pyramid shaped, they can sometimes be inverted
           and show greater quantities at higher trophic levels. This is because, as with pyramids of
           numbers, they represent the biomass present at a given time (i.e. they are a snap-shot of the
           ecosystem). The standing crop biomass (the biomass taken at a certain point in time) gives
           no indication of productivity over time. For example, a fertile intensively grazed pasture
           may have a lower standing crop biomass of grass but a higher productivity than a less
           fertile ungrazed pasture (the fertile pasture has biomass constantly removed by herbivores).
           This results in an inverted pyramid of biomass. In a pond ecosystem, the standing crop of
           phytoplankton (the major producers) at any given point will be lower than the mass of the
           consumers, such as fish and insects, as the phytoplankton reproduce very quickly. Inverted
           pyramids may also be the result of marked seasonal variations.
           Both pyramids of numbers and pyramids of biomass represent storages.

           Pyramids of productivity
           The turnover of two retail outlets cannot be compared by simply comparing the goods
           displayed on the shelves, because the rates at which the goods are sold and the shelves are
           restocked also need to be known. The same is true of ecosystems. Pyramids of biomass
           simply represent the momentary stock, whereas pyramids of productivity show the rate at
           which that stock is being generated.
           Pyramids of productivity take into account the rate of production over a period of time
           because each level represents energy per unit area per unit time. Biomass is measured in
           units of mass (g m–2) or energy (J m–2) as opposed to the more useful measurement of
           productivity in units of flow, mass or energy per metre squared per year (g m–2 yr–1 or
           J m–2 yr–1). Pyramids of productivity refer to the flow of energy through a trophic level
           and invariably show a decrease along the food chain. There are no inverted pyramids. The
           relative energy flow within an ecosystem can be studied, and different ecosystems can be
           compared. Pyramids of productivity also overcome the problem that two species may not
           have the same energy content per unit weight: in these cases, biomass is misleading but
           energy flow is directly comparable.

           Pyramid structure and ecosystem functioning
           Because energy is lost through food chains, top carnivores are at risk from disturbance
           further down the food chain. If there is a reduction in the numbers of producers or primary

                                                                                                                                    17

02_M02_14_82.indd 17                                                                                                          15/04/2010 08:54
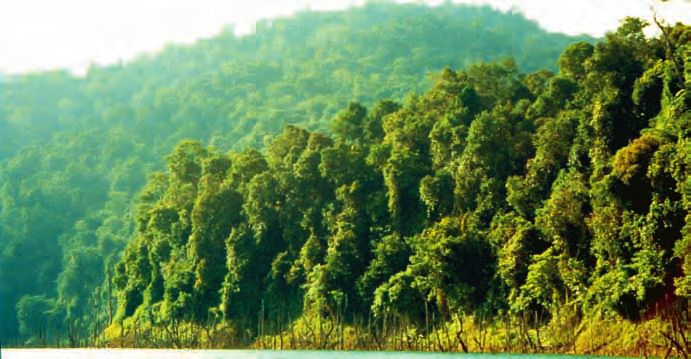
2.1 Structure - Pearson ...
2             THE ECOSYSTEM

                                    consumers, existence of the top carnivores can be put at risk if there are not enough
                                    organisms (and therefore energy and biomass) to support them. Top carnivores may be the
                                    first population to noticeably suffer through ecosystem disruption.

                                                                                          Case study
    A snow leopard.                                                  Snow leopards are found in the mountain ranges of Central Asia. They
                                                                     feed on wild sheep and goats. Effects lower down the food chain threaten
                                                                     this top carnivore. Overgrazing of the mountain grasslands by farmed
                                                                     animals leaves less food for the snow leopard’s main prey: with less food
                                                                     for the wild sheep and goats, fewer of these animals are available for the
                                                                     snow leopard, which puts its existence at risk. The snow leopard has little
                                                                     choice but to prey on the domestic livestock in order to survive. But this
                                                                     leads the herdsmen to attack and kill the snow leopards.
                                                                     The total wild population of the snow leopard is estimated at between
                                                                     4100 and 6600 individuals, and they have now been designated as
                                                                     endangered by the International Union for Conservation of Nature (IUCN).

                                    Top carnivores can also be put at risk through other interferences in the food chain. Suppose
                                    a farmer uses pesticides to improve the crop yield and to maximize profits. Today’s pesticides
                                    break down naturally and lose their toxic properties (i.e. they are biodegradable), but this
                                    was not always the case. In the past, pesticides weren’t biodegradable, and they had serious
                                    knock-on effects for ecosystems. Figure 2.5 shows the effect of the very effective non-
    To watch animations
    and learn more about            biodegradable pesticide DDT on food chains. The producers, the algae and plants or grass (first
    ecological pyramids, go         accumulators) take in the DDT. The first trophic level (the primary consumers) eat the DDT-
    to www.pearsonhotlinks.         containing producers and retain the pesticide in their body tissue (mainly in fat) – this is called
    com, insert the express
                                    bioaccumulation. The process continues up the food chain with more and more DDT being
    code 2630P and click on
    activity 2.3.                   accumulated at each level. The top carnivores (humans, at level 6 in the aquatic food chain or
                                    level 3 in the terrestrial chain) are the final destination of the pesticide (ultimate accumulators).

                                                                   Terrestrial sequence                      Aquatic sequence
    Figure 2.5
    Simple food chains showing                                            milk                                         third carnivores
                                                                                                                         (larger fish)
    the accumulation of the non-                                             meat
    biodegradable pesticide, DDT.                                                                                     second carnivores
                                                                                                                         (larger fish)

                                                          herbivores                            humans,                first carnivores
                                                      (grazing animals)                       the ultimate               (larger fish)
                                                                                              accumulators

                                                                                                                          herbivores
                                                                                                                        (smaller fish)

                                                           grass                                                   algae and water plants

                                                            DDT                                                              DDT
                                                           spray                                                            spray

                                    The pesticide accumulates in body fat and is not broken down. Each successive trophic level
                                    supports fewer organisms, so the pesticide becomes increasingly concentrated in the tissues (this
                                    is called biomagnification). Organisms higher in the food chain also have progressively longer life
                                    spans so they have more time to accumulate more of the toxin by eating many DDT-containing
                                    individuals from lower levels. Top carnivores are therefore at risk from DDT poisoning.
    18

02_M02_14_82.indd 18                                                                                                                               15/04/2010 08:54
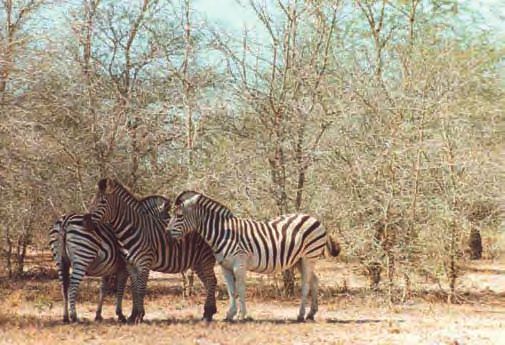
2.1 Structure - Pearson ...
Examiner’s hint:
                                                         EXERCISES                                                  •   A pyramid of biomass
             1    Distinguish between biotic and abiotic factors. Which of these terms refers to the environment         represents biomass
                  of an ecosystem?                                                                                       (standing stock) at a given
                                                                                                                         time, whereas a pyramid
             2    What are the differences between a pyramid of biomass and a pyramid of productivity?                   of productivity represents
                  Which is always pyramid shaped, and why? Give the units for each type of pyramid.                      the rate at which stocks
             3    How can total biomass be calculated?                                                                   are being generated (i.e.
                                                                                                                         the flow of energy through
             4    Why are non-biodegradable toxins a hazard to top predators in a food chain?                            the food chain). A pyramid
             5    Why are food chains short (i.e. generally no more than five trophic levels in length)? What are        of biomass is measured
                  the implications of this for the conservation of top carnivores?                                       in units of mass (g m–2) or
                                                                                                                          energy (J m–2); a pyramid of
                                                                                                                          productivity is measured in
                                                                                                                          units of flow (g m–2 yr–1 or
           Species, populations, habitats and niches                                                                •
                                                                                                                          J m–2 yr–1).
                                                                                                                         Because energy is lost
           Ecological terms are precisely defined and may vary from the everyday use of the same                          through the food chain,
           words. Definitions for key terms are given below.                                                              pyramids of productivity
                                                                                                                          are always pyramid shaped.
                                                                                                                          Pyramids of number or
           Species                                                                                                        biomass may be inverted
                                                                                                                          because they represent
           A species is defined as a group of organisms that interbreed and produce fertile offspring. If
                                                                                                                          only the stock at a given
           two species breed together to produce a hybrid, this may survive to adulthood but cannot                       moment in time.
           produce viable gametes and so is sterile. An example of this is when a horse (Equus caballus)
           breeds with a donkey (Equus asinus) to produce a sterile mule.
                                                                                                                           The species concept is
           The species concept cannot:                                                                                     sometimes difficult to
           • identify whether geographically isolated populations belong to the same species                               apply: for example, can
           • classify species in extinct populations                                                                       it be used accurately to
           • account for asexually reproducing organisms                                                                   describe extinct animals
                                                                                                                           and fossils? The term is
           • clearly define species when barriers to reproduction are incomplete (Figure 2.6).
                                                                                                                           also sometimes loosely
                                                                                                                           applied to what are, in
                                                                                                                           reality, sub-species that
                                                                                                                           can interbreed. This is an
                                                                                                                           example of an apparently
                                                              Vega herring gull                                            simple term that is difficult
                                                                                                                           to apply in practical
                                                                                                                           situations.
                                                                   Birula’s gull
                                      American herring gull

                                                                                                                    Figure 2.6
                                                                  Heuglin’s gull                                    Gulls interbreeding in a
                                                                                                                    ring around the Arctic are
                                                                       Siberian lesser                              an example of ring species.
                                                                       black-backed gull                            Neighbouring species can
                                                                                                                    interbreed to produce viable
                                                                                                                    hybrids but herring gulls and
                                                               lesser black                                         lesser black-backed gulls, at
                                                               -backed gull                                         the ends of the ring, cannot
                                                         herring gull                                               interbreed.

           Population
           A population is defined in ecology as a group of organisms of the same species living in the
           same area at the same time, and which are capable of interbreeding.

                                                                                                                                                   19

02_M02_14_82.indd 19                                                                                                                        15/04/2010 08:54
2.1 Structure - Pearson ...
2                THE ECOSYSTEM

    A population of zebras.

                                          Habitat
                                          Habitat refers to the environment in which a species normally lives. For example, the habitat
                                          of wildebeest is the savannah and temperate grasslands of eastern and south-eastern Africa.

    Wildebeest in their habitat.

    •   Species – A group
        of organisms that
        interbreed and produce
        fertile offspring.
    •    Population – A group of
          organisms of the same
          species living in the same
          area at the same time,
          and which are capable of
          interbreeding.
    •     Habitat – The
           environment in which a
           species normally lives.
    •      Niche – Where and how
            a species lives. A species’
                                          Niche
            share of a habitat and        An ecological niche is best be described as where, when and how an organism lives. An
            the resources in it.
                                          organism’s niche depends not only on where it lives (its habitat) but also on what it does.
    •       Community – A group
             of populations living        For example, the niche of a zebra includes all the information about what defines this
             and interacting with         species: its habitat, courtship displays, grooming, alertness at water holes, when it is active,
             each other in a common       interactions between predators and similar activities. No two different species can have the
             habitat.
                                          same niche because the niche completely defines a species.
    •        Ecosystem – A
              community of
              interdependent
              organisms and the           Community
              physical environment        A community is a group of populations living and interacting with each other in a common
              they inhabit.
                                          habitat. This contrasts with the term ‘population’ which refers to just one species. The
                                          grasslands of Africa contain wildebeest, lions, hyenas, giraffes and elephants as well as
    To access worksheet 2.1               zebras. Communities include all biotic parts of the ecosystem, both plants and animals.
    on mini-ecosystems,
    please visit www.
    pearsonbacconline.com                 Ecosystem
    and follow the on-screen
    instructions.
                                          An ecosystem is a community of interdependent organisms (the biotic component) and the
                                          physical environment (the abiotic component) they inhabit.
    20

02_M02_14_82.indd 20                                                                                                                         15/04/2010 08:54
2.1 Structure - Pearson ...
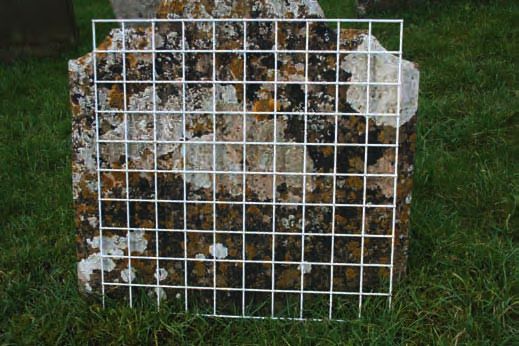
Population interactions                                                                                                                             Examiner’s hint:
                                                                                                                                                             You must be able to define
           Ecosystems contain numerous populations with complex interactions between them. The                                                               the terms species, population,
           nature of the interactions varies and can be broadly divided into four types (competition,                                                        habitat, niche, community and
                                                                                                                                                             ecosystem and apply them to
           predation, parasitism and mutualism), each of which is discussed below.                                                                           examples from your local area.

           Competition
           When resources are limiting, populations are bound to compete in order to survive. This
           competition can be either within a species (intraspecific competition) or between different
           species (interspecific competition). Interspecific competition exists when the niches of
           different species overlap (Figure 2.7). No two species can occupy the same niche, so the
           degree to which niches overlap determines the degree of interspecific competition. In this
           relationship, neither species benefit, although better competitors suffer less.
                                                                                                                                                             Figure 2.7
                                                                                                                                                             The niches of species A and
                                                                                                                                                             species B, based on body
                                                                                                species B
                 proportion of individuals

                                                                                                                                                             size, overlap with each other
                                                                                                                                                             to a greater extent than with
                                                     species A                                                                                   species C   species C. Strong interspecific
                                                                                                                                                             competition will exist
                                                                                                                                                             between species A and B but
                                                                                                                                                             not with species C.

                                                                                                                 body size

           Experiments with single-celled animals have demonstrated the principle of competitive
           exclusion: if two species occupying similar niches are grown together, the poorer
                         (a)
           competitor will   be eliminated (Figure 2.8).
           (a)                                                                                      P. aurelia
                                               (a)                                                                                                           Figure 2.8
                                                                  density density

                                                                                                                             P. caudatum                     Species of Paramecium
                                                                                                    P. aurelia
                                                                                                                                                             can easily be gown in the
                                                                population

                                                                                                                             P. caudatum
                                                                                                                                                             laboratory. (a) If two species
                                                                                                                                                             with very similar resource
                                                       population

                                                                                                                                                             needs (i.e. similar niches) are
                                                                                                                                                             grown separately, both can
                                                                                                                                                             survive and flourish. (b) If the
                                                                                    0   2   4      6        8         10     12     14     16   18           two species are grown in a
                                                                                                            days                                             mixed culture, the superior
                                                                                    0   2   4      6        8         10     12      14    16   18           competitor – in this case
                                                                                                            days                                             P. aurelia – will eliminate the
                                             (b)                                                                                                             other.
           (b)
                                                                  density density

                                             (b)                                                        P. aurelia
                                                                population

                                                                                                         P. aurelia

                                                                                                                             P. caudatum
                                                       population

                                                                                                                             P. caudatum
                                                                                    0   2   4      6        8         10      12     14    16   18
                                                                                                            days
                                                                                    0   2   4      6        8         10     12      14    16   18
                                                                                                            days

           Individuals within the same species occupy the same niche. Thus, if resources become
           limiting for a population, intraspecific competition becomes stronger.
                                                                                                                                                                                          21

02_M02_14_82.indd 21                                                                                                                                                               15/04/2010 08:54
2.1 Structure - Pearson ...
2             THE ECOSYSTEM

                                     Predation
                                     Predation occurs when one animal (or, occasionally, a plant) hunts and eats another animal.
                                     These predator–prey interactions are often controlled by negative feedback mechanisms
                                     that control population densities (e.g. the snowshoe hare and lynx, page 8).
    Nepenthes rajah, the largest
    pitcher plant, can hold
    up to 3.5 litres of water in
    the pitcher and has been
    known to trap and digest
    small mammals such as rats.
    Nepenthes rajah is endemic to
    Mount Kinabalu where it lives
    between 1500 and 2650 m
    above sea level (pages 66–67).

    Not all predators are
    animals. Insectivorous
    plants, such as the Venus
    fly traps and pitcher plants
    trap insects and feed on
    them. Such plants often
    live in areas with nitrate-
    poor soils and obtain
    much of their nitrogen
    from animal protein.

                                     Parasitism
                                     In this relationship, one organism (the parasite) benefits at the expense of another (the
                                     host) from which it derives food. Ectoparasites live on the surface of their host (e.g. ticks
                                     and mites); endoparasites live inside their host (e.g. tapeworms). Some plant parasites draw
                                     food from the host via their roots.
    Rafflesia have the largest
    flowers in the world but no
    leaves. Without leaves, they
    cannot photosynthesize, so
    they grow close by South-
    East Asian vines (Tetrastigma
    spp.) from which they draw
    the sugars they need for
    growth.

                                     Mutualism
                                     Symbiosis is a relationship in which two organisms live together (parasitism is a form of
                                     symbiosis where one of the organisms is harmed). Mutualism is a symbiotic relationship
                                     in which both species benefit. Examples include coral reefs and lichens. Coral reefs show
                                     a symbiotic relationship between the coral animal (polyp) and zooxanthellae (unicellular
                                     brown algae or dinoflagellates) that live within the coral polyp (Figure 2.9).

    22

02_M02_14_82.indd 22                                                                                                             15/04/2010 08:54
2.1 Structure - Pearson ...
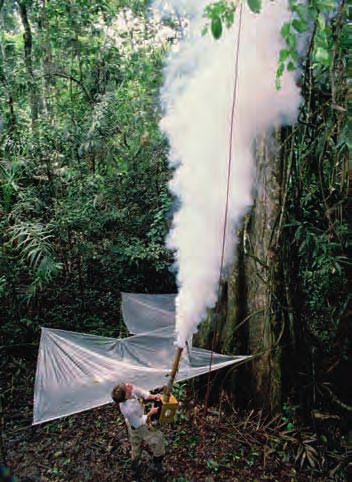
zooxanthellae   Figure 2.9
             tenticles with                 mouth                                                                       The zooxanthellae living
             nematocysts                                                                                                within the polyp animal
             (stinging cells)                                                                                           photosynthesize to produce
                                                                                                                        food for themselves and the
                                                                                                                        coral polyp, and in return are
                                                                                                                        protected.

                                                                                                                            Mutualism is a symbiotic
                                                                                                                            relationship in which both
                                                                                                                            species benefit.
                                                                                                          nematocyst        Parasitism is a symbiotic
                                                                                                                            relationship in which one
                                                                                                                            species benefits at the
              gastrovascular cavity                                                                                         expense of the other.
              (digestive sac)

             living tissue linking polyps

              limestone calice                                                           skeleton

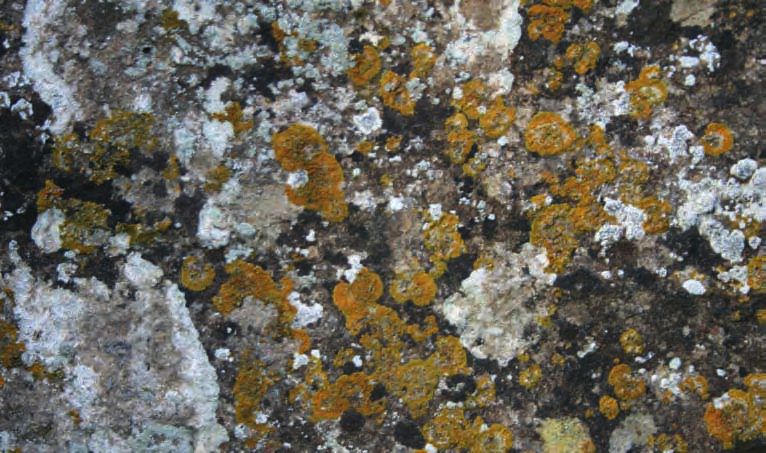
                                                                                                                        Lichens consist of a fungus
                                                                                                                        and alga in a symbiotic
                                                                                                                        relationship. The fungus is
                                                                                                                        efficient at absorbing water
                                                                                                                        but cannot photosynthesize,
                                                                                                                        whereas the alga contains
                                                                                                                        photosynthetic pigments and
                                                                                                                        so can use sunlight energy
                                                                                                                        to convert carbon dioxide
                                                                                                                        and water into glucose.
                                                                                                                        The alga therefore obtains
                                                                                                                        water and shelter, and the
                                                                                                                        fungus obtains a source of
                                                                                                                        sugar from the relationship.
                                                                                                                        Lichens with different colours
                                                                                                                        contain algae with different
                                                                                                                        photosynthetic pigments.

                                                          EXERCISES
             1      Define the terms species, population, habitat, niche, community, and ecosystem. What is the
                    difference between a habitat and a niche? Can different species occupy the same niche?
             2      What is the difference between mutualism and parasitism? Give examples of each.
             3      The abundance of one species can affect the abundance of another. Give an ecological
                    example of this, and explain how the predator affects the abundance of the prey, and vice
                    versa. Are population numbers generally constant in nature? If not, what implications does
                    this have for the measurement of wild population numbers?

                                                                                                                                                    23

02_M02_14_82.indd 23                                                                                                                         15/04/2010 08:54
2              THE ECOSYSTEM

                                         2.2  Measuring abiotic components of the
                                                   system
                                       Assessment statements
                                       2.2.1 List the significant abiotic (physical) factors of an ecosystem.
                                       2.2.2 Describe and evaluate methods for measuring at least three abiotic (physical)
                                             factors within an ecosystem.

                                       Measuring abiotic components
                                       Ecosystems can be broadly divided into three types.
                                       • Marine – The sea, estuaries, salt marshes and mangroves are all characterized by the high
                                         salt content of the water.
                                       • Freshwater – Rivers, lakes and wetlands.
                                       • Terrestrial – Land-based.
                                       Each ecosystem has its own specific abiotic factors (listed below) as well as the ones they share.
                                       Abiotic factors of a marine ecosystem:
                                       • salinity
                                       • pH
                                       • temperature
                                       • dissolved oxygen
                                       • wave action.
                                       Estuaries are classified as marine ecosystems because they have high salt content compared
                                       to freshwater. Mixing of freshwater and oceanic sea water leads to diluted salt content but
                                       it is still high enough to influence the distribution of organisms within it – salt-tolerant
                                       animals and plants have specific adaptations to help them cope with the osmotic demands
                                       of saltwater.
                                       Only a small proportion of freshwater is found in ecosystems (Figure 2.10). Abiotic factors
                                       of a freshwater ecosystem:
                                       • turbidity                              • temperature
                                       • flow velocity                          • dissolved oxygen
                                       • pH.
    Figure 2.10                                                                 lakes
                                                                                             soil moisture 0.05%
                                                                               0.26%
    The majority of the Earth’s                                permafrost                    wetlands 0.03%
    freshwater is locked up in                                   0.86%
    ice and snow, and is not                                                                              rivers
    directly available to support      fresh groundwater                                                 0.006%
    life. Groundwater is a store of          30.1%
    water beneath ground and
    again is inaccessible for living
    organisms.

                                                                                                                   ice and snow
                                                                                                                       68.7%

    24

02_M02_14_82.indd 24                                                                                                                   15/04/2010 08:54
Abiotic factors of a terrestrial ecosystem:
           • temperature
           • light intensity
           • wind speed
           • particle size
           • slope/aspect
           • soil moisture
           • drainage
           • mineral content.
                                                                                                             The Nevada desert, USA.
                                                                                                             Water supply in terrestrial
                                                                                                             ecosystems can be extremely
                                                                                                             limited, especially in desert
                                                                                                             areas, and is an important
                                                                                                             abiotic factor in controlling
                                                                                                             the distribution of organisms.

           You must know methods for measuring each of the abiotic factors listed above and how
                                                                                                                 To learn more about
           they might vary in any given ecosystem with depth, time or distance. Abiotic factors are              sampling techniques, go
           examined in conjunction with related biotic components (pages 29–34). This allows species             to www.pearson.co.uk,
           distribution data to be linked to the environment in which they are found and explanations            insert the express code
           for the patterns to be proposed.                                                                      2630P and click on activity
                                                                                                                 2.4.
                                             Distribution of Earth’s water

                    fresh water                             other                            rivers
                        3%                                  0.9%             surface          2%
                                                                             water                               The majority of the Earth’s
                                                                                            swamps
                                                                             0.3%                                water is found in the
                                                                                             11%
                                                         groundwater                                             oceans, with relatively little
                                                            30.1%                                                in lakes and rivers. Much of
                                                                                                                 the freshwater that does
                                                                                                                 exist is stored in ice at the
                       saltwater                                                                                 poles (Figures 2.10 and
                         97%                                                                                     2.11).
                                                                                              lakes
                                                                                              87%
                                                         icecaps and
                                                           glaciers
                                                            68.7%
                                                                                                             Figure 2.11
                                                                                                             The percentage of the
                                                                                                             planet containing freshwater
                                                                                                             ecosystems is extremely low
                   Earth’s water                         fresh water                   fresh surface water   compared to oceanic ones.

                                                                                                                                          25

02_M02_14_82.indd 25                                                                                                              15/04/2010 08:55
2               THE ECOSYSTEM

    Abiotic factors that can         Evaluating measures for describing abiotic
    be measured within an
    ecosystem include the
                                     factors
    following.                       This section examines the techniques used for measuring abiotic factors. An inaccurate
    • Marine environment            picture of an environment may be obtained if errors are made in sampling: possible sources
        – Salinity, pH,
        temperature, dissolved
                                     of error are examined below.
        oxygen, wave action.
    • Freshwater
        environment –
                                     Light
        Turbidity, flow velocity,    A light-meter can be used to measure the light in an ecosystem. It should be held at a
        pH, temperature,
                                     standard and fixed height above the ground and read when the value is fixed and not
        dissolved oxygen.
    • Terrestrial environment       fluctuating. Cloud cover and changes in light intensity during the day mean that values
        – Temperature, light         must be taken at the same time of day and same atmospheric conditions: this can be
        intensity, wind speed,       difficult if several repeats are taken. The direction of the light-meter also needs to be
        particle size, slope, soil
                                     standardized so it points in the same direction at the same angle each time it is used. Care
        moisture, drainage,
        mineral content.             must be taken not to shade the light-meter during a reading.

                                     Temperature
                                     Ordinary mercury thermometers are too fragile for fieldwork, and are hard to read. An
                                     electronic thermometer with probes (datalogger) allows temperature to be measured in
                                     air, water, and at different depths in soil. The temperature needs to be taken at a standard
                                     depth. Problems arise if the thermometer is not buried deeply enough: the depth needs to
                                     be checked each time it is used.

                                     pH
                                     This can be measured using a pH meter or datalogging pH probe. Values in freshwater
                                     range from slightly basic to slightly acidic depending on surrounding soil, rock and
                                     vegetation. Sea water usually has a pH above 7 (alkaline). The meter or probe must be
                                     cleaned between each reading and the reading taken from the same depth. Soil pH can be
                                     measured using a soil test kit – indicator solution is added and the colour compared to a
                                     chart.

                                     Wind
                                     Measurements can be taken by observing the effects of wind on objects – these are then
                                     related to the Beaufort scale. Precise measurements of wind speed can be made with a
                                     digital anemometer. The device can be mounted or hand-held. Some use cups to capture
                                     the wind whereas other smaller devices use a propeller. Care must be taken not to block the
                                     wind. Gusty conditions may lead to large variations in data.

                                     Particle size
                                     Soil can be made up of large, small or intermediate particles. Particle size determines
                                     drainage and water-holding capacity (page 125). Large particles (pebbles) can be measured
    An anemometer measuring          individually and the average particle size calculated. Smaller particles can be measured
    wind speed. It works by
    converting the number of
                                     by using a series of sieves with increasingly fine mesh size. The smallest particles can be
    rotations made by three cups     separated by sedimentation. Optical techniques (examining the properties of light scattered
    at the top of the apparatus      by a suspension of soil in water) can also be used to study the smallest particles. The best
    into wind speed.                 techniques are expensive and the simpler ones time consuming.

    26

02_M02_14_82.indd 26                                                                                                                15/04/2010 08:55
ght
                sight the target      line of si
                at eye level                                                                                                      ght
                                                                                                                        line of si

                                                                                                  protractor

                                                                                                       read angle
                                                                                                       in degrees

                                                                                                               string and
                                                                                                               weignt

           Slope
           Surface run-off is determined by slope which can be calculated using a clinometer (Figure                 Figure 2.12
                                                                                                                     The slope angle is taken
           2.12). Aspect can be determined using a compass.                                                          by sighting along the
            If the slope is 10 degrees,                                                                              protractor’s flat edge and
                                                                                                                     reading the degree aligned
                                   percentage slope = tan(10) × 100 = 0.176 × 100 = 17.6%
                                                                                                                     with the string. Percentage
                                                                                                                     slope can be calculated by

           Soil moisture                                                                                             determining the tangent of
                                                                                                                     the slope using a scientific
           Soils contain water and organic matter. Weighing samples before and after heating in an                   calculator and multiplying
                                                                                                                     by 100.
           oven shows the amount of water evaporated and therefore moisture levels. Temperatures
           must not be hot enough to burn off organic content as this would further reduce soil
           weight and give inaccurate readings. Repeated readings should be taken until no further
           weight loss is recorded – the final reading should be used. Soil moisture probes are also
           available, which are simply pushed into the soil. These need to be cleaned between readings,
           and can be inaccurate.

           Mineral content
           The loss on ignition (LOI) test can determine mineral content. Soil samples are heated to
           high temperatures (500–1000 °C) for several hours to allow volatile substances to escape.
           Mass loss is equated to the quantity of minerals present. The temperature and duration of
           heating depend on the mineral composition of the soil, but there are no standard methods.
           The same conditions should be used when comparing samples.

           Flow velocity
           Surface flow velocity can be measured by timing how long it takes a floating object to
           travel a certain distance. More accurate measurements can be taken using a flow-meter (a
           calibrated propeller attached to a pole). The propeller is inserted into water just below the
           surface and a number of readings taken to ensure accuracy. As velocity varies with distance
           from the surface, readings must be taken at the same depth. Results can be misleading if
           only one part of a stream is measured. Water flows can vary over time because of rainfall or
           glacial melting events.

           Salinity
           Salinity can be measured using electrical conductivity (with a datalogger) or by the density
           of the water (water with a high salt content is much denser than low-salt water). Salinity                A flow-meter allows water
           is most often expressed as parts of salt per thousand parts of water (ppt). Sea water has an              velocity to be recorded at any
           average salinity of 35 ppt, which is equivalent to 35 g dm–3 or 35‰.                                      depth.

                                                                                                                                                27

02_M02_14_82.indd 27                                                                                                                     15/04/2010 08:55
2              THE ECOSYSTEM

                                         Dissolved oxygen
                                         Oxygen-sensitive electrodes connected to a meter can be used to measure dissolved oxygen.
                                         Care must be taken when using an oxygen meter to avoid contamination from oxygen in
                                         the air. A more labour-intensive method is Winkler titration – this is based on the principle
                                         that oxygen in the water reacts with iodide ions, and acid can then added to release iodine
                                         that can be quantitatively measured.

                                         Wave action
                                         Areas with high wave action have high levels of dissolved oxygen due to mixing of air and
                                         water in the turbulence. Wave action is measured using a dynamometer, which measures
                                         the force in the waves. Changes in tide and wave strength during the day and over monthly
                                         periods mean that average results must be used to take this variability into account.

                                         Turbidity
                                         Cloudy water is said to have high turbidity and clear water low turbidity. Turbidity affects
                                         the penetration of sunlight into water and therefore rates of photosynthesis. Turbidity can
                                         be measured using a Secchi disc (Figure 2.13). Problems may be caused by the Sun’s glare
                                         on the water, or the subjective nature of the measure with one person seeing the disc at one
    Figure 2.13
                                         depth but another, with better eyesight, seeing it at a greater depth. Errors can be avoided
    A Secchi disc is mounted on          by taking measures on the shady side of a boat.
    a pole or line and is lowered
                                         More sophisticated optical devices can also be used (e.g. a nephelometer or turbidimeter)
    into water until it is just out of
    sight. The depth is measured         to measure the intensity of light scattered at 90° as a beam of light passes through a water
    using the scale of the line or       sample.
    pole. The disc is raised until
    it is just visible again and a
    second reading is taken. The         Evaluation of techniques
    average depth calculated is
    known as the Secchi depth.
                                         Short-term and limited field sampling reduces the effectiveness of the above techniques
                                         because abiotic factors may vary from day to day and season to season. The majority
                                         of these abiotic factors can be measured using datalogging devices. The advantage of
                                         dataloggers is that they can provide continuous data over a long period of time, making
                                         results more representative of the area. As always, the results can be made more reliable by
                                         taking many samples.

                                              Abiotic data can be collected using instruments that avoid issues of objectivity as they directly record
                                              quantitative data. Instruments allow us to record data that would otherwise be beyond the limit of
                                              our perception.

                                                                                           EXERCISES
                                          1     List as many abiotic factors as you can think of. Say how you would measure each of these
                                                factors in an ecological investigation.
                                          2     Evaluate each of the methods you have listed in exercise 1. What are their limitations, and
                                                how may they affect the data you collect?
                                          3     Which methods could you use in (a) marine ecosystems, (b) freshwater ecosystems and
                                                (c) terrestrial ecosystems?

    28

02_M02_14_82.indd 28                                                                                                                                     15/04/2010 08:55
2.3 Measuring biotic components of the system

           Assessment statements
           2.3.1 Construct simple keys and use published keys for the identification of
                 organisms.
           2.3.2 Describe and evaluate methods for estimating abundance of organisms.
           2.3.3 Describe and evaluate methods for estimating the biomass of trophic levels in a
                 community.
           2.3.4 Define the term diversity.
           2.3.5 Apply Simpson’s diversity index and outline its significance.

           Keys for species identification
           Ecology is the study of living organisms in relation to their environment. We have
           examined the abiotic environmental factors that need to be studied, now we will look at
           the biotic or living factors. In any ecological study, it is important to correctly identify the
           organisms in question otherwise results and conclusions will be invalid. It is unlikely that
           you will be an expert in the animals or plants you are looking at, so you will need to use
           dichotomous keys.
           Dichotomous means ‘divided into two parts’. The key is written so that identification is
           done in steps. At each step, two options are given based on different possible characteristics
           of the organism you are looking at. The outcome of each choice leads to another pair of
           questions, and so on until the organism is identified.
           For example, suppose you were asked to create a dichotomous key based on the following
           list of specimens: rat, shark, buttercup, spoon, amoeba, sycamore tree, pebble, pine tree,
           eagle, beetle, horse, and car. An example of a suitable key is given below.

            1 a    Organism is living                                go to 4
              b    Organism is non-living                            go to 2
            2 a    Object is metallic                                go to 3
              b    Object is non-metallic                            pebble
            3 a    Object has wheels                                 car
              b    Object does not have wheels                       spoon
            4 a    Organism is microscopic                           amoeba
              b    Organism is macroscopic                           go to 5
            5 a    Organism is a plant                               go to 6
              b    Organism is an animal                             go to 8
            6 a    Plant has a woody stem                            go to 7
              b    Plant has a herbaceous stem                       buttercup
            7 a    Tree has leaves with small surface area           pine tree
              b    Tree has leaves with large surface area           sycamore tree
            8 a    Organism is terrestrial                           go to 9
              b    Organism is aquatic                               shark
            9 a    Organism has fewer than 6 legs                    go to 10
              b    Organism has 6 legs                               beetle
           10 a    Organism has fur                                  go to 11
              b    Organism has feathers                             eagle
           11 a    Organism has hooves                               horse
              b    Organism has no hooves                            rat
           The key can also be shown graphically (Figure 2.14, overleaf).
                                                                                                                    29

02_M02_14_82.indd 29                                                                                          15/04/2010 08:55
2             THE ECOSYSTEM

                                                      living                                                                      non-living
    Figure 2.14
    A dichotomous key for a
    random selection of animate
                                     microscopic                       macroscopic                                 non-metallic                    metallic
    and inanimate objects.

                                      amoeba                                                                         pebble
    To learn more about                                                                                                                   wheels              no wheels
    using dichotomous                              animal                                       plant
    keys, go to www.
    pearsonhotlinks.com,                                                                                                                   car                 spoon
                                                                             woody                                 herbaceous
    insert the express code
                                                                              stem
    2630P and click on
    activity 2.5.
                                                                                                                   buttercup
                                                       leaves with small              leaves with large
      Examiner’s hint:                                    surface area                   surface area
    You need to be able to
    construct your own keys for up
    to eight species.                                          pine tree               sycamore tree

                                     aquatic                                    terrestrial

                                      shark
                                                                    6 legs                        fewer than
                                                                                                    6 legs

                                                                    beetle       feathers                             fur

                                                                                     eagle                hooves                  without
                                                                                                                                  hooves

                                                                                                          horse
                                                                                                                                    rat

                                     Describe and evaluate methods for estimating
                                     abundance of organisms
                                     It is not possible for you to study every organism in an ecosystem, so limitations must be
    The measurement of the
    biotic factors is often          put on how many plants and animals you study. Trapping methods enable limited samples
    subjective, relying on your      to be taken. Examples of such methods include:
    interpretation of different      • pitfall traps (beakers or pots buried in the soil which animals walk into and cannot
    measuring techniques
                                         escape from)
    to provide data. It is
    rare in environmental            • small mammal traps (often baited with a door that falls down once an animal is inside)
    investigations to be             • light traps (a UV bulb against a white sheet that attracts certain night-flying insects)
    able to provide ways of          • tullgren funnels (paired cloth funnels, with a light source at one end, a sample pot the
    measuring variables that             other and a wire mesh between: invertebrates in soil samples placed on the mesh move
    are as precise and reliable
    as those in the physical
                                         away from the heat of the lamp and fall into the collecting bottle at the bottom).
    sciences. Will this affect       You can work out the number or abundance of organisms in various ways – either by
    the value of the data
                                     directly counting the number or percentage cover of organisms in a selected area (for
    collected and the validity
    of the knowledge?                organisms that do not move or are limited in movement), or by indirectly calculating
                                     abundance using a formula (for animals that are mobile – see the Lincoln index).

                                     The Lincoln index
                                     This method allows you to estimate the total population size of an animal in your study
                                     area. In a sample using the methods outlined above, it is unlikely you will sample all the
    30

02_M02_14_82.indd 30                                                                                                                                                      15/04/2010 08:55
animals in a population so you need a mathematical method to calculate the total numbers.
           The Lincoln index involves collecting a sample from the population, marking them in some
           way (paint can be used on insects, or fur clipping on mammals), releasing them back into
           the wild, then resampling some time later and counting how many marked individuals
           you find in the second capture. It is essential that marking methods are ethically acceptable
           (non-harmful) and non-conspicuous (so that the animals are not easier to see and therefore
           easier prey).
           Because of the procedures involved, this is called a ‘capture–mark–release–recapture’
           technique. If all of the marked animals are recaptured then the number of marked
           animals is assumed to be the total population size, whereas if half the marked animals are
           recaptured then the total population size is assumed to be twice as big as the first sample.
           The formula used in calculating population size is shown below.
            N = total population size of animals in the study site
                                                                                                             To learn more about the
            n1 = number of animals captured on first day                                                     Lincoln index, go to www.
            n2 = number of animals recaptured                                                                pearsonhotlinks.com,
                                                                                                             insert the express code
            m = number of marked animals recaptured on the second day                                        2630P and click on activity
                                                               × n2​
                                                          ​ n1 m
                                                     N = _______                                             2.6.

           Movement of your animals into and out from your study area will lead to inaccurate results.

           Quadrats
           Quadrats are used to limit the sampling area when you want to measure the population size
           of non-mobile organisms (mobile ones can move from one quadrat to another and so be
           sampled more than once thus making results invalid). Quadrats vary in size from 0.25 m
           square to 1 m square. The size of quadrat should be optimal for the organisms you are
           studying. To select the correct quadrat size, count the number of different species in several
           differently sized quadrats. Plot the number of species against quadrat size: the point where
           the graph levels off, and no further species are added even when the quadrats gets larger,
           gives you the size of the quadrat you need to use.
           If your sample area contains the same habitat throughout, quadrats should be located at
           random (use a random number generator, page 332 – these can be found in books or on
           the internet). First, you mark out an area of your habitat using two tape measures placed at
           right angles to each other. Then you use the random numbers to locate positions within the
           marked-out area . For example, if the grid is 10 m by 10 m, random numbers are generated
           between 0 and 1000. The random number 596 represents a point 5 metres 96 centimetres
           along one tape measure. The next random number is the coordinate for the second tape.
           The point where the coordinates cross is the location for the quadrat.
           If your sample area covers habitats very different from each other (e.g. an undisturbed and
           a disturbed area), you need to use stratified random sampling, so you take sets of results
           from both areas. If the sample area is along an environmental gradient, you should place
           quadrats at set distances (e.g. every 5 m) along a transect: this is called systematic sampling
           (continuous sampling samples along the whole length of the transect).
           Population density is the number of individuals of each species per unit area. It is
           calculated by dividing the number of organisms sampled by the total area covered by the
           quadrats.
           Plant abundance is best estimated using percentage cover. This method is not suitable
           for mobile animals as they may move from the sample area while counting is taking
           place.
                                                                                                                                    31

02_M02_14_82.indd 31                                                                                                         15/04/2010 08:55
2             THE ECOSYSTEM

    Percentage cover is the
    percentage of the area within
    the quadrat covered by one
    particular species. Percentage
    cover is worked out for each
    species present. Dividing
    the quadrat into a 10 × 10
    grid (100 squares) helps to
    estimate percentage cover
    (each square is 1 per cent of
    the total area cover).

                                     Percentage frequency is the percentage of the total quadrat number that the species was
                                     present in.

    Sample methods must                                                                 In the early 1980s, Terry Erwin, a scientist
    allow for the collection of                                                         at the Smithsonian Institution collected
    data that is scientifically                                                         insects from the canopy of tropical forest
    representative and                                                                  trees in Panama. He sampled 19 trees and
    appropriate, and allow the                                                          collected 955 species of beetle. Using
    collection of data on all                                                           extrapolation methods, he estimated there
    species present. Results                                                            could be 30 million species of organism
    can be used to compare                                                              worldwide. Although now believed to be
    ecosystems.                                                                         an overestimate, this study started the race
                                                                                        to calculate the total number of species
                                                                                        on Earth before many of them become
                                                                                        extinct.

    Canopy fogging uses a
    harmless chemical to
    knock-down insects into
    collecting trays (usually on
    the forest floor) where they
    can be collected. Insects
    not collected can return to
    the canopy when they have
    recovered.

                                     Describe and evaluate methods for estimating
                                     the biomass of trophic levels
                                     We have seen how pyramids of biomass can be constructed to show total biomass at each
                                     trophic level of a food chain. Rather than weighing the total number of organisms at each
                                     level (clearly impractical) an extrapolation method is used: the mass of one organism, or
                                     the average mass of a few organisms, is multiplied by the total number of organisms present
                                     to estimate total biomass.
                                     Biomass is calculated to indicate the total energy within in a living being or trophic level.
                                     Biological molecules are held together by bond energy, so the greater the mass of living
                                     material, the greater the amount of energy present. Biomass is taken as the mass of an
    Biomass is the mass              organism minus water content (i.e. dry weight biomass). Water is not included in biomass
    of organic material in           measurements because the amount varies from organism to organism, it contains no
    organisms or ecosystems,
    usually per unit area.
                                     energy and is not organic. Other inorganic material is usually insignificant in terms of mass,
                                     so dry weight biomass is a measure of organic content only.

    32

02_M02_14_82.indd 32                                                                                                                   15/04/2010 08:55
To obtain quantitative samples of biomass, biological material is dried to constant weight.
                                                                                                                        Variables can be measured
           The sample is weighed in a previously weighed container. The specimens are put in a hot                      but not controlled
           oven (not hot enough to burn tissue) – around 80 °C – and left for a specific length of time.                while working in the
           The specimen is reweighed and replaced in the oven. This is repeated until a similar mass is                 field. Fluctuations in
           obtained on two subsequent weighings (i.e. no further loss in mass is recorded as no further                 environmental conditions
                                                                                                                        can cause problems
           water is present). Biomass is usually stated per unit area (i.e. per metre squared) so that
                                                                                                                        when recording data.
           comparisons can be made between trophic levels. Biomass productivity is given as mass per                    Standards for acceptable
           unit area per period of time (usually years).                                                                margins of error are
                                                                                                                        therefore different. Is this
           To estimate the biomass of a primary producer within in a study area, you would collect all                  acceptable?
           the vegetation (including roots, stems, and leaves) within a series of 1 m by 1 m quadrats
           and then carry out the dry-weight method outlined above. Average biomass can then be
           calculated.

                                                                                                                     Examiner’s hint:
                                         Environmental philosophies                                                Dry-weight measurements of
             Ecological sampling can at times involve the killing of wild organisms. For example, to help assess   quantitative samples can be
             species diversity of poorly understood organisms (identification involves taking dead specimens       extrapolated to estimate total
                                                                                                                   biomass.
             back to the lab for identification), or to assess biomass. An ecocentric worldview, which promotes
             the preservation of all life, may lead you to question the value of such approaches. Does the end
             justify the means, and what alternatives (if any) exist?

           Diversity and Simpson’s diversity index
           Diversity is considered as a function of two components: the number of different species
           and the relative numbers of individuals of each species. It is different from simply counting
           the number of species (species richness) because the relative abundance of each species is
           also taken into account.
           There are many ways of quantifying diversity. You must be able to calculate diversity using
           the Simpson’s diversity index as shown below and in the example calculation on page 35.

            D = diversity index
            N = total number of organisms of all species found
                                                                                                                     Examiner’s hint:
            n = number of individuals of a particular species
                                                                                                                   You are not required to
             = sum of                                                                                             memorize the Simpson’s
                                                                                                                   diversity formula but must
                                                              N(N 2 1)
                                                       D = _________
                                                           ​            ​                                          know the meaning of the
                                                           n(n 2 1)
                                                                                                                   symbols.

           You could examine the diversity of plants within a woodland ecosystem, for example,
                                                                                                                        Diversity is the function
           using multiple quadrats to establish number of individuals present or percentage cover
                                                                                                                        of two components:
           and then using Simpson’s diversity index to quantify the diversity. A high value of D                        the number of different
           suggests a stable and ancient site, and a low value of D could suggest pollution, recent                     species and the relative
           colonization or agricultural management (Chapter 4). The index is normally used in                           numbers of individuals
           studies of vegetation but can also be applied to comparisons of animal (or even all                          of each species. This is
                                                                                                                        different from species
           species) diversity.                                                                                          richness, which refers
           Samples must be comprehensive to ensure all species are sampled (Figure 2.15, overleaf).                     only to the number of
                                                                                                                        species in a sample or area.
           However, it is always possible that certain habitats have not been sampled and some species
           missed. For example, canopy fogging does not knock down insects living within the bark of
           the tree so these species would not be sampled.

                                                                                                                                                33

02_M02_14_82.indd 33                                                                                                                    15/04/2010 08:55
2             THE ECOSYSTEM

    Figure 2.15                                                                      30
    To make sure you have
    sampled all the species in                                                       25
    your ecosytem, perform a

                                                         number of species counted
    cumulative species count: as                                                     20
    more quadrats are added to
    sample size, any additional
                                                                                     15
    species are noted and added
    to species richness. The point
    at which the graph levels off                                                    10
    gives you the best estimate of
    the number of species in your                                                     5
    ecosystem.
                                                                                      0
                                                                                          1            5              10            15                 20
                                                                                                               number of quadrats

                                     Measures of diversity are relative, not absolute. They are relative to each other but not
                                     to anything else, unlike, say, measures of temperature, where values relate to an absolute
                                     scale. Comparisons can be made between communities containing the same type of
                                     organisms and in the same ecosystem, but not between different types of community
                                     and different ecosystems. Communities with individuals evenly distributed between
                                     different species are said to have high ‘evenness’ and have high diversity. This is because
                                     many species can co-exist in the many available niches within a complex ecosystem.
                                     Communities with one dominant species have low diversity which indicates a poorer
                                     ecosystem not able to support as many types of organism. Measures of diversity in
                                     communities with few species can be unreliable as relative abundance between species
                                     can misrepresent true patterns.

                                         Only 1 per cent of described species are vertebrates (Figure 2.16), yet this is the group that
                                         conservation initiatives are often focussed on.

    Figure 2.16                                                                                                   vertebrates              other
    Of the total number of                                                                                            1%                 organisms
    described species (about 1.8                                                                                                            6%
    million), excluding microbes,                                                                             fungi
    over three-quarters are                                                                                    4%
    invertebrates. Over half are
    insects. The most successful
    group are the beetles, which                                         plants/algae
    occupy all ecosystems apart                                             18%
    from oceanic ones.                                                                                                                          beetles
                                                                                                                                                 22%

                                                   other invertebrates
                                                          12%
                                                                                                                                                     flies
                                                                                                                                                     9%
                                                                                              other insects                         wasps
                                                                                                 13%                  butterflies    8%
                                                                                                                       & moths
                                                                                                                         7%

    34

02_M02_14_82.indd 34                                                                                                                                         15/04/2010 08:55
Example calculation of Simpson’s diversity index                                                         To download a
            The data from several quadrats in woodland were pooled to obtain the table below.                        Simpson’s diversity index
                                                                                                                     calculator, go to www.
                         Species                          Number (n)                  n(n 2 1)                       pearsonhotlinks.com,
                         woodrush                               2                           2                        insert the express code
                         holly (seedlings)                      8                          56                        2630P and click on activity
                         bramble                                1                           0                        2.7.
                         Yorkshire fog                          1                           0
                         sedge                                  3                           6
                         total (N)                             15                          64                        Applying the rigorous
                                                                                                                     standards used in
            Putting the figures into the formula for Simpson’s diversity index:                                      a physical science
                                                                                                                     investigation would render
                                                        N = 15
                                                                                                                     most environmental
                                                        N 2 1 = 14                                                   studies unworkable.
                                                                                                                     Whether this is acceptable
                                                        N(N 2 1) = 210
                                                                                                                     or not is a matter of
                                                        n(n 2 1) = 64                                               opinion, although it could
                                                            ​ 210 ​= 3.28
                                                        D = ____                                                     be argued that by doing
                                                              64                                                     nothing we would miss
                                                                                                                     out on gaining a useful
                                                                                                                     understanding of the
                                                        EXERCISES
                                                                                                                     environment.
             1    Create a key for a selection of objects of your choice. Does your key allow you to accurately
                  identify each object?
             2    What ethical considerations must you bear in mind when carrying out mark–release–
                  recapture exercises on wild animals?
             3    Take a sheet of paper and divide it into 100 squares. Cut these squares out and put them into
                  a tray. Select 20 of these squares and mark them with a cross. Put them back into the tray.
                  Recapture 20 of the pieces of paper. Record how many are marked. Use the Lincoln index to
                  estimate the population size of all pieces of paper. How closely does this agree with the actual
                  number (100)? How could you improve the reliability of the method?
             4    What is the difference between species diversity and species richness?
             5    What does a high value for the Simpson’s index tell you about the ecosystem from which the
                  sample is taken? What does a low value tell you?

             2.4       Biomes
           Assessment statements
           2.4.1 Define the term biome.
           2.4.2 Explain the distribution, structure and relative productivity of tropical rainforests,
                 deserts, tundra, and any other biome.

           Definition of biome
           A biome is a collection of ecosystems sharing similar climatic conditions. A biome has
                                                                                                                     To access worksheet 2.2
           distinctive abiotic factors and species which distinguish it from other biomes (Figure 2.17,
                                                                                                                     investigating different
           overleaf). Water (rainfall), insolation (sunlight), and temperature are the climate controls              biomes, please visit www.
           important in understanding how biomes are structured, how they function and where they                    pearsonbacconline.com
           are found round the world.                                                                                and follow the on-screen
                                                                                                                     instructions.
           Water is needed for photosynthesis, transpiration, and support (cell turgidity). Sunlight
           is also needed for photosynthesis. Photosynthesis is a chemical reaction, so temperature
           affects the rate at which it progresses. Rates of photosynthesis determine the productivity of
                                                                                                                                            35

02_M02_14_82.indd 35                                                                                                                 15/04/2010 08:55
You can also read