Study on the Development of the Renewable Energy Market in Latin America and the Caribbean - November 2014
←
→
Page content transcription
If your browser does not render page correctly, please read the page content below
Study on the Development
               of the Renewable Energy
               Market in Latin America and
               the Caribbean

               November 2014

OVE/WP-02/14
Study on the Development
of the Renewable Energy
Market in Latin America and
the Caribbean

Christopher Flavin
Milena Gonzalez
Ana Maria Majano
Alexander Ochs
Maria da Rocha
Philipp Tagwerker

November 2014
STUDY ON THE DEVELOPMENT OF THE RENEWABLE ENERGY
    MARKET IN LATIN AMERICA AND THE CARIBBEAN
     UNDER THE IDB CLIMATE CHANGE EVALUATION

                                IDB RFP #14-002

                                    June 2014

                                Project Director
                                Alexander Ochs
                   aochs@worldwatch.org | 202.745.8092, Ext. 511

                                Project Manager
                                Milena Gonzalez
                 mgonzalez@worldwatch.org | 202.745.8092, Ext. 527

                                       Authors
        Christopher Flavin, Milena Gonzalez, Ana Maria Majano, Alexander Ochs,
                Maria Gabriela da Rocha Oliveira, and Philipp Tagwerker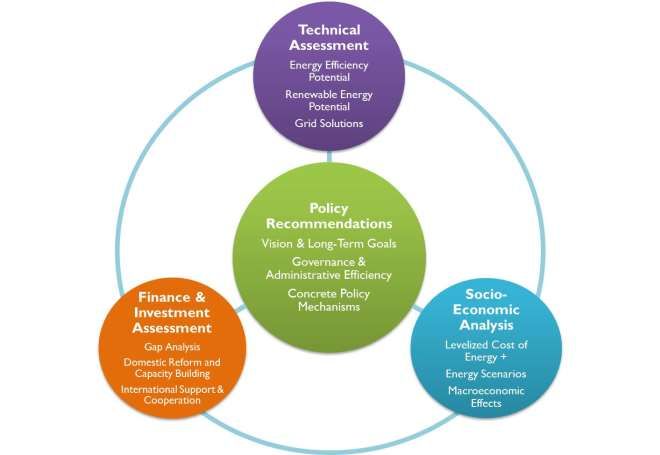
Contents

Introduction......................................................................................................................... 1
1 Renewable Energy for Power Generation: Global Trends ................................................ 3
    1.1   Status of Renewable Energy Technologies.................................................................................. 4
    1.2   Renewable Energy Global Markets ............................................................................................. 6
    1.3   Grid Integration of Renewable Energy ...................................................................................... 11
    1.4   Environmental Impacts and Sustainable Development ............................................................ 12
2    Renewable Energy in Latin America and the Caribbean............................................................ 14
    2.1   Introduction to the Electricity Sector in the Region .................................................................. 14
    2.2   Renewable Energy Development by Sub-region ....................................................................... 20
      2.2.1    Mexico.............................................................................................................................................. 20
      2.2.2    Central America ............................................................................................................................... 21
      2.2.3    The Caribbean .................................................................................................................................. 23
      2.2.4    Andean Zone .................................................................................................................................... 25
      2.2.5    Brazil ................................................................................................................................................ 27
      2.2.6    Southern Cone .................................................................................................................................. 29
    2.3   Renewable Energy Policy Landscape and Trends ...................................................................... 31
      2.3.1    Renewable electricity targets........................................................................................................... 31
      2.3.2    Renewable energy tenders or auctions ............................................................................................ 31
      2.3.3    Regulatory policies ........................................................................................................................... 32
      2.3.4    Fiscal incentives ............................................................................................................................... 34
      2.3.5    Public funds for renewable energy projects ..................................................................................... 35
    2.4   Renewable Energy Investment Flows and Market Trends ........................................................ 35
    2.5   Outlook for Medium-Term Expansion of Renewable Energy in the Region ............................. 39
3    Barriers to the Advancement of Renewable Energy in Latin America and the Caribbean, and
     Opportunities to Overcome Them ........................................................................................... 40
    3.1   The Importance of Policies and Measures in Overcoming Barriers .......................................... 40
    3.2   Technological Barriers ............................................................................................................... 41
      3.2.1    Lack of available data and information ........................................................................................... 41
      3.2.2    Transmission and distribution challenges ........................................................................................ 42
      3.2.3    The need for integrated resource planning ..................................................................................... 42
    3.3   Market Barriers.......................................................................................................................... 43
      3.3.1    Restricted grid and power market access ........................................................................................ 43
      3.3.2    Lack of economies of scale ............................................................................................................... 44
      3.3.3    High transaction costs...................................................................................................................... 45
3.3.4     Counterparty risk ............................................................................................................................. 46
       3.3.5     Fossil fuel subsidies .......................................................................................................................... 46
       3.3.6     The need to create open, fair, and competitive electricity markets ................................................ 48
    3.4    Finance Sector Barriers.............................................................................................................. 48
       3.4.1     Currency risks ................................................................................................................................... 49
       3.4.2     Inadequacy of financial products ..................................................................................................... 49
       3.4.3     Underdeveloped financial sectors .................................................................................................... 50
       3.4.4     The need for financial sector development...................................................................................... 51
    3.5    Social Barriers ............................................................................................................................ 51
       3.5.1     Lack of public acceptance ................................................................................................................ 51
       3.5.2     Vested interest in business as usual ................................................................................................. 52
       3.5.3     Not In my backyard .......................................................................................................................... 52
       3.5.4     The need for up-to-date, fully inclusive data gathering and communication ................................. 53
4    Vulnerability to Climate Change, and Adaptation Strategies in the Power Sector in
     Latin America and the Caribbean ............................................................................................. 55
    4.1    Climate Change Impacts in the Region...................................................................................... 55
    4.2    Power Sector Vulnerability to Climate Change Impacts, and Adaptation Measures ............... 56
       4.2.1     Power generation............................................................................................................................. 56
       4.2.2     Electricity transmission and distribution.......................................................................................... 58
       4.2.3     Energy demand ................................................................................................................................ 59
    4.4    Adaptation Developments in the Region to Date ..................................................................... 59
5    How Multilateral Banks Can Support Renewable Energy Development in
     Latin America and the Caribbean ............................................................................................. 61
    5.1    Building Enabling Infrastructure for the Grid of the Future ...................................................... 61
    5.2    Securing Private Sector Investment .......................................................................................... 63
    5.3    Engaging in Energy Policy Design and Development ................................................................ 64
    5.4    Helping to Establish Supply Chains for Current and Emerging Technologies ........................... 65
Endnotes ...................................................................................................................................... 67
List of Figures
Figure 1.1 World Primary Energy from Renewable Sources, 1990–2012 3
Figure 1.2 Total Primary Energy from Renewable Sources, by Region, 2002–2012 4
Figure 1.3 Global Energy Growth Rates, by Source, 2007–2012 7
Figure 1.4 Global Investment in Renewable Energy, 2004–2013 7
Figure 1.5 Global Levelized Cost of Energy Ranges for Renewable Power Generation, 2013 8
Figure 2.1 Share of Installed Power Capacity in IDB Member Countries, by Sub-region, 2013 14
Figure 2.2 Electricity Production in IDB Member Countries, 1990–2011 15
Figure 2.3 Growth in Electricity Consumption in IDB Member Countries, by Sub-region,
1990–2000 and 2001–2011 15
Figure 2.4 Electricity Access in IDB Member Countries, 2012 16
Figure 2.5 Population Without Access to Electricity IDB Member Countries, by Sub-region, 2012 16
Figure 2.6 Electric Power Transmission and Distribution Losses in IDB Member Countries, 2011 17
Figure 2.7 Electricity Generation by Source in IDB Member Countries, 1970, 1990, and 2013 18
Figure 2.8 Net Renewable Capacity Additions by Source in IDB Member Countries, 2007–2012 18
Figure 2.9 Installed Power Capacity in Mexico, by Source, 2012 20
Figure 2.10 Installed Power Capacity in Central America, by Source, 2012 22
Figure 2.11 Installed Power Capacity in Central America, by Country and Source, 2012 22
Figure 2.12 Installed Power Capacity in the Caribbean IDB Member Countries, by Source, 2012 24
Figure 2.13 Installed Power Capacity in the Caribbean, by Country and Source, 2012 25
Figure 2.14 Installed Power Capacity in the Andean Zone, by Source, 2012 26
Figure 2.15 Installed Power Capacity in the Andean Zone, by Country and Source, 2012 26
Figure 2.16 Installed Power Capacity in Brazil, by Source, 2012 28
Figure 2.17 Installed Power Capacity in the Southern Cone 29
Figure 2.18 Installed Power Capacity in the Southern Cone, by Country and Source, 2012 30
Figure 2.19 Cumulative Renewable Energy Investment IDB Member Countries, by Technology, 2006–2012 35
Figure 2.20 Cumulative Renewable Energy Investments in Brazil and Mexico, by Technology, 2006–2012 36
Figure 2.21 Cumulative Renewable Energy Investment in Central America, by Technology, 2006–2012 37
Figure 2.22 Cumulative Renewable Energy Investment in Caribbean IDB Member Countries, by Technology,
2006–2012 37
Figure 2.23 Cumulative Renewable Energy Investment in the Andean Zone, by Technology, 2006–2012 38
Figure 2.24 Cumulative Renewable Energy Investment in the Southern Cone, by Technology, 2006–2012 38
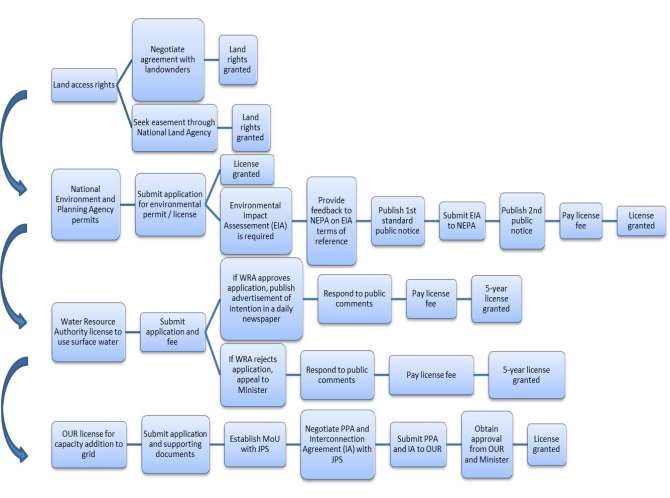
Figure 3.1 Permitting Process for Small Hydro Capacity (100 kW to 25 MW) in Jamaica 45
Figure 3.2 Levelized Cost of Energy Projection for Jamaica, 2010–2030 52
Figure 3.3 Levelized Cost of Energy and Job Creation Estimates for Jamaica, by Power Source 53
Figure 3.4 Worldwatch Methodology for Sustainable Energy Roadmap Development 54
List of Tables
Table 1.1 Global Electricity Generating Capacity of Selected Renewable Energy Sources, 2013 6
Table 1.2 Status of Renewable Energy Technologies: Characteristics and Costs 10
Table 2.1 Renewable Energy Potential in IDB Member Countries 19
Table 2.2 Key Sub-regional Statistics: Mexico 20
Table 2.3 Key Sub-regional Statistics: Central America 21
Table 2.4. Key Sub-regional Statistics: Caribbean IDB Member Countries 23
Table 2.5 Key Sub-regional Statistics: The Andean Zone 25
Table 2.6 Key Sub-regional Statistics: Brazil 27
Table 2.7 Key Sub-regional Statistics: Southern Cone 29
Table 2.8 Renewable Electricity Targets in IDB Member Countries 31
Table 2.9 Renewable Energy Contracted Under Auctions in IDB Member Countries, 2007–2013 32
Table 2.10 Fiscal Incentives in IDB Member Countries, by Country 34
Table 3.1 Post-Tax Subsidy as Share of GDP in IDB Member Countries 47
Table 4.1 Power Generation Vulnerabilities to Climate Change and Adaptation Measures by Technology 57Introduction
The region of Latin America and the Caribbean is already a global low-carbon leader in terms of power
generation from hydrological and biomass resources, and it recently has made great strides in developing its
other renewable energy sources. Declining costs, maturing technologies, and vast untapped potentials for
renewables offer an unprecedented opportunity for further development of the renewable energy market in
the region. Continuing to invest in renewables will provide Latin America and the Caribbean with the
opportunity to address key economic, social, and environmental challenges in the energy sector. These
include:
Achieving universal access to electricity
Approximately 34 million people in Latin America and the Caribbean still lack access to electricity.
Renewable energy has the ability to provide reliable, affordable, and sustainable modern energy services
to those who currently lack them. Increasing electricity access through decentralized micro-grid
solutions—thereby avoiding economically prohibitive grid expansion to remote locations—will advance
economic productivity, social opportunity, gender equality, and a host of other developmental priorities at
a fraction of the cost of fossil fuels over the long term.
Meeting future electricity demand
To meet rapidly growing electricity demand, Latin America and the Caribbean will need to double its
installed power capacity by 2030. A self-sufficient, domestic renewable energy supply can increase energy
security, eliminate the need for expensive fuel imports, and reduce the burden on national budgets. It can
also result in substantial economic and societal benefits such as increasing competitiveness, job creation,
and balance of payments, apart from its local and global environmental benefits.
Transforming the electricity system
In most parts of Latin America and the Caribbean, the grid infrastructure is outdated and in need of
significant modernization and expansion. This creates a unique opportunity to build a 21st-century
electricity system through integrated, system-wide national and regional energy planning that can support
growing shares of renewable energy, increase energy efficiency, and provide reliable service at the least
cost in the long term. This development must be based on thorough analysis of the technical and
socioeconomic potentials of the full spectrum of renewable technologies and result in a coherent policy
consisting of ambitious goals and concrete support mechanisms, supported by effective governance and
administrative structures and processes.
Mitigating and adapting to climate change
Climate change is already having, and will continue to have, profound impacts on the regional economy,
ecosystems, and human well-being in Latin America and the Caribbean. Climate change and the power
sector are closely related given that the power sector is an important source of greenhouse gas emissions
and that the sector itself is vulnerable to the impacts of climate change. In addition to contributing to
climate change mitigation, renewable energy can help make the region’s energy systems more reliable and
resilient in the face of a changing climate.
STUDY ON THE DEVELOPMENT OF THE RENEWABLE ENERGY MARKET IN LATIN AMERICA AND THE CARIBBEAN 1
UNDER THE IDB CLIMATE CHANGE EVALUATIONRenewables are increasingly the most economic option for new generation capacity, especially for countries that depend on fuel oil for power generation, such as many in Central America and the Caribbean. Resource advantages give the region the potential to match or even undercut the lowest costs achieved in other parts of the world. Low-cost financing and the scaling up of local industries are important keys to realizing that potential. Effective policies and measures can greatly improve the investment environment for domestic and international, as well as public and private, actors—particularly given a market that is distorted due to both direct and indirect subsidies for fossil fuels. Considering the longevity of current investments in power system infrastructure, it is imperative that policymakers carry out integrated resource plans that seek to lower overall electricity system costs in the long term by taking advantage of synergies among different renewable sources, energy efficiency, and smart grid technologies. This report begins with an overview of the status of renewable energy technologies for power generation and their global markets (Chapter 1). It then provides an overview of the power sector in Latin America and the Caribbean and of regional renewable energy development to date (Chapter 2). This is followed by an assessment of the current barriers to the continued development of renewable energy in the region, along with best practices for addressing them (Chapter 3). The report then analyzes the impacts of climate change in the region and suggests adaptation strategies for the power sector (Chapter 4). Finally, the report ends with recommendations to any Multilateral Development Bank, including the Inter-American Development Bank, on how they can best position and strengthen their role as a driving force behind the development of a future energy system powered by a large share of renewables in Latin America and the Caribbean. STUDY ON THE DEVELOPMENT OF THE RENEWABLE ENERGY MARKET IN LATIN AMERICA AND THE CARIBBEAN 2 UNDER THE IDB CLIMATE CHANGE EVALUATION
1      Renewable Energy for Power Generation: Global Trends

As a major source of greenhouse gas emissions, the energy sector is a critical component of low-carbon
development strategies being designed and adopted worldwide. These efforts seek to maximize the cross-
sectoral impacts of renewable energy development, such as economic and social development, energy
security, energy access, and reduced negative impacts on human and environmental health.

Electricity markets around the world have experienced rapid and dynamic change over the past five years.
Propelled by USD 1.1 trillion of investment since 2009—the vast majority of it from the private sector—
renewable power generation has grown at double-digit rates and accounted for more than 40% of the new
generating capacity added in 2012.1 (See Figures 1.1 and 1.2.) It can now be said with confidence that new
renewable energy technologies (in addition to long-established hydropower) have entered mainstream energy
markets and are in many cases economically competitive with fossil fuels—sometimes by wide margins.

                           FIGURE 1.1 World Primary Energy from Renewable Sources,
                                                 1990–2012
                 1,200

                 1,000
                                       Other RE
                                       Hydro Power
                  800
          MTOE

                  600

                  400

                  200

                    0
                         1990 1992 1994 1996 1998 2000 2002 2004 2006 2008 2010 2012

                                                                                      Source: BP

The global emergence of renewable energy is far from uniform, however. A handful of countries and regions—
including China, Europe, and North America—dominate both the manufacturing and use of these technologies.
The commercial maturity and economic competitiveness of individual renewable technologies is also uneven,
with most of the recent growth occurring in wind, solar, and biomass power. Geothermal, small hydropower,
and marine technologies continue to advance, but their markets remain tiny and are confined mainly to
geographic or resource conditions that are only rarely present.

STUDY ON THE DEVELOPMENT OF THE RENEWABLE ENERGY MARKET IN LATIN AMERICA AND THE CARIBBEAN             3
UNDER THE IDB CLIMATE CHANGE EVALUATION
FIGURE 1.2 Total Primary Energy from Renewable Sources,
by Region, 2002–2012
1,200
1,000 Asia
800 Africa + Middle
MTOE
East
600 Europe
400
South + Central
America
200
North America
0
2002 2003 2004 2005 2006 2007 2008 2009 2010 2011 2012
Source: BP
Wind, solar, and biomass resources are found in abundance and in varying combinations in most parts of the
world. Moreover, many of the technologies to tap these resources are now widely available on the world
market. Where the right market conditions and policy frameworks are in place, new power sources and
industries can be established in just a few years. This chapter provides an overview of the status of renewable
energy technologies for power generation and their global markets.
1.1 Status of Renewable Energy Technologies
Most renewable power technologies are based on principles of mechanical, electrical, and chemical
engineering that were understood many decades ago and are already being deployed widely in other
industries. For example, modern wind turbines draw on aviation design and materials, whereas biomass
combustion employs some of the same processes as coal-fired power plants. The newest renewable
technology in wide use today is the solar photovoltaic (PV) cell, a semiconductor material invented in the
1950s and related closely to the now-ubiquitous silicon chip.
Despite the surprisingly “conventional” nature of most renewable power technologies, turning them into
commercially reliable and economically competitive electricity generators has been a difficult and time-
consuming process. Virtually all of these devices were already at the prototype stage or beyond as early as the
1970s, but efforts to commercialize them rapidly in response to rising oil prices were stymied by technical and
reliability problems, high costs, and a lack of solid policy frameworks to support their development.
Wind power is the most widely deployed new renewable technology in use today, with 318 gigawatts (GW) of
capacity connected to the world’s power grids as of the end of 2013.2 Although the industry has experimented
with a range of technologies over the past three decades, the sector is dominated today by a single design:
three carbon fiber blades set atop a 50–100 meter steel tower that generates between 500 kilowatts (kW) and
5 megawatts (MW) of electricity. Individual turbines generally sell for USD 1,400 per kW.3 Turbines as small as
STUDY ON THE DEVELOPMENT OF THE RENEWABLE ENERGY MARKET IN LATIN AMERICA AND THE CARIBBEAN 4
UNDER THE IDB CLIMATE CHANGE EVALUATION1 kW and below are also available, mainly for distributed and off-grid applications, but their cost of generation is two to four times as high as for large turbines, and their contribution to global power supplies is minimal.4 The cost of grid-scale wind turbines has fallen steadily since these were introduced in the 1980s, as a result of small, cumulative improvements in components ranging from generators and transmissions to electronic controls. The largest factor in falling costs, however, has been the 40-fold increase in average turbine size, from less than 50 kW to nearly 2 MW.5 In addition, developers now place turbines higher to harness stronger winds, and operate them with higher capacity factors. Developing new wind farms typically takes 1–3 years (compared to 5–10 years for large coal and hydro plants), and individual turbines can be installed in a matter of days. However, installation of the largest turbines is sometimes constrained by the availability of transport infrastructure to move the massive equipment to the deployment site. Solar power has experienced the most rapid technology advances and cost reductions of any renewable technology in use today. Although the basic design of the semiconductor-based PV cells that dominate the market has changed only modestly since the 1970s, cumulative advances in cell and module efficiency and the scaling up and automation of manufacturing have brought down module costs. Average PV module prices have fallen by nearly 75% in the past three years. 6 These factors, combined with heightened global competition, have lowered prices from USD 4,000 per kW to well under USD 1,000 per kW just since 2009. 7 Although invented in the United States, solar modules have become a global commodity, with manufacturing now centered in China and other Asian countries, and the ability to ship modules virtually anywhere in the world. Unlike any other electricity technology, solar PV can be deployed economically at virtually any scale, from small cells that power individual light bulbs to square kilometers of panels that can produce as much electricity as a large coal-fired power plant. Another solar technology that is available for large-scale power generation (although only in high-insolation desert conditions) is concentrated solar thermal power (CSP), which collects solar heat and uses it to produce steam and drive a turbine. CSP plants are often equipped with the ability to store heat, which allows them to meet power needs several hours after sunset. Although CSP was deemed less expensive than PV electricity as recently as five years ago, CSP cost reductions have not kept up with sharply falling PV prices, and generation costs are now more than twice as high.8 Biomass—including urban and agricultural wastes, forest products, and dedicated energy crops—is a solid fuel that, most simply, can be used to fuel a power generator in the same way as coal. Direct combustion of biomass for power generation has been used for decades and is common in parts of Europe and North America. Biomass also can be converted to a premium fuel such as methane (biogas) or ethanol, or it can be gasified and used to run a generator. These technologies are in limited use today but continue to advance. The plethora of devices, scales, and feedstock options, however, has impeded industry standardization and mass production, keeping growth modest compared with solar and wind. Hydropower is a fully mature renewable energy technology that continues to be deployed in many developing countries. In addition to large hydro plants, small hydropower (less than 10 MW in size) is a popular option, particularly in areas where electricity from the main grid is unavailable. An estimated 75 GW of small hydro capacity is now in use—a third or more of it in China, which has prioritized its development.9 Geothermal electricity has been used since the 1970s and is deployed in locations where geothermally heated water is found near the Earth’s surface. The hot, pressurized water can be converted directly to steam to spin a turbine, or it can be used to heat a secondary fluid that drives the turbine. These resources are found in few locations, however, and just over 10 GW of generating capacity is now in operation worldwide.10 New installations in 2013 were just 1% of the capacity installed in both the wind and solar industries.11 New STUDY ON THE DEVELOPMENT OF THE RENEWABLE ENERGY MARKET IN LATIN AMERICA AND THE CARIBBEAN 5 UNDER THE IDB CLIMATE CHANGE EVALUATION
technologies that can harness the virtually unlimited geothermal heat found deeper in the Earth’s crust have
been under development for many years, but they have been slowed by technical hurdles and high costs. High
exploration and drilling expenses have limited industry investment, and the opportunity for large-scale
manufacturing is minimal.

A range of marine resources is being developed to supply renewable electricity as well. Tides, waves, currents,
and tropical heat differentials (known as ocean thermal energy conversion, or OTEC) all represent enormous
resources, but they are technologically challenging and expensive and provide only tiny amounts of electricity
today. With the exception of tidal power in a few select locations, none of these technologies is likely to be
widely available commercially for at least a decade, and potentially much longer.

1.2      Renewable Energy Global Markets
Global markets for renewable energy have been on the rise for decades, but in the past five years accelerated
double-digit growth has brought them into the mainstream of electricity production. Large hydropower, which
has been in use for more than a century, continues to dominate renewable power supplies globally (see Table
1.1), with much of the growth in Asia and Africa, where most of the potential remains untapped.12 Small hydro
is a growing portion of the hydropower market, but its growth remains modest.

TABLE 1.1 Global Electricity Generating Capacity of Selected Renewable Energy Sources, 2013

                             Generating Capacity
                                   gigawatts
 Hydropower                          1,000
 Wind power                           318
 Solar PV power                       139
 Biomass power                         88
 Geothermal power                      12
 CSP                                  3.4
Source: See Endnote 12 for this chapter.

After hydro, wind is the largest producer of renewable power at 318 GW, followed by solar PV (139 GW),
biomass (88 GW), geothermal (12 GW), and CSP (3.4 GW).13 By comparison, the total current generating
capacity of the entire Latin America region is roughly 300 GW.14 In 2013, renewable energy provided roughly
22.1% of the world’s electricity (5.7% if hydro is excluded).15 Measured by annual growth rates over the past
five years, the prominence of renewable energy sources is striking: solar has grown at 69% annually, wind at
25%, and biomass at 12% (see Figure 1.3); in contrast, all of the fossil fuels are growing at less than 4%
annually.16 The new renewable energy technologies (excluding large hydro) combined contributed 44% of the
generating capacity added in 2013.17

Most of the growth in renewables has occurred in a small number of countries, including China, Denmark,
Germany, and the United States. Growth within the United States has been uneven, however, with a handful
of states dominating the market. This concentration of renewable energy deployment is almost entirely a
consequence of policy differences, pointing to the large untapped potential to take technologies and policy
ideas that are already proven and to adopt them quickly in other parts of the world.

STUDY ON THE DEVELOPMENT OF THE RENEWABLE ENERGY MARKET IN LATIN AMERICA AND THE CARIBBEAN                  6
UNDER THE IDB CLIMATE CHANGE EVALUATION
FIGURE 1.3 Global Growth in Energy, by Source, 2007–2012
77%
69.0%
67%
57%
Growth Rate (%)
47%
37%
25.0%
27%
17.6%
17%
3.7%
7% 3.5%
0.6% 2.4%
-2.1%
-3%
Nuclear Oil Natural Gas Hydro Coal Biofuels Wind Solar
Source: BP
Global investment in renewable energy (including biofuels) reached USD 254 billion in 2013 (see Figure 1.4),
making renewables one of the largest and most dynamic segments of the electricity industry.18 The USD 15
billion invested in renewable energy in Latin America and the Caribbean in 2012 was just 6% of the world total,
with Brazil alone accounting for more than a third of the regional share.19 As other regions have demonstrated,
such investment could be increased rapidly with more-supportive policy frameworks in place.
FIGURE 1.4 Global Investment in Renewable Energy, 2004–2013
300 279
250
250 227
214
200
171 168
Billion USD
146
150
100
100
65
50 40
0
2004 2005 2006 2007 2008 2009 2010 2011 2012 2013
Source: BNEF
STUDY ON THE DEVELOPMENT OF THE RENEWABLE ENERGY MARKET IN LATIN AMERICA AND THE CARIBBEAN 7
UNDER THE IDB CLIMATE CHANGE EVALUATIONRenewable power has become an engine of employment in the countries where it has grown the fastest. The
renewables sector is more jobs intensive than most of the energy industry, and the positions created require
moderate-to-high skill levels and also pay relatively well. Of the estimated 6.5 million renewable energy jobs
reached in 2013 (including fuels and heat as well as electricity), most were in solar, bioenergy, and wind.20 The
majority of the jobs were found in China, Brazil, the United States, India, Germany, Spain, and Bangladesh.21
As renewable power markets have grown, the scale of individual installations has varied enormously. Wind
power, for example, began with a decentralized model in Denmark and Germany, with thousands of individual
turbines installed on farms—many of them owned by individual farmers or cooperatives. In the United States
and China, however, wind power has been dominated by large wind farms, often with hundreds of turbines
clustered in particularly windy locations (with generating capacities as high as 300 MW). The larger wind farms
are generally less expensive, but they are limited by the availability of transmission lines and the cost of
building new ones.
Biomass power plants tend to be of intermediate scale (rarely more than 50 MW), limited by the availability of
nearby biomass and the cost of transporting it long distances. Solar power, which has emerged as a significant
electricity option only in the past few years, is being installed at virtually every scale possible, from large
desert-based power plants to small residential rooftops. Small, “distributed” applications of less than 5 MW
are rapidly gaining market share due to the limited economies of scale and to the fact that sufficient sunlight is
available in urban areas where most power is consumed. Germany alone now has over 1 million individual
generators connected to its electricity grid. In northern Europe, such systems are often owned by local farmers
and their cooperatives, whereas in the United States, specialized firms are now building solar installations on
commercial and residential rooftops, with the building owner paying for the electricity only as it is generated.
Generating electricity from renewable resources is now economical in many circumstances, with costs varying
widely depending on the local resources, the capabilities of local industry, and the cost of capital. These
variables must be evaluated locally to determine the true economics. Generally, if resources are abundant,
biomass, geothermal, and hydropower have the lowest electricity cost, followed by onshore wind, solar PV,
and CSP. However, besides being constrained by their resource availability, geothermal and hydropower
projects have long lead times, which limit their rate of growth. For wind and solar, their larger resource, wider
geographic distribution, and targeted policy support in key markets have led to widespread development and
to increased convergence of the levelized cost of electricity (LCOE) of different renewables.22 (See Figure 1.5.)
FIGURE 1.5 Global Levelized Cost of Energy Ranges for
Renewable Power Generation, 2013
0.6
LCOE (USD/kWh)
0.5
0.4
0.3
0.2
0.1
0
Source: REN21
STUDY ON THE DEVELOPMENT OF THE RENEWABLE ENERGY MARKET IN LATIN AMERICA AND THE CARIBBEAN 8
UNDER THE IDB CLIMATE CHANGE EVALUATIONHydropower is currently the most reliable and cost-effective renewable power generation technology. Because it is a mature technology, further cost reductions in the future are unlikely. Costs depend heavily on the cost of civil works, civil engineering design, and other factors pertaining to the site and the scale of development of the country. Biomass costs rely heavily on feedstock prices, and data on prices vary widely between countries. Because data are lacking on price trends of feedstock, comparisons of price trends are difficult. The installed costs of geothermal power plants have risen due to increases in drilling costs (similar to the oil and gas sectors) and to a rise in commodity prices. Cost reductions are also heavily dependent on resource availability and siting of power plants, so it is unclear whether there will be significant reductions in the future.23 Total installed costs of wind power are again declining after reaching their peak in 2009. The rise in wind power costs was due to higher costs for materials for wind turbines, which constitute the largest cost component. New cost reductions have resulted from a global overcapacity of wind turbine manufacturers and increased competition from Chinese manufacturers. The difference between U.S. and Chinese turbine prices still remains large, making further price reductions likely in the future.24 The continued growth of solar PV installed capacity combined with a high learning curve and overcapacity in the manufacturing base has resulted in significant price decreases globally. Although PV module price reductions are expected to slow, balance-of-system (BoS) costs are likely to have a larger impact on future PV prices. Parabolic trough collection has been the most dominant and reliable CSP technology to date, used in 80% of CSP power plants; capital costs for CSP power plants therefore are much higher in comparison to other technologies. However, opportunities for reducing capital costs exist: for example, doubling the plant size from 50 MW to 100 MW can cut costs by 12%.25 It is important to note that a static analysis of costs by technology may not lead to the most appropriate choice of energy mix or least-cost energy system in the long term. A dynamic system analysis is required to identify the right combination of renewable energy sources that can unlock the synergies among them and provide flexibility to the power system. This analysis can provide policymakers with the information needed to support the development of the least-cost solution from a systems perspective.26 Table 1.2 summarizes the status of renewable energy technologies, including their costs and technical and operational considerations.27 STUDY ON THE DEVELOPMENT OF THE RENEWABLE ENERGY MARKET IN LATIN AMERICA AND THE CARIBBEAN 9 UNDER THE IDB CLIMATE CHANGE EVALUATION
TABLE 1.2 Status of Renewable Energy Technologies: Characteristics and Costs

                                                                                *
Technology     Market Niches          System         Capital Cost        LCOE                  Technology and Operational
                                  Characteristics     (USD/kW)         (USD/kWh)                       Considerations
Biomass       Utility-scale      Plant size:         800–4,500        0.04–0.20        Many technologies are well established,
              (Direct            1–200 MW            Co-fire:         Co-fire:         although gasification and pyrolysis are less
              combustion,        Capacity factor:    200–800          0.04–0.12        mature. Biomass is low cost where long-
              co-firing with     50–90%                                                term, sustainable supply of low-cost
              coal, MSW**)                                                             feedstock is available. Feedstock costs vary
              Industrial         Plant size:         Co-fire:         Co-fire:         by type, location, and preparation required.
              co-generation or   1–20 MW             200–800          0.04–0.12        Generally, landfill gas and biogas are
              self-generation    Capacity factor:    Gasification:    Gasification:    cheapest, then forest and agricultural
                                 Co-fire:            2,050–5,500      0.06–0.24        residue, followed by energy crops. Small-
                                 50–90%              Anaerobic        Anaerobic        scale gasifiers are more competitive than
                                 Gasification:       digestion:       digestion:       diesel for off-grid applications.
                                 40–80%              (biogas)         (biogas)
                                 Anaerobic           500–6,500        0.06–0.19
                                 digestion:          (landfill gas)   (landfill gas)
                                 50–90%              1,900–2,200      0.04–0.07
              Off-grid           Plant size:         500–6,500        0.06–0.24
*
Technology Market Niches System Capital Cost LCOE Technology and Operational
Characteristics (USD/kW) (USD/kWh) Considerations
CSP Utility-scale Plant size: 3,100–7,300 0.19–0.38 Commercial deployment is still in its
10–250 MW With With infancy. Capital costs are high, especially
Capacity factor: storage: storage: when storage is added. However,
20–40% 7,100–9,800 0.12–0.37 generation costs with storage may be lower
35–75% given increased electricity production. CSP
(with storage) also adds flexibility to the grid. Greater
operational experience, economies of
scale, learning curves, etc. may lower costs
in the future.
Marine Utility-scale Tidal range: Tidal range: Tidal range: Of the five technologies under
Plant size: 5,290–5,870 0.21–0.28 development (tidal power, tidal currents,
250 MW salinity gradients), none has been widely
Capacity factor: deployed yet. Yet great potential exists and
23–29% numerous demonstration projects have
been or soon will be deployed.
Wind Utility-scale Turbine size: 1.5– 925–1,950 0.04–0.16 Onshore wind LCOE is competitive with
onshore 3.5 MW fossil fuels. Operational costs of offshore
Capacity factor: wind are high due to difficulties of the
25–40% offshore environment. Higher capital costs
Utility-scale Turbine size: 4,500–5,500 0.15–0.23 of offshore wind are somewhat offset by
offshore 1.5–7.5 MW higher generating capacities achieved. Off-
Capacity factor: grid wind turbines can be coupled with
35–45% diesel generators, batteries, or other
Off-grid Turbine size:Some of these strategies require minimal investment and should be adopted before more-expensive strategies are undertaken. In many instances, utility engineers have been surprised to discover that existing power systems are more resilient and adaptable than expected. Less-robust electricity systems with fewer connections to other grids present more challenges, but these are hardly insurmountable. While the challenges of increasing wind and solar generation are dependent on the nature of the renewable supply and electricity demand, as well as on the flexibility of the power system, studies on the experiences of power systems around the world have provided best practices that can be applied elsewhere. Denmark, Ireland, Germany, Portugal, Spain, Sweden, and the United Kingdom all have had renewable energy exceed 5–10% of annual generation without technical issues.29 This is possible as long as local concentrations of variable renewable energy generation are avoided, renewable energy plants contribute to stabilizing the grid when needed, and short-term forecasting is used effectively.30 The capacity of the current grid to deal with variability in electricity demand and the possibility of outages can be used to handle the variability and uncertainty of wind and/or solar power generation at these levels. Integrating large shares of wind and/or solar power requires more significant investments, and a system-wide transformation is recommended to minimize total system costs.31 When renewable energy is deployed, it should take into account the long-term development of the whole system, including future transmission infrastructure plans and synergies with other energy sources. In addition, wind and solar systems can be operated in a way that provides short-term grid stability and when needed can be curtailed to avoid moments of extreme variability.32 System and market operations can be improved through the adoption of short-term power markets (such as nodal pricing in the Electric Reliability Council of Texas (ERCOT) or power delivery contracts in Germany), system service markets that value flexibility, renewable energy production forecasts, and cooperation with nearby service areas.33 In systems with high growth in demand that require significant investments in the short term, such as those of emerging economies in Latin America, deployment of high levels of wind and solar power can be carried out in line with grid expansions, thereby avoiding putting existing generators under economic stress. However, these systems usually do not enjoy the flexibility provided by a larger existing asset base, so long-term investment plans that consider additional system flexibility are important. The growing importance of solar and wind power is propelling a growing interest in energy storage technologies that can help address the variability challenge. With the exception of pumped hydropower, which is used for storage in some regions, storing electricity has tended to be too expensive for widespread use. However, recent advances in a range of battery technologies have convinced many experts that storage will soon be affordable, with much of it likely to be located close to customers. The batteries in growing fleets of plug-in hybrid-electric vehicles may provide a portion of this storage. 1.4 Environmental Impacts and Sustainable Development All energy technologies have impacts on the environment, and the ability to mitigate many of those impacts is one of the main advantages of renewable energy. Fossil fuel-fired power plants are a major contributor to local air pollution and are responsible for an estimated 7 million premature deaths each year.34 They are also the largest single source of greenhouse gas emissions, which are projected to grow rapidly in coming decades, with all of that growth centered in developing countries. By contrast, most renewable technologies produce negligible emissions, which are offset quickly via reduced fossil fuel pollution over their operating lives. Their consumption of water, another limited resource, also tends to be much lower.35 STUDY ON THE DEVELOPMENT OF THE RENEWABLE ENERGY MARKET IN LATIN AMERICA AND THE CARIBBEAN 12 UNDER THE IDB CLIMATE CHANGE EVALUATION
Renewable energy sources do have some unique environmental impacts, but these are largely local and can be
integrated via careful planning and the application of proven mitigation strategies. Government regulation is
generally needed to ensure that companies do not take shortcuts in order to lower costs. Wind power, for
example, can put birds at risk of striking the turbine blades, which is minimized via careful siting and the
installation of devices that warn birds about the turbines. Large solar installations can be hazardous to some
land animals, requiring environmental impact assessments to determine the potential project impacts.

Both geothermal power and solar cell production can release toxic chemicals with potential health effects.
China, for example, has reported instances of solar manufacturers dumping dangerous chemicals into nearby
waterways, provoking a crackdown by local authorities.36 To avoid this, the chemicals must be contained and
then either recycled, destroyed, or safely sequestered.

Biomass power can threaten soil health and biodiversity, depending on the feedstock used and how it is
harvested. When using forestry or agricultural waste, sufficient crop residues should be left behind to improve
carbon storage, maintain nutrient levels, and prevent erosion. Energy crops present higher land-use impacts,
but using sustainable agriculture practices can improve efficiency of land use and soil health.37 Hydropower is
also often limited by environmental factors: for example, large dams have flooded vast swaths of land,
destroying biodiversity and requiring the relocation of millions of people. Most hydro development in
industrial countries has been stopped, and in developing countries, long and bitter struggles have emerged
over many hydro projects. In most cases, small hydropower stations do not require large impoundments,
limiting their environmental impact.

Renewable power technologies can be used for sustainable development as well, to provide electricity to some
of the 1.3 billion people who currently lack such access.38 This is one of the three goals of the United Nations’
Sustainable Energy for All (SE4ALL) initiative, which is aimed at ending energy poverty by 2030.39 Many of the
people without access to electricity live in areas that are too remote or inaccessible to be reached by
traditional electricity grids. Although diesel generators have provided power in some areas, renewables offer a
more economical alternative in many cases. In some locations, such as parts of Africa and South Asia, small
solar panels are sufficient to run lights and power mobile phones, producing enough power to make
meaningful improvements in people’s lives.

In recent years, attention has turned to the development of “micro-grids” to provide electricity in islands or
remote regions where grid extension is possible. Small hydropower has been used in this way for decades, but
most of the power for existing micro-grids comes from diesel generators, which typically cost several times as
much as grid electricity. Thousands of these micro-grids could be made more affordable by replacing diesel
generators with a combination of renewable technologies, with the mix varying depending on resource
availability. In such a configuration, the diesel units would be retained mainly for backup power, saving fuel
and reducing the overall cost of electricity. In other areas, new micro-grids can be built from scratch. In both
cases, modern electronic controls facilitate the use of multiple power sources, ensuring increased reliability
and cost savings compared with the systems in place today.

The last decade has seen dramatic growth in renewable energy markets, the proliferation of support policies,
and significant cost reductions in renewable technologies across the world. Already, investments in renewable
energy are shifting to new markets in Asia, Latin America, the Middle East, and Africa. Still, significant
opportunities for future development in these markets remain and are expected to attract further investment.

STUDY ON THE DEVELOPMENT OF THE RENEWABLE ENERGY MARKET IN LATIN AMERICA AND THE CARIBBEAN                    13
UNDER THE IDB CLIMATE CHANGE EVALUATION
2       Renewable Energy in Latin America and the Caribbean

Latin America and the Caribbean is a very diverse region, with economies of varying sizes. The two largest
economies, Brazil and Mexico, drive many of the regional trends, masking some of the developments in the
power sector that require individual analysis. This chapter provides an overview of the power sector in Latin
America and the Caribbean and of the development of renewable energy in the region to date.

The chapter orders the 26 borrowing members of the Inter-American Development Bank geographically, from
north to south, into: Mexico, Central America (Belize, Costa Rica, El Salvador, Guatemala, Honduras, Nicaragua,
and Panama), the Caribbean (Bahamas, Barbados, Dominican Republic, Guyana, Haiti, Jamaica, Suriname, and
Trinidad and Tobago), the Andean Zone (Bolivia, Colombia, Ecuador, Peru, and Venezuela), Brazil, and the
Southern Cone (Argentina, Chile, Paraguay, and Uruguay). Unless otherwise specified, the data presented here
include only the 26 countries in the region.

2.1     Introduction to the Electricity Sector in the Region
Brazil accounts for the majority of the installed power capacity in Latin America and the Caribbean (37%), while
Mexico, the Andean Zone, and the Southern Cone each represent about a fifth, and Central America and the
Caribbean represent 4% and 3%, respectively.1 (See Figure 2.1.)

                   FIGURE 2.1 Share of Installed Power Capacity in IDB Member Countries,
                                            by Sub-region, 2013

                                                                           Mexico
                                          19%                              Central America
                                19%
                                                 4%                        Caribbean
                                                 3%
                                           18%                             Andean Zone
                              37%
                                                                           Brazil
                                                                           Southern Cone

             * Note: Share is out of total installed power capacity of 327 GW in 26 IDB countries.
                                                                                                     Source: MIF and BNEF

It is well known that electricity production and consumption are correlated positively with economic growth.
Over the last 20 years, average economic and electricity growth in Latin America and the Caribbean have
exceeded the global average. Electricity production has more than doubled, from 609 Terawatt-hours (TWh) in
1991 to 1,379 TWh in 2011, representing average growth of 4.4% per year.2 (See Figure 2.2.) This sustained
growth trajectory coincided with the economic recovery of the 1990s. 3 Even during the recent global
recession, the region enjoyed strong economic growth—averaging 3.8% annually over the last decade—a level
that is expected to continue into the foreseeable future.4

STUDY ON THE DEVELOPMENT OF THE RENEWABLE ENERGY MARKET IN LATIN AMERICA AND THE CARIBBEAN                                  14
UNDER THE IDB CLIMATE CHANGE EVALUATION
FIGURE 2.2 Electricity Production in IDB Member Countries,
1990–2011
1400
1200
1000
800
TWh
600
400
200
0
1990 1992 1994 1996 1998 2000 2002 2004 2006 2008 2010
Source: U.S. EIA
In the 1970s, Brazil had the highest growth in electricity consumption in the region, averaging 12%, but this
rate has decreased significantly in the last two decades. Mexico has followed a similar trend. Meanwhile,
Central America, the Caribbean, the Andean Zone, and the Southern Cone experienced a sharp increase in
electricity consumption in the 1990s, which has continued for the Andean Zone in the last decade. The
Caribbean saw the largest change in electricity consumption growth in the last two decades.5 (See Figure 2.3.)
FIGURE 2.3 Growth in Electricity Consumption in IDB Member Countries,
by Sub-region, 1990–2000 and 2001–2011
7%
1990-2000
6%
2001-2011
5%
4%
3%
2%
1%
0%
Central Mexico Caribbean Andean Zone Brazil Southern Latin America
America Cone
Source: U.S. EIA
Generally, as economies grow, there is a positive correlation between growth in GDP per capita and growth in
power consumption per capita. This trend is more noticeable in developing economies, such as those of Latin
America and the Caribbean, than in developed nations, due in part to lower levels of energy efficiency, growing
use of electric appliances, and increases in electricity access. The population of Latin America and the
Caribbean is forecast to grow by 0.85% annually over the next 20 years, while the economies of the region are
expected to expand by 3% a year on average.6 Meeting this growing demand will require nearly doubling the
region’s combined electricity generation capacity from 1,379 TWh in 2011 to 2,500 TWh in 2030.7
STUDY ON THE DEVELOPMENT OF THE RENEWABLE ENERGY MARKET IN LATIN AMERICA AND THE CARIBBEAN 15
UNDER THE IDB CLIMATE CHANGE EVALUATIONThis immense growth in energy consumption is tied to increased access to electricity in the region. In 1970,
only half of Latin America and the Caribbean’s 275 million people had access to electricity.8 By 2013, the
region, with a population of 590 million people, boasted an 88% electrification rate, and 17 of the 26 countries
had electrification rates at or above the average.9 An estimated 34 million people in the region still lack access
to electricity, over 8 million of whom live in Haiti.10 (See Figure 2.4.)
FIGURE 2.4 Electricity Access in IDB Member Countries, 2012
100%
90%
80%
70%
60%
50%
40%
30%
20%
10%
0%
Source: MIF and BNEF
On a sub-regional basis, Brazil, Mexico, and the Southern Cone have close-to-universal electricity access.
However, the size of Brazil and Mexico’s populations is reflected in the amount of people without access in
each country: 3.4 million and 2.4 million, respectively.11 In the Andean Zone, Bolivia and Peru are the outliers
with access rates of 78% and 86%, and 2.3 million and 4.3 million people without electricity, respectively.12
Central America as a whole has the highest number of countries at or below the regional average, including
Honduras, Nicaragua, Guatemala, El Salvador, and Panama, which together are home to just over 8 million
people without access.13 The largest outlier in the Caribbean and in the region as a whole is Haiti, with only
15% electricity coverage and 8.6 million people without access.14 (See Figure 2.5.)
FIGURE 2.5 Population Without Access to Electricity in IDB Member
Countries, by Sub-region, 2012
10.0
8.0
Million People
6.0
4.0
2.0
0.0
Central Mexico Caribbean Andean Zone Brazil Southern
America Cone
Source: MIF and BNEF
STUDY ON THE DEVELOPMENT OF THE RENEWABLE ENERGY MARKET IN LATIN AMERICA AND THE CARIBBEAN 16
UNDER THE IDB CLIMATE CHANGE EVALUATIONAccess to electricity is not the only challenge, however, as the region faces serious grid reliability and stability
challenges, which translate to significant economic losses to the system. On average, system losses, which
include losses during transmission between sources of supply and points of distribution and during the
distribution to consumers, reached 15% of total power output, or 1,379 TWh, in 2011—almost twice the world
average. 15 (See Figure 2.6.) As with electricity access, power losses vary significantly by country, yet improving
transmission and distribution systems as a region could contribute to meeting the growing energy demand.
FIGURE 2.6 Electric Power Transmission and Distribution Losses
in IDB Member Countries, 2011
60%
50%
Percent Losses
40%
30%
20%
10%
0%
Source: World Bank
Currently, electricity and heat generation is the largest global contributor to greenhouse gas emissions; as a
region, however, Latin America and the Caribbean has the world’s greenest electricity mix (in terms of carbon
intensity).16 This is due primarily to its large hydropower development, which has been the biggest source of
electricity generation since the 1970s and currently makes up 51% (small and large hydro) of total installed
generating capacity.17 However, the share of electricity from hydro has been declining over the last decade, a
trend that is expected to continue with the development of natural gas and renewable resources. Overall, the
role of fossil fuels in the region has changed over time, with fuel oil being replaced slowly by natural gas, while
coal use remains consistently low.18 (See Figure 2.7.)
This trend is especially true for Mexico, Brazil, and the Southern Cone (Chile and Argentina), although Brazil
remains heavily dominated by hydro. Nevertheless, oil use for power generation in the Caribbean and Central
America continues to be significant. While the Caribbean’s electricity mix has remained relatively stable over
the past three decades, Central America’s mix has changed with the introduction of coal in Costa Rica and the
recent development of renewables throughout the sub-region. The Andean Zone has experienced little change
in its electricity mix, with a slight decrease in natural gas and oil, accompanied by an increase in hydropower.19
STUDY ON THE DEVELOPMENT OF THE RENEWABLE ENERGY MARKET IN LATIN AMERICA AND THE CARIBBEAN 17
UNDER THE IDB CLIMATE CHANGE EVALUATIONYou can also read