Lopez Village Subarea Plan - February 22, 2017 - Preliminary Draft - San Juan County
←
→
Page content transcription
If your browser does not render page correctly, please read the page content below
Lopez Village
Subarea Plan
February 22, 2017 - Preliminary Draft
Acknowledgements
The Lopez Village Subarea Plan, along with its companion development regulations and standard details
were adopted by the San Juan County Council on _________, 2018 in Ordinance __-2018.

The Lopez Village Planning and Review Committee was established by the County Council in Resolution No.
34-2013 to help the community develop this subarea plan for the Lopez Village Urban Growth Area. This
Committee advised the staff, Planning Commission and County Council on the development of the Lopez
Village Subarea Plan and the regulations and standards needed to implement it. Thank you to this very
dedicated Committee and the community partners and staff who were instrumental in the creation of this
Plan.

 Lopez Village Planning and
 Review Committee             Annie Albritton

                              Sandy Bishop

                              Nancy Greene

                              Madrona Murphy

                              Dennis Ryan

                              Barbara Thomas, Chair
 San Juan County
                              Councilman Jamie Stephens

                              Linda Kuller, Planning Manager

                              Shannon Wilbur, Sr. Project Engineer

                              John Cook, Engineering Technician

                              Jacob Heinen, Engineering Technician

                              Colleen Brennan, Engineering Technician

                              Stephanie O’Conner, Engineering Technician

    Dedication: This Plan is dedicated to Dan Drahn in recognition of his long standing and extensive
       contributions to Lopez Village planning. Dan’s expertise and positive attitude influenced the
 development of this plan. He was committed to his beloved community and ensuring that the plan would
                       create a better, more livable place for generations to come.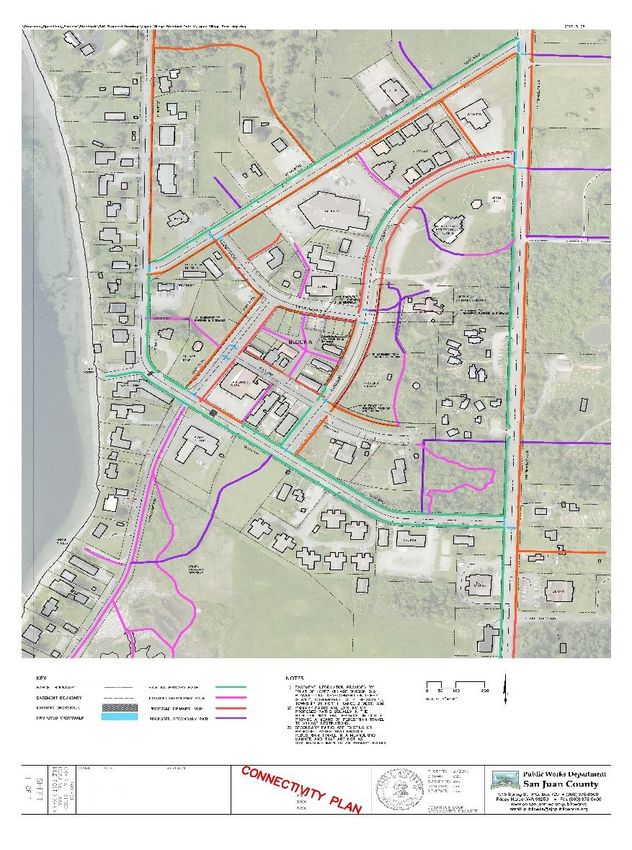
Authority
The Lopez Village Urban Growth Area Subarea Plan is adopted pursuant to San Juan County Code (SJCC)
 18.30.190 and 18.90.050 and in accordance with with Article 11 of the Washington State Constitution;
Chapter 43.21C RCW (State Environmental Policy Act); Chapter 90.58 (including without limitation RCW
   90.58.340) (Shoreline Management Act); Chapter 36.70 RCW (Planning Enabling Act); and Chapter
                              36.70A RCW (Growth Management Act).

                                  Growth Management Act (GMA)
   This plan is adopted pursuant to the GMA and its fourteen planning goals (Appendix A) that help
Washington State communities plan in a coordinated fashion to protect the public’s health, safety and
  welfare. Under the GMA, the subarea plan must be consistent with and supportive of the San Juan
County Comprehensive Plan (Plan), county-wide planning policies, development regulations and capital
  budgets. Also, GMA requires that public facilities and services be developed concurrently with the
           development that they serve to ensure alignment with adopted levels of service.

                                               Applicability
 The Lopez Village Subarea Plan supplements the goals and policies of the Plan. It shall apply to all land,
land use activity, and to all structures and facilities developed within the official map of the Village. The
   provisions of the Lopez Village Plan shall prevail over any conflicting provision of the Plan except as
provided in Shoreline Master Program (SMP) section below. All other provisions of the Plan shall retain
                                          their full force and effect.
Regulations to implement the goals and policies of the Lopez Village Subarea Plan will be contained in
the San Juan County Code (SJCC) Title 18, Unified Development Code (UDC). The UDC regulations will
       apply except as suprceded by specific regulations adopted for the Lopez Village Subarea

                                               Official Maps
    This subarea plan includes map(s) which shall be known as the Lopez Village Subarea Plan official
     map(s). These map(s) shall consist of the original official map adopted by Ordinance No. 9-2005
including any subsequent amendments adopted pursuant to SJCC 18.90.020 and 18.90.050. The official
    maps may delineate land use districts, public facilities, recreation, open area, and transportation
 facilities. The official maps shall be amended in the same manner as other official maps of the Plan, as
                            provided by SJCC 18.10.040, 18.90.020 and 18.90.050.

                                            Plan Amendments
       Subarea plan amendments shall be processed using the procedures in SJCC Chapter 18.90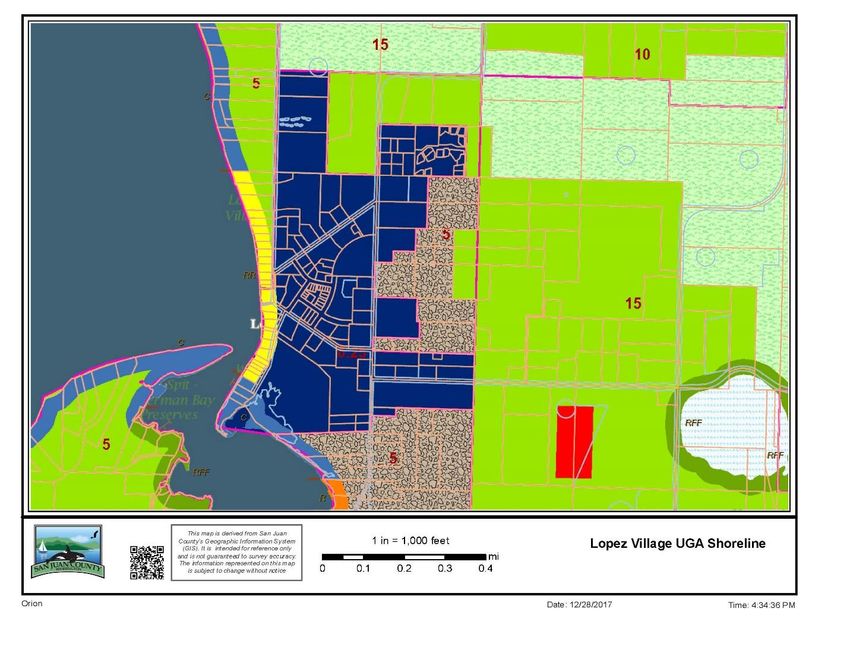
Table of Contents

                              The TOC will be corrected when the next draft is produced.
Introduction.............................................................................................................................................

Setting......................................................................................................................................................

Relationship to Other Local Plans and Land Use Regulations..................................................................

Subarea Plan Purpose...............................................................................................................................

Relationship Example: Vision, Goals, Policies, Code and Implementation Plan.............................
Amendments.............................................................................................................................................

Planning History - Lopez Village Non-municipal Urban Growth Area………………………….………….
Lopez Village Planning and Review Committee........................................................................................

Maximum Density and Density Bonus………………………………………………………………………..……………
.
Growth Reserve Areas……………………………………………………………………………………………………..……….

Past Community Planning Efforts………………………………………………………………….……

Community Characteristics.......................................................................................................................

Population Projections................................................................................................................................

Population Allocation in Urban Growth Areas.....................................................................................
Past Projection.........................................................................................................................................
1990 - 2016 San Juan County Population Distribution...............................................................................

SJC Comprehensive Plan Update 2036 Projection………………………………………………………………………………..

Lopez Village Population Projection - Proportionate Share of the Lopez Island Population……..

2010 – 2017 Permit Data……………………………………………………………………………………………………

Demographic Snapshots

XXXXXX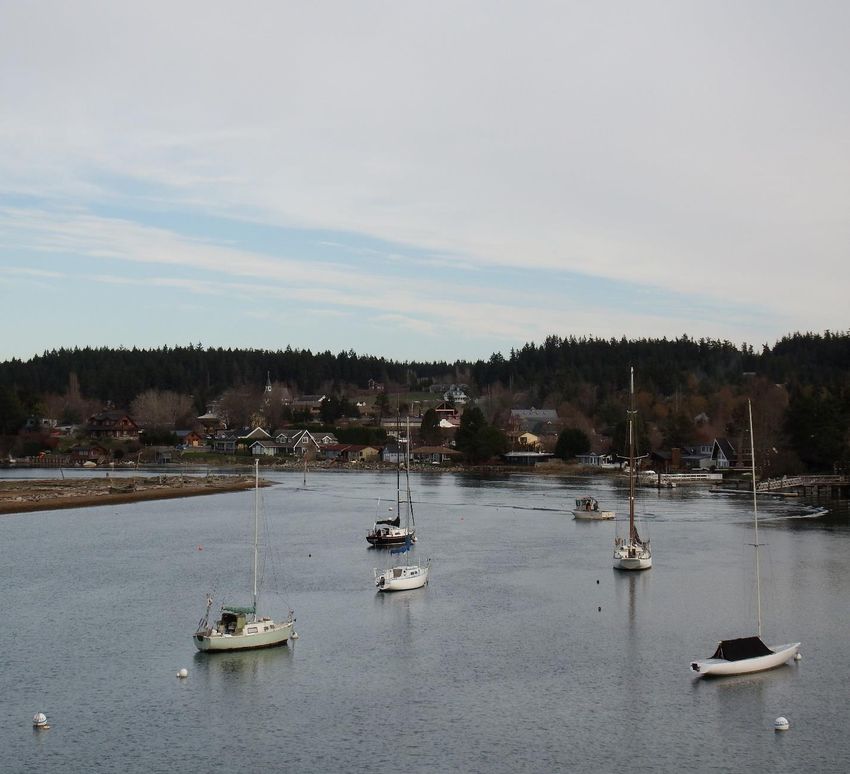
Physical Setting and Environmental Characteristics

Natural Resources.....................................................................................................................................

Built Environment and Sense of Place........................................................................................................

Land Use.....................................................................................................................................................

Housing.......................................................................................................................................................

Transportation............................................................................................................................................

Pedestrian and Bicycle Facilities…………………………………………………………………………………………………………….

Connectivity………………...............................................................................................................................

Public Spaces..............................................................................................................................................

Parking.......................................................................................................................................................

Capital Facilities

Water Systems……………………………………………………………………………………………………………………………………..

Sewage Systems………………………………………………………………………………………………………………………………….

Solid Waste System……………………………………………………………………………………………………………………….……

Stormwater System..................................................................................................................................

Government Administration l.................................................................................................................

Law Enforcement.....................................................................................................................................

Fire Protection.........................................................................................................................................

Emergency Medical Services....................................................................................................................

Health Care………………………………………………………………………………………………………………..…………………….

Lopez Island School District....................................................................................................................

Lopez Library...........................................................................................................................................

Museum..................................................................................................................................................

Senior Center...........................................................................................................................................

Chamber of Commerce............................................................................................................................

Community Center……………………………………….........................................................................................

Art and Culture........................................................................................................................................

Electricity.............................................................................................................................................
Telephone Service................................................................................................................................

Economics

Healthy Community

Goals and Policies

           Healthy Community .............................................................................................................

           Natural Systems and Habitat.................................................................................................

           Open Space, Natural and Scenic Resources...........................................................................

           Open Space and Viewsheds………………………………………………………………………………………….…..

           Land Use................................................................................................................................

           Built Environment.................................................................................................................

           Landscaping..........................................................................................................................

           Housing..................................................................................................................................

          Transportation.......................................................................................................................

                       Connectivity and Non-motorized Transportation…………………………………….…………..

                       Parking....................................................................................................................

           Capital Facilities...................................................................................................................

                       General....................................................................................................................

                                    Parks and Recreation..................................................................................

                                    Library…………………………………………………………………………………………………….

                                    Fire and Emergency Management Services................................................

                                    Utilities.......................................................................................................

                                    Stormwater………………………………………………………………………………………..…..

                                    Economic Development...............................................................................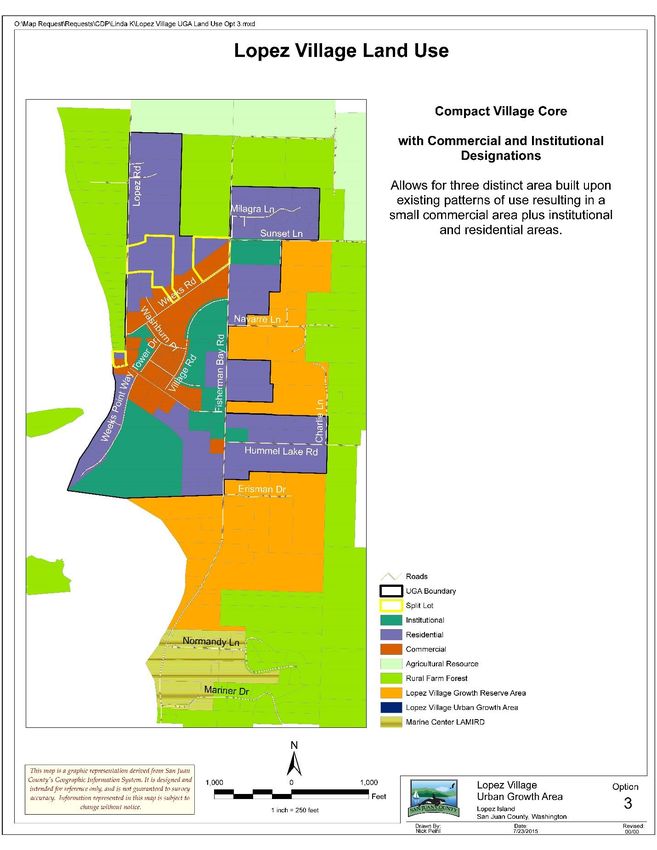
List of Figures

Figure 1. Lopez Village population growth 2000-2016......................................................................
Figure 2. 2016 Urban growth areas: percent of County population……………………………………………….
Figure 3. Lopez Village growth: stable proportionate share of island population…………………………..
Figure 4. Marital status………………………………………………………………………………………………………………….
Figure 5. Population by household type………………………………………………………………………………………..
Figure 6. Lopez island population by age……………………………………………………………………………………...
Figure 7. Lopez Island gender, race and etnicity…………………………………………………………………………….
Figure 8. Geographical mobility………………………………………………………………………………………………….….
Figure 9. Per capita income and and median household income comparisons…………………….…………
Figure 10. County and Lopez Island household income comparisons………………………………………….…
Figure 11. Comparisons of persons below the poverty rate…………………………………………………………….
Figure 12. Transportation to work…………………………………………………………………………………………………..
Figure 13. Population Migration……………………………………………………………………………………………………..
Figure 14. Educational attainment………………………………………………………………………………………………….
Figure 15. Population by minimum level of education…………………………………………………………………..
Figure 16. Comparisons of persons with language other than English spoken at home………………….
Figure 17. Lopez Fire district 4: 2016 Call percentage……………………………………………………………………….

List of Tables

Table 1. San Juan County population distribution 1990-2016. ..............................................................
Table 2. Residential Permits in Lopez Island and Lopez Village UGA 2010-2016…………………………….…..
Table 3. Lopez Village UGA 2016-2040 population forecast: proportionate share of State……………..….
Table 4. Residential permits in Lopez Island and Lopez Village urban growth area 2010-2017……………
Table 5. New residents and residences in Lopez Island and Lopez Village UGA 2010 – 2016………….….
Table 6. Lopez Village urban growth area present and potential development…………………………………..
Table 7. 2010 San Juan County housing inventory by island………………………………………………………………..
Table 8. Lopez Island low income housing inventory…………………………………………………………………………..
Table 9. 2036 San Juan County population and housing unit projections……………………………………………
Table 10. 2010 Analysis of parking in Lopez Village urban growth area………………………………………………..
Table 11. Group A community water systems in Lopez Village…………………………………………………………….
Table 12. 2017 community sewage treatment facilities………………………………………………………………………
Table 13. 2017 San Juan County solid waste facilities………………………………………………………………………….
Table 14. Lopez Island Fire District 4: stations……………………………………………………………………………………..
Table 15. Lopez Island Fire District 4: equipment detail…………………………………………………………………………
Table 16. Lopez Island Fire District 4: calls 2008 – X………………………………………………………………………………
Table 17. 2016 Lopez Fire Protection District rating: Washington Survey and Rating Bureau……………...
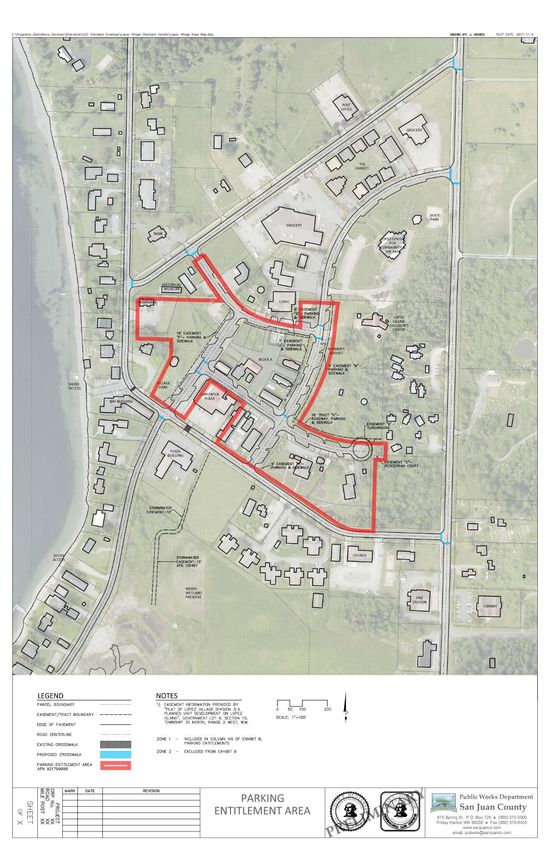
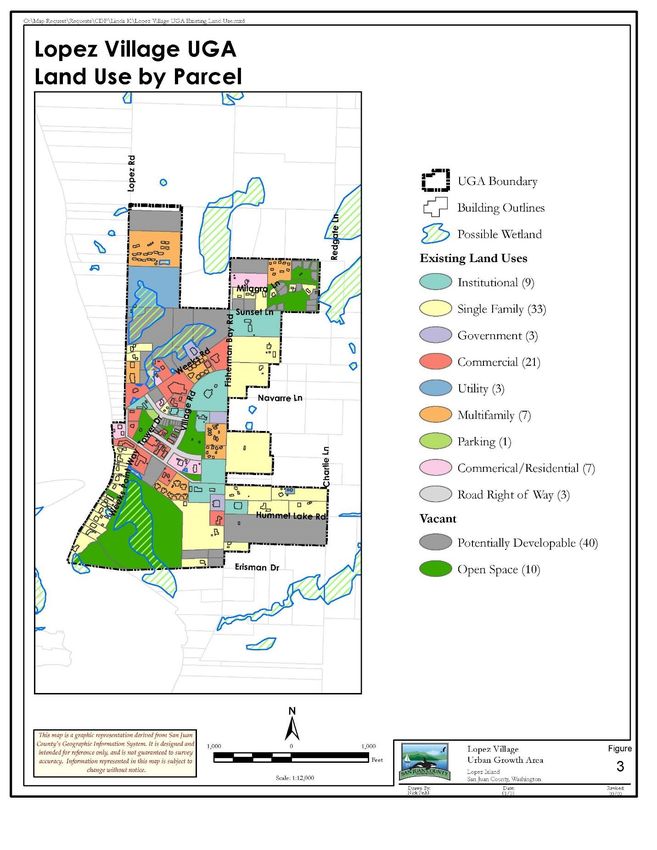
List of Maps

Map 1. Lopez Village urban growth area..................................................................................................
Map 2. Lopez Shoreline Master Program designations…………………………………………………………………………
Map 3. Lopez Village urban growth area existing Land use by parcel…………………………………………………...
Map 4. Lopez Village urban Growth area land use map………………………………………………………………………..
Map 5. Lopez Village connectivity map…………………………………………………………………………………………………
Map 6. Parking entitlement area………………………………………………………………………………………………………
LOPEZ VILLAGE VISION
         Lopez Village is on the mouth of Fisherman Bay and is the social and commercial core of the Island
                                                where local matters.

                  The Village provides opportunities for a sustainable quality of life within a friendly and
                                             responsible community setting.

                       Natural systems which support the Village are thoughtfully cared for and valued.

                                              THESE CORE VALUES ENVISION THE CREATION OF:

   A sustainable, climate resilient village with                                     An inviting, distinctive sense of place based on the
    ecological integrity attuned to long-term                                     intrinsic qualities of our natural and built environment,
stewardship of its natural context, very protective                                   valued historic and cultural assets, unique local
   of Fisherman Bay, and that treasures rural                                           character, and commitment to beauty, hand
           tranquility and night skies.                                             craftsmanship, and human scaled design including
                                                                                  sustainable building practices and energy conservation.
 A viable, innovative, and diverse economy with                                   A vital, healthy community that fosters equity, diversity,
employment opportunities, stable businesses, and                                    and aging in place, and values local engagement in
        services for residents and visitors.                                       shaping Village development to achieve a high overall
                                                                                                       quality of life.

A well connected mobility framework network for                                   A livable village, with a range of services and uses where
 pedestrians, bicycles, transit, and automobiles.                                  residents and visitors live, work, shop and socialize in a
                                                                                     safe, attractive, walkable and healthy environment.

   N:\LAND USE\LONG RANGE PROJECTS\PCOMPL-14-0002 Lopez Village Plan\2017 DRAFT_PLAN_CODE_STANDARDS_MAPS\Lopez Village Plan\2018-02-22_Draft Subarea Plan.docx
                                                                                                                                                                 10
1. INTRODUCTION
Setting
Lopez Island is the third largest island in San Juan County’s collection of islands in Puget Sound Washington. It
consists of approximately 30 square miles of natural beauty and a predominately rural landscape. It is the
County’s second largest unincorporated community. Still, it is a small community including about 2,466
permanent residents in 2016.
The Lopez Village urban growth area includes approximately X (466?) acres on the western side of Lopez Island.
The Village’s western boundary is almost exclusively identified by the shoreline of Fisherman Bay. The eastern
boundary extends in a north/south alignment that encompasses parcels on the eastern side of Fisherman Bay
Road. Lopez Village is about 1.6 miles in length and a half mile wide.
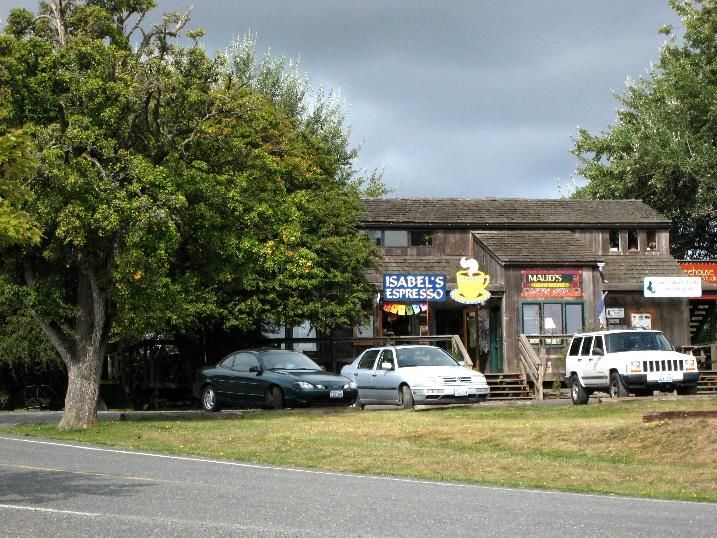
Lopez Village is presently characterized with a mix of commercial, institutional and residential uses and open
space. Its identity and appeal draws on its splendid views and setting, a classic but under-realized street grid,
small-scale buildings with some fine, local details and history of being the cultural and social center for the
island.
Relationship to Other Local Plans and Land Use Regulations
San Juan County Comprehensive Plan (Plan)
Subarea plans are developed under the provisions of the GMA, provided that such plans are consistent with
the Plan which addresses the GMA’s planning goals. These goals address urban growth, sprawl, transportation,
housing, economic development, property rights, permits, natural resource industries, open space and
recreation, environment, citizen participation and coordination, public facilities and services, and historic
preservation.
Of particular importance in subarea planning are the goals designed to encourage compact development in
areas where adequate public facilities exist or can be provided efficiently. The development of this subarea
plan is consistent with Section B, Element 2 Land Use of the Plan including the overall goal for Growth Areas
(Appendix B).
Subarea Plan Purpose
The purpose of the Lopez Village Subarea Plan is to guide future development in the Lopez Village urban growth
area by establishing a vision, and goals and policies that will guide growth consistent with the desires and
wishes of the island residents. The community is committed to making the Village a compact place of future
urban growth and preserving the character of the overall island for agriculture and related uses.
The community’s vision statement paints a picture of how the community might look, function and thrive in
the future. It provides the framework for developing goals and policies that will be tools for decision-making.
The Subarea Plan is intended to guide the actions of the community and County decision-makers. To further
implement the Subarea Plan, the County will adopt consistent development regulations and standard plans to
support the community’s image of their future.
This Subarea Plan will provide locally determined and ongoing guidance for the growth of the Village that will
enhance the vitality and livability of Lopez Island. It is intended to meet the requirements of the Washington
State Growth Management Act (GMA) and be integrated with other relevant plans.
N:\LAND USE\LONG RANGE PROJECTS\PCOMPL-14-0002 Lopez Village Plan\2017 DRAFT_PLAN_CODE_STANDARDS_MAPS\Lopez Village Plan\2018-02-22_Draft Subarea Plan.docx
11It will:
1. Assure that Lopez Island residents and stakeholders play a dynamic role in defining the future character
of the Village;
2. Provide a tangible community vision for growth and development so that the qualities that define its
character and give it value as a place to live and work are not compromised;
3. Identify, conserve, and enhance the character and qualities that contribute to people's enjoyment of
the Village and that support its functions as the rural Island’s primary commercial, service, residential
and cultural core;
4. Provide land use and development goals and policies which add to and are more specific than those
contained in the San Juan County Comprehensive Plan (Plan);
5. Anticipate and identify the tools and resources needed to manage growth and change in the Village;
6. Develop action agendas to ensure that growth will not exceed the planned capacity of infrastructure
and public services; and
7. Provide guidance for the adoption of specific development regulations and design standards needed
to implement the community’s vision of future land use patterns and development.
Relationship Example: Vision, Goals, Policies, Code and Implementation Plan
Vision: A village that treasures rural tranquility and night skies;
Goal: Develop night lighting standards that will minimize light pollution and facilitate
viewing of the stunning starry night sky.
Policy: Adopt dark sky regulations based on the L-1 lighting regulations from the most
current Joint IDA-IES Model Lighting Ordinance.
Code: Tailor model night lighting requirements to Village needs.
Implementation: Provide technical bulletin and public education on Village lighting standards.
Planning History - Lopez Village Non-municipal Urban Growth Area
In 1978, San Juan County adopted its first comprehensive land use plan to address critical land use issues. The
San Juan County Comprehensive Plan (Plan) addressed the protection of the rural character and natural
environment of the islands and guided growth and development in the County.
In 1998, the Plan was updated and adopted under the Washington State Growth Management Act (GMA). To
address GMA goals, this plan encouraged higher density residential and mixed use development in growth
areas to prevent sprawl, protect natural resources and relieve development pressures that threaten rural
character. In this Plan, Lopez Village (Village) was designated a Village Activity Center.
In 2000, the Village was re-designated as an interim Urban Growth Area (UGA) in Ordinance No. 11-2000 as a
viable alternative to address affordable housing and achieve compliance with the rural element of the GMA.
The interim UGA encompassed 466 acres of land and around 230 parcels. This interim designation was
intended to preserve the natural beauty of the island by allowing the creation of a concentrated development
pattern in the Village.
The adoption of the interim Village UGA was appealed to the Washington State Growth Management Hearings
Board (Board). In May 2001, the Board issued a decision finding the Village UGA out of compliance with the
N:\LAND USE\LONG RANGE PROJECTS\PCOMPL-14-0002 Lopez Village Plan\2017 DRAFT_PLAN_CODE_STANDARDS_MAPS\Lopez Village Plan\2018-02-22_Draft Subarea Plan.docx
12GMA. The Board required that the UGA boundaries be established using the criteria in RCW 37.70A.110 and
that non-municipal UGA boundaries be established after the completion of an urban capital facilities and
service analysis. Sewer, drainage and traffic facilities, water availability and saltwater intrusion issues were
studied.
The availability of water service needed to accommodate a growing population was a key factor in determining
the 2005 UGA boundaries. As a result of these studies and population projections and capital facilities studies,
the UGA boundaries were reduced in Ordinance No. 9-2005 to include 206 acres of land and approximately
146 parcels.
The entire Lopez Village Urban Growth Area was designated “Village Commercial” on the Plan’s official map.
This designation and its associated density regulations provide a basic level of land use control.
The UGA boundary was further revised in 2008 to exclude 3 parcels that were not served or likely to be served
by the Fisherman’s Bay Sewer District or one of the three water providers in the Village. The Village consists of
198 acres of land and 143 parcels. In 2008, non-residential development occupied 28 parcels and
approximately 35 acres. In 2008, 25 additional acres of developable land were projected as needed to meet
the demands for non-residential land use and 74 acres were projected to be needed to provide a sufficient
amount of developable land to meet projected growth.
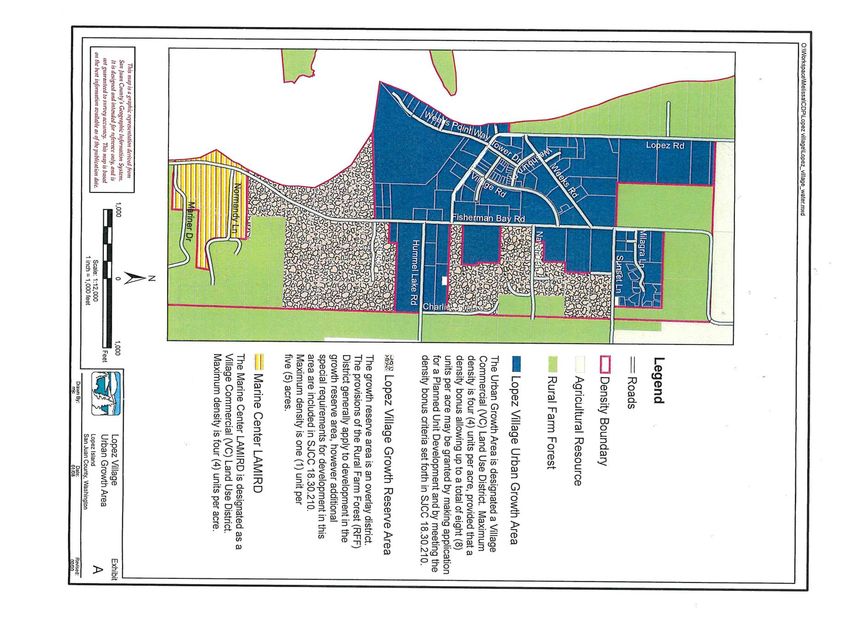
Maximum Density and Density Bonus
When adopted, the UGA established a maximum density for single family development in the Village of 4 units
per acre. A density bonus was established for developments that meet special criteria. A total of 8 units per
acre were allowed with a Planned Unit Development that met water conservation criteria and affordable
housing requirements. The density bonuses combined could provide a density bonus of four units per acre,
plus the underlying density of four units per acre for a maximum of eight dwelling units per acre.
Growth Reserve Areas
On its eastern border, two distinct Growth Reserve Areas (GRAs) (overlay districts) were established for
possible future inclusion in the Lopez Village UGA. Their inclusion in the UGA would be considered when growth
warrants it and appropriate provisions can be made for urban level services. A maximum density of 1 unit per
five acres is permitted in a GRA. These areas and other land surrounding the UGA are designated Rural Farm
Forest.
Past Community Planning Efforts
Lopez islanders have a long history of developing a vision of the Village’s future. These efforts a described in
Appendix C and were used as the foundation for creating this subarea plan.
N:\LAND USE\LONG RANGE PROJECTS\PCOMPL-14-0002 Lopez Village Plan\2017 DRAFT_PLAN_CODE_STANDARDS_MAPS\Lopez Village Plan\2018-02-22_Draft Subarea Plan.docx
13Community Characteristics
Population Projections
As the basis for its land use planning, the Growth Management Act requires counties to use a population
projection that is consistent with the projections of the Washington Office of Financial Management (OFM).
RCW 36.70A.115 states:
“Counties and cities that are required or choose to plan under RCW 36.70A.040 shall ensure
that, taken collectively, adoption of and amendments to their comprehensive plans and/or
development regulations provide sufficient capacity of land suitable for development
within their jurisdictions to accommodate their allocated housing and employment growth,
including the accommodation of, as appropriate, the medical, governmental, educational,
institutional, commercial, and industrial facilities related to such growth, as adopted in the
applicable countywide planning policies and consistent with the twenty-year population
forecast from the office of financial management.”
Population Allocation in Urban Growth Areas
The Growth Management Act requires that counties reduce sprawl and
“Encourage development in urban areas where adequate public facilities and services
exist or can be provided in an efficient manner” (RCW 36.70A.020 (1)).
It does not require a specific percentage of projected growth be allocated to urban growth areas. However,
the County’s urban growth area boundaries have been based on the premise that fifty percent of future
development on Orcas and Lopez Islands would occur within their urban growth areas. These areas provide
urban services and higher density housing options than rural areas.
Past Projection
In 2009, Appendix 1 of the Plan provided population projections, a build out analysis and land use inventories
for 2000-2025 based on a 20-year average annual population growth rate of 2.2 percent. The OFM’s estimate
of the 2010 population for San Juan Islands was significantly less than projected in the Plan (15,769 vs. 17,316).
1990 - 2016 San Juan County Population Distribution
Table X below shows that since 1990 Lopez Island’s population has steadily been 15 percent of the County’s
population. As shown in Figure X below, Lopez Village’s population grew 25 percent or approximately 34
residents between 2000 and 2016 or an average annual increase of approximately 1.55 percent. In the same
period, the population of Lopez Island increased thirteen percent or by 290 people, an average annual increase
of 0.83 percent.
Between 2000 and 2016, approximately 11.7 percent of Lopez islands total population increase occurred within
the Lopez Village urban growth area rather than the projected fifty percent. Sixteen years is a small sample
size; however, comparable data for earlier decades is not available.
N:\LAND USE\LONG RANGE PROJECTS\PCOMPL-14-0002 Lopez Village Plan\2017 DRAFT_PLAN_CODE_STANDARDS_MAPS\Lopez Village Plan\2018-02-22_Draft Subarea Plan.docx
14Table 1. San Juan County population distribution 1990-2016.
1990 % by 2000 % by 2010 % by 2016 % by
Island Population Island Population Island Population Island Population Island
San Juan 3,449 34% 4,783 34% 5,416 34% 5,566 34%
(unincorp.)
Orcas 3,195 32% 4,455 32% 5,220 33% 5,395 33%
Lopez 1,483 15% 2,176 15% 2,380 15% 2,466 15%
Shaw 163 2% 235 2% 238 2% 241 1%
Subtotal 8,290 82.61% 11,649 82.7% 13,254 84.1% 13,668 83.8%
(unincorp.)
Town of Friday 1,492 14.9% 2,020 14.3% 2,162 13.7% 2,250 13.8%
Harbor
Total Ferry 9,782 97.5% 13,669 97.09% 15,416 97.76% 15,912 97.54%
Served
Total Non- 253 2.60% 409 2.91% 347 2.20% 402 2.46%
Ferry-Served
TOTAL 10,035 100% 14,078 100% 15,769 100% 16,320 100%
Source: OFM Selected Islands Report (County Parts) September 21, 2016. 1990 data is from the OFM based on 1990 Census data.
Figure 1. Lopez Village population growth 2000-2016.
159 161 163 165 165 164 168 169 171 171
145 147 150 153 157
137 141
Source: OFM Small Areas Estimates-Unincorporated UGAs Sept. 2016 and OFM County GMA Population forecast 2012.
Table X provides a comparison between the number of building permits that have had final inspections on
Lopez Island and the number of new residents
N:\LAND USE\LONG RANGE PROJECTS\PCOMPL-14-0002 Lopez Village Plan\2017 DRAFT_PLAN_CODE_STANDARDS_MAPS\Lopez Village Plan\2018-02-22_Draft Subarea Plan.docx
15Figure 2. 2016 Urban growth areas: Percent of County Population.
The County includes small village service
Friday centers. Unlike other counties where
Harbor both population and economic activity
Unicorporated San 14% are concentrated in urban growth areas,
Juan County Eastsound
7% these areas house a relatively low
78%
proportion of each island’s population. In
Lopez 2010, percent of the Lopez Island
Village population and the County’s urban
1% growth areas accounted for
approximately twenty-two percent of the
County’s population and Lopez Village
was one percent of that total.
Source: OFM Small Area Estimates - Unincorporated UGA.
SJC Comprehensive Plan Update 2036 Projection
In 2017, the County selected a 2036 population projection based on its’ proportionate share of the State
population to use in its periodic update of the Plan. The projection was selected after the review of the most
recent OFM projections and U.S. Census and other data including the County’s share of Washington State’s
population. Since 1980, the County maintained an average 0.23 percent proportionate share of the State’s
growing population.
Because of the volatility of the County’s annual population changes compared to the relative dependability of
the County’s proportionate share of the State’s population, the County’s selected population projection is
based on its’ proportionate share of the State population. This projection is consistent with historic trends
over the past thirty-six years. It is the most statistically valid method of projection and falls between the OFM’s
medium and high population forecasts.
Lopez Village Population Projection - Proportionate Share of the Lopez Island Population
For the past twenty-six years, the County’s ferry served islands maintained consistent shares of the County’s
population. Population growth is allocated in Lopez Village urban growth area as a percentage of the Island’s
population rather than as a percentage of the County’s population growth. The allocation of the island’s
population growth to Lopez Village assumes that the percentage of Lopez islands’ population living in the
Village will remain constant over the next twenty years, a proportionate share projection. This model is
limited by the expectation that, as the Village grows, its relative weight to the island’s population will remain
the same.
The forecast in Table 4 and Figure 3 indicate that Lopez Village urban growth area currently contains 6.93
percent of the Lopez Island population. Under the proportionate share of the Lopez Island population method,
the Lopez Village urban growth area population is expected to become 204 people in 2036 and sixteen
household units.
N:\LAND USE\LONG RANGE PROJECTS\PCOMPL-14-0002 Lopez Village Plan\2017 DRAFT_PLAN_CODE_STANDARDS_MAPS\Lopez Village Plan\2018-02-22_Draft Subarea Plan.docx
16The proportionate share projection for Lopez Village urban growth area is 204 people in 2036, an increase of
thirty-three people or sixteen residential units. By contrast, the current rate of population growth of
approximately one person per year suggests that by 2036, the population in Lopez Village would be 191.
Table 3. Lopez Village UGA 2016-2040 population forecast: proportionate share of State.
2000 2005 2010 2016 2020 2025 2030 2035 2036 2040
Lopez Island
Population 2176 2317 2380 2466 2546 2677 2801 2914 2936 3020
Lopez Village UGA
(stable proportionate
share of island 137 150 159 171 177 186 194 202 204 209
population).
Percent of Island
Population 6.30 6.47 6.68 6.93 6.93 6.93 6.93 6.93 6.93 6.93
Source: OFM Small areas unincorporated UGA’s September, 2016 and U.S. Census
Figure 3. Lopez Village growth: stable proportionate share of Island population.
3500 7.00%
3000 6.80%
2500
6.60%
2000
6.40%
1500
6.20%
1000
500 6.00%
R² = 0.997
0 5.80%
2000 2005 2010 2016 2020 2025 2030 2035 2036 2040
Lopez Island Population Lopez Village UGA
Percentage of Island Population Poly. (Lopez Village UGA)
Source: OFM Small Areas Estimates-Unincorporated UGAs Sept. 2016 and U.S. Census.
2010 – 2017 Permit Data
Building permit data for Lopez Village 2010 – 2017 depicted in Table 4 below indicates an almost 1:1 connection
between residential development and new residents. The residential development pattern across the rest of
the island, of 2.12 new units per new resident, suggests that future residential development in Lopez Village
may follow the same trend.
There may be plans in progress to revive a long subdivision in the Village. This development may generate up
to twenty-eight new residential units. Due to the size of this urban growth area, a few large developments
could account for the entire population allocation for Lopez Island. If, in the future, it’s clear that population
growth in Lopez Village is occurring at a higher rate than expected, the County may revise its population
projection for the Village by attributing a higher percentage of the Island’s population growth to it.
N:\LAND USE\LONG RANGE PROJECTS\PCOMPL-14-0002 Lopez Village Plan\2017 DRAFT_PLAN_CODE_STANDARDS_MAPS\Lopez Village Plan\2018-02-22_Draft Subarea Plan.docx
17Table 4. Residential permits in Lopez Island and Lopez Village urban growth area 2010-2017.
Year Lopez Lopez island Total Population
Village Permits Lopez Village Lopez Island
2010 0 27 Single Family Residence* 32 165 2,380
5 Demolition
2011 0 23 Single Family Residence 30 165 NA
7 Demo
2012 4 SFR 22 Single Family Residence 27 164 NA
1 Demolition
2013 17 Single Family Residence 18 168 NA
1 Demolition
2014 3 SFR 24 Single Family Residence 30 169 NA
2 Demolition
1 Mixed-use
2015 0 34 Single Family Residence 34 171 NA
2016 0 23 Single Family Residence 28 171 2,466
5 Demolition
2017
2010 - 2017 7 SFR 170 Single Family Residence 199 171 - 165 = 6 2,466 - 2,380 = 86
Total 21 Demolition
1 Mixed-use
Source: SJC Department of Community Development permit and OFM population data.* Includes all finaled owner/builder permits, manufactured
homes, park model and modular units.
Eight years is a small sample size and any conclusions drawn upon Table 4 should be treated with caution.
Between 2010 and 2017, the population of Lopez Island Village increased by six residents, whereas at the same
time, the population of the rest of Lopez Island increased by eighty residents.
Lopez Village population growth has been at a rate of approximately one person per year whereas the
population growth for the rest of the island has been at a rate of about thirteen people per year. Over the same
period, seven single family residential permits were issued for new residences in Lopez Village and 170 single
family residential permits were issued for Lopez Island beyond the urban growth area. The permit data for
Lopez Island reveals that for every new resident on the island, more than two houses are constructed.
Table 5. New residents and residences in Lopez Island and Lopez Village UGA 2010 - 2016.
New Residents New SFRs 2010- Rate of SFRs per SFR’s per average
2010-2016 2016 new resident household (2.05)
Lopez Island 80 170 2.12 4.35 SFR’s per
(outside UGA) household
Lopez Village 6 7 1.16 2.33 SFR’s per
household
Source: SJC Department of Community Development permit and OFM population data
N:\LAND USE\LONG RANGE PROJECTS\PCOMPL-14-0002 Lopez Village Plan\2017 DRAFT_PLAN_CODE_STANDARDS_MAPS\Lopez Village Plan\2018-02-22_Draft Subarea Plan.docx
18Demographic Snapshots
Unless otherwise noted, the following demographics for Lopez Island with comparisons to the County and
Washington State came from the U.S Census Bureau American Community Survey Five year estimates
2012-2016. Because of the small sample sizes, they should be used cautiously.
Marital Status
Figure 4. Marital status.
Sixty-seven percent of the Lopez population aged 15 years and
older was married. This is about 10 percent higher than the
County’s marital rate of 58 percent and 25 percent higher than
the State rate.
Figure 5. Population by household type.
Persons per Household
Lopez Island had, 1,247 households and 2.1 persons per household. Compared to the County’s 2 per
household and 2.6 per household in Washington.
AGE
Reflecting the high number of reti7ees, sixty-two percent of Lopez Island’s population was over age 50 in
2016. The median age on Lopez Island was 56.9 in, a bit higher than the County’s median of 54.4 and 1.5
times the State’s median 37.4 (U.S. 49.9 percent).
Figure 6. Lopez island population by age.
N:\LAND USE\LONG RANGE PROJECTS\PCOMPL-14-0002 Lopez Village Plan\2017 DRAFT_PLAN_CODE_STANDARDS_MAPS\Lopez Village Plan\2018-02-22_Draft Subarea Plan.docx
0
N:\LAND USE\LONG RANGE PROJECTS\PCOMPL-14-0002 Lopez Village Plan\2017 DRAFT_PLAN_CODE_STANDARDS_MAPS\Lopez Village Plan\2018-02-22_Draft Subarea Plan.docx
0Veteran Status
Approximately 13 percent of Lopez Islands’ population has veteran status meaning civilian veterans who
served during wartime only. This is about 25 percent higher than Washington’s rate of 10.6 percent and
about 10 percent higher than the San Juan County rate of 12.1 percent.
Gender, Race and Ethnicity
Lopez Island’s population was 52 percent female as compared to the State average of 50 percent. Lopez
Island’s a mostly white population with 87 percent white and a bit less diverse than the State average of
81.2 percent.
Figure 7. Lopez Island gender, race and etnicity.
Geographical Mobility
There is little difference in the percentages of geographical mobility (the percentage of people that moved
since the previous year) on Lopez island, the County and the State. On lOpez Island 7.4 percent of those
that moved moved within the County.
Figure 8. Geographical mobility.
N:\LAND USE\LONG RANGE PROJECTS\PCOMPL-14-0002 Lopez Village Plan\2017 DRAFT_PLAN_CODE_STANDARDS_MAPS\Lopez Village Plan\2018-02-22_Draft Subarea Plan.docx
1Per Capita Income and Median Household Income
Figure 9 below shows that Lopez Island residents had about eighty percent of the County’s $39, 266 per
capita income at $33,082 and a bit higher than the State average of $31,762. Median income was $48,074
on Lopez Island, representing 90 percent of the amount in the County and 80 percent the amount in the
State.
Figure 9. Per capita income and and median household income comparisons.
Figure 10. County and Lopez Island household income comparisons.
Compared with the
Household Income County, Lopez Island
60.00% has a higher percen-
50.00% tage of households
40.00% earning less than
30.00% $50,000/year,
20.00% a lower percentage of
10.00% households making
0.00% between $50,000 and
Under $50K - $100K - Over
$50K $100K $200K $200K $100,000/year, and a
lower percentage of
Percent of Households
52.30% 26% 17.50% 4.30% households earning
(Lopez)
over $200,000/year.
Percent of Households
45.90% 30.40% 17.50% 6.20%
(SJC)
Percent of Households (Lopez) Percent of Households (SJC)
Poverty Rate
According to Figure 11 below, 17.8 percent of Lopez Island’s population lived in poverty in 2015 compared
to 11.6 percent in the County and 13.3 percent state average (U.S. 15.1 percent). Thirty-eight percent of
children under eighteen and six percent of seniors sixty-five and older were living in poverty.
N:\LAND USE\LONG RANGE PROJECTS\PCOMPL-14-0002 Lopez Village Plan\2017 DRAFT_PLAN_CODE_STANDARDS_MAPS\Lopez Village Plan\2018-02-22_Draft Subarea Plan.docx
2Figure 11. Comparisons of persons below the poverty rate.
Transportation to Work
Unsurprisingly, Figure 12 indicates that the vast majority, over sixty-three percent, of Lopez Island
commuters drove to work alone. The next most common commute was working from home at eleven
percent of commuters. The mean travel time to work was 18.8 minutes on Lopez Island, 14.4 minutes in
the County overall and less than the state’s average commute time of 26.3 minutes.
Figure 12. Transportation to work.
*Workers 16 years old and older
Migration and Population Increase
San Juan County and Lopez Island had about the same rate of population that had moved since the
previous year 16.9 and 17 percent. The majority of Lopez Island residents, eighty-three percent, lived in
the same house the year prior to the 2015 ACS. In that year, seven percent of new Lopez residents moved
from within San Juan County, six percent moved from another county in Washington State, and three-
point-six percent moved from a state other than Washington. Less than one percent of new Lopez
residents moved to the Island from abroad.
Figure 13. Population migration.
Education and Language
N:\LAND USE\LONG RANGE PROJECTS\PCOMPL-14-0002 Lopez Village Plan\2017 DRAFT_PLAN_CODE_STANDARDS_MAPS\Lopez Village Plan\2018-02-22_Draft Subarea Plan.docx
3According to the 2015 ACS, forty-eight percent of Lopez residents have a bachelor’s degree or higher
compared to thirty-two percent statewide. Another thirty percent have some college education.
Compared to statewide measures, Lopez Island residents have a higher level of academic attainment.
The 2015 ACS found that over ninety-four percent of adults over eighteen speak english at home. This
percentage is slightly higher than the statewide percentage of eighty-one percent. Children ages five to
seventeen spoke english at home at a rate of sevety-nine percent. Notably, the 2015 ACS found that
nineteen percent of children on Lopez Island speak spanish at home compared with the Washington State
percentage of twelve-point-seven.
Educational Attainment
Figure 14 shows that at 95.2 percent, Lopez Island has a higher high educational level than the State’s rate
of 90.4 perent and has one and one half times the State rate of those with a bachelor’s degree or higher.
Population by minimum
Figure 14. Educational attainment.
Figure 15. Population by minimum level of education.
No degree
No degree
Post-grad 21% High school 17%
High
school
Some
Bachelor's college
Some college
30% Bachelor's
Source: 2016 ACS
N:\LAND USE\LONG RANGE PROJECTS\PCOMPL-14-0002 Lopez Village Plan\2017 DRAFT_PLAN_CODE_STANDARDS_MAPS\Lopez Village Plan\2018-02-22_Draft Subarea Plan.docx
4You can also read


