FINANCING UNIVERSAL WATER, SANITATION AND HYGIENE UNDER THE SUSTAINABLE DEVELOPMENT GOALS - UN-Water Global Analysis and Assessment of Sanitation ...
←
→
Page content transcription
If your browser does not render page correctly, please read the page content below

FINANCING UNIVERSAL WATER,
SANITATION AND HYGIENE UNDER THE
 SUSTAINABLE DEVELOPMENT GOALS
UN-Water Global Analysis and Assessment of Sanitation and Drinking-Water

                        GLAAS 2017 Report
FINANCING UNIVERSAL WATER,
SANITATION AND HYGIENE UNDER THE
 SUSTAINABLE DEVELOPMENT GOALS
UN-Water Global Analysis and Assessment of Sanitation and Drinking-Water

                        GLAAS 2017 Report
UN-Water global analysis and assessment of sanitation and drinking-water (GLAAS) 2017 report: financing universal water, sanitation and hygiene under the sustainable development goals

         ISBN 978-92-4-151219-0

         © World Health Organization 2017

         Some rights reserved. This work is available under the Creative Commons Attribution-NonCommercial-ShareAlike 3.0 IGO licence (CC BY-NC-SA 3.0 IGO; https://creativecommons.org/
         licenses/by-nc-sa/3.0/igo).

         Under the terms of this licence, you may copy, redistribute and adapt the work for non-commercial purposes, provided the work is appropriately cited, as indicated below. In any use of
         this work, there should be no suggestion that WHO endorses any specific organization, products or services. The use of the WHO logo is not permitted. If you adapt the work, then you
         must license your work under the same or equivalent Creative Commons licence. If you create a translation of this work, you should add the following disclaimer along with the suggested
         citation: “This translation was not created by the World Health Organization (WHO). WHO is not responsible for the content or accuracy of this translation. The original English edition shall
         be the binding and authentic edition”.

         Any mediation relating to disputes arising under the licence shall be conducted in accordance with the mediation rules of the World Intellectual Property Organization.

         Suggested citation. UN-Water global analysis and assessment of sanitation and drinking-water (GLAAS) 2017 report: financing universal water, sanitation and hygiene under the sustainable
         development goals. Geneva: World Health Organization; 2017. Licence: CC BY-NC-SA 3.0 IGO.

         Cataloguing-in-Publication (CIP) data. CIP data are available at http://apps.who.int/iris.

         Sales, rights and licensing. To purchase WHO publications, see http://apps.who.int/bookorders. To submit requests for commercial use and queries on rights and licensing, see http://
         www.who.int/about/licensing.

         Third-party materials. If you wish to reuse material from this work that is attributed to a third party, such as tables, figures or images, it is your responsibility to determine whether
         permission is needed for that reuse and to obtain permission from the copyright holder. The risk of claims resulting from infringement of any third-party-owned component in the work
         rests solely with the user.

         General disclaimers. The designations employed and the presentation of the material in this publication do not imply the expression of any opinion whatsoever on the part of WHO
         concerning the legal status of any country, territory, city or area or of its authorities, or concerning the delimitation of its frontiers or boundaries. Dotted and dashed lines on maps represent
         approximate border lines for which there may not yet be full agreement.

         The mention of specific companies or of certain manufacturers’ products does not imply that they are endorsed or recommended by WHO in preference to others of a similar nature that are
         not mentioned. Errors and omissions excepted, the names of proprietary products are distinguished by initial capital letters.

         All reasonable precautions have been taken by WHO to verify the information contained in this publication. However, the published material is being distributed without warranty of any
         kind, either expressed or implied. The responsibility for the interpretation and use of the material lies with the reader. In no event shall WHO be liable for damages arising from its use.

         Design and layout by L’IV Com Sàrl, Villars-sous-Yens, Switzerland.
         GLAAS visual identifier design by Ledgard Jepson Ltd, Barnsley, South Yorkshire, England.
         Printed in France.

v.10_16125_GLAAS 2017 Report_JULY.indd 2                                                                                                                                                                       27/07/17 19:05
UN-Water Reports
UN-Water is the United Nations (UN) inter-agency coordination mechanism for freshwater related issues, including sanitation. It was formally established
in 2003 building on a long history of collaboration in the UN family. UN-Water is comprised of UN entities with a focus on, or interest in, water-related
issues as Members and other non-UN international organizations as Partners.

The main purpose of UN-Water is to complement and add value to existing programmes and projects by facilitating synergies and joint efforts, so as to
maximize system-wide coordinated action and coherence. By doing so, UN-Water seeks to increase the effectiveness of the support provided to Member
States in their efforts towards achieving international agreements on water.

PERIODIC REPORTS
  WORLD WATER DEVELOPMENT REPORT (WWDR)                                                                            Strategic outlook
  is the reference publication of the UN system on the status of the freshwater resource. The Report               State, uses and management of water
  is the result of the strong collaboration among UN-Water Members and Partners and it represents                  resources
  the coherent and integrated response of the UN system to freshwater-related issues and emerging                  Global
  challenges. The report production is coordinated by the World Water Assessment Programme and the                 Regional assessments
                                                                                                                   Triennial (2003–2012)
  theme is harmonized with the theme of World Water Day (22 March). From 2003 to 2012, the WWDR                    Annual (from 2014)
  was released every three years and from 2014 the Report is released annually to provide the most up              Links to the theme of World Water Day
  to date and factual information of how water-related challenges are addressed around the world.                  (22 March)

  UN-WATER GLOBAL ANALYSIS AND ASSESSMENT OF SANITATION AND
  DRINKING-WATER (GLAAS)                                                                                           Water supply and sanitation
  is led and produced by the World Health Organization (WHO) on behalf of UN-Water. It provides a                  Global
  global update on the policy frameworks, institutional arrangements, human resource base, and                     Regional and country highlights
  international and national finance streams in support of sanitation and drinking-water. It provides              Biennial (since 2008)
  substantive evidence for the activities of Sanitation and Water for All (SWA).

  THE PROGRESS REPORT OF THE WHO/UNICEF JOINT MONITORING
                                                                                                                   Status and trends
  PROGRAMME FOR WATER SUPPLY AND SANITATION (JMP)                                                                  Water supply and sanitation
  is affiliated with UN-Water and presents the results of the global monitoring of progress towards                Global
  access to safe drinking-water, and adequate sanitation and hygiene. Monitoring draws on the findings             Regional and national assessments
  of household surveys and censuses usually supported by national statistics bureaus in accordance                 Biennial (1990–2012)
  with international criteria and increasingly draws on national administrative and regulatory datasets.           Annual updates (since 2013)

                     UN-WATER                    • Update of UN-Water Policy Brief on Water and Climate Change
                      PLANNED                    • UN-Water Policy Brief on the Water Conventions
                  PUBLICATIONS                   • UN-Water Analytical Brief on Water Efficiency
                 2017–2018                       • SDG 6 Synthesis Report 2018 on Water and Sanitation

   WORLD WATER DAY • 22 MARCH                                                          WORLD TOILET DAY • 19 NOVEMBER
Foreword
Safe drinking-water and sanitation are crucial to human welfare, by supporting health and livelihoods and helping to create
healthy environments. The consumption of unsafe water impairs human health through illnesses such as diarrhoea, and untreated
sewage can contaminate drinking-water supplies and the environment, creating a heavy burden on communities.
In recent years, much progress has been made in increasing access to drinking-water and sanitation, but still too many people
lack access to safe, sustainable water supply and sanitation services. In 2015, the WHO/UNICEF Joint Monitoring Programme
(JMP) estimated that 660 million people still do not have access to improved drinking-water sources, and over 2.4 billion people
do not have access to improved sanitation.
The Sustainable Development Goals (SDGs), as part of the 2030 Agenda for Sustainable Development, build upon the many
achievements made under the Millennium Development Goals (MDGs), but are more aspirational, extensive and ambitious. Goal
6 is focused on clean water and sanitation. Going beyond “improved” drinking-water and sanitation, Target 6.1 calls for universal
and equitable access to safe and affordable drinking-water, and Target 6.2 aspires to access to adequate and equitable sanitation and
hygiene for all, as well as the end of open defecation.
A large financing gap has been identified as one of the greatest barriers to achieving these targets. To meet Targets 6.1 and
6.2, capital financing would need to triple to US$ 114 billion per annum, and operating and maintenance costs need to be
considered in addition. Beyond this global figure, there are large variations in financing needs from region to region and country
to country. Hence, financing strategies are needed based on evidence and realistic proposals for how to fill the gaps. As part of
this effort, the UN-Water Global Analysis and Assessment of Sanitation and Drinking-Water (GLAAS) and Tracking Financing to
WASH (TrackFin), both led by the World Health Organization (WHO), are providing evidence for decision-makers on the WASH
enabling environment, including governance, monitoring, human resources and finance, to make smarter decisions on water
and sanitation financing, including on how to better utilize existing financing.
Investing in WASH can have a beneficial impact across a number
of issues covered by the SDGs including health and education.
For example, it has been estimated, through expert opinion, that
26% of childhood deaths and 25% of the total disease burden in
children under five could be prevented through the reduction of
environmental risks, including by reducing unsafe water, sanitation
FINANCING UNIVERSAL WATER, SANITATION AND HYGIENE UNDER THE SUSTAINABLE DEVELOPMENT GOALS
and inadequate hygiene. Specifically, diarrhoeal diseases are
among the main contributors to global child mortality, causing
about 10% of all deaths in children under five years.1 WASH also
leads to improved nutrition. Moreover, improved WASH in health
care facilities leads to a reduction in maternal mortality, as well as
increased use of health centers and facilities, and WASH in schools
leads to increased attendance for girls. Investing in WASH provides
benefits that expand beyond the water and sanitation sector.
This GLAAS report presents an analysis of the most reliable and up-
to-date data from 75 countries and 25 external support agencies
(ESAs) on the issues related to financing universal WASH access Dr Margaret Chan Guy Ryder
under the SDGs. Director-General Chair, UN-Water
World Health Director-General,
We hope that the GLAAS 2017 report will be a useful resource for Organization International Labour
decision- and policy-makers so that the realizable goal of safe, Organization
sustainable water and sanitation services for all can be achieved.
1
WHO (2017) Don’t pollute my future! The impact of the environment on children’s health. Geneva: World Health Organization. Available at: http://apps.who.int/iris/bitstream/10665/254678/1/WHO-FWC-IHE-17.01-eng.
pdf?ua=1 [Accessed 15 March 2017].
ivAcknowledgements
UN-Water and the World Health Organization (WHO) gratefully acknowledge the financial support provided by the Department for
International Development (DFID), United Kingdom; the Swiss Agency for Development and Cooperation (SDC); the Directorate-
General for International Cooperation (DGIS), the Netherlands; the Agence Française de Développement (AFD), France; and the Bill
& Melinda Gates Foundation (BMGF) to the UN-Water Global Analysis and Assessment of Sanitation and Drinking-Water (GLAAS)
and Tracking Financing to WASH (TrackFin) initiatives.
The preparation of this report involved contributions from hundreds of individuals representing all regions of the world. UN-Water
and WHO would like to extend their gratitude to all those individuals and organizations that contributed to the development of
the results and report – especially those individuals who coordinated efforts and submitted information from 75 countries and
25 ESAs (Annex G). Every effort has been made to name contributors as best to our available knowledge.
The GLAAS 2017 report FINANCING UNIVERSAL WATER, SANITATION AND HYGIENE UNDER THE SUSTAINABLE
DEVELOPMENT GOALS is dedicated to Piers Cross, who passed away on 29 March 2017, for his contributions to
the WASH sector, his dedication and energy, and above all his friendship.
UN-WATER GLOBAL ANALYSIS AND ASSESSMENT OF SANITATION AND DRINKING-WATER • GLAAS 2017 REPORT
vTable of contents
Foreword. . . . . . . . . . . . . . . . . . . . . . . . . . . . . . . . . . . . . . . . . . . . . . . . . . . . . . . . . . . . . . . . . . . . . . . . . . . . . . . . . . . iv
Acknowledgements. . . . . . . . . . . . . . . . . . . . . . . . . . . . . . . . . . . . . . . . . . . . . . . . . . . . . . . . . . . . . . . . . . . . . . . . . . v
Acronyms and abbreviations. . . . . . . . . . . . . . . . . . . . . . . . . . . . . . . . . . . . . . . . . . . . . . . . . . . . . . . . . . . . . . . . . . vii
GLAAS summary table of key indicators for WASH financing. . . . . . . . . . . . . . . . . . . . . . . . . . . . . . . . . . . . . . . . . viii
Main findings. . . . . . . . . . . . . . . . . . . . . . . . . . . . . . . . . . . . . . . . . . . . . . . . . . . . . . . . . . . . . . . . . . . . . . . . . . . . . . . ix
Introduction and context of the GLAAS 2017 report. . . . . . . . . . . . . . . . . . . . . . . . . . . . . . . . . . . . . . . . . . . . . . . . . 1
Purpose of GLAAS. . . . . . . . . . . . . . . . . . . . . . . . . . . . . . . . . . . . . . . . . . . . . . . . . . . . . . . . . . . . . . . . . . . . . . . . . . 2
Financial Planning: Estimating the financing gap and needs to meet the SDGs. . . . . . . . . . . . . . . . . . . . . . . . . . . . 5
Financial sufficiency to meet targets. . . . . . . . . . . . . . . . . . . . . . . . . . . . . . . . . . . . . . . . . . . . . . . . . . . . . . . . . . . . . 5
Identifying financial needs through national assessments. . . . . . . . . . . . . . . . . . . . . . . . . . . . . . . . . . . . . . . . . . . . . . 6
Data availability for decision-making. . . . . . . . . . . . . . . . . . . . . . . . . . . . . . . . . . . . . . . . . . . . . . . . . . . . . . . . . . . . . 7
Development and implementation of financial plans for WASH. . . . . . . . . . . . . . . . . . . . . . . . . . . . . . . . . . . . . . . . . . 9
Government budgeting for WASH. . . . . . . . . . . . . . . . . . . . . . . . . . . . . . . . . . . . . . . . . . . . . . . . . . . . . . . . . . . . . . 10
WASH government budgets. . . . . . . . . . . . . . . . . . . . . . . . . . . . . . . . . . . . . . . . . . . . . . . . . . . . . . . . . . . . . . . 10
Government budget allocations.. . . . . . . . . . . . . . . . . . . . . . . . . . . . . . . . . . . . . . . . . . . . . . . . . . . . . . . . . . . . 12
Government budget trends. . . . . . . . . . . . . . . . . . . . . . . . . . . . . . . . . . . . . . . . . . . . . . . . . . . . . . . . . . . . . . . . 13
Sources of financing for WASH. . . . . . . . . . . . . . . . . . . . . . . . . . . . . . . . . . . . . . . . . . . . . . . . . . . . . . . . . . . . . . . . . 15
National expenditures and sources of funds. . . . . . . . . . . . . . . . . . . . . . . . . . . . . . . . . . . . . . . . . . . . . . . . . . . . . . . 15
Household contributions. . . . . . . . . . . . . . . . . . . . . . . . . . . . . . . . . . . . . . . . . . . . . . . . . . . . . . . . . . . . . . . . . . . . 17
Public expenditure: Respective share of government and external contributions. . . . . . . . . . . . . . . . . . . . . . . . . . . . . 18
External aid flows to water and sanitation. . . . . . . . . . . . . . . . . . . . . . . . . . . . . . . . . . . . . . . . . . . . . . . . . . . . . . . . . 20
Allocation of global aid commitments. . . . . . . . . . . . . . . . . . . . . . . . . . . . . . . . . . . . . . . . . . . . . . . . . . . . . . . . 20
Geographic distribution of aid. . . . . . . . . . . . . . . . . . . . . . . . . . . . . . . . . . . . . . . . . . . . . . . . . . . . . . . . . . . . . . 22
Specific targets for financial or technical assistance. . . . . . . . . . . . . . . . . . . . . . . . . . . . . . . . . . . . . . . . . . . . . . . 23
External support agency strategies. . . . . . . . . . . . . . . . . . . . . . . . . . . . . . . . . . . . . . . . . . . . . . . . . . . . . . . . . . . 24
External support agency priorities. . . . . . . . . . . . . . . . . . . . . . . . . . . . . . . . . . . . . . . . . . . . . . . . . . . . . . . . . . . 25
Repayable Financing.. . . . . . . . . . . . . . . . . . . . . . . . . . . . . . . . . . . . . . . . . . . . . . . . . . . . . . . . . . . . . . . . . . . . . . . 27
Allocation of expenditures. . . . . . . . . . . . . . . . . . . . . . . . . . . . . . . . . . . . . . . . . . . . . . . . . . . . . . . . . . . . . . . . . . . . 30
FINANCING UNIVERSAL WATER, SANITATION AND HYGIENE UNDER THE SUSTAINABLE DEVELOPMENT GOALS
Sanitation versus drinking-water. . . . . . . . . . . . . . . . . . . . . . . . . . . . . . . . . . . . . . . . . . . . . . . . . . . . . . . . . . . . . . . 30
Urban versus rural.. . . . . . . . . . . . . . . . . . . . . . . . . . . . . . . . . . . . . . . . . . . . . . . . . . . . . . . . . . . . . . . . . . . . . . . . . 31
Hygiene promotion. . . . . . . . . . . . . . . . . . . . . . . . . . . . . . . . . . . . . . . . . . . . . . . . . . . . . . . . . . . . . . . . . . . . . . . . 31
Capital expenditure and recurrent O&M costs. . . . . . . . . . . . . . . . . . . . . . . . . . . . . . . . . . . . . . . . . . . . . . . . . . . . . . 32
Basic versus large systems. . . . . . . . . . . . . . . . . . . . . . . . . . . . . . . . . . . . . . . . . . . . . . . . . . . . . . . . . . . . . . . . . . . . 32
Sector strengthening. . . . . . . . . . . . . . . . . . . . . . . . . . . . . . . . . . . . . . . . . . . . . . . . . . . . . . . . . . . . . . . . . . . . . . . 33
Financing universal access. . . . . . . . . . . . . . . . . . . . . . . . . . . . . . . . . . . . . . . . . . . . . . . . . . . . . . . . . . . . . . . . . . . . 34
Improving the use of existing financial resources.. . . . . . . . . . . . . . . . . . . . . . . . . . . . . . . . . . . . . . . . . . . . . . . . . . . 34
Cost recovery. . . . . . . . . . . . . . . . . . . . . . . . . . . . . . . . . . . . . . . . . . . . . . . . . . . . . . . . . . . . . . . . . . . . . . . . . . 34
Maintaining affordability. . . . . . . . . . . . . . . . . . . . . . . . . . . . . . . . . . . . . . . . . . . . . . . . . . . . . . . . . . . . . . . . . . 37
Use of committed funds. . . . . . . . . . . . . . . . . . . . . . . . . . . . . . . . . . . . . . . . . . . . . . . . . . . . . . . . . . . . . . . . . . 39
Improved targeting towards vulnerable populations. . . . . . . . . . . . . . . . . . . . . . . . . . . . . . . . . . . . . . . . . . . . . . 41
Utilizing alternative sources of finance. . . . . . . . . . . . . . . . . . . . . . . . . . . . . . . . . . . . . . . . . . . . . . . . . . . . . . . . . . . 44
Conclusion. . . . . . . . . . . . . . . . . . . . . . . . . . . . . . . . . . . . . . . . . . . . . . . . . . . . . . . . . . . . . . . . . . . . . . . . . . . . . . . . 45
Annexes.. . . . . . . . . . . . . . . . . . . . . . . . . . . . . . . . . . . . . . . . . . . . . . . . . . . . . . . . . . . . . . . . . . . . . . . . . . . . . . . . . . 47
Annex A. Methodology and validation. . . . . . . . . . . . . . . . . . . . . . . . . . . . . . . . . . . . . . . . . . . . . . . . . . . . . . . . . . . 47
Annex B. TrackFin: Tracking financing to WASH. . . . . . . . . . . . . . . . . . . . . . . . . . . . . . . . . . . . . . . . . . . . . . . . . . . . . 50
Annex C. SDG 6: Monitoring the means of implementation. . . . . . . . . . . . . . . . . . . . . . . . . . . . . . . . . . . . . . . . . . . . 53
Annex D. Summary of responses to GLAAS 2016/2017 country survey. . . . . . . . . . . . . . . . . . . . . . . . . . . . . . . . . . . . 60
Annex E. Summary of responses to GLAAS 2016/2017 ESA survey. . . . . . . . . . . . . . . . . . . . . . . . . . . . . . . . . . . . . . . 72
Annex F. Glossary. . . . . . . . . . . . . . . . . . . . . . . . . . . . . . . . . . . . . . . . . . . . . . . . . . . . . . . . . . . . . . . . . . . . . . . . . . 74
Annex G. Contributors.. . . . . . . . . . . . . . . . . . . . . . . . . . . . . . . . . . . . . . . . . . . . . . . . . . . . . . . . . . . . . . . . . . . . . . 76
viAcronyms and abbreviations
ADB Asian Development Bank
AFD Agence Française de Développement, France
AMCOW African Ministers’ Council on Water
BFP Budget Framework Paper
BMGF Bill & Melinda Gates Foundation
BMZ Federal Ministry for Economic Cooperation and Development, Germany
CPIA Country Policy and Institutional Assessment
DFAT Department of Foreign Affairs and Trade, Australia
DFID Department for International Development, United Kingdom
DGIS Directorate-General for International Cooperation, the Netherlands
ESA External support agency
FCV Fragility, conflict and violence
GDP Gross domestic product
GLAAS Global Analysis and Assessment of Sanitation and Drinking-Water
IDA International Development Association, World Bank Group
IWRM Integrated water resources management
JICA Japan International Cooperation Agency, Japan
JMP WHO/UNICEF Joint Monitoring Programme for Water Supply and Sanitation
JSR Joint sector review
KfW Kreditanstalt für Wiederaufbau, Development Bank, Germany
LWSC Liberia Water and Sewer Corporation
MDG Millennium Development Goal
MOFA Ministry of Foreign Affairs
MoI Means of implementation
NGO Nongovernmental organization
O&M Operations and maintenance
UN-WATER GLOBAL ANALYSIS AND ASSESSMENT OF SANITATION AND DRINKING-WATER • GLAAS 2017 REPORT
ODA Official development assistance
OECD Organisation for Economic Co-operation and Development
OECD-CRS OECD Creditor Reporting System
OECD-DAC OECD Development Assistance Committee
OPEC Organization of Petroleum Exporting Countries
PEFA Public Expenditure and Financial Accountability
SDC Swiss Agency for Development and Cooperation, Switzerland
SDG Sustainable Development Goal
SECO State Secretariat for Economic Affairs, Switzerland
Sida Swedish International Development Cooperation Agency, Sweden
SWA Sanitation and Water for All
TrackFin Tracking Financing to WASH
UN United Nations
UNDP United Nations Development Programme
UNEP United Nations Environment Programme
UNICEF United Nations Children’s Fund
USAID United States Agency for International Development, United States
WASH Water, sanitation and hygiene
WASH BAT WASH Bottleneck Analysis Tool
WHO World Health Organization
viiGLAAS summary table of key
indicators for WASH financing
VALUE INDICATOR
CONTEXT
68% Global population using an improved sanitation facility
91% Global population using an improved drinking-water source
Countries reporting insufficient financing to meet national WASH targets for:
87% / 90% Urban / rural sanitation
78% / 90% Urban / rural drinking-water
WASH BUDGETS AND PLANS
Countries reporting existence of a financing plan that is consistently followed for:
34% / 27% Urban / rural sanitation
42% / 32% Urban / rural drinking-water
76% Countries able to provide WASH budget data
4.9% Annual increase in government WASH budgets, average
19 Government WASH budget per capita (US$), average
0.42% Government WASH budget as a percentage of GDP, average
EXPENDITURES
56% Countries able to provide government expenditure data
50 Total WASH expenditure per capita (US$), average
1.3% Total WASH expenditure as a percentage of GDP, average
57% / 43% Breakdown of country WASH expenditure between water / sanitation
76% / 24% Breakdown of country WASH expenditure between urban / rural
66% Percentage of WASH financing derived from households, average
EXTERNAL SUPPORT
8.2 billion Official development assistance commitments for water and sanitation in 2015 (constant 2014 US$)
3.8% Percentage of total ODA commitments for water and sanitation in 2015
7.4 billion Official development assistance disbursements for water and sanitation in 2015 (constant 2014 US$)
FINANCING UNIVERSAL WATER, SANITATION AND HYGIENE UNDER THE SUSTAINABLE DEVELOPMENT GOALS
65% / 35% Breakdown of water and sanitation ODA commitments between water / sanitation
25% Water and sanitation ODA commitments directed to basic services
73% / 24% / 3% Breakdown of water and sanitation ODA disbursements between urban / rural / combined
32% / 36% / 32% Breakdown of water and sanitation development assistance between ODA grants / ODA loans / non-concessional loans
IMPROVING THE USE OF EXISTING FINANCIAL RESOURCES
Countries with absorption rates greater than 75% for:
60% Domestic capital commitments
59% External donor commitments
Countries with cost recovery for O&M more than 80% for:
39% / 34% Urban / rural sanitation
45% / 24% Urban / rural drinking-water
30% / 35% Countries indicating that affordability schemes exist and are widely used for sanitation / drinking-water
43% Average non-revenue water
viiiMain findings
The GLAAS 2017 report focuses on the key role of financing in the water, sanitation and hygiene (WASH) sector. It is designed
to provide a global perspective as the world embarks on achieving the SDGs, particularly SDG 6 relating to clean water and
sanitation, which is essential to good health and well-being. It also provides country-specific data for governments to use as
they plan investments and allocate resources.
Five key findings emerged from the GLAAS 2016/2017 results:
National WASH budgets are increasing as countries prepare to take on board the SDGs, yet there remains
1
a discrepancy between global aspirations and national realities
Countries are showing a high level of responsiveness to the SDGs, with a majority of countries in the process of setting or planning
to set targets that take into account the SDGs in the next few years. Available data on national budgets and expenditure indicate
that government allocations and spending for WASH are increasing—annual government WASH budgets are increasing at an
annual average rate of 4.9% after adjusting for inflation. This increase in WASH budgets will have positive effects not only in the
WASH sector, but also in health, including nutrition, education and economic development. However, more than 80% of countries
report insufficient financing to meet national WASH targets, let alone the higher levels of service that are the focus of the SDGs.
The SDGs require greater ambitions for WASH, but there remains a lack of financial sustainability for
2 reaching the unserved and maintaining services
More than one half of countries indicate that household tariffs are insufficient to recover operations and basic maintenance
(O&M) costs. For rural sanitation, a greater number of countries reported improvements in cost recovery as opposed to those
that reported declines; however, cost recovery remains an issue. While many service providers and communities have access to
government subsidies, nearly 20% of countries indicate a lack of any mechanism to cover operational financial gaps, leading to
deferred maintenance, deterioration of assets and increased failure rates. Combined with estimated capital investment needs
to reach the SDGs that are three times higher than current investment levels, significantly more resources will be required to
address the financial gap for WASH investments and O&M. The additional resources will contribute to sustainable WASH services,
overall improving health and well-being.
UN-WATER GLOBAL ANALYSIS AND ASSESSMENT OF SANITATION AND DRINKING-WATER • GLAAS 2017 REPORT
3 More and better data are available for informed decision-making
Disaggregated financial data are available from an increasing number of countries: 42 out of 75 participating countries were
able to provide government expenditure data, compared to 33 out of 94 in the previous GLAAS cycle. Moreover, nearly 70% of
countries indicate that data are available and used in decisions for resource allocation for drinking-water and sanitation. Data are
also available for WASH and health issues. Over 70% of countries indicate that data are available and used for decisions regarding
identifying public health priorities for reducing WASH-related diseases and responding to WASH-related disease outbreaks.
However, significant data gaps remain and existing data continue to be fragmented across different ministries and stakeholders.
Over two thirds of respondent countries indicate the existence of a financing plan/budget for water and sanitation, but only one
third report that the financial plan has been defined, agreed and consistently followed.
Official development assistance (ODA) disbursements for water and sanitation are increasing, but future
4 investments are uncertain
Investments in WASH are investments in public health—ODA to safe, sustainable WASH systems will contribute to achieving
gains in health. Water and sanitation ODA disbursements (spending) increased from US$ 6.3 to US$ 7.4 billion from 2012 to
2015. However, aid commitments for water and sanitation have declined since 2012: global aid commitments decreased from
US$ 10.4 to US$ 8.2 billion, and aid commitments to sub-Saharan Africa decreased from US$ 3.8 billion to US$ 1.7 billion from
2012 to 2015. Considering the greater needs to make progress towards universal access to safely managed WASH services under
the SDG targets, the possibility of future reductions in aid disbursements does not align with global aspirations.
ix5 Extending WASH services to vulnerable groups is a policy priority, but implementation is lagging behind
Achieving the SDGs will require additional efforts to reach vulnerable groups, including poor populations and communities living
in remote areas or informal settlements. Over 70% of countries report having specific measures to reach poor populations in their
WASH policies and plans. However, the implementation of such concrete measures is lagging: few countries indicate that they are
able to consistently apply financing measures to target resources to poor populations. Furthermore, while “reducing inequalities
in access and services to the poorest and most vulnerable” was considered a very high priority for two thirds of external support
agencies (ESAs), aid to basic systems (as a proxy for aid targeted to unserved populations, particularly in rural areas) was only
25% of WASH aid disbursements in 2015. Increasing and sustaining WASH access for vulnerable groups will not only be critical
for achieving SDG 6, but also for SDG 3 on ensuring healthy lives and promoting well-being for all at all ages.
FINANCING UNIVERSAL WATER, SANITATION AND HYGIENE UNDER THE SUSTAINABLE DEVELOPMENT GOALS
xIntroduction and context of the
GLAAS 2017 report
The transition from the MDG to the SDG era calls for a balance between continuity and a notable departure from business as
usual. The aspirational and ambitious goals and targets that make up the SDG framework will require a new take on development
policies, plans and programmes, on means of implementation and also on monitoring progress.
Sustainable Development Goal 6 on clean water and sanitation, “by 2030, ensure availability and sustainable management of water
and sanitation for all,” extends the original MDG 7 targets to cover all freshwater issues from the perspective of economic, social
and environmental sustainability, in a holistic manner. The first two targets under SDG 6 raise ambitions to increase access to
safe, sustainable water supplies and sanitation services. In particular, they aim to “achieve universal and equitable access to safe and
affordable drinking-water for all” (Target 6.1) and to “achieve access to adequate and equitable sanitation and hygiene for all and end
open defecation, paying special attention to the needs of women and girls and those in vulnerable situations” (Target 6.2). The new
Targets 6.3–6.6 address issues that include, but go beyond, drinking-water supply and sanitation: wastewater management, water
use efficiency, integrated water resources management (IWRM) and aquatic ecosystems’ protection and restoration. Targets 6.a
and 6.b focus on the means of implementation for achieving SDG 6.
Meeting these targets will require large investments in terms of finance and resources. The World Bank has estimated that globally,
current levels of financing for WASH are only sufficient to cover the capital costs of achieving basic universal water, sanitation
and hygiene services by 2030. Meeting SDG Targets 6.1 and 6.2 will require a tripling of capital investments to US$ 114 billion
per year, not to mention operations and maintenance (O&M) costs, which are key for sustainable services.1 Investments in WASH
will also have positive effects on and contribute to improving other critical areas related to public health covered by the SDGs
such as nutrition, economic development, education, and climate resilience.
The financial challenges of meeting the SDGs raise many issues such as which options and opportunities exist to bridge the
funding gaps, the nature of financing mechanisms, such as using a mix of public and private financing, how to increase financial
efficiency in infrastructure development, service delivery and asset management, and viable approaches to tariff-setting and
subsidies that address the dilemma between cost recovery and affordability from economics and human rights perspectives.
UN-WATER GLOBAL ANALYSIS AND ASSESSMENT OF SANITATION AND DRINKING-WATER • GLAAS 2017 REPORT
This report analyses the current WASH finance situation in countries, with an assessment of funding gaps to reach targets, financial
planning and government budgets, as well as different sources of WASH financing (taxes, transfers and tariffs) and expenditure
allocations. The policies and actions of ESAs are also highlighted. The report then focuses on funding universal access to WASH,
with a discussion of how the targeting and use of existing financial resources can be improved as well as what cost recovery and
pro-poor affordability schemes and measures can be deployed to reach those under threat of being left behind.
New results from recently participating countries of the WHO-led UN-Water GLAAS TrackFin initiative during 2015 and 2016 are
also presented throughout this report and in Annex B. Previous GLAAS results have shown that there are substantial gaps in our
understanding and tracking of financing to water, sanitation and hygiene. WHO launched the TrackFin initiative with the intention
to develop and test a common, consistent methodology to track these financial flows at the national level. Strengthening this
evidence base can contribute to improved dialogue at the national level between finance and line ministries, as well as better
decision-making in funding allocations for priority needs, catalyzing better management of available resources, and attracting
additional investment to the sector.
This GLAAS 2017 report is the fourth periodic report, and first thematic report, following on from earlier reports in 2010, 2012,
and 2014. It draws on data from 75 countries and 25 ESAs from in-depth surveys that investigated factors related to finance
and other elements of the enabling environment, including plans, targets, data availability and measures to reach vulnerable
populations. The specific finance focus of the GLAAS 2016/2017 survey has resulted in a lower level of participation than has been
customary in recent data collection cycles due to the challenge of providing comprehensive information on WASH financing,
1
Hutton G and Varughese MC (2016) The Costs of Meeting the 2030 Sustainable Development Goal Targets on Drinking Water, Sanitation, and Hygiene. Water and Sanitation Program Technical Paper, World Bank, Washington,
DC. Available at: http://www.worldbank.org/en/topic/water/publication/the-costs-of-meeting-the-2030-sustainable-development-goal-targets-on-drinking-water-sanitation-and-hygiene [Accessed 24 March 2017].
1which is often fragmented across ministries and organizations, and the time required to collect this information. It is expected
that the level of participation will rebound for the next, general update cycle of GLAAS in 2018/2019. More detailed information
about the GLAAS methodology, including the country and ESA surveys,1 can be found in Annex A.
Figure
1
Country and ESA participation in the GLAAS 2016/2017 surveys
Participation in 2016/2017 Global Analysis and Assessment of Sanitation and Drinking-Water (GLAAS)
Participating bilateral donor
Participating country
Not a participant
Not applicable
Water Supply and Sanitation
Collaborative Council
WaterAid CARE International
Bill & Melinda Gates European Commission
Foundation
UNDP, UNICEF
World Vision World Bank
International Inter-American Development Bank
CARE USA
Water.org
Asian Development Bank
BRAC
African Development Bank
Source: GLAAS 2016/2017 country and external
support agency surveys.
COUNTRIES EXTERNAL SUPPORT AGENCIES (ESAs)
Afghanistan, Albania, Argentina, Azerbaijan, Bangladesh, Barbados, Belarus, Bhutan, African Development Bank (AfDB); Asian Development Bank (ADB); Australia,
Bolivia (Plurinational State of), Bosnia and Herzegovina, Botswana, Brazil, Burkina Department of Foreign Affairs and Trade (DFAT); Bill & Melinda Gates Foundation
Faso, Burundi, Cambodia, Chile, China, Colombia, Costa Rica, Côte d’Ivoire, Cuba, (BMGF); BRAC; CARE International and CARE USA; European Commission; Finland,
Dominican Republic, Ecuador, El Salvador, Ethiopia, Fiji, Georgia, Ghana, Guatemala, Ministry of Foreign Affairs; France, Agence Française de Développement (AFD);
Guinea, Haiti, Honduras, India, Jamaica, Kenya, Kyrgyzstan, Lao People’s Democratic Germany, Federal Ministry for Economic Cooperation and Development (BMZ);
Republic, Lesotho, Liberia, Lithuania, Madagascar, Malaysia, Maldives, Mali, Mexico, Inter-American Development Bank (IDB); Japan International Cooperation Agency
Micronesia (Federated States of), Mongolia, Mozambique, Nepal, Nigeria, Pakistan, (JICA); Portugal, Ministry of Foreign Affairs; Swedish International Development
FINANCING UNIVERSAL WATER, SANITATION AND HYGIENE UNDER THE SUSTAINABLE DEVELOPMENT GOALS
Panama, Papua New Guinea, Paraguay, Peru, Philippines, Rwanda, Senegal, Solomon Cooperation Agency (Sida); Swiss Agency for Development and Cooperation (SDC)
Islands, South Africa, Tajikistan, Thailand, Serbia, Swaziland, Timor-Leste, Tonga, and State Secretariat for Economic Affairs, Switzerland; The Netherlands, Ministry of
Ukraine, United Republic of Tanzania, Uruguay, Uzbekistan, Vanuatu, Venezuela Foreign Affairs (DGIS); United Kingdom, Department for International Development
(Bolivarian Republic of), Viet Nam, Zambia, Zimbabwe. (DFID); United Nations Children’s Fund (UNICEF); United Nations Development Fund
(UNDP); United States Agency for International Development (USAID); Water Supply
and Sanitation Collaborative Council (WSSCC); Water.org; WaterAid; World Bank; World
Vision International.
Purpose of GLAAS
The Global Analysis and Assessment of Sanitation and Drinking-Water (GLAAS) is a UN-Water initiative led by WHO. GLAAS
objectives are defined as: monitoring the inputs (in terms of human resources and finance) and the enabling environment (in
terms of laws, plans and policies, institutional and monitoring arrangements), required to sustain and extend WASH systems and
services to all, and especially to the most vulnerable population groups. GLAAS does this at both global and regional levels by
collecting information at country level and through existing data sources.
GLAAS has been collecting information directly from governments and ESAs on the status and trends in the enabling environment
for sanitation and drinking-water services since 2008, highlighting policy, legal and regulatory frameworks, institutional
arrangements, the human resource base for WASH, and financial flows in the national context as well as through international
cooperation.
1
GLAAS and ESA surveys available online at: http://www.who.int/water_sanitation_health/monitoring/investments/glaas-2016-2017-cycle/en/
2GLAAS also analyses the factors associated with progress in WASH in order to identify drivers and bottlenecks, highlight knowledge
gaps and assess strengths and challenges within and across countries. It aims to facilitate the efforts of government-led platforms
to enhance coordination across the various sectors, institutions and actors influencing and providing WASH services.
GLAAS has developed a medium-term strategy (2016–2020) that will support its monitoring activities within this broadened
scope of SDG 6 and with an expanded focus. It builds on the guidance of two GLAAS evaluation meetings (2012 and 2015) and
on the recommendations of the JMP/GLAAS Strategic Advisory Group. The current report reflects one of the outcomes of both
evaluation meetings, the idea that GLAAS produce, alternatingly, general update reports on all GLAAS aspects of the enabling
environment (governance, monitoring, human resources and finance) and thematic reports. This first thematic report focuses
on the status and trends in financing of drinking-water, sanitation and hygiene infrastructure and O&M.
GLAAS complements other efforts in the wider water and sanitation environment, such as the WHO/United Nations Children’s
Fund (UNICEF) Joint Monitoring Programme on Water Supply and Sanitation (JMP). GLAAS provides evidence for the Sanitation
and Water for All (SWA) High Level Meetings and is leading the monitoring of the SWA Collaborative Behaviours. GLAAS is one of
the main data sources for the SWA Collaborative Behaviours indicators, along with World Bank’s Country Policy and Institutional
Assessment (CPIA), Public Expenditure and Financial Accountability (PEFA) Assessments and the Organisation for Economic Co-
operation and Development Creditor Reporting System (OECD-CRS). Both the GLAAS 2016/2017 country and ESA surveys were
revised to be able to collect information aligned with the Behaviours. Country profiles for the SWA Collaborative Behaviours are
being prepared by GLAAS on behalf of SWA for the April 2017 High Level Meetings.
SWA Collaborative Behaviours and Building Blocks
SWA has identified four Collaborative Behaviours and five Building Blocks for development effectiveness that can improve long-term performance in making
progress towards universal access to water and sanitation. The Collaborative Behaviours are:
• Enhance government leadership of sector planning processes;
• Strengthen and use country systems;
• Use one information and mutual accountability platform built around a multi-stakeholder government-led cycle of planning, monitoring and learning; and
• Build sustainable water and sanitation sector financing strategies that incorporate financial data from taxes, tariffs and transfers as well as estimates for
non-tariff household expenditure.
While the Collaborative Behaviours are the “how” for improving sector performance, the Building Blocks are the “what.”The Building Blocks are:
• Sector policy and strategy;
• Institutional arrangements;
UN-WATER GLOBAL ANALYSIS AND ASSESSMENT OF SANITATION AND DRINKING-WATER • GLAAS 2017 REPORT
• Sector financing;
• Planning, monitoring and review; and
• Capacity development
GLAAS is well positioned to contribute to monitoring the Collaborative Behaviours and Building Blocks as they align with GLAAS’focus on the enabling environment
for WASH. GLAAS has been closely working with SWA on the monitoring strategy and country profiles for the Collaborative Behaviours and continues to collect
data on the Building Blocks.
GLAAS is also complementary to the WASH Bottleneck Analysis Tool (WASH BAT) developed by UNICEF to help assess the enabling
environment for WASH in countries and develop concrete action items. If a country participates in GLAAS and wants to explore
certain topics in more detail, it could conduct a WASH BAT and if a country conducts a WASH BAT before GLAAS, those data can
feed into the GLAAS survey. WHO and UNICEF have worked closely to ensure that GLAAS and the WASH BAT are closely aligned.
3Monitoring the SDG Means of Implementation
GLAAS is a co-custodian, along with the United National Environment Programme (UNEP) and the Organisation for Economic Co-operation and Development
(OECD), for monitoring SDG Targets 6.a and 6.b on the means of implementation (MoI). GLAAS is well placed for this role as it has been monitoring the WASH
enabling environment since its pilot in 2008. For additional information, see Annex C.
Target 6.a By 2030, expand international cooperation and capacity-building support to developing countries in water- and sanitation-related activities and
programmes, including water harvesting, desalination, water efficiency, wastewater treatment, recycling and reuse technologies.
Target 6.b Support and strengthen the participation of local communities in improving water and sanitation management.
Overview of GLAAS 2016/2017 participating countries and improvement of data availability
The WASH sector is heavily fragmented, and it is difficult to centralize data from the many national institutions and supporting partners involved in sector
financing. However, an increasing number of countries have been able to provide key data on WASH budgets and expenditures through the GLAAS country survey:
• Availability of government expenditure data has steadily increased from 5% of participating countries in the 2009/2010 GLAAS cycle to 23% in 2011/2012,
35% in 2013/2014, and 56% in the 2016/2017 cycle.
• Availability of household expenditure data in addition to government expenditure data increased from 5% of participating countries in 2011/2012 to 20%
in 2013/2014 and 33% in 2016/2017.
• Availability of government WASH budget data increased from 52% in 2013/2014 to 76% in 2016/2017.
The quality of data provided has also shown steady improvement, as countries have been able to provide an increasing level of disaggregation, as well as provide
data for more ministries and institutions involved in WASH in country. TrackFin has also helped to improve the quality and level of detail of WASH financing data
in implementing countries.
While the volume and quality of WASH financing data continue to improve, comparability of the data between countries and between different cycles of GLAAS
remains a challenge. Budget and expenditure data reported may cover different areas of WASH and the broader water sector, and national institutions, ministries,
and other agencies for which data are reported differ from cycle to cycle and country to country. A great deal of care was required in the analysis of trends from
the previous cycle of GLAAS in order to ensure comparability of results, for example by including only comparable elements of the data in the analysis.
Due to the finance focus of the GLAAS 2016/2017 cycle, there were fewer participating countries (75 countries) compared to the 2013/2014 cycle (94 countries),
particularly from low income and sub-Saharan African countries. Table 1 provides an overview of participating countries from the 2013/2014 and 2016/2017
cycles by World Bank income group. It is not surprising that there has been some degree of self-selection in the participating countries depending on the capacity
to provide the information requested. GLAAS continues to encourage countries to provide data through a government-led multi-stakeholder GLAAS country
process, and will continue to accept country submissions until mid-2017. In addition, support is being provided to an increasing number of countries for the
collection and compiling of WASH financing data through TrackFin (see Annex B). Despite the challenges, it is unquestionable that the current GLAAS report
FINANCING UNIVERSAL WATER, SANITATION AND HYGIENE UNDER THE SUSTAINABLE DEVELOPMENT GOALS
provides the most comprehensive information on WASH financing from countries and ESAs to date.
Table Breakdown of GLAAS participating countries in 2013/2014 and 2016/2017 by World
1 Bank income group
World Bank income group 2013/2014 (n=94) 2016/2017 (n=75)
Low income 29% 20%
Lower middle income 37% 40%
Upper middle income 28% 35%
High income 5% 5%
Not available 1% —
4Financial Planning: Estimating
the financing gap and needs to
meet the SDGs
Financial sufficiency to meet targets
Despite being a key determinant of public health and economic development, the WASH sector faces major obstacles in attracting
sufficient resources to meet its investment needs. In the GLAAS 2013/2014 cycle, during the MDG era, 80% of countries reported
that financial resources were insufficient to meet national targets established for drinking-water and sanitation, despite increasing
domestic budget allocations. More recent global estimates show a tremendous gap in financing to achieve the water supply,
sanitation, and hygiene SDG 6 targets, with capital investment needs alone three times higher than current investment levels.1
Results of the GLAAS 2016/2017 country survey support previous findings that the lack of adequate financial resources constrains
progress towards national goals. Over 80% of countries report insufficient finance for both urban and rural areas in meeting
national targets for drinking-water and sanitation, as well as those for water quality, a major component of SDG 6.
Table Is financing allocated to water and sanitation
2 improvements sufficient to meet national targets?
Per cent of countries reporting
sufficient finance to meet national targets (n= 70)2
Over 80% of countries report
Programme area Urban Rural
insufficient financing to meet
Drinking-water 22% 10%
national WASH targets
Sanitation 13% 10%
(Table 2 and Fig. 2).
Water quality 19% 9%
Source: GLAAS 2016/2017 country survey.
UN-WATER GLOBAL ANALYSIS AND ASSESSMENT OF SANITATION AND DRINKING-WATER • GLAAS 2017 REPORT
It is important to note that these country estimates of financial sufficiency are based on national targets and levels of service,
and therefore, are unlikely to fully consider all the elements of the safely managed standard (accessibility, availability and quality)
nor universal and equitable access by 2030, as envisioned in the SDGs. Currently, a majority of reported national WASH targets
are based on medium-term plans extending up to 2020 with targets set at levels below universal coverage. Fewer than 20% of
countries have set universal access targets for 2030 or sooner; however, a majority of countries3 are setting or planning to set
targets that take into account the SDGs. The lack of adequate financing to meet national targets will be magnified in the future
as SDG targets are integrated more fully into national plans.
1
Hutton G and Varughese MC (2016) The Costs of Meeting the 2030 Sustainable Development Goal Targets on Drinking Water, Sanitation, and Hygiene. Water and Sanitation Program Technical Paper, World Bank, Washington,
DC. Available at: http://www.worldbank.org/en/topic/water/publication/the-costs-of-meeting-the-2030-sustainable-development-goal-targets-on-drinking-water-sanitation-and-hygiene [Accessed 24 March 2017].
2
Insufficient finance is defined here as less than 75% of what is needed to meet national targets.
3
Based on an assessment of 40 countries that reported on this question in the GLAAS 2016/2017 cycle.
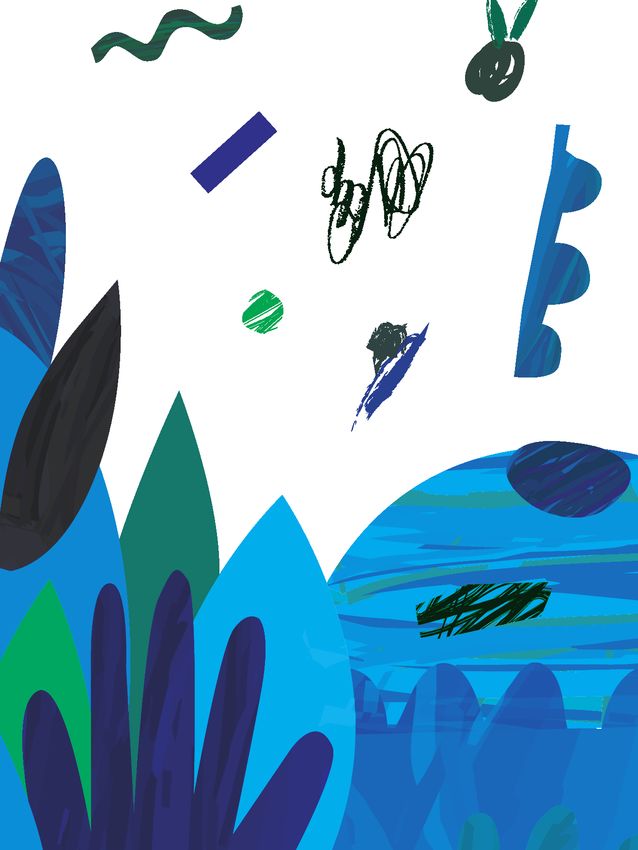
5Figure
2
Level of sufficiency of financial resources allocated to sanitation to meet national targets (n=71)
Is financing allocated to sanitation improvements sufficient to meet national targets?
More than 75% of what is needed for both urban and rural Less than 50% of what is needed for both urban and rural
More than 75% of what is needed for urban or rural Data not available
Between 50% and 75% of what is needed Not applicable
Less than 50% of what is needed for urban or rural
Source: GLAAS 2016/2017 country survey.
Lack of adequate financial resources threatens attainment of national goals
• In Ecuador, the National Strategy for Water and Sanitation set a ten-year target in 2014 of 100% coverage for water and sanitation services, which requires
a total estimated investment of US$ 7.3 billion. The National Strategy indicates that the state is currently investing US$ 350 million per year, which means
investments will need to be doubled. For drinking-water, US$ 2.4 billion is needed and for sanitation US$ 4.9 billion is needed (including for wastewater
treatment in the 10 largest cities representing 38% of the population). Urban needs are US$ 5 billion, while rural needs are US$ 2.3 billion.
• A Water Sector Infrastructure and Investment Framework in South Africa found that in 2016, a total annual capital investment of 82 billion rand
(US$ 6.4 billion) was required for WASH over the next 10 years, but currently available funding is only about 46 billion rand (US$ 3.6 billion) a year, i.e. only
FINANCING UNIVERSAL WATER, SANITATION AND HYGIENE UNDER THE SUSTAINABLE DEVELOPMENT GOALS
56% of capital needs are currently funded. Also, lack of investment in O&M is cited as a particular problem causing a number of schemes to not function
properly. There is an estimated annual sector maintenance shortfall of 44 billion rand (US$ 3.4 billion).
• Papua New Guinea has estimated that the sector needs US$ 100 million for capital expenditures and US$ 20 million for O&M per year. Water PNG has only
about 34% coverage of the population in the areas that have been declared Water PNG districts.
Identifying financial needs through national assessments
Responsibilities for the planning, organization, delivery, maintenance and evaluation of drinking-water supply and sanitation
services remain fragmented over different public sectors and at different levels of administration. For practical purposes, reference
continues to be made to the WASH sector (with hygiene added as a non-service based element), yet a main enabling environment
challenge is how to overcome fragmentation and achieve a greater level of cohesion and efficiency. One way to address this
challenge is by holding a joint sector review (JSR).
Periodic government-led JSRs aim to bring different stakeholders, including development partners, together to engage in
dialogue, review status, progress and performance, and take decisions on priority actions. A JSR also provides an opportunity to
discuss the current financial situation for WASH as well as upcoming needs. Due to the fragmented nature of the WASH sector in
which multiple institutions can play leading roles in the provision of services, periodic JSRs have been effective in highlighting
issues and creating substantial changes in policy, strategy, and programming – especially contributing to the development of
financing strategies in a number of countries.
6More than 60% of responding countries indicate that the government has conducted a JSR in the past three years (i.e. 2014–2016).
However, few countries explicitly mentioned finance as a topic covered in these reviews. Both Kenya and Liberia noted that
WASH financing had been covered specifically in their most recent JSR. Additionally, Costa Rica and Madagascar noted that JSRs
had led to investment plans, and in Mozambique, the JSR sparked awareness of the need to mobilize investments to expand
WASH systems that were experiencing increasing demand. Further information and guidance on JSRs and specific case studies
are available online.1 Public expenditure reviews are also an opportunity for governments to analyse the effectiveness of public
finance, including for water and sanitation.2
JSRs, finance and target setting in Pakistan
In early 2016, the Parliament of Pakistan adopted a resolution declaring the SDGs to be national development goals, which created momentum at both the national
and provincial levels to assess the current situation and develop a baseline. From there, provinces are using JSRs to discuss their current WASH status and levels
of financial expenditures. The reviews, along with the use of an SDG costing tool, will contribute to setting national and provincial WASH targets by June 2017.
Data availability for decision-making
Lack of data is often cited as an impediment to financial planning and performance tracking. For WASH investment planning, data
needed to estimate future needs and resources can include information such as: coverage levels and targets, predicted population
growth, an up-to-date inventory of assets and their current condition, cost and performance data, availability of external funds,
domestic budget execution performance, and estimated trends in demand for services. The availability of information for decision-
making was cited by countries as relatively good, with nearly 70% of countries indicating that data are available, analysed and
used (at least partially) for decisions regarding resource allocation for sanitation and drinking-water (Fig. 3). However, countries
did not report on the quality of the information or whether it was used specifically for decisions in rural or urban areas. Countries
are also using data in decisions regarding WASH and health. Over 70% of countries indicated that data are available, analysed
and used (at least partially) for identifying public health priorities for reducing WASH-related diseases, and for decisions regarding
response to WASH-related disease outbreaks, over 80% of countries report using data in their decision-making.
Figure Are data collected and used to inform decisions on resource
3 allocations? (n= 65)
60% —
Drinking–water
UN-WATER GLOBAL ANALYSIS AND ASSESSMENT OF SANITATION AND DRINKING-WATER • GLAAS 2017 REPORT
Sanitation
50% —
Nearly 70% of countries
indicate that data are
40% —
available and used for
Per cent of countries
decisions for resource
30% —
allocation for sanitation
20% — and drinking-water.
10% —
0—
Limited data Partial data Data available, Data available,
collected and available, but not analysed and used analysed and used
limited availability generally used in a minority of in a majority of
decisions decisions
Source: GLAAS 2016/2017 country survey.
However, when asked specifically about the availability of WASH expenditure reports, many countries still indicate difficulties in
gathering consolidated data, such as financial information on WASH across ministries and committed versus disbursed information
on external finance. For example, Cambodia reports that the WASH sector has no sector-wide approach and that there is no
1
Danert K, Furey S, Mechta M and Gupta S (2016) Effective Joint Sector Reviews for Water, Sanitation and Hygiene (WASH). A Study and Guidance – 2016. Water and Sanitation Programme of the World Bank, Washington, DC.
Available at: http://www.rural-water-supply.net/_ressources/documents/default/1-757-3-1463486911.pdf [Accessed 8 March 2017].
2
More information on public expenditure reviews can be found here: http://wbi.worldbank.org/boost/tools-resources/public-expenditure-review [Accessed 24 March 2017].
7You can also read