Capturing economic and social value from hydrocarbon gas flaring and venting: solutions and actions - WIDER Working Paper 2021/6 - unu-wider
←
→
Page content transcription
If your browser does not render page correctly, please read the page content below
WIDER Working Paper 2021/6

Capturing economic and social value from
hydrocarbon gas flaring and venting: solutions
and actions

Etienne Romsom and Kathryn McPhail*

January 2021
Abstract: This second paper on hydrocarbon gas flaring and venting builds on our first, which
evaluated the economic and social cost (SCAR) of wasted natural gas. These emissions must be
reduced urgently for natural gas to meet its potential as an energy-transition fuel under the Paris
Agreement on Climate Change and to improve air quality and health. Wide-ranging initiatives and
solutions exist already; the selection of the most suitable ones is situation-dependent. We present
solutions and actions in a four-point (‘Diamond’) model involving: (1) measurement of chemicals
emitted, (2) accountability and transparency of emissions through disclosure and reporting, (3)
economic deployment of technologies for (small-scale) gas monetization, and (4) an ‘all-of-
government’ approach to regulation and fiscal measures. Combining these actions in an integrated
framework can end routine flaring and venting in many oil and gas developments. This is
particularly important for low- and middle-income countries: satellite data since 2005 show that
85 per cent of total gas flared is in developing countries. Satellite data in 2017 identified location
and amount of natural gas burned for 10,828 individual flares in 94 countries. Particular focus is
needed to improve flare quality and capture natural gas from the 1 per cent ‘super-emitter’ flares
responsible for 23 per cent of global natural gas flared.
Key words: energy transition, gas, health, climate, air quality
JEL classification: Q3, Q4, Q5
Acknowledgements: We would like to thank Tony Addison and Alan Roe for reading and
commenting on an earlier version of this paper.
Notes: This study is complemented by an earlier WIDER Working Paper written by the same
authors (Romsom and McPhail 2021): ‘Capturing Economic and Social Value from Hydrocarbon
Gas Flaring and Venting: Evaluation of the Issues’.
Abbreviations and units are at the end of the paper.

* Both authors: EnergyCC, Singapore, info@enerycc.com, www.energycc.com
This study has been prepared within the UNU-WIDER project Extractives for development (E4D)—risks and opportunities,
which is part of the Domestic Revenue Mobilization programme. The programme is financed through specific contributions by
the Norwegian Agency for Development Cooperation (Norad).
Copyright © UNU-WIDER 2021 / Licensed under CC BY-NC-SA 3.0 IGO
Information and requests: publications@wider.unu.edu
ISSN 1798-7237 ISBN 978-92-9256-940-2
https://doi.org/10.35188/UNU-WIDER/2021/940-2
Typescript prepared by Luke Finley.
The United Nations University World Institute for Development Economics Research provides economic analysis and policy
advice with the aim of promoting sustainable and equitable development. The Institute began operations in 1985 in Helsinki,
Finland, as the first research and training centre of the United Nations University. Today it is a unique blend of think tank, research
institute, and UN agency—providing a range of services from policy advice to governments as well as freely available original
research.
The Institute is funded through income from an endowment fund with additional contributions to its work programme from
Finland, Sweden, and the United Kingdom as well as earmarked contributions for specific projects from a variety of donors.
Katajanokanlaituri 6 B, 00160 Helsinki, Finland
The views expressed in this paper are those of the author(s), and do not necessarily reflect the views of the Institute or the United
Nations University, nor the programme/project donors.
1     Introduction

Natural gas is seen as an important energy source in the energy transition towards a light-carbon
or zero-net-carbon future. In many comparison studies for climate and air quality, gas is a more
beneficial fuel than coal and heavy fuel oil in power generation, industrial use, and transportation.
However, the benefits of the use of natural gas are significantly impaired when global emissions
from gas flaring and venting are considered.

Routine flaring and venting of natural gas are generally accepted practices and are pervasive in the
oil and gas industry. The main purpose is to get rid of associated petroleum gas (APG), a by-
product in the production of oil. The decision to flare or vent natural gas by oil and gas companies
is often based on commercial criteria that exclude externalities such as air quality, health and
climate impact. Moreover, flaring and venting wastes a valuable energy source that could be
captured and utilized for beneficial purposes.

In our first working paper on gas flaring (Romson and McPhail 2021), we established the scale,
scope, and impact of hydrocarbon flaring and venting. Linking GGFR, IEA, EPA, and other data
sources, our first working paper provides an integrated assessment of natural gas flared and vented
by the oil and gas industry, including the amounts and damages of chemicals released into the
atmosphere.

The history of gas flaring and venting has shown that large fugitive emissions and large volumes
of flaring are not inevitable by-products of oil production. Between 1996 and 2010, significant
progress was made to reduce gas flaring among the top 30 emitting countries, with Nigeria and
Russia as notable examples. Between 1994 and 2014, overall volumes of fugitive emissions—which
include gas flaring—increased. Nevertheless, there are also regions and countries which
significantly reduced fugitive emissions, including the EU (−44 per cent), Nigeria (−28 per cent),
and Ukraine (−11 per cent). Trends in gas flaring over time show that although there is overlap
between large oil-producing countries, countries with high fugitive emissions, and top flaring
countries, there are also a number of countries that have managed to reduce flaring even while
increasing oil production. Countries such as Angola, China, Kuwait, Russia, Kazakhstan, and Qatar
were able to increase oil production or keep it stable while, at the same time, reducing gas flaring.
Saudi Arabia and Canada similarly increased oil production while keeping gas flaring stable.
Norway, Kuwait, Qatar, UAE, and Saudi Arabia have relatively low flaring in view of the size of
their oil production. It is also possible to have large oil production without having large fugitive
emissions (Saudi Arabia, UAE, Brazil).

Flaring is not necessarily linked to the stage of oil development, to increasing oil production, or to
the overall size of oil production. Since 1994, the ‘rest of the world’ countries outside the flaring
top 30 countries reduced their flaring volumes by 36 per cent. The argument that routine flaring
occurs mainly in the early production phase to allow gas infrastructure development to catch up is
often not substantiated by the data. This is especially noteworthy, as it is the top five flaring
countries that have some of the most developed and mature oil and gas infrastructure: Russia, Iraq,
the US, Iran, Venezuela.

A major result of our first working paper on gas flaring is to show these atmospheric releases and
their social impact in a consistent representation. Different emissions affect climate, air quality,
health, and environment differently. These wider-ranging impacts from this broader spectrum of
releases are captured in a multi-impact economic valuation framework of social cost of
atmospheric release (SCAR) that assigns a social cost per ton for each individual release, including:

                                                  1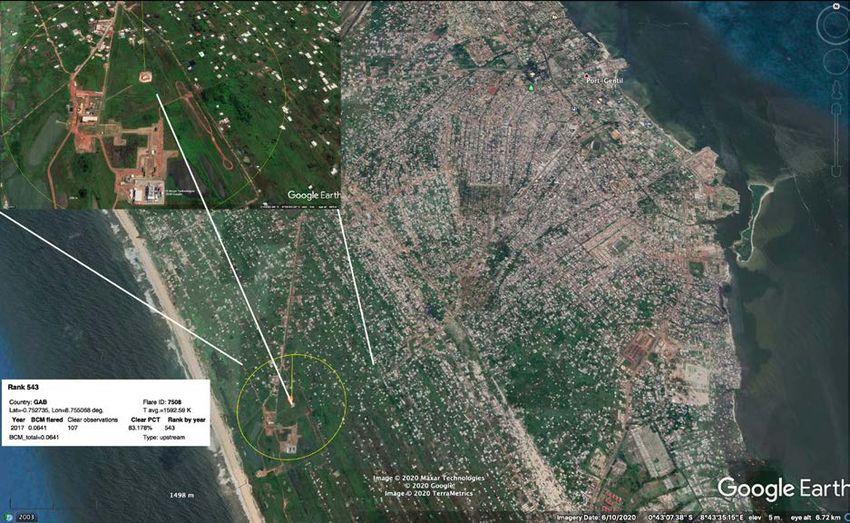
carbon dioxide (CO2), methane (CH4), black carbon (BC), nitrogen and sulphur oxides (NOX and
SOX), volatile organic compounds (VOCs), organic carbon (OC), carbon monoxide (CO),
ammonia (NH3) and nitrous oxide (N2O); see Figure 1.
Figure 1: Impact categories’ contributions to Shindell social cost of atmospheric releases

Source: authors’ illustration based on 2015 data from Shindell (2015), corrected for NOX and VOC added.

Some 6.9 per cent of globally produced natural gas is flared (3.7 per cent) or vented (3.2 per cent)
in upstream oil and gas operations, contributing half of the total SCAR of natural gas. Downstream
venting adds an additional 0.7 per cent, bringing the global total of gas flared and vented to 7.6 per
cent. The global volume of natural gas flared and vented has not reduced since the year 2000.
Because of poor flaring operations, the social cost per volume flared is 12.6 times higher than
under perfect combustion. Therefore, poor flare operations negate most of the benefits that flaring
has over venting (the SCAR for venting is 16 times higher than for perfect combustion); see
Figure 2. In addition to continued efforts to put flares out, work to improve the quality of flaring
(thus avoiding super-emitter flares) is an obvious low-cost/high-impact opportunity. Various
countries have shown positive results in reducing flaring and fugitive emissions, providing
experience that others can build on.

The global social cost of flaring and venting emissions exceeds the sales value of the global gas
marketed by a factor of 1.5, assuming a global average gas price of US$4/MMBtu. This analysis
provides unambiguous support to the imperative to reduce, and eliminate as far as is practically
possible, the impact of natural gas flaring and venting. Also, these social cost estimates can guide
stepwise solutions, such as the conversion of vents into flares and from poor-quality to high-
quality flaring (i.e. a system and operations that provide 98 per cent destruction efficiency) and
avoiding super-emitter flares.

                                                         2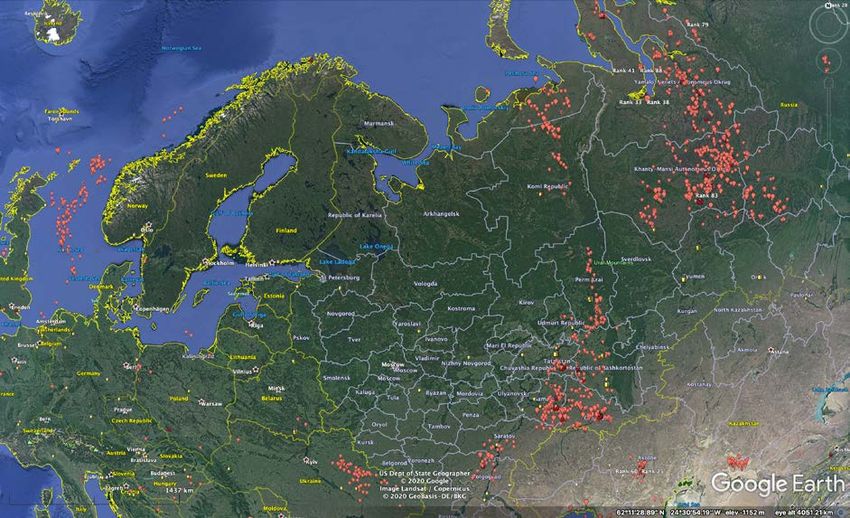
Figure 2: Overview of the social cost of flaring and venting relative to the volume and impact of global natural gas
produced

Note: the SCAR (in $ bn) from upstream flaring and venting, representing less than 7% of the volume of
produced natural gas, exceeds the SCAR from downstream gas combustion (92% of produced natural gas);
emissions are based on 2017 data; costs in 2019 US$.
Source: reproduced from Romsom and McPhail (2021), Figure 18.

Furthermore, the application of gas capture technologies for unprocessed natural gas can create
significant revenue opportunities. If 75 per cent of all natural gas flared and vented globally were
to be captured, it would provide an additional natural gas sale value of US$40 bn per year
(assuming an average gas price of $4/MMBtu). These commercial opportunities are particularly
significant for low- and middle-income countries dependent on oil and gas production. Satellite
data since 2005 show that 85 per cent of total gas flared is in developing countries. Moreover,
improvements in air quality and reduction in regional aerosol-induced hydrologic cycle changes
provide benefits in health and for other economic activities, such as agriculture, that are expected
to significantly increase the added value from these emission reductions. If all the natural gas flared
and vented globally were to be captured and brought to market, it could supply more than all of
South and Central America’s gas consumption, plus all of Africa’s power needs.

This second working paper further addresses the integrated framework (which we refer to as the
‘Diamond model’) to end routine flaring and venting. This model combines four elements: (1)
improved measurement of vent and flare gas production and emissions; (2) accountability,
transparency, and reporting of gas production and emissions; (3) small-scale gas development and
monetization technologies; and (4) regulation and fiscal measures. Incorporating the
socioeconomic cost analysis, detailed in our previous paper, into the Diamond model provides the
means to construct an abatement strategy that captures both the economic and the social value
from hydrocarbon gas flaring and venting.

                                                         3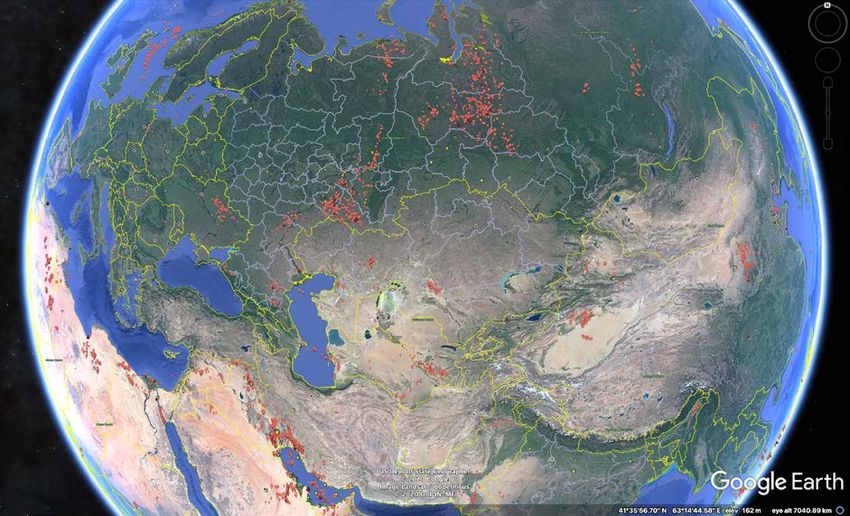
2      Overcoming impediments to reducing natural gas flaring and venting

In our previous working paper, summarized in the previous section, we presented the magnitude
and trends of flaring and venting in oil and gas operations, as well as their emissions and impact
on health and climate. It is important to realize that natural gas is not a waste product, even though
generally tolerant attitudes towards flaring and venting may give the impression that it is.
Moreover, narrowly focused oil and gas companies may wish to argue that routine flaring and
venting is a necessary sacrifice to avoid a greater waste—that is, leaving hydrocarbons behind in
the ground if they are not allowed to flare and vent. However, it is worth re-emphasizing that
prudent operators can reasonably be expected to execute development plans and conduct
operations that limit climate and environmental impacts and that are sufficiently robust to
accommodate the costs of doing so.

The discussion on how stakeholders define ‘waste’ is also important. It is not ‘waste’ to leave
hydrocarbons in the ground until the infrastructure is available to process and properly evacuate
the production streams. The hydrocarbons are therefore not lost but merely deferred until these
conditions are met. The simplest way to achieve the necessary gas infrastructure is to implement
oil and gas regulation that makes it mandatory to have a development solution for APG. However,
this is not a common practice. Norway is one of the few countries which have policies and
regulations that disallow the practice of routine flaring to produce oil. A second impediment to
stopping routine flaring practices is the ability to enforce such regulations. Exception permits are
too easily handed out. Field observations to monitor local emissions are seldom (if ever) carried
out, or are conducted inadequately. Apart from capacity, this is also a capability issue.

The measurement of fugitive emissions, including flaring and venting, is difficult in the absence of
(accurate) metering. Flared and vented APG streams are generally not measured. Hence, data are
sparse and estimates often unreliable. Remote sensing technologies are increasingly capable of and
accurate in monitoring fugitive emissions, particularly those from gas flares. In addition, flow
metering of flare and vent gas, as well as regular gas sampling for compositional analysis, could
and should be made mandatory in situations where these practices are approved. The practice of
using emission factors should be restricted to their use in comparing actual measured data with
what are considered minimum performance criteria. The use of emission factors for estimation
purposes is not reliable, as our flare examples in working paper 1 demonstrated (Romsom and
McPhail 2021).

The self-reporting of flare and vent data without a validation process currently causes systematic
under-reporting of these resource streams. Hence, governments do not have a picture of the true
scale of the opportunity costs and the potential value for the country. There is therefore less
incentive to facilitate the infrastructure developments necessary to capture the natural gas that is
being wasted. Third-party assessment of fugitive emissions is an important mechanism to improve
data reliability. Regulators should not only require measurement of flare and vent streams to assess
their volumes, they should also measure flare properties to improve their operational performance
and minimize negative environmental impact. Given their disproportionately large environmental
impact, the occurrence of super-emitter flares 1 should be avoided and penalties imposed for not
meeting flare quality standards. Measurement of air quality should also be part of a mandatory

1
  A super-emitter gas flare creates a very large SCAR due to its high flow rate (i.e. more than 5 MMscfd) and/or its
poor flaring quality (i.e. a destruction efficiency of 80% or lower, releasing ten times or more the amount of chemicals
other than CO2 compared with a well-operated flare under similar flow rates). Based only on flow rate considerations,
a small fraction (6.6%) of all global flares are super-emitters, consuming 61% of natural gas flared (see also Figure 18).

                                                            4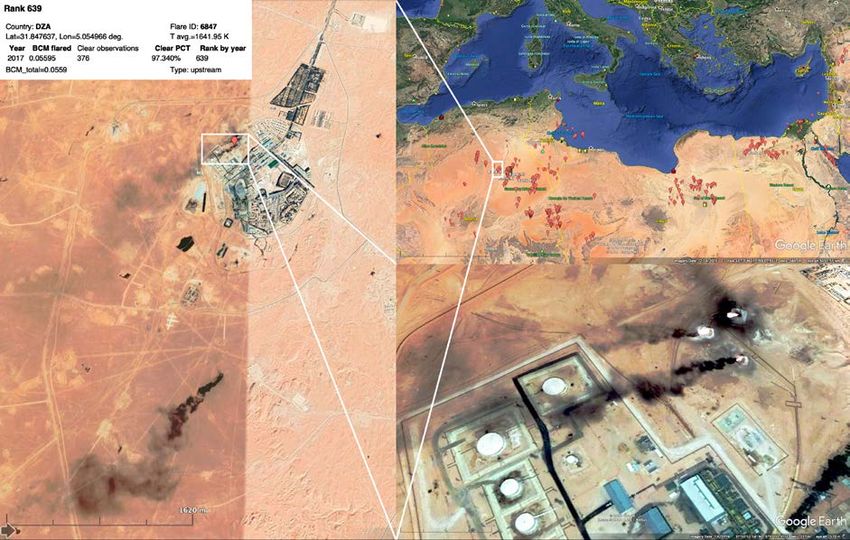
measurement scheme. As gas flaring is easier to detect and monitor, there is a risk that oil
producers dispose of their gas though vents instead of gas flares to avoid detection. Improved
methane detection levels and high spatial resolution from satellite sensors are important tools to
ensure the improved measurement of methane emissions and the compliance of producers.

In unconventional oil and gas, as well as in other onshore oil and gas provinces, there are many
small individual producers. In these oil developments, economies of scale are less critical.
However, for the commercial development of APG it is often necessary to aggregate the produced
gas from multiple producers to achieve sufficient economies of scale. There is a role for
government and regulations to facilitate and incentivize such initiatives. When local gas markets
are lacking, regulations that require ownership of the gas produced to be centralized in the state
can provide governments and regulators with better options to facilitate the monetization of this
resource. For example, the state could sell the gas rights of a large production area to an aggregator
to facilitate development.

Governments and regulators may want to price the cost of externalities, such as emissions of gases,
particulates, produced water, energy inefficiency, etc., in to the fiscal framework for oil and gas
taxation. Whereas development of APG may not meet commercial thresholds, such fiscal
measures improve the commercial break-even for gas monetization projects and incentivize
producers to utilize resources that would otherwise be wasted. Other incentives to reduce flaring
and venting could include common infrastructure to aggregate the gas, improving access to
markets (transportation and local market development), benchmarking and best practice sharing,
technology development and implementation (e.g. sponsored piloting of technologies), etc.
Governments may also reduce barriers to provide tax credits for the importation of certain
technologies and equipment that could make APG developments commercial, when such
equipment cannot be locally fabricated.

Finally, governments could stimulate local gas market development, or in the case of gas-to-wire,
stimulate electricity market development by providing gas price guarantees or electricity feed-in
tariffs over a limited period of time to promote infrastructure development while reducing
investment risk. Such measures would be best co-ordinated with the government’s strategy on
renewables expansion, particularly since natural gas supports renewables in power generation
(Romsom and McPhail 2020b).

International financiers and organizations that have adopted the UN Sustainable Development
Goals (SDGs) as part of their development strategies could provide further resources to facilitate
development while reducing wasteful emissions. Capturing hydrocarbons by avoiding upstream
flaring and venting offers significant opportunities to contribute to many SDGs, including
Agriculture (SDG2), Good Health and Well-being (SDG3), Gender Equality (SDG5), Sustainable
Cities and Communities (SDG11) in addition to Energy Access (SDG7) and Climate Action
(SDG13).

In conclusion, there are wide-ranging initiatives and solutions to overcome the current
impediments to the utilization of APG. The selection of which initiatives are most suited is
situation-dependent. However, the continuous improvement of gas monetization technologies, in
combination with improved measurements, accountability, transparency, and reporting and with
regulations and fiscal measures, provides the potential for an integrated framework to end routine
flaring and venting in many oil and gas developments (see Figure 3). This is particularly important
for low- and middle-income countries, as satellite data since 2005 show that 85 per cent of total
gas flared is in developing countries.

                                                  5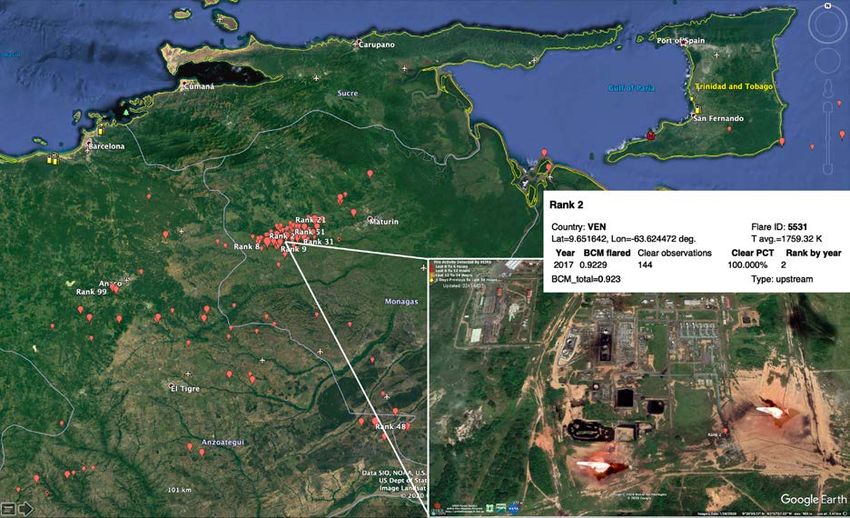
The paper now turns to a more detailed discussion of these categories of possible initiatives as
summarized in the ‘Diamond model’ diagram in Figure 3.
Figure 3: Integrated ‘Diamond model’ framework to end routine flaring and venting

Source: authors’ illustration.

3      Improved measurement of vent and flare gas production and emissions

We consider the following component issues in this section of the paper: metering of flared and
vented gas; remote sensing of satellites to assess flaring and venting; Nigeria’s Gas Flare Tracker;
and systemic under-reporting of emissions.

                                                       6
Measurement of vent and flare gas: key points
      •     Natural gas that is being flared and vented is seldom metered. Reliable and continuous metering and data
            logging should be required for every vent and flare exceeding a minimum size, to assess volumes emitted
            and to establish opportunity costs and social costs from these practices. Metered flare and vent data can
            also provide the basis for fiscal measures.
      •     Under-reporting of flaring and venting appears to be a systemic issue in the oil and gas industry. Third-
            party verification for atmospheric emissions is absent. Without reliable data, the development of flaring
            and venting reduction solutions is being hampered.
      •     In the absence of physical meters, satellite data are being used to establish volume estimates for individual
            flares. Such technology is now also becoming practicable for methane emissions. In some countries, such
            as Nigeria, VIIRS Nightfire (VNF) satellite data are being used as the basis for determining the taxation
            of individual oil and gas companies for the gas that they flare.
      •     When different satellite data are combined, this provides higher accuracy on volumes flared. In particular,
            poorly operated flares with a high degree of smoking are likely to be underestimated by VNF.
      •     Even more importantly, satellites that measure other emissions (such as NO2, SO2, methane, etc.), when
            combined with VNF, can provide key information on flaring quality. SCAR damages from flaring increase
            dramatically when flares are poorly operated.
      •     Flare quality is seldom measured, and regulatory frameworks are inadequate or not enforced.
            Consequently, operational standards and the compliance of oil and gas operators in their flaring and
            venting practices are often poor.
      •     Further work is needed to develop models that calibrate satellite observations with metered data and other
            local emissions data, to enable satellite-based SCAR assessments for individual flares.
      •     Combining emission data from individual flares and vents with transport models and other geographical
            information (such as population density) allows the assessment of regional distributions of SCAR from
            local emitters.
      •     The combination of satellite data for flaring and venting and geographical information also provides the
            opportunity to rank flares and vents on their potential for commercialization. Natural gas rates and
            distance to market are the two key criteria for gas capture and monetization.
      •     It is critical that satellite data of atmospheric emissions are made available in the public domain (as is the
            case for VNF) and therefore accessible to third parties for verification and to the public for transparency.
            There is a risk that commercial satellites may limit data sharing by imposing charges, or by granting
            proprietary access to data on flare and vent areas to emitting companies only.

The lack of reliable data from venting and flaring has been an obstacle to understanding the true
scale and impact of these emissions. There are multiple reasons why data are lacking.

3.1       Metering of flared and vented gas

Natural gas that is being flared and vented is seldom metered. Observational studies from gas
flaring highlight the need for continuous and high-density read-outs of flare emissions.
Unprocessed gas streams can be highly irregular in terms of flow rates and composition. Conrad
and Johnson (2017) highlight flow irregularity as a particular concern. In one flaring example,
10 per cent of the instantaneous flare data was responsible for 56 per cent of the measured black
carbon (BC) emissions. This flow irregularity requires metering technology that can handle the
dynamic range in terms of rates and composition. Individual point measurements may not be
reliable, and continuous metering and data logging are required. Moreover, regular physical
sampling of the flare stream for compositional analysis can assist flare (re-)design and good
operations. In addition, using local optic measurements to determine the degree of smoking of
flares is a proven method of assessing flare quality and BC emissions.

                                                             7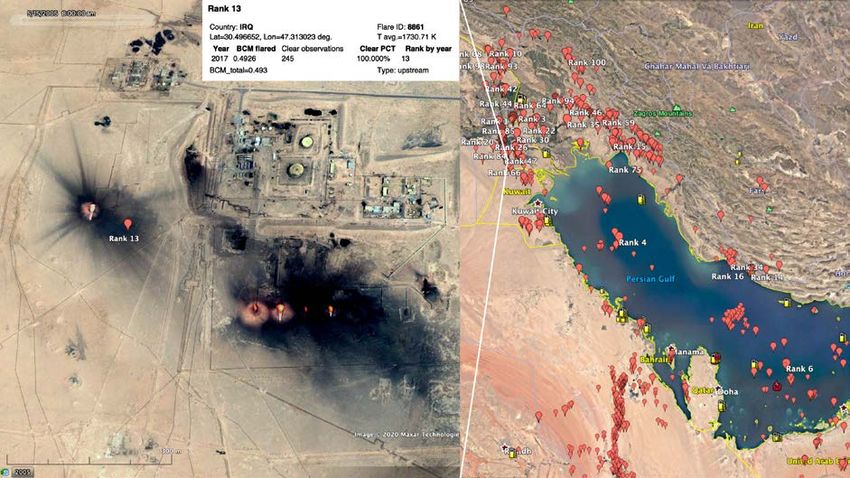
3.2      Remote sensing by satellites to assess natural gas flaring

In addition to physical metering on flaring and venting sites, technology advancements now also
provide the opportunity to measure emissions from space using specialized satellite sensors. This
has a number of advantages:

       • there is no need to make investments in local meters;
       • there is no requirement for site access to assess flaring and venting operations: data
         aggregation and processing can be done remotely and does not require local resources;
       • satellite data provide an independent and objective assessment;
       • a high degree of spatial resolution enables atmospheric emissions to be attributed to
         individual emission sources, but also to be easily aggregated;
       • satellite data are generally in the public domain and therefore accessible by third parties
         for verification, promoting transparency;
       • multiple satellite overpasses enable daily measurements, during both day and night-time;
       • satellite sensors can distinguish the release of different chemicals and thereby enable SCAR
         assessments that are based on chemical compositions;
       • combining information from different satellite sensors can improve spatial and emission
         volume accuracy;
       • satellites can assess not only the point of emission but also the subsequent distribution of
         atmospheric releases, enabling SCAR assessments that are geography dependent.

Since the launch of the Suomi National Polar-Orbiting Partnership (S-NPP) satellite on 21
November 2011, its Visible Infrared Imaging Ratiometer Suite (VIIRS) is regularly used by
multiple organizations for the remote assessment of natural gas flaring (see Table 1 and Figure 4).
The VIIRS source data are made publicly available by the US National Oceanic and Atmospheric
Administration (NOAA). 2 With 22 imaging and radiometric bands covering wavelengths from
0.41 to 12.5 microns, VIIRS has a wide range of applications, 3 including the detection of radiant
heat from fires such as flares. During night-time overpasses, the VIIRS is able to make use of both
visible light and infrared detectors to identify night fires (VNF), significantly improving detection
of smaller hotspots. Gas flares are identified as small, high-intensity, and high-temperature heat
sources of fixed location and can be distinguished from other fires and hotspots (Elvidge 2015).
The current VNF detection limit is 0.26 m2 for 1,800 K heat sources such as flares. New algorithms
using multiple spectral bands can further enhance this flare detection threshold (Elvidge et al.
2019). The integration of VIIRS data with other satellite sensor data and oil and gas field and
facility databases can further eliminate potential false positives. VIIRS has been successfully
deployed in a large number of studies and applications.

2
    NOAA, ‘Visible Infrared Imaging Radiometer Suite (VIIRS)’, Washington, DC: US Department of Commerce.
3
  VIIRS provides sensor data records for more than 20 environmental data categories including clouds, sea surface
temperature, ocean colour, polar wind, vegetation fraction, aerosol, fire, snow and ice, vegetation, and other
applications.

                                                       8
Table 1: Top 100 gas flares in 2017, as identified by VIIRS
Number of flares in the Top 100 flares per country
global top 100
Iraq 31 1, 5, 7, 11, 12, 13, 19, 20, 26, 29, 30, 32, 36, 39, 42,
47, 49, 52, 54, 56, 57, 58, 66, 74, 76, 80, 84, 85, 89,
93, 98
Iran 22 3, 4, 6, 10, 14, 15, 16, 22, 23, 34, 35, 44, 46, 59, 64,
65, 68, 69, 75, 91, 94, 100
Venezuela 10 2, 8, 9, 21, 31, 48, 51, 61, 82, 99
Russia 13 17, 28, 33, 38, 40, 41, 63, 67, 70, 79, 81, 83, 88
Nigeria 7 18, 71, 73, 77, 78, 86, 96
Angola 4 24, 62, 72, 87
Kazakhstan 2 25, 60
Algeria 5 27, 43, 45, 95, 97
Mexico 3 37, 53, 55
Malaysia 1 50
Egypt 1 90
Syria 1 92
Note: as an example of a top-100 flare, the second-largest global flare in 2017, located in Venezuela, is shown in
Figure 5.
Source: authors’ construction based on NOAA VIIRS data.
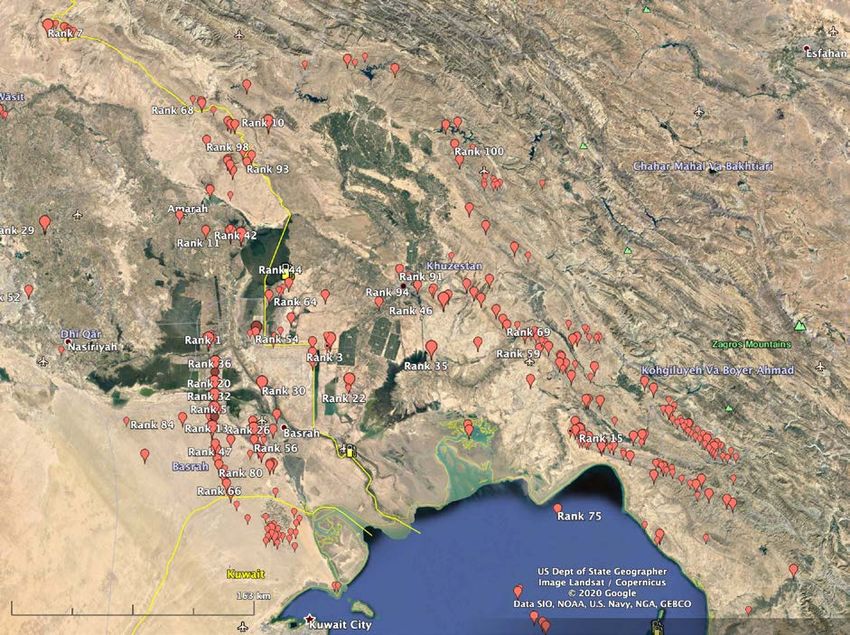
Figure 4: Top 100 gas flares in 2017, as identified by VIIRS
Note: Iraq has the most flares in the top 100, followed by Iran and Venezuela; the top four countries with the
greatest flaring volume are Russia, Iraq, Iran, and the US, respectively (Romsom and McPhail 2021).
Source: authors’ illustration based on NOAA VIIRS data.
9VIIRS determines flare rates from emitted light and heat. If the flare quality is bad and the flare is
emitting a lot of smoke, this can partially obscure the flare and so influence the volume estimate.
Therefore, once VIIRS has identified flare locations, it is good practice to get complementary
information on flares by remote sensing from other satellites, such as data from the OMI (Ozone
Monitoring Instrument) on board NASA’s Aura satellite. Combining sensor input not only
provides more accurate rate estimates, but can also provide a detailed picture on individual
chemical releases that determine flare quality and SCAR. Appendix A gives an overview of
individual gas flares detected by VIIRS. It should be noted that in addition to routine flaring to
dispose of natural gas as a waste product, many other flares are installed as emergency devices to
divert natural gas and perform blow-down of oil and gas facilities to safely respond to operational
upsets. Such flares emit occasionally high flare rates for short periods of time.
Figure 5: Identification of the second-largest flare globally, in Venezuela
Note: this Venezuelan flare burned an estimated 0.92 bcm of natural gas in 2017, accounting for 13% of natural
gas flared in Venezuela and 0.66% of global natural gas flared that year.
Source: authors’ illustration based on a combination of Google Earth images with 2017 VIIRS data.
3.3 Gas flaring tracker in Nigeria
With an estimated flaring volume of 7.8 bcm per year, Nigeria ranks globally as the seventh-largest
gas flaring nation. However, it has made remarkable progress in creating a Gas Flare Tracker that
assesses flaring sources across the country based on daily VIIRS satellite data. Historically, these
data have been very difficult to compile because of the multitude of sources, the geographical
distribution, and difficulty of local access. A key driver for the Nigerian government in developing
the Gas Flare Tracker is the potential tax income levied on the oil and gas companies based on
their volume of gas flared. Comprehensive and accurate measurement of flaring data by source
and owner is therefore a key objective for the government of Nigeria. The flaring data are publicly
10available on a website, 4 displaying a map of all of the gas flares in the region, with details per asset
and over time on gas being flared. The potential for alternative use for the Nigerian gas currently
flared is substantial: close to 28,000 gigawatts of power could be generated, which could provide
40 per cent of Nigeria’s electricity demand. This is particularly relevant in Nigeria, where reliable,
round-the-clock electricity is generally lacking. Measuring gas flared and taxing the flaring
companies is a key step to disincentivizing flaring and promoting alternative use of natural gas.
However, other hurdles would need to be overcome to aggregate the APG and make the required
infrastructure and power investments. More stringent enforcement of tax collection and fines is
also needed.
Nigeria’s gas flaring tracker was developed with support from the UK’s Department for
International Development and is being managed and maintained by Nigeria’s National Oil Spill
Detection and Response Agency (NOSDRA). Part of the effort to establish a reliable gas flaring
tracker for Nigeria was the development of a reliable method of calibrating reported and satellite-
observed flare data (Hodgson 2018). Although this type of calibration has been carried out in the
past and methods used are well documented, the Nigeria study was the first to use many ground-
sourced, monthly gas flare data points (280) from the Niger Delta to try to create a calibration that
works on both local and regional levels. Inputs to the satellite calibration were the reported flare
volumes supplied by oil companies to the Nigerian National Petroleum Corporation (NNPC).
Although the NNPC dataset was imperfect, a scalable calibration equation was devised using VNF
data. Errors in the flaring estimates correlate strongly with the number of data observations.
Intermittent or irregular flares, and the presence of clouds, can affect the number of VNF data
points to support the flaring estimates. Multi-satellite and multi-sensor data can significantly reduce
these uncertainties, as well as improving the calibration methodology by addressing the impact of
flare quality on flare volume assessments (see Figures 6, 7, 8, and 9).
4
See https://nosdra.gasflaretracker.ng and https://gasflaretracker.ng.
11Figure 6: Comparison of reported and VNF-estimated flare data in Nigeria
Note: the NOSDRA Gas Flare Tracker provides good average comparison between estimated and reported flare
volumes. However, VNF data occasionally fail to pick up short-term trends in reported flare data. This could be
due to lack of data (e.g. cloud overcast), high-smoke flares obscuring the flame, or other flare quality issues.
Source: NOSDRA (National Oil Spill Detection and Response Agency). This figure is reproduced here under fair
use for research, knowledge-sharing, and educational purposes.
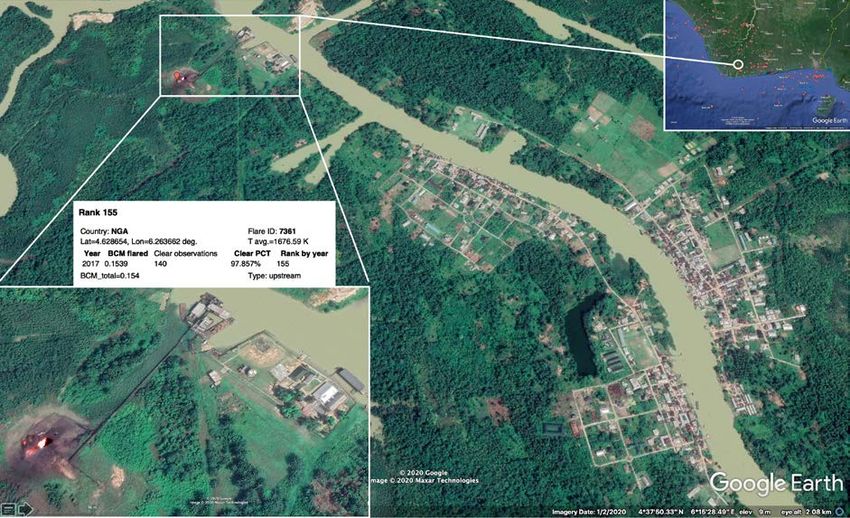
Figure 7: Identification of a flare (ranked 155th) near a village in the Niger Delta in Nigeria
Source: authors’ illustration based on a combination of Google Earth images with 2017 VIIRS data.
12Figure 8: Identification of a super-emitter flare, located in Iraq
Source: authors’ illustration based on a combination of Google Earth images with 2017 VIIRS data.
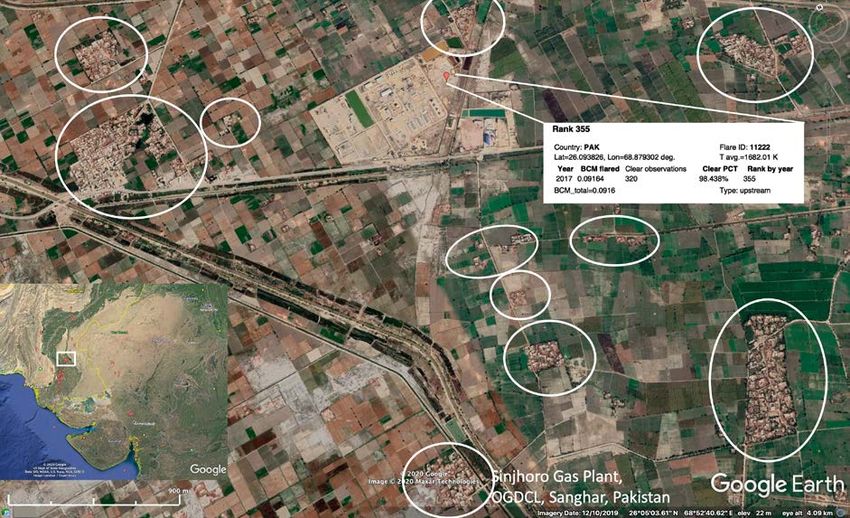
Figure 9: Example of smoking flares in Algeria, ranked 639th in 2017
Source: authors’ illustration based on a combination of Google Earth images with 2017 VIIRS data
133.4 Remote sensing by satellites to assess natural gas venting
The estimation of methane emissions through leaks or deliberate venting of natural gas has
historically been hampered by a lack of accuracy in estimates, with a discrepancy between bottom-
up and top-down estimates. Bottom-up methodologies are based on point sources and deliver
higher accuracy per source point, yet they may fail to identify all point sources. Top-down estimates
determine the amount of methane in a larger area, yet they may wrongly assign such volumes to
certain assets, thereby overestimating the amount of release by these assets. In our first flaring
report, we provided additional information on the importance of the combination of higher
accuracy and more comprehensive data-gathering on methane releases. Recent improvements in
satellite detection equipment may now start to identify methane emitters with higher spatial
accuracy and across larger areas. The first time a satellite was able to observe a high-resolution
methane release and attribute this detection to a single facility was in 2016 (see Figure 10). Since
then, satellite capabilities have improved further. On 2 September 2020, GHGSat launched Iris, a
new satellite to measure methane emissions with a spatial resolution of 25 m and a field of view of
25 × 25 km. Iris is a similar but much improved version of satellite GHGSat-D Claire, a
technology demonstration satellite that was launched in 2016. Claire, with an orbit of 90 minutes,
is able to evaluate a thousand sites per year. Iris is expected to provide a factor-ten performance
improvement. An example of Claire’s capabilities was published in November 2019 (Varon et al.
2019), highlighting large and persistent methane emissions near oil and gas installations of the
Korpezhe field in western Turkmenistan near the east coast of the Caspian Sea, during the period
November 2017 to January 2019. The estimated amount of methane released in this period was
142 ± 34 metric kilotons.
Figure 10: First satellite detection of a methane plume leaking from a single facility in January 2016
AVIRIS Aircraft data - January 12, 2016 EO-1 Satellite data - January 1, 2016
Note: methane observations were made by the Hyperion spectrometer on NASA’s Earth Observing-1 (EO-1)
satellite (right) and are compared with AVIRIS aircraft data (left), at an underground natural gas storage facility
near Aliso Canyon, California.
Source: NASA’s Earth Observatory, with permission: https://earthobservatory.nasa.gov/images/88245/imaging-a-
methane-leak-from-space.
NASA’s EO-1 and GHGSat-D’s observations exemplify the potential of satellite detection
technology to improve on the identification and measurement of oil and gas sources of
atmospheric methane releases with high spatial and spectral accuracy.
143.5 Systemic under-reporting of atmospheric emissions
Under-reporting of flaring and venting appears to be a systemic issue in the industry. Without
reliable data, the development of flaring and venting reduction solutions is being hampered. For
example, a study into APG flaring in Russia, Kazakhstan, Turkmenistan, and Azerbaijan (Haugland
et al. 2013) observed that satellite data exceeded reported flaring in Russia (the world largest flaring
country) by more than a factor of three in 2005. In 2011 this discrepancy had reduced but was still
just above a factor of two. In this same period, Kazakhstan (then ranked seventh-largest flaring
country) under-reported with a discrepancy that increased from a factor of two in 2006 to a factor
of four in 2011. A recent study on onshore flaring in Texas (Willyard and Shade 2019) concluded
that self-reported flaring volumes underestimate actual volumes by a factor of two, a result that is
consistent with other studies (Collins 2018; Leyden 2019). Another recent study on flaring in the
period 2012–18 compared government-reported flaring data for offshore oil and gas installations
in nine countries (Brazil, Canada, Denmark, Mexico, Netherlands, Nigeria, Norway, UK, and USA
Gulf of Mexico) with radiant heat observations from VIIRS (Brandt 2020). The study concluded
that there was no overall bias when all data were combined, although variations in reporting
between countries and over time do occur. In another study on flaring in offshore Mexico (ranked
tenth among the largest flaring nations), satellite data were compiled and a multi-pollutant analysis
used to compare top-down estimates with bottom-up flaring assessments and reporting (Zhang et
al. 2019). In this latter study, OMI data from on board NASA’s Aura satellite were used to track
NO2 and SO2 emissions from offshore oil and gas installations in Mexican waters in the Gulf of
Mexico. These were compared with radiant heat observations from the Defense Meteorological
Satellite Program (DMSP) and VIIRS, and data from the Emission Database for Global
Atmospheric Research (EDGAR), Instituto Mexicano del Petróleo (IMP), and Secretaria de
Energia de México (SENER). Figure 11 shows a comparison of these individual flared gas volume
assessments in a single graph.
Figure 11: Reported versus satellite measured flaring data in Mexico
Source: reproduced from Zhang et al. (2019), under the Creative Commons license CC BY-NC-ND 4.0.
15This analysis not only confirms the need to improve on flaring measurements and reporting: the
study also shows the benefits of multi-pollutant analysis and the combination of multiple satellite
sensors to reduce uncertainties in estimates. The authors reported that the SO2 emissions were
completely missing from the EDGAR database and the NO2 emissions were included only in the
recent EDGAR update, albeit at a factor of ten lower than the satellite estimates. The trends in
OMI emission data for NO2 and SO2 appear to track the government reported IMP/SENER data,
but with reported flaring rates a factor of two less than those derived from OMI data. In this case,
the radiant heat data from DMSP/VIIRS appear to significantly underestimate OMI data by a
factor of five, as well as the reported IMP/SENER data. The radiant heat data also appear to have
missed the spikes in flaring emissions in 2008 and 2015/16.
The combination of flare gas metering, wellhead fluid sampling, and OMI/VIIRS/Landsat remote
sensors provides opportunities for increased accuracy in calibration methods to link satellite
data to flare volume estimates. Moreover, as discussed in our first report on flaring (Romsom
and McPhail 2021), it is not only the magnitude of flaring that is important but also the quality of
the flaring process. Many impact assessments assume (near) perfect combustion of natural gas by
flaring, although in practice there are repeated observations of flares that do not meet these
conditions. This results in atmospheric releases of chemicals that have a significantly greater SCAR
per ton than CO2 or methane (see Figure 1). The ability to measure individual releases and establish
reliable correlations between releases—such as between NO2 and BC (Li et al. 2016)—enables
SCAR estimates that account for both the volume and the quality of natural gas flaring.
Satellite observations also provide valuable information on the transportation of atmospheric
releases, enabling assessments to be made that determine geography-dependent risks (such as
population density and exposure of the Arctic region to BC).
Operators—and sometimes also regulators (Haugland et al. 2013)—may benefit from not
reporting or under-reporting natural gas flared and vented. These benefits can be financial
(avoiding fiscal taxes, fines), commercial (avoiding costs of proper gas treatment) and reputational
(avoiding non-compliance with quality standards, being earmarked as a polluter, or negative social
impact due to degrading air quality). However, without accurate reporting and transparency
thereof, there is less incentive to improve on detrimental emission practices. Furthermore,
regulators may lack the necessary data to enforce compliance with applicable rules and regulations
by oil and gas operators. The third-party certification of vent and flare emission data (see Section
4.2) provides a level of commonality, quality, and reliability that these can be trusted and utilized.
In conclusion, reliable assessment of emission streams from flaring and venting serves a variety of
purposes:
• it improves understanding of how much natural gas is emitted and lost through these
practices and thereby helps to determine the basis for assessing both compliance with
emission volume restrictions and any taxes and/or fines that may be levied;
• it can provide reliable estimates on the volumes of individual chemicals emitted to
determine the SCAR of each flare and vent;
• it can help determine if the flare is operating within its design envelope, i.e. if the targeted
destruction efficiency of 98 per cent is being met (EPA OAQPS 2012);
• it can identify potential super-emitter flares and vents early for corrective action;
• it can support the calibration of local data with remote satellite observations and further
develop transport models to assess the regional distributions of SCAR;
• it can provide a baseline dataset as input to potential investments to aggregate, process,
and utilize natural gas for economic use.
16Further detailed information and interactive maps to assess sources of gas flaring can be found on
the SkyTruth website (https://skytruth.org/viirs/); see also Appendix A for more information on
global locations where natural gas is flared. Figure 12 shows a comparison of global gas flaring on
1 January 2020 and 30 June 2020.
Figure 12a: SkyTruth image of global flaring sites on 1 January 2020
Source: reproduced with permission from SkyTruth, ‘Flaring Maps’.
Figure 12b: SkyTruth image of global flaring sites on 30 June 2020
Source: reproduced with permission from SkyTruth, ‘Flaring Maps’.
174 Accountability, transparency, and reporting of venting and flaring emissions
4.1 Global gas flaring and venting reduction initiatives
More effective measurement is the first component of the Diamond model. The use and
enhancement of measuring systems to introduce improved reporting, enhanced accountability, and
greater transparency represents the second component. Initiatives in this area—already in
operation or proposed—are the subject of this section.
Global gas flaring and venting reduction initiatives: key points
• Since 2002, there have been a number of voluntary global multi-stakeholder initiatives to reduce upstream
flaring and venting.
• The focus is principally on standards, improvements in measurement, and commercialization. There is
less emphasis on fiscal measures.
• There was some reduction in gas flaring between 2004 and 2014. The combined amount of gas flared and
vented between 2000 and 2017 stayed relatively constant. Flaring reduced in absolute terms while venting
(methane) increased.
• Flaring data assume a 100 per cent combustion efficiency—where all hydrocarbons are destroyed. Many
flares do not reach this target and produce a range of chemicals that are toxic to human health, as well as
affecting air quality and climate.
• Methane emission avoidance is a major opportunity to reduce short-term impact on global warming and,
more importantly, on human health.
• More recently, institutional investors have focused on how to reduce climate risk to their portfolios by
engaging with oil and gas companies to measure, manage, reduce, and disclose methane emissions.
• Concerted action is needed by all emitting companies, including those not participating in any voluntary
initiatives. Non-voluntary measures (i.e. regulation) are needed to reduce flaring and venting.
The Global Gas Flaring Reduction (GGFR) public–private partnership was launched by the World
Bank and the government of Norway at the World Summit on Sustainable Development in
Johannesburg in 2002 (GGFR 2019). Based on early joint work (IGU Magazine 2013–14), which
showed that global flaring levels had remained virtually constant since 1980, the aim was to catalyse
the public and private sectors to reduce carbon emissions and environmental impact of flaring,
monetize a wasted resource, and improve energy efficiency and access to energy.
GGFR uses the following definition for routine flaring, the target for reduction: ‘Routine flaring
of gas is flaring during normal oil production operations in the absence of sufficient facilities or
amenable geology to re-inject the produced gas, utilize it on-site, or dispatch it to a market.’ All
other flaring, even when continuous, is considered non-routine or safety flaring.
This means that a number of oil production operations are not part of the scope of the GGFR
programme, e.g. flaring due to system upsets and emergency operations, maintenance activities,
well clean-up and production well tests, exploration well (deliverability) tests, and gas influx into
the wellbore during drilling operations
18However, the GGFR scope does include gas flaring during oil production for commercial reasons
or due to lack of gas processing and evacuation infrastructure, and these are to be eliminated. For
this effort to be successful and to avoid abuse, stringent definitions of ‘routine flaring’ and ‘normal
production operations’ need to be agreed and adhered to.
Actions have included improved measurement and transparency; regulations and standards; and
market opportunities:
International: joint work with the US NOAA to improve continuous measurement of flaring
using satellite data covering 60 countries.
National governments: support to low- and middle-income countries for oil and gas legislation
(World Bank 2004; Svensson and Rios 2012); seek market opportunities for associated gas (GGFR
2009), including technologies for the commercialization of small volumes of associated gas, such
as CNG (compressed natural gas), mini- and micro-LNG (liquified natural gas), and GTL (gas-to-
liquids). 5
Companies: a Voluntary Global Standard (GGFR 2004) and guidelines on flare and vent
measurement, to ensure no flaring in new projects and to eliminate continuous production flaring
in five to six years.
GGFR reported that its contributions to flaring reductions by 2013 included (GGFR 2013):
• gas flaring reduced by 20 per cent from 154 bcm in 2007 to 140 bcm in 2011;
• regulations on gas flaring passed in Russia, Angola, Kazakhstan, Gabon, and Cameroon,
and under development in Indonesia, Nigeria, Qatar, and Iraq;
• gas utilization projects developed in Angola, Cameroon, Gabon, Nigeria, Kazakhstan,
Qatar, Russia, and Uzbekistan.
After 2013, momentum slowed; this led to a rekindling of the flaring reduction efforts by the
World Bank Group in 2015, when the ‘Zero Routine Flaring (ZRF) by 2030’ initiative was
launched. However, as Figure 14 shows, flare volumes continue to rise in several large flaring
countries (GGFR 2020b).
The ZRF initiative is currently endorsed by 32 governments, 38 oil companies, and 15
development institutions and supported by OPEC; see Figure 13. Although the initiative has more
endorsers than GGFR has partners, not all GGFR partners have endorsed ZRF. In particular,
Algeria, Kuwait, Qatar, Chevron, ExxonMobil, Pemex, and Qatar Petroleum have yet to endorse
ZRF and adopt its targets.
5
GTL technology is based on a gas -refining process to convert natural gas or other gaseous hydrocarbons into liquid
synthetic fuels with longer-chain hydrocarbons, such as gasoline or diesel fuel.
19Figure 13: Endorsers of ‘Zero Routine Flaring by 2030’
t,
Source: reproduced from World Bank (undated). The World Bank Group authorizes the use of this material subject
to the terms and conditions on its website, Legal.
An important accomplishment is the development of satellite measurement data. By 2019, there
were more than 100 countries with satellite flare data, which is summarized and published by
GGFR on an annual basis. Where flare operational performance does not meet quality standards,
chemicals are emitted such as NOX, SOX, VOCs, and BC, each of which have a significantly larger
SCAR per ton than either CO2 or methane. This negates most of the benefits that flaring has over
venting. Thus, there is an immediate opportunity to improve the quality of flaring to avoid ‘super-
emitter flares’.
Figure 14: GGFR and ‘Zero Routine Flaring by 2030’ initiatives need further efforts to reverse the trend of
increasing flare volumes
Source: reproduced with permission from GGFR (2020a), Global Gas Flaring Tracker Report.
20In parallel, global initiatives were launched on methane emissions reduction, focusing initially on
capturing value and developing policies and regulation. Measurement came much later. The first,
Methane to Markets in 2004, was launched with 14 governments led by the US and focused on
methane abatement, recovery, and use. In 2010 it was renamed the Global Methane Initiative
(GMI), 6 and it has 44 countries and the European Commission as members. There is also a GMI
network of more than 700 project network members, mostly from private sector companies but
also including financial institutions, research/academia, NGOs, and others, sharing experience and
expertise across the network for methane emissions reduction. The network has helped GMI to
leverage nearly US$600 m in private sector and financial institution investment for projects that
capture and use methane.
In 2017, the Methane Guiding Principles (MGP), 7 a multi-stakeholder platform of 20 institutions
from industry, academia, and intergovernmental organizations, including the IEA, was set up to
develop methane policy and regulation.
In 2018, international oil and gas companies, members of the Oil and Gas Climate Initiative
(OGCI) set a target to reduce methane intensity in upstream oil and gas operations from
0.32 per cent in 2018 to 0.25 per cent by 2025 (OGCI undated). The UN Principles for
Responsible Investment (UNPRI), which in 2020 represents about 3,000 investors with over
US$100 trillion in assets under management, recommended in 2015 that international oil
companies (IOCs) should extend their standards on methane emissions to non-operated joint
venture partners and state-owned companies. The OGCI target covers operated assets only, thus
missing an opportunity to speed up reduction of methane emissions by applying the target to all
company operations. Methane intensity figures are useful, particularly in comparing and
benchmarking companies and countries on their methane performance. However, with respect to
SCAR impacts and climate change mitigation under a limited global carbon budget, absolute
reduction measures are more practicable.
Another voluntary multi-stakeholder platform, the Oil and Gas Methane Partnership (OGMP),
created by the Climate and Clean Air Coalition (CCAC), was launched at the UN Secretary
General’s Climate Summit in New York in September 2014. It focuses on emissions
measurement. The ten partner companies are BP, Ecopetrol, Eni, Equinor, Neptune Energy
International SA, Pemex, PTT, Repsol, Shell, and Total. In January 2020, OGMP members agreed
to an updated framework for reporting methane emissions transparently to civil society and
governments (CCAC undated [a]). This includes that companies report all material sources of
methane emissions from operated and non-operated assets. Member companies are to publish
individual reduction targets and report on progress. In 2019, the CCAC launched the Global
Methane Alliance (GMA) to support countries that commit to ambitious methane reduction
targets in the oil and gas sector through methane solutions that promote economic development,
air quality improvement, and other country priorities (CCAC undated [b]).
Another initiative focused on methane measurement was launched in 2018 by global investors
Ceres, members of the UNPRI (Ceres 2018). It provides guidance to oil and gas companies and
their investors on how to apply the Task Force on Climate-Related Financial Disclosures (TCFD)
framework for disclosure on methane emissions, with a suggested implementation timeline.
6
See https://www.globalmethane.org.
7
See https://methaneguidingprinciples.org.
21These global initiatives have a common theme in that they are all voluntary. The World Bank
GGFR publishes flaring data for 86 countries but is silent on the issue of venting gas. Parties that
are not part of the World Bank initiative are under no obligation to report their flaring and venting
contributions. The IEA online database for methane emissions reports in MtCO2e, although this
obscures the non-global-warming-related damages from methane and damages from other
hazardous air pollutants (such as VOCs) when natural gas is vented.
Although the objective in emissions reduction is the same, concerted action by all emitting
companies is needed, including those not participating in any of the groups mentioned here.
Regulation and fiscal measures—complementing improvements in measurements as opposed to
relying on estimates—data transparency, and technical solutions are needed to drive the industry
in lowering their fugitive emissions.
As set out in Section 3, there has been little reduction in the volume of gas flaring and venting in
recent years: 6.9 per cent of globally produced natural gas is flared (3.7 per cent) and vented
(3.2 per cent) in upstream oil and gas operations. Global flaring and venting volumes are significant
both in terms of opportunity costs and from the perspective of social costs such as impact on
human health, air quality, and climate.
4.2 Company and country reporting, and transparency and accountability initiatives
4.2.1 Reporting of venting and flaring emissions
Reporting and transparency: key points
• Measurement and public reporting of both flaring and venting are variable and need improvement.
Institutional investors and financial regulators are now focused on addressing this gap, for example with
the standard framework of the TCFD. Also, climate metrics now include upstream hydrocarbon flaring
and venting.
• Mandatory company reporting is more effective at reducing emissions (including GHGs). It produces
comparable data which enable benchmarking, peer pressure, performance improvement, and an
assessment of climate and health risks.
• Transparency and accountability benefits companies’ licence to operate, improving its social licence to
operate, access to capital, and access to markets.
• The Nigeria Gas Flare Tracker is an example of an open source database which allows government,
citizens, and community organizations to have visibility over the full scale of the flaring events, potential
value for the country, and opportunities to capture APG for health, economic, and social benefit.
Improvements needed for reliable flaring and venting data
The measurement of fugitive emissions, including flaring and venting, is difficult in the absence of
accurate metering. Often, little information is available on flare properties that can improve
operational performance and reduce social and environmental impact. Shortcomings in the data
on emissions from natural gas flaring and venting are caused by the following:
At the company level, gas that is being flared or vented is most often not metered and therefore
flare data are estimates at best (for example based on flare size and colour). Much of the existing
flaring data relies on self-reporting. Therefore, flare measuring/estimation standards are likely to
vary significantly between parties and, without a verification process, can be under-reported. The
reporting format varies across companies, which makes comparison and benchmarking difficult.
22You can also read