Maritime & Offshore Towage - December 2020 - JBR
←
→
Page content transcription
If your browser does not render page correctly, please read the page content below
NEWSLETTER

Towage

                                            NEWSLETTER

                                          Maritime &
                                            Offshore

                                          Towage
                                            December 2020

1   NEWSLETTER GLOBAL MARITIME INDUSTRY       www.globalma.com
NEWSLETTER

Towage

Dear all,

This summer, after months of (semi-)lockdown, we were enjoying the freedom of meeting with our friends and
family again, visiting the zoo or other outings, starting up our sporting events, going out for dinner, having a drink,
making small journeys – all so nice because we were prevented from doing this since March. And while economists
were discussing the V- or W-shape of the crisis and the moment of resurrection of the economy the COVID-19
pandemic hit hard again with a second wave.

Now we find ourselves in a lockdown for the second time and economists are gloomier than before. All eyes are on
the pharmaceutical industry, expectantly for the vaccines which will make our lives normal again.

Meanwhile, a new normal has set in. COVID-19 has changed the way we work and the way we live. Working from
home is what we do every day now, and it has both its advantages as well as disadvantages. Social distancing is
harder to act upon, since it is an unnatural behaviour for humans, though at the moment inflicted by governments.
And as other routines are becoming normal in this strange world.

Here in the Netherlands we are lucky we have a very well developed level of digitalisation, working from home is no
technical issue. However, not all countries can rely on a well-developed digital infrastructure, which makes working
from home not as easy as it is here. And there are more differences between countries which makes the economic
consequences much more drastic in some countries than in others.

However, all over the world governments are taking aid measures of unprecedented scale, e.g. with fiscal stimulus,
direct income support for small businesses and tax deferrals. Still many suffer from unemployment, corporate
failures and supply chain disruptions.

The shipping sector suffers, like many other sectors. However, the shipping sector is different, with a poignant
human element in it: the human disaster of crews stuck on vessels, unable of being changed.

As usual, besides a theme, this newsletter will focus on the several shipping sectors, most of them negatively
impacted by the COVID-19 pandemic. The facts are here, but we also have sought for the glimmers in these sectors
to encourage our readers and ourselves.

But most of all we wish you and your family a good health. We hope that you and your company will endure these
uncertain times.

The JBR Maritime and Offshore Team

2           NEWSLETTER GLOBAL MARITIME INDUSTRY                                                      www.globalma.com
NEWSLETTER

Global Maritime Industry
NEWSLETTER

Towage

Contents
1    Key Takeaways from the Newsletter

2    Global Maritime & Offshore

             Overview                                Harbor towage sector is
             Dry-Bulk Sector                         facing stiff challenges due to
             Tanker Shipping                         outbreak of COVID-19
             Container Shipping                      pandemic. The sector is
             Offshore Supply Vessel                  witnessing downward
             Cruise Line                             pressure from the maritime
                                                     industry in line with declining
             Port/Terminals
                                                     demand and in-turn downfall
                                                     in the manufacturing
3    Towage
                                                     activities. The market
             Overview                                participants are inclining
             New Trade Routes                        towards technology-driven
             New Tug Designs                         service delivery. The
             Supply and Demand                       pandemic has accelerated an
             Market                                  understanding of the
             New Towage Concepts                     potential of digitally
             Overview of Selected Towage Operators   delivered services among the
                                                     major players. The ongoing
                                                     pandemic condition has
4    M&A Activity in the Maritime & Offshore
     Industry                                        made the operators cautious
                                                     about the mental health and
5    Share Price Performance                         safety of crews who are
                                                     under threat.
6    Peer Analysis

7    Global M&A Partners

8    Global M&A Partners–Maritime and
     Offshore Team

3       NEWSLETTER GLOBAL MARITIME INDUSTRY                       www.globalma.com
1
NEWSLETTER

Towage

Key Takeaways from
the Newsletter

The global maritime industry is undergoing through stiff challenges on the back of ongoing COVID-19 pandemic.
The downward shift in the manufacturing and production activities have adverse ripple effects on the supply chain
that is being translated in the global shipping industry.

While the growth had started declining in 2019 and had touched loss-making levels, the beginning of 2020 has been
severely hard on the dry bulk shipping market. Virtually all the sectors are witnessing record dip in volumes and
rock-bottom freight rates due to COVID-19 induced lockdown. In the tanker shipping, the industry is facing hard
times due to the escalating freight rates against poor market fundamentals. Mismatch between oil production and
demand, shrinking tonnage availability, and growing freight rates have collectively led to increase in floating
storage. Additionally, the global offshore supply vessel (OSV) is expected to grow at a healthy CAGR of 8.3% from
2019 to 2024 and reach $25 bn in 2024 from $15.5 bn in 2019. North America has been the dominant OSV market
with increasing offshore exploration activities in the region including the Gulf of Mexico driving up demand for
OSVs. Further, the blow from the COVID-19 pandemic on the cruise industry is expected to be the most devastating
during the coming years. The US State Department suggested the American travellers with underlying health
conditions to avoid cruise ships with a fear of increasing the risk of infection in a cruise-ship environment.

COVID-19 pandemic has exposed the vulnerability of long supply chains. The crisis started with a supply disruption,
as the Chinese manufacturers were unable to produce and transport because of the local lockdown. As the lockdown
shifted to Europe and the USA, customer demand was also substantially impacted. It is inevitable that new trade
routes will occur. The already started regionalisation of trade will be accelerated by the pandemic, the Chinese One
Belt One Road Initiative with arising trade routes is in full steam; the Arctic Passages are initiatives have less impact,
though they are being developed. These new trade routes allow the emergence of new ports or contribute to the
growing or diminishing importance of ports.

These changing trade flows will undoubtedly reflect the developments in towage operation and tug design:
different requirements on versatility and power of tug boats increases the need for custom made vessels. But not
only the trade flows influence tug development, decarbonisation and digitization are having major influences on
designs. Furthermore, new service concepts will appear.

These items will be discussed in the underlying Newsletter. And as every year we have made our overview of
selected towage operators worldwide: where are they towing, how many vessels do they operate and has the fleet
grown – you will find the answers in our Overview of Selected Harbour Towage Operators.

4       NEWSLETTER GLOBAL MARITIME INDUSTRY                                                             www.globalma.com
2
NEWSLETTER

Towage

Global Maritime
Industry

The global maritime industry is undergoing stiff challenges on the back of ongoing COVID-19 pandemic which has severely
impacted the global demand and in-turn stalled the manufacturing activities (Exhibit 1). The impact of COVID-19 is being
witnessed largely on the Chinese manufacturing output that has exerted negative pressure on demand for coal and iron ore
during the H1 2020 in line with decline in manufacturing activities. Such downward shift in the manufacturing and production
activities have adverse ripple effects on the supply chain that is being translated in the global shipping industry. A global credit
rating agency, Moody’s has downgraded the outlook for the global shipping industry from ‘stable’ to ‘negative’ due to the
Coronavirus outbreak. Further, decline in demand for container and dry bulk shipping services is anticipated to exert downward
pressure on the EBITDA of market participants in 2020.

Exhibit 1: Revised Forecast for Main Shipping Markets (2020)
             Oil tanker shipping               Container shipping                                                          Dry bulk shipping
              • Breakdown of OPEC+ alliance has lifted Saudi • Blanked sailings have kept the spot freight        • Freight rates have been hit hard by the
    Impact

                Arabian crude oil exports significantly        rates ‘artificially’ high                            Coronavirus, seasonality and IMP2020, but
              • The Corona pandemic is destroying global oil • Volumes have remained low but Chinese                smaller sectors are starting to recover
                demand growth for 2020                         exports of backlogged orders will lift             • Capesize sector is feeling the most pain, due
                                                               volumes out of Asia                                  to low iron are demand
              • Short-term: Saudi Arabian exports will           • Medium-term: Demand will start to pick up • Short term: China remains weak, but demand
    Demand

                positively impact demand                           as Chinese manufacturing resumes normal      elsewhere can lift rates in the market
                                                                   operations                                 • Medium-term: Demand will remain sluggish,
                                                                 • Long-term: Lockdown in Europe and NA will    but resume to normality in the long-term
                                                                   dampen container demand during this period

              • Due to closures at Chinese yards, deliveries     • Due to closures at Chinese yards, deliveries   • Due to closure of Chinese Yards, deliveries
    Supply

                are expected to be a bit lower than                are expected to be slightly lower than           are expected to be slightly lower than what
                previously anticipated                             previously anticipated                           anticipated previously
              • Annual expected fleet growth: Crude oil          • Annual expected fleet growth: 2.5%             • Annual expected fleet growth: 3.1%
                tanker: 1.8% Product tanker: 2%

              • Oil product freight rates will be negatively     •   BIMCO now expect loss-making average         • The fundamentally lower demand will put
    Outlook

                affected by poor demand, but stay above              freight rates for the full year                a damper on earnings
                break-even levels                                •   IMO2020 and deteriorating demand-supply      • Freight rates are expected to be lower
              • Crude oil tanker freight rates remain strong,        fundamentals weakens the outlook               than last year
                but will decline once geopolitical support eases

Source: BIMCO

The outbreak of COVID-19 has disrupted the global trade creating sudden downward shift in the shipping industry. Charter
rates of containers carriers have seen a sharp decline, but recovering fast, due to vessels taken out of service. At the end of the
year the rates are sky high. Dry bulk have declined sharply due to the economic slowdown as demand dried up. The outlook of
these segments remains bearish for the remaining time during 2020 and the dry bulk trade is expected to fall by 4-6% during
2020. The decline is anticipated to be driven by muted steel production and weak industrial demand that will impact coal and
iron ore procurement.

5                 NEWSLETTER GLOBAL MARITIME INDUSTRY                                                                                       www.globalma.com
NEWSLETTER

Towage
 Lower consumption by major crude-consuming countries to impact trade flow
                  Share in global
                                                             Jan-20 Feb-20 Mar-20 Apr-20 May-20 Jun-20 July-20
                    POL trade

                                                                                                                                                         Crude oil trade
                  60%                                          -15%          -2%            -7%        -21%         -15%          -11%
                                                                                                                                                         growth in 2019
                                                 US
                Share of countries                                                                                                                            3-5%
                   in demand                                                                                                                             Crude oil trade
                                                               1%            10%            15%        -8%          19%           34%            25%
                                                                                                                                                        outlook for 2020
Crude oil                                     China
                  39%
                                                               3%            9%             2%         -16%         -23%          -19%           -37%      (3)-(5)%
                                               India
Note: All percentages, except share, reflects on-year change in charter rates on calendar year basis
Source: CRISIL Research

Sudden decline in crude oil prices during the year led to oil contango, a situation where the price of an oil futures contract
exceeds the spot price. This sparked a rush for booking vessels to be used as floating storage that helped tanker owners in
capitalizing on the growing demand. Therefore, even after having wallowed rates of dry bulk and container, tanker charter rates
were about 44% higher during the first half of 2020. However, the oil contango that enabled countries and traders to strongly
look out for floating storage is now narrowed down and rates are anticipated to be streamlined with the prevailing demand-
supply dynamics of global trade. Further, widespread lockdowns in major crude oil-consuming economies including the US and
India have reduced consumption of petroleum products in these regions, impacting crude oil demand.

 Lower consumption by major crude-consuming countries to impact trade flow
                  Share in global
                                                             Jan-20 Feb-20 Mar-20 Apr-20 May-20 Jun-20 July-20
                    POL trade

                                                                                                                                                         Crude oil trade
                  60%                                          -15%          -2%            -7%        -21%         -15%          -11%
                                                                                                                                                         growth in 2019
                                                 US
                Share of countries                                                                                                                            3-5%
                   in demand                                                                                                                             Crude oil trade
                                                               1%            10%            15%        -8%          19%           34%            25%
                                                                                                                                                        outlook for 2020
Crude oil                                     China
                  39%
                                                               3%            9%             2%         -16%         -23%          -19%           -37%      (3)-(5)%
                                               India
Note: All percentages, except share, are on-year change in imports
Source: Energy Information Administration-US, National Bureau of Statistics-China, Petroleum Planning and Analysis Cell-India, CRISIL Research
Source: BIMCO, Clarksons

6            NEWSLETTER GLOBAL MARITIME INDUSTRY                                                                                                        www.globalma.com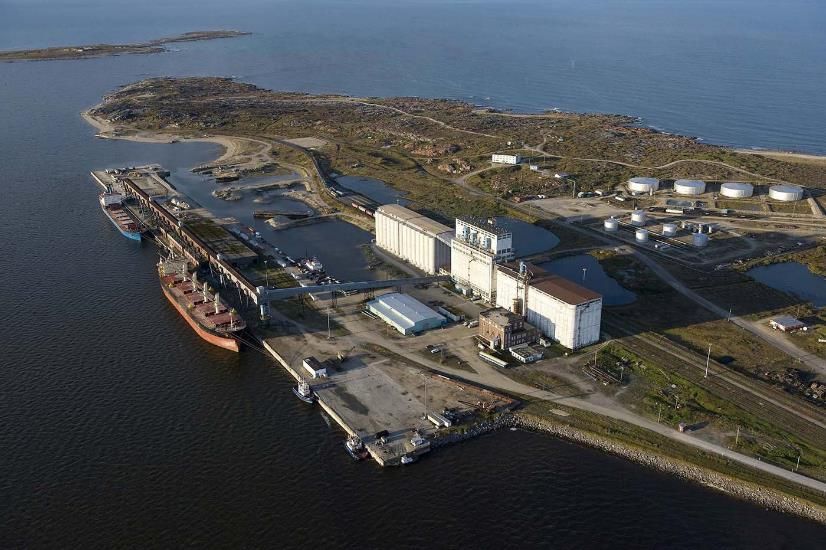
NEWSLETTER

Towage

The dry bulk market outlook is expected to witness improvements by end of 2020; however, the prospects from 2021 onwards
The Pandemic-hit 2020 has been a challenging year for the dry bulk sector. While the growth had started declining in 2019 and
had touched loss-making levels, the beginning of 2020 has been severely hard on the dry bulk shipping market (Figure 2).
Virtually all the sectors are witnessing record dip in volumes and rock-bottom freight rates due to COVID-19 induced lockdown.
Smaller dry-bulk segments have fared better and have managed to keep earnings at around break-even level.
The biggest story in the dry bulk industry in recent months has been the strength of the recovery in major Chinese imports.
These are up across the board, breaking previous records for monthly imports as well as imports accumulated year-till-date in
2020. Chinese recovery has been strong enough to make up for lower activity, with all ship sizes above their break-even levels.
The second half of 2020 is proving to be much stronger than the first with China pushing to make up for the lower demand in
the rest of the world. Despite the strength of the past few months, average spot-market earnings in the year to date across all
ship sizes are at loss-making levels, with time running out to turn this year around.

Figure 1: Dry Bulk Earnings and Break-Even Levels, 2018-2020

Source: BIMCO, Clarksons

The biggest story in the dry bulk industry in recent months has been the strength of the recovery in major Chinese imports.
These are up across the board, breaking previous records, not just for monthly imports, but also accumulated over the first
seven months of the year. The Chinese recovery has been strong enough to make up for lower activity in the rest of the world,
with all ship sizes above their break-even levels. Capesize earnings rose quickly in late June, to reach USD 33,760 per day on 7
July. The high Chinese imports led to congestion at many of its ports, temporarily lowering the number of available ships. Since
then, rates have fallen to a more sustainable level, averaging around USD 19,400 per day in August.
Key drivers for dry-bulk market include imports to China, exports out of Brazil, and US Soy-bean exports to China. As China has
started to open up, the import volumes have picked up. Chinese iron ore imports have been strong and are up 11.8% in the first
seven months of this year compared with last – an additional 348 Capesize loads (200,000 tonnes). At 112.6m tonnes, imports
in July were at a record high, bringing total imports in the first seven months of the year to 659.6m tonnes. Higher iron ore
imports are backed by higher steel production levels. Stimulus measures from the Chinese government are prompting local
governments to encourage steel production, and invest in infrastructure projects. Chinese crude steel production has recovered
and increased by 2.8% after seven months since Jan’20 after monthly declines during March and April. The rise in steel
production in China comes at the same time as production is falling in the rest of the world (-16.5% year-on-year), as the
recovery elsewhere lags behind. Consequently, China accounted for a record high 62% of global steel output in Q2, up from
54% in 2019. EU steel production was down 24.4% in July from last year, drops largely driven by the collapse of many
manufacturing sectors, in particular Germany’s car production. The steel production in China has grown at faster than its iron
ore imports between 2018 and 2019 (+8.3% in 2019 and +6.6% in 2018) leading to high iron ore imports in 2019 as it has moved
towards using more electric arc furnaces and scrap steel, rather than blast furnaces.

7           NEWSLETTER GLOBAL MARITIME INDUSTRY                                                              www.globalma.com
NEWSLETTER

Towage
Figure 2: Major Chinese Import Growth Rates (Accumulated year-on -year, 2018-2020)
                     30%                                                                                                                                       30%
                     25%                                                                                                                                       25%
                     20%                                                                                                                               17.7%   20%

                                                                                                                                                                            Growth rate
Growth rate

                     15%                               11.8%                                                                                                   15%
                     10%                                                                  6.3%        6.8%                                                     10%
                      5%                                                         3.7%                                                                          5%
                                         0.5%                                                                                             0.5%
                      0%                                                                                                                                       0%
                               -1.0%
                     -5%                                                                                                                                       -5%
                     -10%                                                                                                  -7.9%                               -10%
                                        Iron Ore                                           Coal                                         Soya beans
                                                                   2018                 2019             7M 2020
Source: BIMCO, General Administration of Customs PR China

Additionally, US soya-bean exports to China have decreased nearly 42% compared to 1Q19. When compared to pre-trade war
level of 2017, the exports have declined steeply and have dropped by as much as 65.6% (equivalent to a loss of 5.4 mn tonnes,
or 72 Panamax loads).
However, iron ore exports out of Brazil have declined by 8.7% in the first four months of 2020, contributing significantly to the
low volumes in the capsize segment and offsetting the slight rise in volumes from China.
However, it is worth noting that volumes on the main trades of smaller vessels have remained strong. While the rates have been
just around the break-even levels due to the pandemic crises, the positive demand developments could potentially push the
rates higher as the economy gradually opens up.

Fleet and Demolitions
While volumes have stayed low, dry-bulk shipping fleet has reached 891.5 mn DWT registering a growth of 1.6% as of May 19,
2020. According to BIMCO, the fleet is expected to grow by around 3% in 2020 adding 39.3 mn DWT to the market (Figure
3).The addition could further exacerbate the excess supply vs. demand situation currently prevalent as evident from the rise in
slippage rate for planned deliveries to 35% from 25% before the pandemic.
Lockdown measures taken by most countries have also impacted the demolitions as major shipbreaking nations have closed
their respective beaches. Till May 2020, total dry-bulk demolition was 5.4 mn DWT. As per BIMCO estimates, the demolitions
could rise to 14 mn DWT from the expected 12 mn DWT due the tepid demand in the dry-bulk market.

Figure 3: Dry Bulk Ship Fleet Growth, 2016A-2022E

                      50                                                                                                                                       5%
                      40
                                                                                                                                                               4%
                                                                                                                                                                     Growth rate p.a.

                      30
       Million DWT

                      20                                                                                                                                       3%
                      10
                       0                                                                                                                                       2%
                     -10
                                                                                                                                                               1%
                     -20
                     -30                                                                                                                                       0%
                                2016A              2017A              2018A              2019A               2020F            2021E                  2022E
                                                           To be delivered p.a           Demolition             Growth rate (RH-axis)
Source: BIMCO, Clarksons *Growth rate for 2022E not available in source.

8                           NEWSLETTER GLOBAL MARITIME INDUSTRY                                                                                       www.globalma.com
NEWSLETTER

Towage
Outlook
On the positive side, China, one of the biggest drivers for the dry bulk industry, is gradually recovering and the stimulus
measures around housing and construction sectors are expected to boost the demand for raw materials. However, demand for
steel and aluminium for the automotive industry have been significantly impacted due to the COVID-19 crises (Figure 4). For
instance, car sales in 1Q20 fell by 41% in China and in April 2020 fell by 41% in the UK that is the lowest level since 1946. Iron
ore is another raw material whose low level of demand is expected to weigh heavily on the dry bulk sector.
Moreover, as per BIMCO estimates, trading in all commodities is expected to fall. For instance, demand for coal is expected to
fall by up to 8% due to reduced manufacturing activity because of “the Great lockdown” leading to low electricity consumption.

Figure 4: Annual Change in Coal Demand
                                   400                                                                                      400
Metric tons of carbon equivalent

                                                                                                                                   Metric tons of carbon equivalent
                                   200                                                                                      200
                                                                                                                       Q1
                                     0                                                                                      0

                                   -200                                                                                     -200
                                                                                                                Full
                                   -400                                                                         Year        -400

                                   -600                                                                                     -600
                                          1971            1980              1990           2000   2010             2020
                                                                                   Power
Source: BIMCO

Recent Developments
While the outlook for the year has been mostly negative, the surge in dry bulk rates in the mid of June and October 2020 has
been very heartening for the struggling industry. Panamax and Handymax were hugely supported by US soybeans trade which
is expected to decline post reaching its peak in the last few months of 2020. A second round of lockdowns in Europe is also
expected to impact trade in the Atlantic basin. Despite the strong demand for iron ore entering a seasonal slowdown and a fall
in Chinese coal demand slow down dry bulk recovery, surge in rates have been witnessed in most segments:
Panamax: Healthy demand for both minerals and grains from the North has positively impacted rates in most regions of the
Atlantic. Rates gained traction with support led by both the North in the Atlantic and the North Pacific in Asia.
Supramax/Ultramax: Rates have gone up with strong demand from the US Gulf, Arabian Gulf, Asia, and the Indian Ocean.
Handysize: East coast South America captured the spotlight with a surge in demand between September end and early
October. Tonnage with November dates were tight, particularly in north Brazil. US Gulf also showed signs of improvement.
Crew-Change
Maritime transport is also trying to resolve the crew-change issue caused by the travel restrictions due to COVID-19 with up to
400,000 sailors being stranded either at sea or at home.
Close to 80% of world trade by volume is carried on vessels including container ships, fuel tankers, and dry bulk carriers (United
Nations Conference on Trade and Development). However, as over a fifth of the 1.8 mn seafarers who crew the world’s 96,000
commercial vessels are due for changeover, the industry experts have warned that a trade logjam is imminent unless
governments create “safe corridors” that would allow free movement to sailors. As per maritime rules, sailors are only allowed
to spend 11 months at sea.

9                                          NEWSLETTER GLOBAL MARITIME INDUSTRY                                 www.globalma.com
NEWSLETTER

Towage
                         “
                                   There is an urgent need to establish safe corridors between key
                                  countries such as Philippines and India and key crew change hubs

                                                                                                                             “
                                 around the world. We need solutions and global collaboration now.
                                                 - Henriette Hallberg Thygesen, Maersk’s Fleet and Strategic Brands Chief.

The tanker shipping industry is facing hard times due to the escalating freight rates against poor market fundamentals.
Mismatch between oil production and demand, shrinking tonnage availability, and growing freight rates have collectively led
to increase in floating storage.

Figure 5: Oil Product Tanker Earnings (Jan 2016 – Nov 2020)

Source: BIMCO, Clarksons
Note: Data updated through to 14 February 2020

Geopolitical tensions have broken down the OPEC+ alliance and erupted the crude oil tanker spot freight market (Figure 5).
Saudi Arabia is capitalizing on the ongoing political turmoil, which has significantly lifted the country’s exports. The country is
preparing to flood the global oil market in the short run that will bring down the fuel costs and benefit the crude oil tanker
industry during downfall in the global oil demand during 2020. Further, BIMCO expects the global oil demand is expected to fall
for 2020 y-o-y during the longer term. Such trends will translate into significantly declining the transportation demand for fuel.
The tanker industry experienced a boost immediately after the start of the COVID-19 crisis because of the lower oil price and
higher exports from major producers. However, the lower aviation and transport demand and fundamentally lower oil
consumption due to global lockdown has affected the industry.

                 On 28 August, Very Large Crude Carrier                                       At US$11,949 per day, Suezmax earnings were
                 (VLCC) earnings averaged US$16,949 per                                       ~US$8,000 below breakeven, and Aframaxes
                 day, indicating a loss of around US$7,000                                    expected to lose US$7,700 per day, with
                 every day.                                                                   earning averaging US$9,322 per day.

10          NEWSLETTER GLOBAL MARITIME INDUSTRY                                                                                  www.globalma.com
NEWSLETTER
Towage
Figure 6: Crude Oil Tanker Earnings (Jan 2019 – Oct 2020)
Source: BIMCO, Clarksons
The economic activity worldwide has been slowing down since 2019 and will slow down further during 2020. The trade-to-GDP
multiplier is anticipated to fail to deliver expected guidance under such conditions. Additionally, the tankers have seen little
demolition in the first six months of 2020. Only seven crude oil tankers were demolished in the first eight months of 2020,
totalling 681,832 dead weight tonnes (DWT). BIMCO expects demolition activity to rise as freight rates and actual demand for
tanker shipping falls, with total crude oil demolition reaching to 7.5m DWT in the full year and 1.0m DWT of product tankers
being demolished. YTD 2020, 547,334 DWT of oil-product tankers have been removed.
Figure 7: Oil Product Tanker Fleet Growth (2016A – 2022E)*
10 10%
8 8%
Growth rate p.a.
6 6%
Million DWT
4 4%
2 2%
0 0%
-2 -2%
-4 -4%
2016A 2017A 2018A 2019A 2020F 2021E 2022E
Delivered Demolition To be delivered p.a Growth rate (RH-axis)
Source: BIMCO estimates on Clarkson’s raw data
*Growth rate for 2022E not available in source.
According to BIMCO, the demand for oil products supplied in the US have collapsed: For instance,
gasoline fell by 37.7% at 3.1 mn barrels per day (bpd) during Jan 3 – Apr 3. However, the
production has recovered marginally to remain at 6.8 mn bpd as of May 15 declining by 16.5%
since Jan 3. The supply of jet fuel has fallen by 62.5% since the beginning of 2020, declined to 0.6
mn bpd on May 15 from 1.6m bpd on January 3.
11 NEWSLETTER GLOBAL MARITIME INDUSTRY www.globalma.comNEWSLETTER
Towage
At this moment the rates for container shipping are sky
high.
Though the year started on the negative side. The
container market is heavily dependent on consumer
spending, which was severely impacted during
lockdowns across the globe. The months of April and May
suffered the worst impact compared to the previous year
with container shipping volumes declining by 1.9m TEU (-
13.6%) and 1.7m TEU (-11.0%) respectively (Figure 9). The
lost volumes in June were less than half of this, down
0.7m TEU (-5.1%) and signalled the beginning of a muted
recovery.
Figure 8: Change in Container Volumes from 2019
On main trade lanes and the rest of the world
250 0%
0 -1%
-250 -2%
Thaousand TEU
Growth rate
-500 -3%
-750 -4%
-1000 -5%
-1250 -6%
-1500 -7%
-1750 -8%
-2000 -9%
jan-20 feb-20 mrt-20 apr-20 mei-20 jun-20
ROW Intra-Asian Far East to Europe Far Eats to North America Acc. Y-o-y growth 2019 (RH-axis)
Source: BIMCO, CTS
Despite lower demand due to the pandemic, carriers achieved high freight rates and profitability in the first half of the year
through large-scale capacity reductions and low bunker prices. Shipping containers on long-term contracts compared to short-
term ones, has also been key to carriers’ profitability. Tonnage providers suffered the most due to idle ships but demand started
showing signs of improvement in the second half of the year.
Long-term rates experienced a boost after short-term container freight rates reached record highs on many of the major
container shipping trades. Long-term freight rates between the Far East and the US rose, mirroring the development in short-
term contracts that saw an increase in freight rates to the US, outpacing the rise in spot rates to Europe. Rates increased from
$2,412 per FEU on 30 September to $3,133 per FEU on 1 October. These declined once again but at $3,207 per FEU, still 25.7%
higher than on the corresponding day in 2019. In mid-September, spot rates into the US were at record high and continued
increasing until 15 September, when they jumped for the last time and have since remained steady near the record-breaking
levels. (Figure 9).
12 NEWSLETTER GLOBAL MARITIME INDUSTRY www.globalma.comNEWSLETTER
Towage
Figure 9: Container Shipping Spot Freight Rates – Far East (2019 – 2020)
On main trade lanes and the rest of the world
The container shipping industry is particularly vulnerable to
Container volumes between the Far East and North America also got stronger in the second half of 2020 with volumes up by
180,000 TEU and 280,000 TEU in July and August respectively (Figure 10), benefitting from large-scale restocking in the US.
With these strong volumes, the Far East to North America trade is outperforming the development in the rest of the world.
Figure 10: far East to North America Container Volumes (2018 – 2020)
Source: BIMCO, CTS
BIMCO anticipates that the fleet will expand by 2.1% in 2020, marking a four-year low. A total of
300,000 TEU container ship fleet to be demolished in 2020 and so far, this year 169,647 TEU have
been demolished. Container ship fleet owners had to rid of some of their older and substandard
ships since the industry is witnessing poor conditions in the container shipping charter market
13 NEWSLETTER GLOBAL MARITIME INDUSTRY www.globalma.comNEWSLETTER
Towage
Figure 11: Container Ship Fleet Growth (2016A – 2022E)
1.500 6%
1.250 5%
1.000 4%
Growth rate p.a.
Million DWT
750 3%
500 2%
250 1%
0 0%
-250 -1%
-500 -2%
-750 -3%
2016A 2017A 2018A 2019A 2020F 2021E 2022E
Delivered Demolition To be delivered p.a Growth rate (RH-axis)
Source: Baltic and International Maritime Council *Growth rate for 2021E not available in source.
The COVID-19 pandemic has a major negative influence on the
global offshore oil and gas industry. Next year COVID-19 will have
it impact on the offshore oil and gas industry, but after that the
future looks brighter. It is forecasted that the global offshore
supply vessel (OSV) will grow at a CAGR of 7.9% from 2019 to
2027 and reach $20.7 bn in 2027 from $16.1 bn in 2019. In North
America it is expected that the OSV market will benefit from
increasing offshore exploration activities in the region including
the Gulf of Mexico (Exhibit 2). Additionally, increasing offshore
activity in Asian countries, especially India could potentially lead
to long-term contracts for the OSV providers (Figure 12).
Exhibit 2: Major Segments in Offshore Supply Vessel
Global Offshore Supply Vessel Market
By Type BY Application By Region
• Anchor Handling Tug • Shallow water • North America
Supply Vessel • Deepwater • Europe
• Platform Supply Vessel • Asia Pacific
• Multipurpose Support • Rest of the World
Vessel
• Standby & Rescue
Source: Market Research Future
14 NEWSLETTER GLOBAL MARITIME INDUSTRY www.globalma.comNEWSLETTER
Towage
Figure 12: Vessels Market – Growth Rate by Region (2019 – 2024) Growth drivers include growing
exploration activities, increasing number
of offshore wind farm projects, and
increasing offshore decommissioning
activities.
Buoyed by decline in capex and opex for
both offshore oil and gas projects, the
demand for OSVs is expected to surge.
Additionally, decline in costs has also led
to increasing exploration activities in
ultra-deep waters and Arctic regions. It
could, in turn, further fuel demand for
Regional Growth Rates OSVs.
High Mid Low
OSV operators are increasingly investing
in more efficient and environment friendly battery-hybrid propulsion. Major companies including Tidewater, Atlantic Offshore,
and Harvey Gulf International Marine are upgrading their vessels with battery-hybrid propulsion and US-based SEACOR Marine
aims to have the largest battery-hybrid-powered OSVs fleet.
Recent Developments
Offshore marine services companies are looking to reduce capacity by selling vessels in view of the lack of demand vis-a-vis
global oversupply of offshore supply vessels. The key factor has been downturn in the oil and gas industry that has forced the
incumbents to re-evaluate their fleet composition and future fleet deployment. A case in point was the divesture of two anchor
handler tug and supply vessels by Maersk Supply Service.
“
“
As a response to the recent downturn in the oil and gas industry, we
have re-evaluated our fleet composition and future fleet deployment.
–Maersk Supply Service Chief Commercial Officer, Carsten Gram Haagensen
Oil and gas companies are expected to defer as much as $131 bn
worth of oil and gas projects that were to be approved in April 2020
(Rystad Energy) due to the crash in oil prices resulting from the supply
and demand imbalance in the wake of COVID-19. This could result in
up to 10% contraction in volumes and $3 bn in revenue loss for the
offshore drillers.
Moreover, decreasing rate of utilisation has resulted in many OSV
owners approaching their creditors for yet another round of
restructurings. This, in conjunction with the fact that advances in
technology have led to higher rate of obsolescence of floating units, is expected to lead to more pressure on OSV companies to
right-size their inventories.
15 NEWSLETTER GLOBAL MARITIME INDUSTRY www.globalma.comNEWSLETTER
Towage
Impact of COVID-19
The offshore industry has adopted digital technologies to lessen the impact of COVID-19 mitigation measures. Since the
pandemic, compulsory quarantine measures and social isolation practices have affected the way offshore vessels and drilling
rigs operate, affecting the daily lives of offshore workers. Companies such as IEC Telecom are providing remote access facilities
to give crew enhanced online connectivity while at the same time increasing the bandwidth speeds to cope with the escalating
digital traffic.
The cruise industry growth will be driven by a record orderbook of over 117 new cruise ships with deliveries scheduled through
2027. The average cost of a new ship is $578 mn, while the average tonnage is ~82,000, and the average capacity is 2,113
passengers. New ship deployment will be largely driven by the Caribbean region (32%), followed by the Mediterranean region
(17%), and the European region (11%) (Figure 13). Key market participants have initiated their growth plans. For instance, MSC
Cruises is planning for the biggest growth with 14 ships on order including 10 mega-ships, four smaller, and 1,000-guest luxury
vessels since the company is focusing on dominating the high-end market. Additionally, Carnival Corporation has 20 ships on
order from 2019, extending its orderbook through 2024. Further, Royal Caribbean Cruises has an orderbook of 15 ships with a
delivery line through 2026.
Figure 13: Global Scenario of New Ship Deployment by % (2020)
Caribben 32%
Mediterranean 17%
All Other 17%
Europe w/o Med 11%
China 5%
Australis/NZ/Pacific 5%
Alaska 5%
Asia w/o China 5%
Source: Cruise Line International Association
Figure 14: Passenger Capacity (2009 – 2020P)
35 32
30
Passanger capacity - mn
30 28,5
26,7
25,2
25 22,34 23,06
20,5 20,9 21,3
20 17,8 19,1
15
10
5
0
2009 2010 2011 2012 2013 2014 2015 2016 2017 2018 2019p 2020p
Source: Cruise Lines International Association
16 NEWSLETTER GLOBAL MARITIME INDUSTRY www.globalma.comNEWSLETTER
Towage
The global passenger capacity was at 29 mn in 2018 and is expected to reach 32mn in 2020 (Figure 14). Demand for cruise comes
from North America that accounts for almost 59% of the total number of cruise passengers. The Coronavirus situation has
severely impacted cruise demand during the first quarter of 2020. Other markets that largely contribute towards the cruise
shipping industry include Europe (Germany, the UK, and Ireland being the three largest European source markets for cruises)
and the rest of the world (especially Australia/New Zealand and Asia).
According to the world tourism organization (UNWTO), international tourism has declined by 65% in the first quarter of 2020
and is forecasted to decline by 58% to 78% in 2020. In 2020, the cruise traffic is estimated to reach 6 to 12 mn passengers.
While cruising has tentatively restarted in Europe and new regulations are being formed for a potential return in the US, the
industry still faces uncertainty. Hundreds of cruise ships have now been laid up at sea, forcing cruise companies to sell off the
cruise ships. In September 2020, Carnival Corporation announced its plans to sell 18 cruise ships, resulting 12% decrease in the
overall fleet.
Before the COVID-19 outbreak, the last decade showcased record growth for the cruise industry that was intended to continue
during 2020 and later years. According to the CLIA, 32 mn passengers were expected to travel on cruise ships in 2020, growing
from 30 mn in 2019. Since 2009, cruise ship passengers grew from 17.8 mn to 30 mn in 2019, growing at CAGR of 5.4% during
2009-2019. Additionally, cruise industry revenues were estimated to showcase faster growth from ~15.7 bn in 2010 to an
estimated 31.5 bn in 2020, highlighting a CAGR of 7.2%. In 2019, there were 278 ocean cruise line ships operating across 55
cruise companies and over 500 river cruise ships. The ship operators were planning to add another 19 ships in 2020.
Impact of COVID-19 on the Cruise Line Industry
The blow from the COVID-19 pandemic on the cruise industry is the most devastating during the coming years. Travellers with
underlying health conditions are avoiding cruise ships with a fear of increasing the risk of infection in a cruise-ship environment.
In case of an outbreak, the cruise lines will have to force passengers to undergo extra health screening. Additionally, the ships
will be required to mandatorily follow the new enhanced cleaning procedures, including more frequent cleaning of hard
surfaces. Some companies are dismantling cruise ships and are selling as scrap metal. Several vessels are arriving in Britain,
Italy, and the US for dismantling.
Moody’s Investors Service has lowered its outlook for the lodging and cruise industry from ‘stable’ to ‘negative’ since both the
industries are facing revenue losses in 2020 due to the pandemic outbreak. The cruise lines have planned to start sailing as the
pandemic restrictions are easing out. The cruise lines are chalking out plans to tackle the pandemic while sailing by taking safety
precautions such as redirecting ships to new destinations. For instance, Singapore has planned to start sailing cruise ships amid
the Coronavirus pandemic, but the cruise ships will not make any stops and return to the port they departed to keep crew and
passengers safe. The cruise passengers are loyal and are likely to return to cruising after the shock of the outbreak wears off.
The cruise lines will initiate offering discounts to entice travellers to return to the water.
The ports and terminals market are witnessing growing usage of Internet of Things (IoT) solutions to improve safety and
enhance the operational efficiency at port terminals. IoT operations reduce human effort and increase the efficiency of the
operations in the areas including real-time tracking of containers and ships, controlling and enabling access to Closed Circuit
TV (CCTV) cameras for the entire port, and tracking and identifying assets and vehicles for complete traceability within the
proximity of the port. Additionally, ports and terminals sector is giving a greater emphasis on investing into new technology
such as AI and blockchain and transforming into ‘Smart Ports’, as there are growing threat of cyber-attacks due to having
sensitive maritime data points on supply chain such as vessel navigation, cargo handling and container tracking.
Reduction in the workforce and fall in demands has pushed freight rates lower, and additional
restrictions by countries at the ports like the ban on crew changes are disrupting global supply
chains
17 NEWSLETTER GLOBAL MARITIME INDUSTRY www.globalma.comNEWSLETTER
Towage
Impact of COVID-19 on Ports/Terminals
Due to the recent outbreak of CoVID-19, the container port volumes declined over the first few months of 2020 but are reflecting
uneven signs of recovery in the third quarter of 2020. The average number of container vessels arriving weekly at ports have
started to recover, rising to 9,265 by early August from 8,722 in mid-June. The number of ships pulling into ports to unload and
load containers rebounded in many parts of the world, reflecting recovery for world merchandise trade, which suffered a historic
year-on-year fall of 27% in the Q2 2o2o.
The weekly container ship port calls in China and Hong Kong had climbed to 4.1% higher than the 2019 numbers by early August
2020, and calls in North America and Europe were still 16.3% and 13.2% below the levels registered one year earlier.
Eventually, the global ports are improving as the lockdown is easing. For instance, the US ports handled 1.9 mn TEU in July
2020, 2.3% down compared with the same period during the previous year but recovered from 19.3% down in June 2020. Cargo
ships were also being used for medical and emergency supplies during the COVID-19 pandemic. Additionally, the
Mediterranean Shipping Company (MSC) has developed a Suspension of Transit (SOT) container shipping program to prepare
for a recovery in demand for freight services once the lockdown eases. The program is built to ensure business continuity and
maintenance of vital container carriage services such as the movement of food, fresh produce, medical equipment, and other
essential goods. The initiative has focused on catering to the demand for a variety of goods from Asia.
Exhibit 3: Global Top 10 Ports (2019)
By Container Throughput
Ports Year-on-Year Growth
2019 2018
Shanghai 43,300 42,010 3.07%
Singapore 37,200 36,600 1.64%
Ningbo-Zhoushan 27,530 26,350 4.48%
Shenzhen 25,770 25,740 0.12%
Guangzhou 22,830 21,920 4.15%
Busan 21,900 21,660 1.11%
Qingdao 21,000 19,320 8.70%
Hong Kong 18,360 19,600 -6.33%
Tianjin 17,300 16,000 8.13%
Dubai 14,100 14,950 -5.69%
Source: Official websites of various ports, prepared by the SISI
Exhibit 4: Global/International Terminal Operators: By Annual Total Throughput (2019)
Ranking 1 2 3 4 5
Throughput (mteu) 123.8 111.7 86.0 85.2 71.2
Growth/Decline (%) 5.5 2.4 1.6 5.2 -0.3
Source: Official websites of various ports
Cosco Shipping handles an annual throughput of 123.8mn teu (Exhibit 4), followed by China Merchants (111.7mn teu),
Hutchinson (86.0mn teu), PSA (85.2mn teu), and DP World (71.2mn teu).
18 NEWSLETTER GLOBAL MARITIME INDUSTRY www.globalma.comNEWSLETTER
Towage
Global container port capacity expansion is forecasted to contract by ~ 40% over the next five
years in the wake of the COVID-19 induced slowdown in port throughput: global container
terminal capacity is projected to grow at an average annual rate of 2.1% over the next five years,
equating to an additional 25m TEU a year. This is well below the capacity growth seen over the
past decade, when the average annual increase was more than 40m TEU a year.
- Drewry Global Container Terminal Operators Annual Review and Forecast Report
The port and terminals' operations market is highly fragmented that includes domestic and international market players. The
market is witnessing stiff competition at the regional level in line with a larger concentration of vendors in the developed
economies such as the US and Europe and the technologically advanced countries such as China, Korea, and Singapore.
Companies with technical and financial resources have developed expertise in services, which provides them a competitive
advantage over the other players. The competitive environment in the market expected to intensify during the coming years
with an increase in services, extensions, and technological innovations.
DP World, Hutchison Port Holdings Trust, PSA International, and Cosco are the key vendors in the
global port and terminals operations market.
19 NEWSLETTER GLOBAL MARITIME INDUSTRY www.globalma.com3
NEWSLETTER
Towage
Towage
The COVID-19 pandemic hits the shipping industry hard. Though the full scope of the disruptive effects of COVID-19 pandemic
is unknown, it already has many had tangible impacts: closed ports, blanked sailings, diminishing trade and crews being tied
upon the vessels for too long a time, are just a selection of the many effects.
The towage industry as service provider within the shipping industry equally suffers from the pandemic. Towage industry
Captains are adapting to the “new normal”. As mentioned in the general shipping overview in the previous chapter, the various
subsectors undergo the COVID-19 consequences on their own way.
Though container freight rates are doing well, the number of routes have diminished, as have the number of port calls. This
reflects in the number of required tug jobs. Shipping group Maersk is confident about the outlook for shipping beyond 2020 as
a second wave of Coronavirus infections only had a limited impact on global freight volumes. Maersk, the world’s biggest
container shipping line, has recovered faster than expected after the pandemic halted trade around the world, benefiting from
higher retail sales in the United States.
“The second wave of Coronavirus infections has had relatively limited impact on trade volumes”
- Soren Skou, Chief Executive Maersk
Tanker business saw a higher trading and storage activity. Though the tankers were being used as storage, instead of transport
equity, the number of tug jobs at terminals were also lower. But terminal towage was less influenced by the COVID-19
disruptions, since in this sector long-term contracts towage services are common, providing stable business.
Bulk transport, unlike tankers, are struggling with lower demand for shipping space. Since the bulk transport sector is far more
fragmented than container shipping, it is unable to cut capacity. So here no artificial shortage of space was introduced, like
container freight and, a drop in freight rates occurred. And concerning towage - less transport also means less tug jobs.
Industrial towage, such as assisting shipyards, suffered badly from the pandemic. COVID-19 has influenced the shipbuilding
industry in two ways. First, there are reported delays in newbuilding completion caused by problems related to lockdown
measures in major shipbuilding countries. Also disruptions in supply chain and sourcing parts for ships are causing delays.
Second, the lockdown measures and inevitable recession that we are heading towards, caused by the slump of economic
activity, is expected to hurt shipbuilding orders. These months towage has seen a minus of approximately 75%.
20 NEWSLETTER GLOBAL MARITIME INDUSTRY www.globalma.comNEWSLETTER
Towage
A strange course of events took place after the acquisition of
Peruvian towage company Tramarsa by Singapore towage
company PSA. The deal was signed in February 2020 – all was set
to start this new adventure. However, after all these months the
teams haven’t met yet, only being able to communicate through
the virtual world of Zoom or Teams. The company however, has
been renamed from Tramarsa Flota into PSA Marine Peru.
Economic development and population growth will continue to drive future demand for maritime trade. However, the
regionalisation of trade patterns will likely have a substantial impact, as will digitization and sustainable shipping.
Increased ship size and industry consolidation, as well as other developments in liner shipping, have changed maritime trade
patterns by reducing the number of calls to secondary ports. However, the trend towards marginalisation of secondary ports
may have come to an end, as both industry consolidation and the movement of ever-larger ships seem to have run their course.
Already a demand for smaller container vessels is increasing. Furthermore, the gaining importance of intra-continental trade is
a fact. Already 60% of Asia’s trade is intra-regional.
The cost of maritime transport will increase as a result of expected regulations to decarbonise shipping. However, these cost
increases will be small in relation to the value of traded goods and the impact on global trade may be marginal. The connections
and trade routes to and from less-developed countries or countries at the end of poorly serviced transport chains may feel
significant repercussions, but affected countries could be compensated for some of the adverse effects on trade.
There is a range of other possible drivers of future trade flows. Climate change could be a disruptor for shipping: if extreme
weather events make shipping riskier – thus more expensive – demand for maritime trade may suffer. Changes in production
technologies in different industries may also impact maritime trade flows. Global trade is also dependent on politics.
Protectionism, political instability, civil unrest, war or domestic or international conflicts can all have negative implications for
maritime trade.
One Belt One Road (OBOR) Initiative
The most famous new trade route is the Chinese One Belt One Road (OBOR) initiative. This new Silk Road covers 65% of the
world’s population, three-quarters of global energy resources and 40% of GDP and at least 157 nations and international
organizations are making use of it. The “Belt" refers to overland routes for road and rail transportation from China to Europe,
where as the “Road” refers to the maritime connections through Southeast Asia to South Asia, Middle East, Africa and Europe.
Ports on these sea routes are prospering from the increasing trade, e.g. in Europe the Greek port of Piraeus, owned by Cosco,
is transforming into a major hub, just like in Africa the Nairobi port in Kenya and in Asia the Sri Lankan port Colombo. Also major
investments have been made in other East African countries, injecting $10 billion to develop a free trade zone in Djibouti, and
to fund projects at the Port of Djibouti’s Doraleh Container Terminal.
21 NEWSLETTER GLOBAL MARITIME INDUSTRY www.globalma.comNEWSLETTER Towage Furthermore, new ports are being developed, like the planned development of a container port in Turkey, in the Eastern Mediterranean that will operate as a gateway to the Middle East and Central Asia. This port is meant to be part of the OBOR. Already, the Chinese companies China Merchants, Cosco Pacific and infrastructure investment specialist CIC Capital hold a majority stake in Kumport Terminal. Located on the northwest coast of the Marmara Sea, Kumport is Turkey’s third-largest container terminal and is a strategic link to Europe. China’s OBOR will likely have a significant impact on maritime trade flows if fully implemented. The maritime part of the initiative has a stronger potential to impact overall trade than the onshore investments. Investment in the ports connecting China with other parts of the world could cut maritime trade costs, thereby reducing trade costs and increasing imports and exports. OBOR does not cover only infrastructural investments, but also extends to trade agreements. Since China is extremely dependent on imports of oil and gas, respectively almost 85 percent of China’s oil consumption and over 40 percent of gas consumption was derived from imports in 2019 it has been securing its supply. So China is developing and implementing renewables and under the OBOR China has signed MoU’s with many countries in Asia, Africa, Europe and Latin America. With these international relations it has diversified its international relations in the energy sector. As ports will emerge as hubs in the Maritime Silk Road, the infrastructure and port services also have to be adapted. Increasing traffic in ports represents also more tug jobs. Most likely, the deployed tug fleet will expand, with tugs being deployed in a safe, profitable and efficient way. 22 NEWSLETTER GLOBAL MARITIME INDUSTRY www.globalma.com
NEWSLETTER

Towage
                                       Exhibit 5: The One Belt One Road Inititaive

NSR
Also the arctic routes are gaining importance. In 2020 transit cargo on the Northern Sea Route (NSR) totalled 1.28 million
tonnes, according to the Federal Marine and River Transport Agency (Rosmorrechflot). The NSR is a shipping lane between the
Atlantic Ocean and the Pacific Ocean along the Russian coast of Siberia and the Far East. The distance from Northern Europe
to China is approximately 40% shorter than via the Suez Canal or 60% shorter via the Cape of Good Hope, which creates
substantial reductions in transportation time, fuel consumption, environmental emission and it eliminates piracy risks.

According to the International Transport Forum (ITF) the share of global trade using the NSR by the next century will be fairly
small, at less than 5%, even in extreme climate change scenarios. If a Central Arctic passage became feasible, it could trigger a
considerable change in the configuration of maritime trade flows. In Russia the opinion is different from that of the ITF: the
State Atomic Energy Corporation Rosatom (Rosatom) NSR Directorate expects the summer-autumn navigation to achieve an
annual level of three to five million tonnes of NSR transit cargo to be achieved in the coming three to five years.

The northern coast of the Russian Federation has a number of deepwater ports that have been supported by the arctic authority
and the Russian fleet of icebreakers for several years. Murmansk is the largest deepwater port north of the Arctic Circle.

23       NEWSLETTER GLOBAL MARITIME INDUSTRY                                                                  www.globalma.com
NEWSLETTER
Towage
Murmansk is also ice-free throughout the year. Murmansk also provides access to northern European and Asian industrial
centres. Russian Arctic ports in the Barents Sea, including Murmansk, have expanded significantly as offshore oil and ore
production have increased in the region. Other Russian Arctic ports along the Northern Sea Route include Pevek, Tiksi, Igarka,
Dudinka, Dikson, Vitino, Arkhangelsk and Novy. These ports are well situated and very well supported by the Russian icebreaker
fleet.
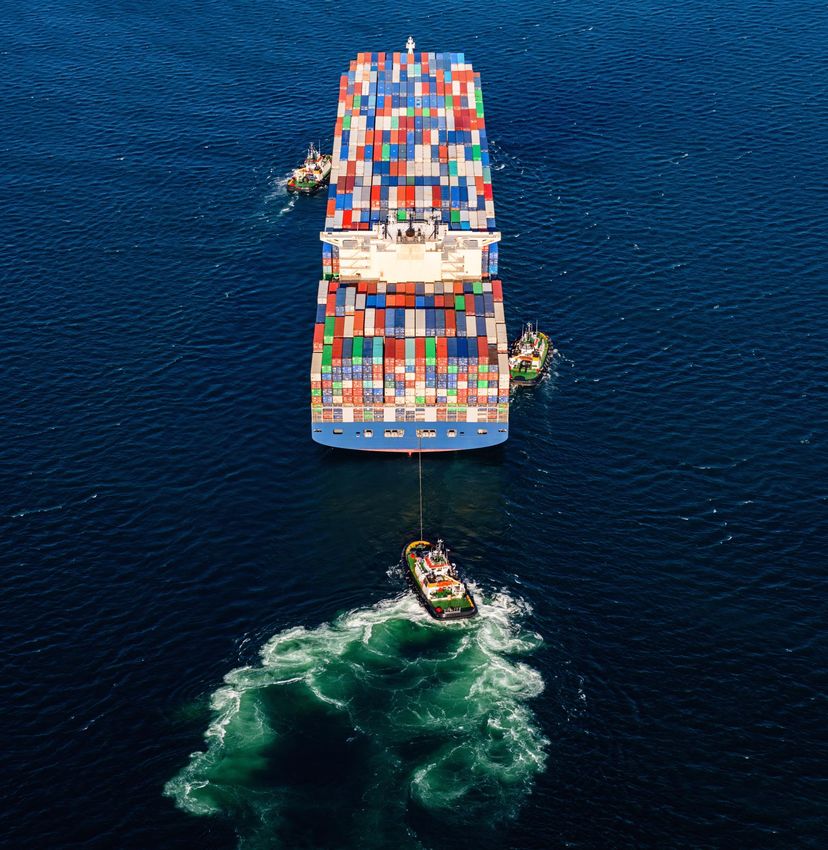
Exhibit 6: The Northern Sea Route
On September 18, 2020 new rules for navigation on the Norther Sea Route were approved. According to these rules, the water area
of the NSR is now divided into 28 regions. Depending on the types of ice conditions in a particular area, a vessel will receive an
appropriate permit. See color fields and marks “NSR regions” on the map.
Source: https://arctic-lio.com/
Accelerated development of the NSR will thrive the development of the Murmansk region, since it seems to be a favourable
location for transshipment facilities. By order of the Government of Russia dated March 31, 2020, amendments were made to
the borders of the seaport of Murmansk. The amendments are related to changing the boundaries of the water area of the
seaport of Murmansk in order to include 3 water sections in the area of the Ura Bay, where it is planned to organize a marine
transshipment complex for liquefied natural gas, intended for transshipment of LNG using floating gas storages. A section of
floating berth will be installed on the third offshore mooring, designed to accommodate auxiliary fleet ships and tugboats.
Furthermore, serious plans and engineering surveys are being made for the Liinakhamari settlement on the shores of Devkina
Zavod bay. This bay has a more favourable shipping location than Kola Bay / Murmansk. It is the only port with a direct exit to
the ocean, with a natural depth of up to 20 meters, non-freezing water area, a short deviation (35 nautical miles) from the route,
absence of naval base, shorter pilotage distance (six kilometers), no dense residential areas in Liinakhamari and no environment
protection zones and there is some infrastructure such as roads, networks, communications and Korzunovo airport 30
kilometers from the future facilities.
24 NEWSLETTER GLOBAL MARITIME INDUSTRY www.globalma.comNEWSLETTER
Towage
As for now, the plans are to complete the construction of the new port in the second quarter of 2024, the time when Russia
expects NSR traffic to reach 80 million tonnes per year including three to five million tonnes of transit cargo. In these arctic
ports ice-class tugs are a necessity.
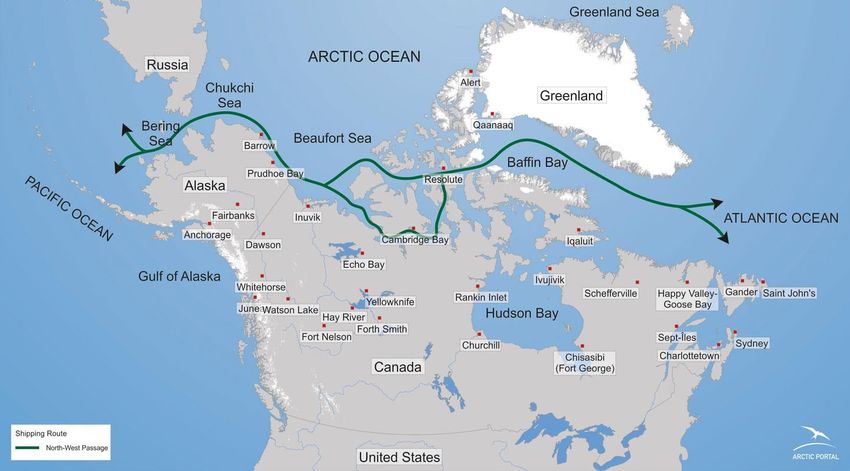
NWP
The Northwest Passage (NWP) is a sea route that connects the Atlantic and Pacific Oceans through the Canadian Arctic
Archipelago. The benefits of a clear NWP are significant. Ship routes from Europe to eastern Asia are 4,000 kilometres shorter.
In these Arctic regions, with difficult access for vessels deepwater ports, adequate port reception facilities for ship-generated
waste, marine salvage and towing services are almost not available. There are a few deepwater ports in American waters near
the Bering Strait. The lack of major ports and port facilities is also one considerable limiting factor in terms of increased shipping
on the NWP. The nearest U.S. port with deep water is Dutch Harbour in the southern Bering Sea. The situation is different in
the region between the Atlantic and Arctic oceans, where there are many Icelandic, Norwegian and Russian deepwater ports.
There are a few of deepwater ports along the west coast of Greenland. In the Arctic, there are hardly any deepwater ports along
the North Slope of Alaska or the entire Canadian eland groups, Canada has one relatively deepwater port in Tuktoyaktuk, but
it suffers from a shallow approach channel and a high degree of in-fill silting. The port is situated in the delta of the Mackenzie
River. But what also should be said is that Resolute Bay is limited in port facilities, in the middle of the eland group, which acts
as a central point of transportation. Resolute Bay can only handle vessels with a draft of 5 meters and the port uses a sunken
vessel as a dock. Vessels of deeper draft must anchor in an open roadstead.
In Hudson Bay, the Port of Churchill is Canada’s only
northern deepwater seaport which is well sheltered,
vessels can berth along their side. The port provides access
via rail, to the interior of Canada and North America in
general. The Port is growing and can efficiently load
Panamax size vessels. The use of the Port of Churchill
eliminates time-consuming navigation, additional
handling and high-cost transportation through the Great
Lakes and St. Lawrence Seaway. The current shipping
season runs from half-July to the beginning of November.
But with the use of icebreakers the shipping season can be
Port of Churchill longer.
Long-term warmer weather across the Canadian Arctic
could open a seasonal navigation passage for much larger container ships, with potential to influence the international
movement of containers. A trans-Arctic navigation season via a southern passage, lasting for six months could encourage
development of a container port in the southern region of James Bay with potential for future transshipment terminals in the
region of Hudson Strait. The opening of a Canadian northern trans-Arctic navigation passage would offer potential to transit
super-mega-size container ships, with further potential to develop a transshipment terminal at Nuuk, Greenland with links to
European ports, north-eastern American ports and Seaway/Great Lakes ports. Future seasonal trans-Arctic container ship
navigation via a southern passage has the potential to intensify competition amongst eastern Canadian container ports at
Quebec City, Halifax and Cape Breton region.
25 NEWSLETTER GLOBAL MARITIME INDUSTRY www.globalma.comYou can also read