Upscaling urban data science for global climate solutions
←
→
Page content transcription
If your browser does not render page correctly, please read the page content below

Global Sustainability                                 Upscaling urban data science for global
           cambridge.org/sus
                                                                 climate solutions
                                                                 Felix Creutzig1,2, Steffen Lohrey2, Xuemei Bai3, Alexander Baklanov4,
                                                                 Richard Dawson5, Shobhakar Dhakal6, William F. Lamb1, Timon McPhearson7,8,9,
           Review
                                                                 Jan Minx1, Esteban Munoz10 and Brenna Walsh11
           Cite this article: Creutzig F et al (2019).
                                                                 1
           Upscaling urban data science for global                Mercator Research Institute on Global Commons and Climate Change, Berlin, Germany; 2Sustainability
           climate solutions. Global Sustainability 2, e2,       Economics of Human Settlements, Technical University Berlin, Germany; 3Australian National University,
           1–25. https://doi.org/10.1017/sus.2018.16             Canberra, Australia; 4World Meteorological Organization (WMO), Geneva, Switzerland; 5University of Newcastle,
                                                                 Newcastle, UK; 6Asian Institute of Technology, Bangkok, Thailand; 7Urban Systems Lab, The New School,
           Received: 29 March 2018
                                                                 New York, USA; 8Cary Institute of Ecosystem Studies, Millbrook, New York, USA; 9Stockholm Resilience Centre,
           Revised: 13 November 2018
           Accepted: 13 November 2018                            Stockholm, Sweden; 10UN Environment, Paris, France and 11Future Earth, Montreal, Canada

           Key words:                                                Non-technical summary. Manhattan, Berlin and New Delhi all need to take action to adapt to
           adaptation and mitigation; policies; politics
                                                                     climate change and to reduce greenhouse gas emissions. While case studies on these cities
           and governance; urban systems
                                                                     provide valuable insights, comparability and scalability remain sidelined. It is therefore timely
           Author for correspondence:                                to review the state-of-the-art in data infrastructures, including earth observations, social media
           F. Creutzig, E-mail: creutzig@mcc-berlin.net              data, and how they could be better integrated to advance climate change science in cities and
                                                                     urban areas. We present three routes for expanding knowledge on global urban areas: main-
                                                                     streaming data collections, amplifying the use of big data and taking further advantage of
                                                                     computational methods to analyse qualitative data to gain new insights. These data-based
                                                                     approaches have the potential to upscale urban climate solutions and effect change at the
                                                                     global scale.
                                                                     Technical summary. Cities have an increasingly integral role in addressing climate change. To
                                                                     gain a common understanding of solutions, we require adequate and representative data of
                                                                     urban areas, including data on related greenhouse gas emissions, climate threats and of
                                                                     socio-economic contexts. Here, we review the current state of urban data science in the con-
                                                                     text of climate change, investigating the contribution of urban metabolism studies, remote
                                                                     sensing, big data approaches, urban economics, urban climate and weather studies. We outline
                                                                     three routes for upscaling urban data science for global climate solutions: 1) Mainstreaming
                                                                     and harmonizing data collection in cities worldwide; 2) Exploiting big data and machine
                                                                     learning to scale solutions while maintaining privacy; 3) Applying computational techniques
                                                                     and data science methods to analyse published qualitative information for the systematization
                                                                     and understanding of first-order climate effects and solutions. Collaborative efforts towards a
                                                                     joint data platform and integrated urban services would provide the quantitative foundations
                                                                     of the emerging global urban sustainability science.

                                                                 1. Introduction: Manhattan, Berlin and everywhere else
                                                                 The locations of choice in Leonard Cohen’s lyrics “First we take Manhattan, then we take Berlin”
                                                                 are a nightmare for the urban greenhouse gas (GHG) emission accountant. Manhattan’s inha-
                                                                 bitants emit low amounts of CO2 per capita; but as part of the larger New York context, with
                                                                 ample commuting from surrounding areas where less efficient building densities prevail, this
                                                                 positive example is compromised. Researchers are similarly perplexed by how Berlin’s GHG
                                                                 emissions can be properly accounted. Berlin’s geographical area is unclear: should the admin-
           © The Author(s) 2019. This is an Open Access          istrative boundaries be chosen, including numerous parks and forests? Or only the built-up
           article, distributed under the terms of the
           Creative Commons Attribution-
                                                                 area, which itself requires proper definition, be included in calculations? Or, different again,
           NonCommercial-ShareAlike licence (http://             should accounting include the Brandenburg hinterland, which produces large amounts of
           creativecommons.org/licenses/by-nc-sa/4.0/),          renewable energy for the city itself?
           which permits non-commercial re-use,                      These kind of urban data challenges derive from the open system character of cities. It is
           distribution, and reproduction in any medium,
                                                                 one of the main reasons that a coherent global urban data-based sustainability science is
           provided the same Creative Commons licence
           is included and the original work is properly         still in its infancy. However, the urgency to tackle this conundrum could not be greater.
           cited. The written permission of Cambridge            Urbanization is a megatrend of the 21st century and has a huge impact on climate change
           University Press must be obtained for                 and other global environmental challenges such as land-use change. At the same time, cities
           commercial re-use.                                    are the focal points of social challenges as enshrined in Sustainable Development Goal 11 –
                                                                 making cities and human settlements inclusive, safe, resilient and sustainable. With an
                                                                 expected increase in global urban population to 66% by 2050 (UN-DESA, 2018), cities will
                                                                 also need to play a decisive role in the reduction of global CO2 emissions. By 2010, emissions
                                                                 from urban building and transport sectors amounted to about 10 GtCO2, of which 2.8 GtCO2

Downloaded from https://www.cambridge.org/core. IP address: 46.4.80.155, on 20 Oct 2021 at 15:13:47, subject to the Cambridge Core terms of use, available at https://www.cambridge.org/core/terms.
https://doi.org/10.1017/sus.2018.16
2                                                                                                                                                       Felix Creutzig et al.

          came from transport, and 6.8 GtCO2 from buildings (Creutzig                                climate effects and solutions. Together, these efforts will help
          et al., 2016). By 2030, buildings could account for 12.6 GtCO2                             the creation of a global urban data platform (GUDP), intended
          (UN Environment, 2017). Researchers have awakened to these                                 to support both scientific efforts and urban decision-makers
          trends and repeatedly call for building a global urban science                             worldwide. We review the quantitative foundations of global
          (Grubler et al., 2012; Solecki et al., 2013; Creutzig, 2015; Bai,                          research on cities with specific focus on urban climate solutions;
          2016; McPhearson et al., 2016 b; McPhearson et al., 2016 c;                                nonetheless, both approach and data will be useful also for other
          Acuto et al., 2018; Bai, et al., 2018 b; Parnell et al., 2018).                            sustainability challenges, such as air pollution and equity in access
          However, development towards such global urban science                                     to water, sanitation and health infrastructures. Hence our contri-
          remains stuck in well-trodden paths, as even conferences dedi-                             bution also intends to help in building the foundations of Global
          cated to the global dimension of urbanization continue to focus                            Urban Sustainability Science.
          on individual case studies.
              Gathering and interpreting urban emissions, climate and
                                                                                                     2. Current state of data-based efforts at the
          ancillary data is important but troublesome for at least four rea-
                                                                                                     urban-climate-change nexus
          sons. First, boundaries of analysis are ambiguous and often incon-
          sistent, making city-to-city comparison done on equal footing                              A number of disciplines and epistemic communities attempt to
          challenging. This applies to all cities, not only to Manhattan                             provide the data and understanding of urban characteristics rele-
          and Berlin.                                                                                vant and pertinent for climate mitigation and adaptation. Here we
              Second, gathering data is cumbersome, and can easily turn                              review and organize these approaches by looking into:
          into multi-million dollar efforts. Most of the best data exist for
          the richest cities and those most committed to addressing climate                          ➢ Accounting for urban GHG emissions by considering urban
          change issues, such as Paris and Los Angeles. This leads to a huge                           metabolism studies, data science approaches and assessment
          bias in the data representation of cities. Urban agglomerations                              studies
          with the highest expected growth rate are medium-sized cities                              ➢ Making use of spatially gridded data based on remote sensing
          and those with a population below one million in Asia and                                    to characterize and typologize cities according to climate and
          Africa (UN-DESA, 2018). The group of 47 least developed coun-                                other characteristics
          tries (LDCs) currently have the largest population growth rate at                          ➢ Utilizing big data approaches at the scale of individual cities
          2.4% per year (UN-DESA, 2017). It is precisely these cities that                           ➢ Data-based approaches for urban climate policies, based on
          will be most affected by urban growth and its climate change                                 insights from econometrics, urban economics and planning,
          adaptation and mitigation consequences; yet they are the ones                                and ex-post policy analysis
          lacking the economic resources and infrastructure capacities to                            ➢ Integrated urban climate, weather and environmental systems
          systematically collect and assess required urban data.                                       and services for sustainable cities.
              Third, the data which is collected on cities is often not that
          which is the most useful for addressing urban climate solutions.
                                                                                                     2.1. Accounting for urban GHG emissions
          For example, cities need building-stock data to understand and
          quantify the impact of retrofitting, and expanding their built-up                          Cities are open systems. They can be well described by investigat-
          area. This is also closely related to the first issue: the data surveyed                   ing inflows, outflows and storage of energy, water, materials, emis-
          usually are of varying quality and methodology, making inter-city                          sions and wastes, which is the subject of urban metabolism studies
          comparisons cumbersome.                                                                    (Wolman, 1965; Brunner, 2007; Kennedy et al., 2007; Kennedy &
              Fourth, qualitative data on contextual information are often                           Hoornweg, 2012; Dijst et al., 2018). Over approximately the last
          missing. Some of the most policy-relevant information is not cap-                          two decades, urban metabolism studies have accumulated ample
          tured in the quantitative data, but rather in narratives – for                             evidence for understanding cities as open systems, for example,
          example, who, why and how do city inhabitants do things the                                energy and material budget and pathways; flow intensity; energy
          way they do? These contextual factors are critical for understand-                         and material efficiency; rate of resource depletion, accumulation
          ing causal relations and socially acceptable pathways to reform.                           and transformation; self-sufficiency or external dependency;
          Such information, both for individual cities and across cities, is                         intra-system heterogeneity; intersystem and temporal variation;
          crucial for building up transferable knowledge, enabling                                   and regulating mechanism and governing capacity (Bai, 2016).
          city-to-city learning, and guiding urban policy and practice (Bai                          The importance of such a systemic assessment of all direct and
          et al., 2010).                                                                             indirect flows increases as the size of the unit of observation
              Overcoming these issues is central to developing knowledge-                            decreases. Smaller spatial units such as cities are less self-sufficient
          based climate solutions that can be upscaled individually to cities                        and are more dependent on trade and material flows arising out-
          worldwide, while still respecting the differences between cities. A                        side the city boundaries in the supply chain of traded products
          harmonized and large-scale data infrastructure is required to pave                         used within city limits (Minx, 2017).
          the way.                                                                                      Urban density and the spatial configuration of activities shape
              In this paper, we extensively review the efforts of different                          the urban metabolism. For example, the dense city centre of Paris
          communities to collect and make use of urban data for addressing                           imports its food consumption but exports all waste. Paris’ sur-
          climate challenges. We then outline three routes for upscaling                             rounding areas consume high levels of construction materials
          urban data science for global climate solutions: 1) Mainstreaming                          and fuel (Barles, 2009). A similar case can be made for city infra-
          and harmonizing data collection in cities worldwide; 2) Exploiting                         structure, such as airports, power plants or wastewater facilities,
          big data and machine learning to scale solutions while maintain-                           that are often located outside of urban administrative boundaries
          ing privacy; 3) Applying computational techniques and data                                 (Ramaswami et al., 2008; Hillman & Ramaswami, 2010).
          science methods to analyse published qualitative information                               Economic disparity within the city is a key factor that causes
          for systematizing and synthesizing understanding of first-order                            large disparities in household carbon footprints and underlying

Downloaded from https://www.cambridge.org/core. IP address: 46.4.80.155, on 20 Oct 2021 at 15:13:47, subject to the Cambridge Core terms of use, available at https://www.cambridge.org/core/terms.
https://doi.org/10.1017/sus.2018.16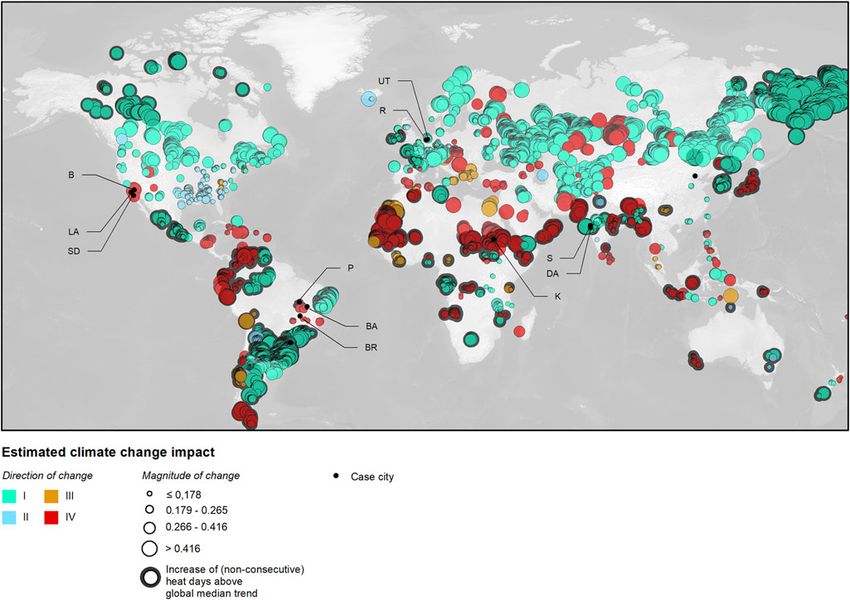
Global Sustainability                                                                                                                                                          3

           spatial resource flows (Lin et al., 2013; Baiocchi et al., 2015;                           2009; Kennedy et al., 2015). TBIA accounts for all emissions that
           Wiedenhofer et al., 2017).                                                                 occur within the city boundary, plus all indirect emissions that
                                                                                                      serve the city and are relevant to its metabolism. The latter includes
           2.1.1. GHG assessment frameworks                                                           electricity, airline and commuter travel, water supply and other
           The urban metabolism literature has served as a blueprint for the                          infrastructures (Ramaswami et al., 2011). TBIF leaves out all life-
           discussion on urban GHG assessments: choosing adequate spatial                             cycle GHG emissions of non-infrastructure items, including
           boundaries for the research or policy question under consider-                             goods and services consumption of households, but accounts for
           ation is crucial for assessing urban GHG emissions and directly                            production within the city.
           determines the level and quality of emissions. First, the spatial                              There is no superior choice among any of these frameworks
           boundaries of the study region itself need to be determined                                for urban analysis. Rather, they complement each other by ad-
           under consideration of dynamic relationships between the                                   dressing different policy questions and actors and provide a
           urban core and surrounding periphery. For example, supposedly                              more complete picture for devising effective urban emission
           green and compact cities such as Freiburg and Barcelona or                                 reduction strategies. For example, while TBIA is designed for
           Paris (Beekmann et al., 2015) still display substantial levels of                          planning decisions by city administrations, local authorities or
           transport emissions mainly driven by commuters from outside                                communities, consumption-based accounting (CBA) mainly
           the city (Creutzig et al., 2012). A focus on the spatial extent of                         informs household actions.
           the city only would therefore not allow the consideration of all
           relevant emission reduction options.                                                       2.1.2. Accounting for urban GHG emissions at the global scale
               Second, the relevance and scope of indirect GHG emissions                              Urban climate change assessments have tried to understand urban
           that occur outside the city in the supply chain of final energy                            GHG emissions at the global scale (Grubler et al., 2012; Seto et al.,
           or other products consumed in cities need to be considered. For                            2014; Rosenzweig et al., 2018). Two major efforts can be distin-
           example, a study of households in Xiamen City (China) shows                                guished: First, the estimation of the urban contribution to global
           that up to 70% of emissions can be attributed to regional and                              GHG emissions. One set of studies has upscaled samples of urban
           national activities outside the city boundaries (Lin et al., 2013).                        emission shares for representative countries or regions to the glo-
           In fact, accounting for such indirect GHG emissions can change                             bal level (IEA, 2013). A second set of studies have downscaled glo-
           the overall picture of the assessments: additional GHG emissions                           bal or national datasets to grid cells based on information on
           from higher household consumption levels in wealthy downtown                               emission point sources, population or the extent of urban areas.
           can offset savings from more compact urban forms – compared to                             These studies estimate the global urban emission share some-
           neighbouring suburban areas (Heinonen et al., 2011). Similarly,                            where between 50 to almost 80% depending on methods and
           the carbon efficiency of Manhattan is offset by surrounding                                reporting scope (Grubler et al., 2012; Marcotullio et al., 2013;
           areas compared to emissions from household consumption in                                  Seto et al., 2014). Due to the very limited data availability for esti-
           smaller metropolitan areas (Jones & Kammen, 2014).                                         mation, large uncertainties remain.
               For obtaining an adequate picture of urban GHG emissions,                                  Second, bottom-up accounts of urban GHG emissions and
           researchers commonly choose among several major frameworks                                 sector-specific drivers have been comprehensively reviewed in glo-
           for assessing GHG emissions (Kennedy et al., 2010; Chavez &                                bal assessment studies such as the Global Energy Assessment
           Ramaswami, 2011; Ramaswami et al., 2011): First, territorial-                              (Grubler et al., 2012; Kahn Ribeiro et al., 2012) or the IPCC AR5
           based emission accounting is most common and straight-forward                              (Lucon et al., 2014; Seto et al., 2014; Sims et al., 2014), and larger
           to compute. It aggregates all emissions occurring within urban                             databases of urban energy and GHG emissions have been compiled.
           administrative or functional boundaries (also denoted as Scope                             Even though great progress has been made in developing emission
           1 emissions) – also those that arise for the production of exports                         accounting standards for cities (ICLEI, 2018; Nangini et al., In
           that are consumed outside the city. While a bulk of the available                          Press), the greatest challenge of such efforts remain with the limited
           evidence still provides single or small-N studies, there is a growing                      comparability of the data collected due to differences in data avail-
           number of consistent data sets that can be used to assess GHG                              ability, choice of physical urban boundaries, choice of reporting
           emissions across metropolitan areas and within and between                                 scope as well as calculation methods
           metropolitan areas over time (Markolf et al., 2017; Shan et al.,                               A small but growing number of studies have made use of com-
           2017 a; Shan et al., 2018;).                                                               piled data from Grubler et al. (2012) or Grubler and Fisk (2012)
               Second, consumption-based emission accounts include all                                and other sources, such as the World Bank, the Carbon
           GHG emissions resulting from final consumption activities within                           Disclosure Project, national statistic bureaus or some of the city net-
           the urban boundary (Scope 3 accounting). Hence, it includes the                            work initiatives, to investigate patterns of urban GHG emissions
           global GHG emissions in the supply chain of products finally                               and energy use across hundreds of cities worldwide. These analyses
           consumed within the urban territory and leaves out export-related                          show that despite all challenges, important and robust high-level
           GHG emissions. Consumption-based GHG estimates have been                                   findings can be derived with in depth-analysis using advanced stat-
           rare, but more recently a growing number of studies have been                              istical methods. For example, regression tree analysis has been used
           published (Chavez & Ramaswami, 2011; Heinonen et al., 2011;                                to identify distinct types of cities that share configurations of drivers
           Sudmant et al., 2018) and some have even provided estimates                                of energy demand and resulting GHG emissions such as GDP per
           for local administrative units across counties (Minx et al., 2013)                         capita, population density, heating degree days and transport fuel
           or metropolitan areas (Minx et al., 2009; Jones & Kammen, 2014).                           prices (Creutzig et al., 2015 a). Building such typologies is key for
               Third, there are hybrid methods such as Scope 2 accounting                             learning on urban climate solutions and synthesizing evidence.
           and particularly trans-boundary supply chain accounting (TBIA)                                 Since the compilation of these data sets, considerable new city
           (Chavez & Ramaswami, 2011; Ramaswami et al., 2011). Scope 2                                data has been published including larger N samples (Shan et al.,
           emission accounting extends territorial accounts by including                              2018; Nangini et al., In Press) with larger levels of transparency as
           upstream emissions from electricity production (Kennedy et al.,                            reporting standards have been more consistently applied. This will

Downloaded from https://www.cambridge.org/core. IP address: 46.4.80.155, on 20 Oct 2021 at 15:13:47, subject to the Cambridge Core terms of use, available at https://www.cambridge.org/core/terms.
https://doi.org/10.1017/sus.2018.16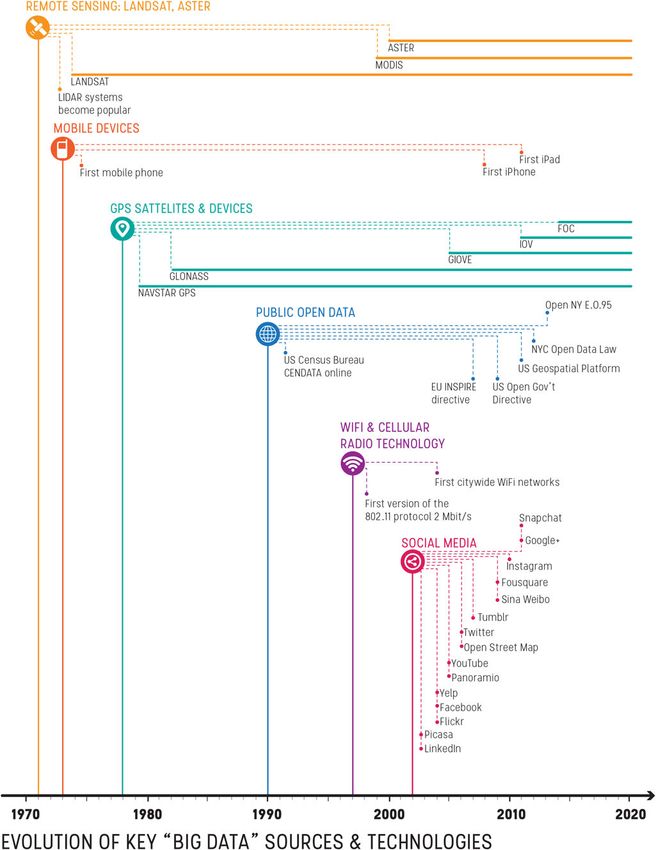
4                                                                                                                                                       Felix Creutzig et al.

          open up new avenues for more advanced and insightful analysis of
          urban GHG emissions and their underlying drivers.                                            Box 1. Spotlight on Asian cities.
              The construction of urban infrastructure is also creating sig-                           As the quantitative scale of urbanization is nowhere as prominent
          nificant emissions in its own right, and the way future cities are                           as it has been in Asia in the first decades of the 21st century, a
          built will determine their energy demand and emissions of tomor-                             focus on Asian cities is warranted. Asian cities are growing at a
          row, given the strong path dependence and lock-in potential of                               historically unprecedented scale and speed. While data on Asian
          urban form (Creutzig et al., 2016). A high share of urban emis-                              cities were scarce und unreliable for a long time, recent efforts
          sions from buildings and transport will originate from both the                              provide better and harmonized data across a growing number of
          construction and the usage in new and emerging cities, particu-                              cities. In CDP’s (cdp.net/en/cities) global data bank of 187 cities,
          larly in Asia, the Middle East and Africa (Creutzig et al., 2016).                           only 18 are from Asia, mostly from Japan, South Korea and
          It is hence of high importance to properly understand the energy                             Taiwan, with the exceptions of two from the Philippines and two
          and emission implications of urbanization in these world regions,                            from Indonesia. However, existing city emission data and
          explored in detail in the data spotlight on Asian cities (Box 1).                            database systems from Japan, South Korea, Taiwan and Hong
          Prospective studies of urban GHG emissions with a full infra-                                Kong provide high detail-resolution, but remain mostly undisclosed.
          structure and life-cycle perspective, however, remain scarce and                             The data are coded in local languages and few efforts have been
          require further investigation.                                                               made to translate them into English except for large cities such as
                                                                                                       Tokyo, Kyoto and Hiroshima. However, emission data of 50 mid-size
          2.2. Observations and remote sensing in the assessment of                                    Japanese cities has been reported and analysed (Makido et al.,
          cities                                                                                       2012).
                                                                                                          In China, the epicenter of current urbanization, there has been a
          In support of post-COP21 actions towards the reduction of                                    considerable increase in city data and studies related to city
          climate-disrupting GHG emissions through a sound scientific,                                 emissions in the last two decades. A recent study showed
          measurement-based approach, the 17th World Meteorological                                    existence of 177 studies, 80 of them in English and 97 related to
          Congress (2015) requested a plan for an Integrated Global                                    cities and emissions (Chen et al., 2017). 122 (or about 45%) of
          Greenhouse Gas Information System (IG3IS). A large part of this                              283 prefecture-level cities have some emission estimates with
          system, coordinated by the World Meteorological Organization                                 various levels of details and explanations of methodologies used,
          (WMO) with partners, is focusing on observations and detecting                               mostly based on city energy consumption data (Figure 1). Other
          mitigation of urban area CO2 and other GHGs (IG3IS, 2016).                                   studies have accounted for emissions in 18 (Xu et al., 2018) and
          Within the four implementation objectives, defined by the                                    24 Chinese cities (Shan et al., 2017 a), developed consumption-
          IG3IS team, one of them is: support subnational government                                   based emission accounts for 13 Chinese cities (Mi et al., 2016)
          entities such as cities and states that represent large GHG source                           and have specifically highlighted emissions for Tibet (Shan
          regions (e.g., megacities) with actionable information on their                              et al., 2017 b). Further efforts summarized data of 637
          GHG emissions at the needed spatial, temporal and sectoral reso-                             Chinese cities to estimate cross-sector climate mitigation
          lution to evaluate and guide progress towards emission reduction                             action potentials (Ramaswami et al., 2017; Tong et al., 2018)
          goals (IG3IS, 2016).                                                                         and built a high-resolution database of gridded emissions
              Measuring CO2 concentrations with very high spatial and                                  (Cai et al., 2018).
          temporal resolutions would enable unforeseen opportunities in                                   In India, urbanization is slower than in China, but urban areas
          urban GHG emission source allocation and accounting, and the                                 are likely to hold 40% of India’s population and could contribute
          corresponding identification of climate solutions. First steps                               75% of India’s GDP by 2030 (compared to 31 and 63%,
          towards performing such measurements in addition to ground-                                  respectively, in 2010). Only few emissions data have been
          based observations have already been taken. In the mid-2000s,                                reported for Indian cities. Selected cities where emission are
          remote sensing of emissions from huge emitters such as power                                 estimated include Ahmadabad (Shukla et al., 2009) and Delhi
          plants was technologically feasible (Bovensmann et al., 2010).                               (Chavez et al., 2012). Another recent study uses survey data to
          It is becoming increasingly possible to measure lower amounts                                estimate urban household based GHG emissions for the largest
          of CO2 emissions and to take higher resolution measurements thanks                           60 municipalities in India, finding efficiency gains in larger cities
          to instruments such as NASA’s Orbiting Carbon Observatory                                    (Ahmad et al., 2015).
          (OCO-2 and OCO-3) (Eldering et al., 2017) or ESA’s Sentinel-5                                   Urban data scarcity is also pervasive in other South Asian
          for methane emissions (Gurney, 2015). Los Angeles has emerged                                countries. The Japanese Low Carbon Society supported
          as a testbed for these advanced monitoring technologies and is                               emissions estimates in a number of smaller cities in Malaysia
          following ambitious efforts to provide monitoring to react and                               and Vietnam (National Institute for Environmental Studies, 2018)
          reduce its carbon emissions (Newman et al., 2016). Urban CO2                                 and a few other studies on specific cities, such as those in
          emissions accounting based on remote sensing will be of increas-                             Kathmandu, have been reported (Shrestha & Rajbhandari, 2010).
          ing relevance in future climate policies and has the potential to                               The key data issues faced by Asian cities are similar to those for
          alleviate data scarcity in cities in the global south. However,                              other world regions, and include a lack of reliable key socio-
          remote sensing data is most valuable when combined with                                      economic and activity data at the city scale; data boundary
          other data that ground-truth it and add additional information                               mismatches; inconsistent methods application; and a lack of
          from social or economic surveys.                                                             realistic assessments of climate solutions and potentials. Consistent
              Remote sensing data offers extensive spatial coverage and the                            evaluation, e.g., under the Global Protocol for Communities (GPC)
          potential of temporal consistency. Simple satellite imagery in the                           and support for database development and analysis are crucial to
          visual spectral lengths – photography – allows the inference of                              upscale urban data-based climate solutions both for Asia and
          structural characteristics such as street networks and the historical                        globally.
          development of built-up areas (Yuan et al., 2005; Xiao et al., 2006).

Downloaded from https://www.cambridge.org/core. IP address: 46.4.80.155, on 20 Oct 2021 at 15:13:47, subject to the Cambridge Core terms of use, available at https://www.cambridge.org/core/terms.
https://doi.org/10.1017/sus.2018.16
Global Sustainability                                                                                                                                                          5

                                                                                                                               Fig. 1. Per capita emissions and GDP in 122 Chinese cities
                                                                                                                               between 2009 and 2012. Total city emissions vary
                                                                                                                               1000-fold (from 0.23–305 million tCO2 per year). The time
                                                                                                                               gap between data and publication is significant: the average
                                                                                                                               gap between the year of the city carbon emissions data and
                                                                                                                               the year of publication is reported as 3.9 years.
                                                                                                                               Source: Chen et al. (2017).

           Multispectral analysis, aided by established indicators such as the                        cities (Seto et al., 2012), allowing an estimation of the associated
           normalized density vegetation index (NDVI) (Gallo et al., 1993;                            loss of agricultural land (Bren d’Amour et al., 2017).
           Tucker et al., 2005; Grover & Singh, 2015) enables the determin-                               Remote sensing information is widely used for climate-change
           ation of material properties or the assessment of vegetation prop-                         related risk assessment and disaster risk reduction. In particular,
           erties related to its water content, cover and type (Ridd, 1995),                          understanding flood risks requires a combination of spatially resolved
           urban land-use structure (Herold et al., 2002), temperature mea-                           data of physical flood exposure – containing data on elevation,
           surements (Tran et al., 2006; Imhoff et al., 2010) and pollution                           hydrology and built-up area – as well as socio-economic data
           (Gupta et al., 2006). A global analysis of the vertical shapes of                          highlighting economic vulnerabilities to flooding. Such a frame-
           cities has revealed how cities in different world regions and at dif-                      work has been presented and applied to case studies, for example,
           ferent stages of development grow differently: from 1999–2009,                             in Copenhagen (Hallegatte et al., 2011; Ranger et al., 2011) and an
           Tokyo or New York have grown in the vertical dimension,                                    overview of future flood risks in 136 major coastal cities has been
           Indian cities have mostly expanded horizontally, while large                               previously published (Hallegatte et al., 2013).
           Chinese cities have grown in both dimensions (Frolking et al.,                                 Downscaled models of climate impacts are crucial to map
           2013) (Figure 2).                                                                          urban adaptation challenges worldwide. Scheuer et al. (2017) pro-
               Remote sensing is a powerful tool, but only if combined with                           pose using the Theil-San estimate and Euclidian distance as a
           other sources (Seto & Christensen, 2013). Its combination with                             measure of magnitude of climate change, both in temperature
           weather data is an obvious candidate for a global analysis of                              and humidity, including long-term average changes as well as
           urban areas and climate change. While weather forecasts and                                weather extremes. This method can be applied for any city and
           reanalyses are able to provide live assessments and temporally                             hence enables global comparisons and rankings of climate change
           highly resolved meteorological parameters, remote sensing                                  impacts (Figure 3). A US-specific study combines Landsat and
           and global climatological climate data sets can inform the long-                           MODIS data in a land model to assess the impact of urbanization
           term climatological characteristics of a city. Particularly inter-                         on US surface climate, finding relevant warming and increased
           esting are temporal and spatial high-resolution microclimate                               surface run-off in built-up areas, but with varying patterns across
           data, including land surface air temperature and humidity,                                 cities (Bounoua et al., 2015).
           available for Europe (Haylock et al., 2008) and worldwide                                      Remote sensing can be used to help assess challenges of urban
           (Kearney et al., 2014), and urban heat island climatologies                                climates, especially the urban heat island effect. Remote sensing
           (CIESIN, 2016).                                                                            allows the application of a consistent methodology across many
               Contextualizing remote sensing data with spatialized socio-                            cities (Peng et al., 2012). Quantities from satellite remote sensing,
           economic data emerges as an increasingly relevant area of                                  such as the NDVI, can predict surface urban heat island (UHI)
           study. In 2010, 4231 cities had a population of more than                                  (Peng et al., 2012; Zhou et al., 2017) and remote sensing can
           100,000 (Atlas of Urban Expansion, 2018). Remote sensing offers                            reveal the growth of the UHI with growth of the urban area extent
           the opportunity to assess these cities in a consistent manner and                          (Streutker, 2003). Urban climates will most significantly be
           analyse the impacts that these settlements have on land use,                               impacted by more severe heat waves (Ganguly et al., 2009; Li &
           GHGs and how they will be impacted by climate change.                                      Bou-Zeid, 2013), which can be explicitly scaled down to specific
           Night-time imagery has been demonstrated to be a useful proxy                              urban locations in climate models. This is of particular import-
           for urban extent and economic affluence (Doll et al., 2000) and                            ance as heat waves lead to deadly outcomes (Mora et al., 2017;
           can be used to estimate spatialized population density data                                Nissan et al., 2017), with currently 30% of the global population
           (Bagan & Yamagata, 2015). Visual observations of urban area                                living in areas experiencing deadly heat in future climates (Mora
           can be combined with forecasts of economic growth to create                                et al., 2017). Such spatially-explicit data can help to assess and
           spatially-explicit projections of future urban expansion in global                         ease and standardize communications of climate impact and

Downloaded from https://www.cambridge.org/core. IP address: 46.4.80.155, on 20 Oct 2021 at 15:13:47, subject to the Cambridge Core terms of use, available at https://www.cambridge.org/core/terms.
https://doi.org/10.1017/sus.2018.16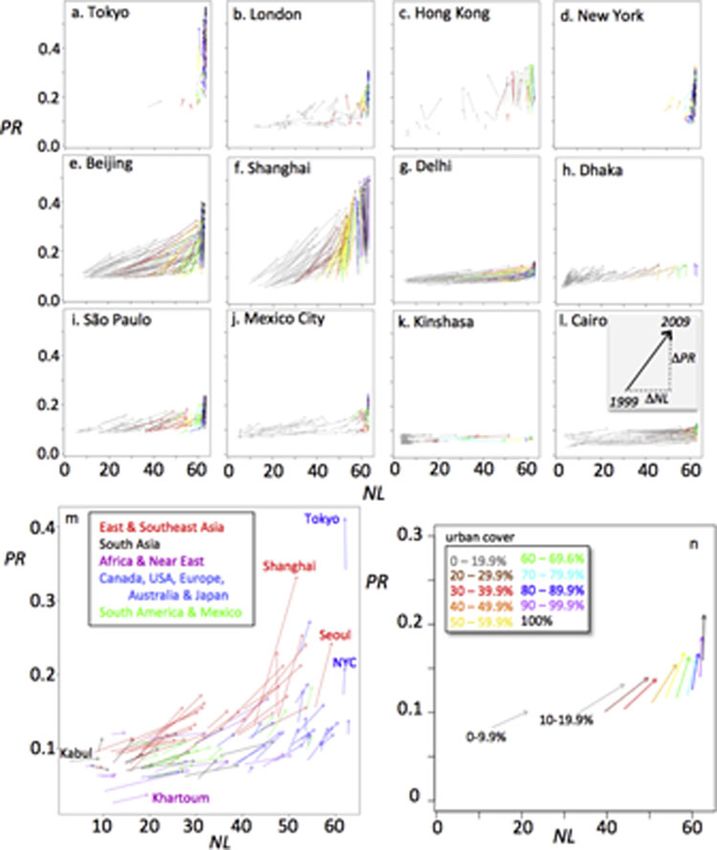
6                                                                                                                                                       Felix Creutzig et al.

          Fig. 2. Changes from 1999–2000 in backscatter power ratio (PR) and nightlight intensity (NL) for 12 global cities. Both metrics represent normalized metrics in the
          range [0,1]. Higher PR values are interpreted as changes in urban built environment and its 3D structure, whereas changes in NL values correspond to urban growth
          into peri-urban areas. Large differences in growth characteristics are revealed. From Frolking et al. (2013).

          enable the identification of cities with similar adaptation chal-                          traditional empirical social survey methods (Wood et al., 2013).
          lenges (Creutzig, 2015). Box 2 provides further examples of how                            This and similar social media analyses (Keeler et al., 2015) offer
          high-resolution maps can assist the integrated assessment of                               the opportunity to complement existing traditional approaches
          settlement patterns.                                                                       to collecting information on human behaviour in cities, that
                                                                                                     can be brought together with other sources of biophysical and
                                                                                                     infrastructural data, especially in spatial formats through GIS.
          2.3. Big data approaches at city-scale
                                                                                                     Big data can also emerge from municipal hotlines, city planning
          Big data, understood as voluminous and complex data of different                           offices, utility use and repair records, tax assessor databases,
          qualities, have the potential to generate new hypotheses and                               and the rapid emergence of sensors and instrumented buildings,
          new methods for understanding interactions between social, bio-                            roads and even ecological spaces. The utility of big data for under-
          physical and infrastructure domains of complex urban systems                               standing urban systems including climate impacts and efficacy of
          facing challenges related to climate change (Herold et al., 2002;                          climate solutions will only increase with time (Knox, 2014).
          McPhearson et al., 2016 c). Crowd-sourced and big data, such                                   Urban decision-makers need improved and regularly updated
          as the movement of people tracked by cell phones, offer manifold                           information on human behaviour and perceptions and how they
          new possibilities for assessing the inner workings of a city, and                          relate to global and local climate change. Linking human behaviour
          the availability, quality and quantity of data is rapidly evolving                         in cities to downscaled climate projections and remotely sensed
          (Figure 4). Crowd-sourced information can serve as a reliable                              observations of urban form, land-use patterns, land cover and
          proxy, with vastly improved resolution and replication, for more                           social-demographic information from national and international

Downloaded from https://www.cambridge.org/core. IP address: 46.4.80.155, on 20 Oct 2021 at 15:13:47, subject to the Cambridge Core terms of use, available at https://www.cambridge.org/core/terms.
https://doi.org/10.1017/sus.2018.16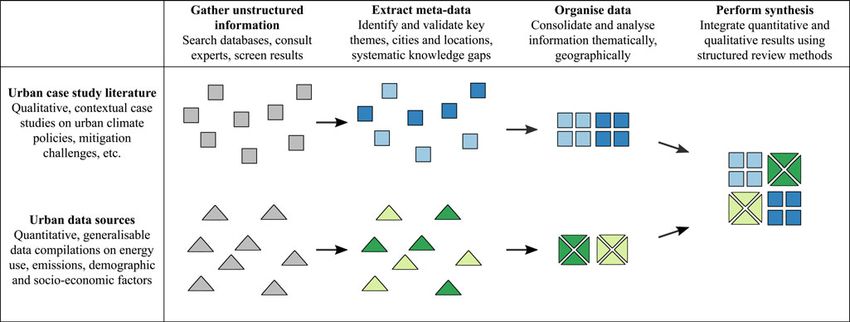
Global Sustainability                                                                                                                                                          7

           Fig. 3. Mapping direction of change in temperature from 1901 until 2014 and precipitation from 1901 until 2013 in cities. The direction of change is indicated by
           colour, where I equals warmer and wetter; II colder and wetter; III colder and drier; and IV warmer and drier conditions. Direction of change is measured as
           Euclidean distance in the 2D space comprising temperature and precipitation change. The classification of the magnitude of change corresponds to quartiles.
           Examplary city abbreviations are as follows: B, Barstow (San Bernardino County, US); BA, Barreiras (Bahia state, Brazil); BR, Brasilia (DF, Brazil); DA, Daman
           (India); K, Khartoum (Sudan); LA, Los Angeles (Los Angeles county, US); P, Palmas (Tocantins/Brazil); R, Rotterdam (Netherlands); S, Surat (India); SD: San
           Diego, US; UT, Utrecht (Netherlands).
           Source: Scheuer et al. (2017).

           databases has the potential to drive a much more nuanced and                               remotely sensed images, roads, parcels). For example, geolocated
           highly spatially resolved platform for improved decision-making.                           Twitter messages can serve as control data for modelling popula-
           Over the past decade, with the advance of big data and the digital                         tion distribution (Lin & Cromley, 2015).
           social sciences, as well as the growing use of social media data                               Research using geolocated SMD to study socioeconomic dis-
           (SMD) in geography studies, a host of new opportunities to aug-                            parities and their relationship to climate impacts in cities is also
           ment and expand urban systems and climate impacts research                                 starting to take shape. Crowd-sourced data from Foursquare
           have emerged (Ilieva & McPhearson, 2018).                                                  users in London, for instance, has been shown to be a reliable
               Geocoded SMD from social media users (e.g., Flickr, Twitter,                           proxy for the localization of income variability and highlighting
           Foursquare, Facebook, Instagram) offer an important new oppor-                             where more at risk neighbourhoods are across the city (Quercia
           tunity to fill data gaps and tackle many of the barriers that prevent                      & Saez, 2014). Yet, mapping based on demographically unrepre-
           researchers and practitioners from understanding the human                                 sentative data can also reproduce spatial segregation and provide
           behaviour component of urban system dynamics and climate                                   an unfair picture of the places that matter citywide (Cranshaw
           change. SMD and other big data enable researchers to ask a                                 et al., 2012). This holds true for global-scale analyses as well.
           wide range of spatially explicit questions at an unprecedented                             The volume of geocoded tweets greatly differs across nations.
           scale. Most social media provide the possibility to manually select                        The US and Brazil are some of the countries where the ratio
           the location from where one posts a message, or have it automat-                           between geocoded and non-geocoded tweets is the highest,
           ically added through geolocation tracking services. Even though,                           while countries such as Denmark and Norway register signifi-
           at present, geolocated tweets and Flickr photographs represent a                           cantly lower values (Graham et al., 2013). The emergence of mul-
           tiny fraction of the overall volume of SMD (e.g., tweets geocoded                          tiple forms of big data creates exciting alternatives to assess how
           via GPS constitute only 1% of all tweets) (Crampton et al., 2013)                          people use and respond to urban events, plans, policies and
           the sheer quantity of these data makes them worth examining.                               designs for climate change adaptation and mitigation. New
           Geotagged tweets can augment traditional control data (e.g.,                               forms of data may be a crucial resource in examining the use,

Downloaded from https://www.cambridge.org/core. IP address: 46.4.80.155, on 20 Oct 2021 at 15:13:47, subject to the Cambridge Core terms of use, available at https://www.cambridge.org/core/terms.
https://doi.org/10.1017/sus.2018.16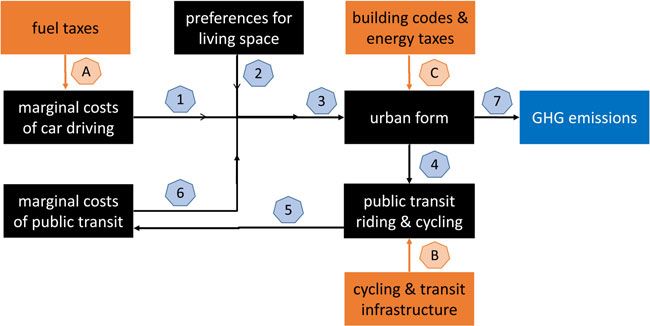
8                                                                                                                                                       Felix Creutzig et al.

                                                                                                     research methods and data, in SMD-based research they are
              Box 2. High-resolution maps for assessment.                                            often due to uncertainty about present and future rules of conduct
              High-resolution maps containing population, settlements and                            for data collection and analysis and data access arrangements.
              urban footprints form the basis for an integrated assessment of                        Regarding the rules of conduct, a major challenge is the risk of
              global settlement patterns. Rapid advances have been made in                           violating social media users’ privacy. This could occur either dir-
              the past decade in the development of such maps. Both new                              ectly through, for example, the use of user-generated geolocated
              satellite technology – such as the Tandem-X radar satellites –                         data (Schwartz & Halegoua, 2015), or indirectly through the coup-
              and improved data processing via machine learning have                                 ling of multiple data sources revealing information that users had
              facilitated rapid advances in their accuracy and resolution. Until                     no intention to disclose (Acquisti & Gross, 2009). The general
              recently, the MODIS 500 urban land cover (Schneider et al., 2010)                      point of contention is that social media users do not grant consent
              represented the state of the art in urban land cover data sets                         for the extraction and circulation of the data they author in any for-
              (Potere et al., 2009). It is now outperformed by both the Global                       mal way, nor do they generally picture researchers as the intended
              Urban Footprint (GUF) data set which provides higher resolution                        audience of the content they share with relatives, friends and collea-
              and accuracy than any other urban land cover data set (Esch                            gues (Schwartz & Halegoua, 2015). Thus, the manipulation of SMD
              et al., 2017), even when compared to the high quality Global                           can lead to unwanted privacy invasion and transparency evasion.
              Human Settlement Layer (GHSL) (Pesaresi et al., 2013; Pesaresi                         Ilieva and McPhearson (2018) suggest seven ways to begin to
              et al., 2016) or GlobeLand 30 (Chen et al., 2015). The GUF                             address privacy and ethical concerns with the use of SMD in sus-
              features a binary urban footprint at a resolution as high as 0.4”                      tainability research:
              (approximately 12 m) at the equator and 0.6” in the
              mid-latitudes on a global coverage, and is freely available for                        • Anonymize data and ensure that no interaction with the indivi-
              scientific use. This high resolution constitutes a paradigm shift in                     duals in the sample takes place
              studying urban extent for cities worldwide.                                            • Use only geotagged and time-stamped information without
                                                                                                       accessing personal details
                                                                                                     • Assess how SMD research complies with IRB guidelines
                                                                                                     • Secure data and resolve ownership and IP issues
          value and social equity of particular spaces in the city that provide                      • Host data-download applications on a restricted access website
          refuge during climate driven extreme events, such as parks, vacant                         • Use more integrated analytical tools with privacy protection
          areas and nonpark open spaces that can provide, for example,                               • Re-conceptualize privacy
          cooling during heat waves. Working with big data offers oppor-
          tunities with multiyear to decadal data sets to understand
          human–nature interactions in the city as never before and could                               Big data can become a central tool for online monitoring of
          prove crucial to assessing progress on examining impacts of cli-                           urban risks and climate policies, enabled by sensor-based cities
          mate change and of mitigation options in cities (Ilieva &                                  and the vast amounts of data routinely generated by their inhabi-
          McPhearson, 2018).                                                                         tants via social media (Figure 4 illustrates the Newcastle case).
              Various sources of big data have already been useful for                               Applications include:
          informing disaster risk management and climate adaptation plan-
          ning. Kusumo et al. (2017) used volunteered geographic informa-                            ➢ Using real-time data feeds from local weather stations, rainfall
          tion through SMD as a source for assessing the desired location                              gauges and sewer gauging to assimilate real-time data within
          and capacity of flood evacuation shelters, while Brouwer et al                               hydrodynamic models for improved flood prediction;
          (2017) used SMD sourced observations of flooding to develop a                              ➢ Combining local high frequency observations, with regional/
          method for estimating flood extent in Jakarta, Indonesia. In                                 national monitoring and predictions, along with tracking of
          New York City, following the devastating impact of Hurricane                                 geospatial social messaging (e.g., tweets of incidents as they
          Sandy, researchers used Twitter SMD to reveal the geographies                                occur) to provide improved early warning of potential impacts;
          of a range of social processes and practices that occurred immedi-                         ➢ Employing image processed CCTV feeds to understand
          ately after the event (Shelton et al., 2014). Stefanidis et al. (2013)                       hazards, e.g., of surface water locations and social media feeds
          used Twitter data collected during the devastating Sendai                                    to validate in real-time the emergent patterns of flooding;
          (Tohoku) earthquake in Japan (3/11/11) to examine social net-                              ➢ Integrating spatially heterogeneous sensor data feeds on flows
          works and build a database for studying the human landscape                                  and movements (e.g., traffic) with geospatial social messaging,
          of post-disaster impacts. Understanding interactions between cli-                            CCTV and other data for improved understanding of the tem-
          mate change and fire prone landscapes is another important area                              poral dynamics of impacts;
          of concern for both climate change adaptation and disaster risk                            ➢ Coupling CCTV monitoring with social media data feeds to
          reduction. Kent et al. (2013) were able to use SMD (including                                better understand citizen reaction and response to emerging
          Twitter, Flickr, Picassa and Instagram data) to examine spatial                              impacts for improved future hazard mitigation and planning;
          patterns of situational awareness during the Horsethief Canyon                             ➢ Using knowledge from previous events, including modelling
          Fire (2012) in Wyoming, USA and demonstrated the utility of                                  result sets of both hazards and impacts, to improve ‘ahead of
          SMD for actionable content during a crisis.                                                  event’ response from the site to the city-scale for future ‘events’.
              Combining satellite data with other datasets and analysing it
          via state-of-the-art machine learning is another promising                                 An example for a specific city is the Newcastle Urban Observatory
          route. For example, it allows for the estimation of poverty levels                         which records one million city observations a day, of over 50
          from satellite data (Jean et al., 2016) (see Box 3).                                       social, environmental and technical processes, across the city.
              SMD and other sources of big data are not without privacy and                          These include transport emissions, precipitation, surface water
          ethical challenges. While ethical concerns pertain to all kinds of                         and river flows, air and water quality, and biodiversity health

Downloaded from https://www.cambridge.org/core. IP address: 46.4.80.155, on 20 Oct 2021 at 15:13:47, subject to the Cambridge Core terms of use, available at https://www.cambridge.org/core/terms.
https://doi.org/10.1017/sus.2018.16
Global Sustainability 9
Fig. 4. Evolution of key ‘big data’ sources and technologies and the rise of social media data. The evolving data landscape over the past few decades demonstrates
the increasing availability of location-based social, infrastructural and landscape/biophysical data. Social media data represents a major new phase in our ability to
understand links between human behaviour, values and preferences, and infrastructural, climatological or other core components of urban, peri-urban and rural
systems that are important for driving transformative change for improving sustainability. Source: Ilieva and McPhearson (2018).
Downloaded from https://www.cambridge.org/core. IP address: 46.4.80.155, on 20 Oct 2021 at 15:13:47, subject to the Cambridge Core terms of use, available at https://www.cambridge.org/core/terms.
https://doi.org/10.1017/sus.2018.1610 Felix Creutzig et al.
There are inherent spatial, temporal and institutional scale mis-
Box 3. Machine learning approaches to process remote sensing matches between urban governance and climate actions, which
data means urban scale climate policies often encounter more serious
Machine learning techniques, such as neural networks, are roadblocks such as political will, institutional arrangements,
powerful tools for the analysis of big, multi-dimensional and financial and knowledge capacity, and are influenced by misin-
often complex big data, where complexity needs to be reduced formed perceptions and arguments (Bai, 2007 b). However, data
to understand its main drivers (Hinton & Salakhutdinov, 2006). is arguably one of the first challenges cities encounter once they
Convolutional neural networks (CNN) serve well to classify embark on the journey to address climate change/urban sustain-
images (Krizhevsky et al., 2012), and are increasingly used to ability issues. Indeed, lack of information and data can become a
assess land-use patterns (Castelluccio et al., 2015). Some serious constraint for smaller cities, and in particular for the
researchers have taken this approach further and combined it majority of cities in the Global South (Nagendra et al., 2018).
with the analysis of socio-economic data (Tapiador et al., 2011; We argue that the right data at the right scale is an insufficient
Jean et al., 2016). Jean et al. (2016)’s work is particularly but necessary condition for urban climate policies.
instructive. They predict poverty in five different African countries – Three data-based approaches will help to directly support the
Nigeria, Tanzania, Uganda, Malawi and Rwanda – at a ward/village design of targeted climate policies, as they will inform their miti-
scale using a combination of CNN, daytime satellite imagery and gation and adaptation potential. Availability of data may not guar-
nightlight data. To build their analysis, they use a three-step antee climate-friendly policies alone, but can inform about best
approach. First the CNN is trained on ImageNet (Deng et al., 2009) solutions.
to learn how to distinguish visual properties such as edges and The first approach makes use of GHG data accounting and
corners. In the second step it is fine-tuned so that it is able to ancillary variables to identify city-specific drivers of emissions
predict night-time intensities from daytime images. Nightlights are and climate risks, and infer policy levers. The second approach
a globally consistent predictor of poverty, thus the model is combines urban economics and urban planning insights to prop-
trained to focus on the aspects in daytime imagery that are erly explain observed data and predict consequences of policy
relevant to poverty estimation. In the third and final step, implementations. The third approach performs systematic policy
socioeconomic survey data is added to the analysis. It is used to reviews of urban municipalities, providing an ex-post analysis of
train ridge-regression models on both household surveys and the climate actions. The set of all three approaches is required to
image features from steps 1 and 2. Their approach exploits upscale urban climate solutions beyond individual cities.
night-time data as a globally consistent, but highly noisy proxy for
poverty in an intermediate step and ultimately explains 37 to 55%
of average household consumption, and 55 to 75% of the variation 2.4.1. Driver analysis of urban climate data
in average household asset wealth. While using publicly available Data of urban GHG emissions and energy use, combined with
data, it provides better results than mobile-phone based studies ancillary socio-economic, geographical and urban form para-
and far outperforms products that rely solely on nightlights. Another meters, allow for the identification of policy levers stratified across
recent study uses data taken from Google Street View images and types of cities. Globally, urban typologies demonstrate how cli-
machine learning techniques (feature extraction and v-support mate mitigation efforts require different policies for different
regression) to successfully estimate high income areas in US cities city types. Advanced statistical analysis of large data sets (decision
(Glaeser et al., 2018). The usage of phone records can reveal tree methods) reveal the uniting and dividing drivers of urban
detailed mobility patterns for improving both the understanding of energy use across different cities (Creutzig et al., 2015 a).
travel behaviour and traffic management (Toole et al., 2015). Results demonstrate that transportation fuel taxes are a main
lever to not only influence urban transport emissions, but also
total urban GHG emissions (Creutzig et al., 2015 a). The same
method in identifying levers has also been successfully applied
indices such as beehive weight. The data are openly available for countries like the UK, enabling a more refined analysis of dri-
through an API and can inform adaptation and mitigation activ- vers, such as heating systems and building vintages, at high spatial
ities in sectors such as transport, building energy, urban greening resolution (Figure 5) (Baiocchi et al., 2015). Intertemporally con-
and flood management. The City Council are already using this sistent household surveys performed in India similarly enable the
high-resolution dataset to inform environmental and transporta- spatially complete analysis of household energy demand and
tion strategies. GHG emissions, stratified along individual social and economic
However, in order to realize the full potential of ‘big data’ characteristics (Ahmad et al., 2015). Arguably, similar typologies
sensor networks and social media feeds that are continuously could also be suitable for identifying climate adaptation strategies
capturing the dynamics of cities in real-time, new approaches (Creutzig, 2015).
are required. These must rigorously evaluate and integrate real- The advantage of this approach is a globally consistent method
time data and information from traditional and new ‘big data’ identifying options stratified across city-specific characteristics.
sources. The sheer volume of information requires advanced This inter alia allows mayors to learn from best-in-class cities of
analytics and methods for uncertainty handling to process and the same type. Cities can be classified into different types by
assimilate this data for real-time decision-making and long-term using urban form, economic activity, transport costs and geo-
planning. graphic factors as typical indicators (McPhearson et al. 2016 b).
Distinct city types with varying degrees of centricity emerge,
such as spread-out commuter cities or dense cities (Baiocchi
2.4. Data-based approaches for urban climate policies
et al. 2015; Creutzig 2015). The disadvantage is that this method
Urban climate mitigation and adaptation actions encounter many neither provides city-specific resolution on implementation, nor
roadblocks (Bulkeley & Betsill, 2013; Rosenzweig et al., 2011). does it identify barriers and obstacles in the political economy.
Downloaded from https://www.cambridge.org/core. IP address: 46.4.80.155, on 20 Oct 2021 at 15:13:47, subject to the Cambridge Core terms of use, available at https://www.cambridge.org/core/terms.
https://doi.org/10.1017/sus.2018.16Global Sustainability 11
Fig. 5. London administrative units are characterized by pat-
terns of residential emission drivers. Each node corresponds
to a statistically distinct combination of housing, climate,
urban form and socio-economic characteristics explaining
location-specific residential GHG emissions.
Source: Baiocchi et al. (2015).
2.4.2. Urban economics and urban planning promising but depend on rich data input from municipalities
Theory and conceptual insights on how cities can be influenced to that are not available everywhere and are not easily tractable in
reach mitigation goals are highly relevant for urban policy deci- terms of identifying key drivers. Similarly, urban econometric
sions, especially when empirically founded. Here, both urban eco- analysis can reveal unexpected effects. In the US, urban planning
nomics theory as well as empirically founded analyses on cities as regulations correlate counterfactually to higher emissions: in cities
complex systems come into play. Urban economics theory with lax zoning regulations new city construction leads to low
explains the key relationship between land prices, transportation density development, and in hot climates there is an extra energy
costs and amenities such as schools (Fujita, 1989), which greatly demand for cooling (Glaeser & Kahn, 2010).
influence land use and energy demand and is well-founded by
empirical data pointing to the relationship between urban density 2.4.3. Ex-post analysis of urban policies
and energy requirement (Newman & Kenworthy, 1989). Urban Triggered by the slow progress in international climate policy over
econometric models aim to identify key drivers of emissions the last two decades, a significant number of bottom-up efforts
that have complex repercussions (Creutzig, 2014; Borck & lead by local governments in cities to combat climate change
Brueckner, 2016). This theory supports the strong and non-linear have emerged with thousands of local governments developing
effect of fuel prices on both transport energy demand and urban and implementing local climate action plans. Ex-post analysis
density (Creutzig, 2014; see also Figure 6). Population density was could answer questions such as: what effect will the combined
shown to be a proxy variable for more specific urban form para- mitigation plans of the world’s cities have on global GHG emis-
meters, such as street connectivity and commuting distance sions? How well protected are city inhabitants against floods?
(Mindali et al., 2004). More general meta-analysis highlights the What actions have been taken, and how effective have they
relevance of the ‘5Ds’ (density, diversity, design, destination acces- been, to enhance adaptive capacity and reduce risks within a
sibility and distance to transit) as key variables of urban planning city? Which combination of city and non-city organizations
for reducing GHG emissions (Ewing & Cervero, 2010; Stevens, need to be involved to effectively deliver a particular climate
2017). Population density reveals to be a useful proxy nonetheless: action in a given city?
thresholds for energy-efficient public transportation of around But even as first case studies are emerging (Ottelin et al., 2018),
50–150 persons/ha point to sustainable urban development win- little is known about the impact these measures have had on redu-
dows, enabling low-carbon mobility (Lohrey & Creutzig, 2016) cing emissions (Seto et al., 2014; Minx, 2017). This lack of knowl-
and low-carbon residential energy use (Baiocchi et al., 2015). edge is currently a direct barrier to learning about the effects and
Data from many cities reveal some fundamental scaling laws efficacy of local climate solutions. Hence, developing a body of lit-
that seem universal across cities, often related to their size erature that aims to understand what solutions work for whom
(Bettencourt et al., 2007). Influential work on understanding cit- under what conditions and why would fill an important informa-
ies as complex systems (McPhearson et al., 2016 a; Alberti, tion gap for policy makers and practitioners. Yet, conducting such
McPhearson & Gonzalez, 2018) using, for example, advanced analysis at the local scale is complex and littered by data chal-
statistics, fractal geometry or network theory, shows an empiric- lenges, even though various work already gathers urban data on
ally founded view on the nature of urban areas, adding more sustainability policies. For example, Hawkins et al. (2016), build-
dimensions to the relationships described by urban economics ing on the Integrated City Sustainability Database (ICSD) (Feiock
theory (Batty, 2008). et al., 2014), analyse six explanations for local governments’
At the intersection between urban planning and computa- motivation to commit to sustainability and find that local prior-
tional urban economics, detailed land-use and transport models ities, regional governance and participation in a sustainability
can capture system-wide emission effects of planning decisions network are strong factors in influencing communes towards sus-
over time (Echenique et al., 2012). Such models are extremely tainability policies.
Downloaded from https://www.cambridge.org/core. IP address: 46.4.80.155, on 20 Oct 2021 at 15:13:47, subject to the Cambridge Core terms of use, available at https://www.cambridge.org/core/terms.
https://doi.org/10.1017/sus.2018.16You can also read