DISASTERS - 2020 ANNUAL SUMMARY - NASA Earth Science Applied Sciences Program - NASA Applied Science
←
→
Page content transcription
If your browser does not render page correctly, please read the page content below
2 0 2 0 A N N UA L S U M M A RY

DISASTERS

                        NASA Earth Science
                        Applied Sciences Program
2020 Annual Summary

Applied Sciences Division
Lawrence Friedl, Applied Sciences Program Director
lfriedl@nasa.gov

Disasters Program Management Team
David S. Green, Program Manager
david.s.green@nasa.gov

John J. Murray, Associate Program Manager for ROSES
john.j.murray@nasa.gov

H. Michael Goodman, Associate Program Manager for ROSES
michael.goodman@nasa.gov

Disasters Program Websites:
http://appliedsciences.nasa.gov/programs/disasters-program
https://disasters.nasa.gov
https://maps.disasters.nasa.gov

______________________________________________________________________________
NASA Earth Science • Applied Sciences Program: Disasters 2020 Annual Summary • 1
NASA Disasters Program 2020 Annual Summary

Table of Contents
I. Introduction .................................................................................................................... 3

II. Disaster Research ......................................................................................................... 5

   A. Disaster Response and Risk Reduction (A.37) Projects .................................... 7

   B. NASA ROSES 2016 GEO GWIS A.50 Global Flood Research Management
   Projects ......................................................................................................................... 37

   C.    NASA ROSES 2016 GEO GWIS A.50 Global Wildfire Information System
   Projects ......................................................................................................................... 47

III. Disaster Response ...................................................................................................... 56

IV. Communications Highlights .................................................................................... 65

V. Abbreviations and Acronyms .................................................................................. 67

______________________________________________________________________________
NASA Earth Science • Applied Sciences Program: Disasters 2020 Annual Summary • 2
I. Introduction

NASA's vision is to deliver science that informs choice, supports decisions, and guides action.
The Disasters Program’s mission is to foster the development, access, and translation of the best
available Earth system science into applications that equip users to help avert needless suffering
when natural hazards threaten to become disasters. Hazardous natural events such as
earthquakes, wildfires, tsunamis, droughts, and hurricanes certainly require knowledge of
geophysics, physical geography, or climatology to comprehend. However, whether a natural
event is a disaster or not ultimately depends on its location and its impact on humans.

Using the data from NASA's Earth Observation platforms and other sources, our geospatial tools
provide the ability to identify where natural hazards, infrastructure, and under-resourced and
marginalized populations converge to create areas of increased vulnerability and risk. The
Disasters Program readies tools that leverage publicly available data to visualize the interplay
between those factors and identify vulnerabilities.

Before, during, and after disasters strike, our team coordinates with decision-makers and local
governments, providing actionable data to enable recovery from disaster impacts and build
resilient communities. The Disasters Program sponsors application science to advance the
creation and distribution of rapid and accurate information, enable disaster management
practices, advance damage reduction, and build resilience. By providing information and tools to
increase understanding, we help the world address systemic disaster risk and increase sustainable
resilience throughout the disaster management cycle.

2020 was a powerful reminder that community resilience to compound hazards is vital. As the
COVID-19 pandemic made in-person logistics more challenging, NASA data and information
became even more valuable to impacted communities. In 2020, our country endured the worst
wildfire season ever recorded, with a record-shattering 18 infernos, each affecting 100,000 acres
or more across the western United States (U.S.) The year also shattered record books with the
most active Atlantic hurricane season ever observed. Five of these named tropical storms or
hurricanes made landfall in Louisiana. The National Oceanic and Atmospheric Administration
(NOAA) reported the most billion-dollar disasters in the U.S. in a single year in the four decades
they have kept track—including a powerful Midwest derecho that proved to be the costliest
thunderstorm in our nation's history.

Other parts of the world suffered as well. Bush fires that began in November 2019 in Australia
burned more than 46 million acres and took nine months to contain. A warehouse explosion in
Beirut, Lebanon left 300,000 people homeless and caused up to $15 billion in damage. Two
Category 4 hurricanes struck Nicaragua within 15 miles of each other—and just two weeks
apart—a first-time occurrence in nearly 170 years of record. The “one-two punch” of the storms
led to deadly flooding and landslides throughout Central America.

If 2020 showed us anything, it was the importance of building community resilience to combined
hazards and the cascading impacts they bring. NASA's Disasters Program rose to the challenges
by convening and working with colleagues and stakeholders from a vast range of sectors to
provide innovative approaches to reduce compound disaster risk.

______________________________________________________________________________
NASA Earth Science • Applied Sciences Program: Disasters 2020 Annual Summary • 3
When disasters occur, our researchers also become providers and distributors of images, data,
and damage assessments. The Disasters team and its network of partners and volunteers assist
with hazard assessment, evaluating severity, and identifying impacts near vulnerable
infrastructure, crops, and lifelines to help guide action. This collaboration provides cutting-edge
tools and unique perspectives for disaster responders, while also serving as a valuable real-world
research testbed.

This report illustrates numerous examples of how the Disasters Program actively developed
connections, nurtured relationships, and collaborated with organizations to engage global,
regional, and local disaster management leaders. Through these efforts, we ensure NASA's
research, expertise, and Earth observation (EO) data provide the most value and positive impact.

Disaster Research for 2020

A portfolio of diverse disaster research projects is at the program's core. These projects include
10 NASA Research Opportunities in Space and Earth Science (ROSES) Disasters A.37 Disaster
Response and Risk Reduction projects and six Group on Earth Observations (GEO) Work
Programme Projects.

Despite the global pandemic, these projects made substantial progress advancing Application
Readiness Levels (ARL). Nearly all the A.37 projects are now at ARL 5 or above, which means
they have been validated in relevant environments. Each project in our research portfolio
continues to mature swiftly toward adoption, and additional information about them is detailed in
this report.

Disaster Response for 2020

The response support area of the Disasters Program functions in a unique way within the Applied
Sciences Program, as well as the greater NASA community. The response team comprises a
NASA Headquarters-based team of program management and support personnel, emergency
managers, and geographic information system (GIS) specialists, as well as disaster coordinators
located at six NASA centers across the U.S. Assigned coordinators at each center work across
the agency as a group during disaster-response situations. Their role includes relevant
engagement with any person or group at each center who may be able to contribute relevant
information or data in a disaster-response situation.

Fostering widespread relationships within individual NASA Centers and in relevant fields is
essential. Bringing these relationships and bodies of knowledge together across centers promotes
and strengthens the program's effectiveness and reach. Such knowledge is vital to the program's
success because coordinators must be aware of all available avenues of collecting data quickly
following any particular disaster situation on a global scale.

The Disasters Program responded to 50 activations in 2020. Activations from 12 unique hazard
categories developed into disasters. Many of these disasters were massive events, demanding
extensive support over weeks or months. The Western U.S. wildfires and the rapid landfall and
resulting impacts of Hurricanes Eta and Iota in Central America are among the events

______________________________________________________________________________
NASA Earth Science • Applied Sciences Program: Disasters 2020 Annual Summary • 4
highlighted in this report that demonstrate the depth and impact of Disasters Program
contributions.

II. Disaster Research
The foundation of the Applied Sciences Program’s mission is its applied science and research,
which the NASA Disasters Program implements through a robust portfolio of collaborative
projects.
In 2020, the program’s research portfolio primarily consisted of the ten NASA ROSES Disasters
A.37 Disaster Response and Risk Reduction projects (Table 1) and six GEO Work Programme
Projects. The GEO projects include three Global Flood Risk Monitoring (GFRM) Community
Activity projects and three Global Wildfire Information System (GWIS) Initiative projects
(Table 2).

Table 1. NASA ROSES 2018 A.37 NASA Disaster Response and Risk Reduction project portfolio

 Principal      Organization     Proposal Title
 Investigator
 (PI) Name
 Bedka          NASA Langley     Hailstorm Risk Assessment Using Spaceborne Remote Sensing Observations
                Research         and Reanalysis Data
                Center (LaRC)
 Glasscoe       NASA Jet         Advancing Access to Global Flood Modeling and Alerting using the Pacific
                Propulsion       Disaster Center (PDC) DisasterAWARE Platform and Remote Sensing
                Laboratory       Technologies
                (JPL)
 Hilburn        Colorado State   Coupled Interactive Forecasting of Weather, Fire Behavior, and Smoke Impact
                University       for Improved Wildland Fire Decision-Making
 Huyck          ImageCat Inc.    Open Critical Infrastructure Exposure for Disaster Forecasting, Mitigation,
                                 and Response
 Kirschbaum     NASA Goddard     Enabling Landslide Disaster Risk Reduction and Response Throughout the
                Space Flight     Disaster Lifecycle with Multi-Scale Toolbox
                Center (GSFC)
 Krotkov        NASA GSFC        Day-Night Monitoring of Volcanic Sulfur Dioxide and Ash for Aviation
                                 Avoidance at Northern Polar Latitudes
 Melgar         University of    Local Tsunami Early Warning with Global Navigation Satellite System
                Oregon           (GNSS) Earthquake Source Products
 Meyer          University of    Integrating Synthetic Aperture Radar (SAR) Data for Improved Resilience and
                Alaska-          Response to Weather-Related Disasters
                Fairbanks
 Monaldo        University of    Development and Implementation of Remote Sensing Techniques for Oil Spill
                Maryland-        Monitoring and Storm Damage Assessment in an Operational Context
                College Park
 Yun            NASA JPL         Global Rapid Damage Mapping System with Spaceborne SAR Data

______________________________________________________________________________
NASA Earth Science • Applied Sciences Program: Disasters 2020 Annual Summary • 5
Table 2. NASA ROSES 2016 A.50 Group on Earth Observation (GEO) Work Programme Projects

 PI Name        Organization     Proposal Title
 Brackenridge   University of    Integrating Global Remote Sensing and Modeling Systems for Local Flood
                Colorado-        Prediction and Impact Assessment
                Boulder
 Kruczkiewicz   Columbia         Toward a Global Flood and Flash Flood Early Warning Action System
                University       Driven by NASA Earth Observations and Hydrologic Models
 Yun            NASA JPL         Global Flood Mapping System with Spaceborne Synthetic Aperture Radar
                                 Data
 Boschetti      University of    Using the NASA Polar Orbiting Fire Product Record to Enhance and Expand
                Idaho            the Global Wildfire Information System
 Field          NASA GSFC        Fire Danger Rating and Applications Indonesia
 Giglio         University of    Development of a Harmonized Multi-Sensor Global Active Fire
                Maryland         Data Set

______________________________________________________________________________
NASA Earth Science • Applied Sciences Program: Disasters 2020 Annual Summary • 6
A. Disaster Response and Risk Reduction (A.37) Projects

Hailstorm Risk Assessment Using Spaceborne Remote Sensing
Observations and Reanalysis Data
                 Principal Investigator: Kristopher Bedka/NASA Langley Research Center
                 (LaRC)
                 Co-Investigators: Sarah Bang/NASA Marshall Space Flight Center (MSFC),
                 Jordan Bell/NASA MSFC, Dan Cecil/NASA MSFC, Kyle Itterly/LaRC-Science
                 Systems and Applications, Inc. (SSAI), Konstantin Khlopenkov/LaRC-SSAI, Ben
                 Scarino/LaRC-SSAI, Chris Schultz/NASA MSFC

Hail is the costliest severe weather hazard for the insurance industry, and hail catastrophe models
(CatModels) are used by reinsurance to estimate risk to an insurer’s portfolio. CatModels are
developed with climatologies that define hailstorm frequency and severity, but hail climatologies
are difficult to derive over developing nations without hail reporting or climate-quality weather
radar observations. Hailstorms and the damage they produce to the land surface generate unique
patterns in satellite imagery that has been collected for 25+ years in some regions. Therefore, this
project seeks to (1) combine reanalyses with geostationary and low-Earth-orbiting imager data to
develop new hailstorm climatologies and regional CatModels, and (2) use optical imager and
synthetic aperture radar data to develop new methods for hailstorm damage mapping to aid
disaster response.
This project, conducted by the NASA Satellite Mapping and Analysis of Severe Hailstorms
(SMASH) team, is a partnership between NASA Langley Research Center and Marshall Space
Flight Center, Willis Towers Watson (WTW), Karlsruhe Institute of Technology (KIT), a variety
of international partners across South America and South Africa, and several U.S. academic
partners. WTW provides global advisory and brokering services by working with clients to
understand risk better and provide financial resilience against extreme loss-generating events
such as hailstorms. The project focused on the detection and characterization of intense
thunderstorm updraft regions where hail and other forms of severe weather such as tornadoes and
damaging straight-line winds are concentrated.
Updrafts were studied using Geostationary Operational Environmental Satellite (GOES) and
European Organization for the Exploitation of Meteorological Satellites (EUMETSAT) Meteosat
Second Generation (MSG) geostationary infrared imagery and low-Earth-orbiting passive
microwave imagers aboard the NASA Tropical Rainfall Measuring Mission (TRMM), the
Global Precipitation Measurement (GPM) mission, and NASA Aqua satellite, and the Japan
Aerospace Exploration Agency (JAXA) Global Change Observation Mission-Water 1 (GCOM-
W1) satellite. Hailstorm updrafts often penetrate through (or “overshoot”) the tropopause, but
most non-severe storm updrafts do not. Automated detections of overshooting tops from
geostationary imagery, therefore, serve as indicators for where hail and other severe weather
could have occurred. A large and/or high concentration of ice particles within a thunderstorm
updraft scatters energy emitted by Earth in passive microwave wavelengths before it can reach
the satellite sensor, leading to radiance depressions detected using state-of-the-art NASA
algorithms.

______________________________________________________________________________
NASA Earth Science • Applied Sciences Program: Disasters 2020 Annual Summary • 7
Geostationary infrared and Low Earth Orbit (LEO) passive microwave imager data were used to
develop regional- to global-scale hailstorm climatologies. A 15-year MSG overshooting cloud
top detection database over South Africa was delivered to KIT and WTW to enable CatModel
development, an immediate business need at WTW during the first year of this project. These
detections, compiled using imagery with 3-km pixels and 15-minute frequency, were combined
throughout the lifetime of each thunderstorm event using sophisticated spatio-temporal
clustering. This storm event set was used to define the climatological characteristics and
frequency of South African hailstorms (Figure 1). The climatology was then replicated with a
model simulation extending over a 25,000-year period. This simulated storm event set is the
heart of the hail CatModel in that it is used to estimate financial impact to a given insurer's
portfolio at return periods far exceeding the length of the satellite data record, such as a 1-in-200-
                                                                year event that is commonly used
                                                                for decision-making in the insurance
                                                                industry.
                                                                      The WTW CatModel became
                                                                      operational in early 2021, and
                                                                      development and operationalization
                                                                      of the CatModel represented an
                                                                      increase from ARL (Application
                                                                      Readiness Level) 7 to 8, which will
                                                                      later increase to ARL 9 after
                                                                      sustained use. A similar workflow
                                                                      will be applied to the 25+ year
                                                                      GOES data record to develop a hail
                                                                      CatModel over South America.
                                                                      Geoffrey Saville, senior research
                                                                      manager for the Willis Research
 Figure 1. A South Africa hailstorm climatology, depicted in terms of Network’s Weather and Climate
 hail events per year per 2 km model grid box, derived from a         Hub said, “It is hoped that this hail
 combination of Meteosat Second Generation geostationary infrared
 data and stochastic modeling at KIT and WTW. Graphic is courtesy
                                                                      risk modeling capability will be
 of Willis Towers Watson.                                             applied to Willis Towers Watson’s
                                                                      major reinsurance clients to help
with the pricing of reinsurance contracts and assessing capital and reserves to meet regulatory
requirements. By leveraging our research relationship with academic partners at Karlsruhe
Institute of Technology in Germany and being a part of this NASA project, we can not only
provide a business rationale to develop the new techniques to assess hail risk, but also work with
clients in South Africa to manage the risks of severe storms and support business and personal
insurance.”
A global passive microwave hailstorm climatology was generated using TRMM and GPM data
from 1998 to 2019 (Figure 2). Though coarser in spatial resolution, the passive microwave
climatology was correlated with the hailstorm distribution derived over South Africa using MSG,
and to highlight other hail hotspots around the world, including the U.S. Central Plains,
southeastern South America, tropical Africa, Pakistan, and Bangladesh. These datasets can be
visualized with a custom web application built at the NASA Langley Atmospheric Science Data
Center (ASDC) using ArcGIS: https://arcg.is/0C8eXC.

______________________________________________________________________________
NASA Earth Science • Applied Sciences Program: Disasters 2020 Annual Summary • 8
The project also analyzed several high-impact severe storm events during 2020: (1) a widespread
tornado outbreak on Easter Sunday in the Southeast U.S., (2) an extremely severe and damaging
hailstorm responsible for over $1 billion in damage in Calgary, Alberta on June 13, and (3) a
derecho wind and hail event responsible for at least $7.5 billion in damage across the Midwest
U.S. on August 10 (https://www.nasa.gov/feature/langley/nasa-researchers-help-analyze-a-
historically-powerful-costly-storm). Analyses included use of GOES-16 infrared and lightning
imagery, ground-based weather radars, passive microwave imagers, and damage maps compiled
using European Space Agency (ESA) Sentinel-1 synthetic aperture radar (SAR) and NASA
Moderate Resolution Imaging Spectroradiometer (MODIS), Visible Infrared Imaging
Radiometer Suite (VIIRS), and Landsat data.
Analyses of these events were shared with Environment and Climate Change Canada, the Iowa
and Illinois State Climatologists, and forecasters from several NOAA National Weather Service
offices. Experience with derecho event analysis has contributed significantly to automated SAR
and optical imager storm damage-mapping capabilities. Lessons learned and insights from these
events will be described in journal publications in 2021.

______________________________________________________________________________
NASA Earth Science • Applied Sciences Program: Disasters 2020 Annual Summary • 9
Figure 2. A global climatology of
                                                                       hailstorm detections per year, per
                                                                       2° grid box, using the TRMM and
                                                                       GPM Microwave Imagers from
                                                                       1998-2019. The detection counts
                                                                       are normalized to account for the
                                                                       varying number of observations as
                                                                       a function of latitude caused by
                                                                       TRMM and GPM inclined orbits.

Project Summary: Hailstorm Risk Assessment Using Spaceborne Remote Sensing Observations and
Reanalysis Data
Application Products       South African CatModel, South American CatModel, Global Passive
                           Microwave Hailstorm Detections, Web-based GIS Hailstorm
                           Visualization Portal
ARL Advancement            Current ARL 7, advancement to ARL 8 in early 2021. Goal ARL 9
Geographic Region          South Africa, South America, Continental U.S., and global hailstorm
                           climatologies
Partners                   Willis Towers Watson
                           Karlsruhe Institute of Technology
                           South African Weather Service
                           Centro de Previsão do Tempo e Estudos Climáticos (Brazil)
                           Servicio Meteorologico Nacional (Argentina)
                           Universidad de Buenos Aires
                           Universidad Nacional de Columbia
                           University of Oklahoma
                           Central Michigan University
Prospective Partners       United States Department of Agriculture (USDA) National Agricultural
                           Statistics Survey, Foreign Agriculture Service
2020 Journal Papers        4
2020 Media Features        7
2020 Scientific            11
Presentations

______________________________________________________________________________
NASA Earth Science • Applied Sciences Program: Disasters 2020 Annual Summary • 10
Advancing Access to Global Flood Modeling and Alerting using the
PDC DisasterAWARE® Platform and Remote Sensing Technologies
Primary Investigator: Margaret (Maggi) Glasscoe/NASA Jet Propulsion
Laboratory (JPL)
Co-Investigators: Bandana Kar/Oak Ridge National Laboratory, Doug
Bausch/Pacific Disaster Center, ZhiQiang Chen/University of Missouri Kansas
City, Ron Eguchi and Charlie Huyck/ImageCat, Marlon Pierce/Indiana
University, Kristy Tiampo/University of Colorado Boulder, Guy
Schumann/Remote Sensing Solutions
Flooding is a major hydro-meteorological event that impacts billions of people across the world
daily. Models and Earth observation data are used for forecasting flood severity, extent, and
depth, but these models and derived products are not globally operational, and they often provide
different outputs. Therefore, we seek to rapidly classify flood severity by incorporating flood
model outputs and remote-sensing-derived products from multiple platforms to help with flood
risk mitigation, increase the resilience of impacted communities, and disseminate alerts using
DisasterAWARE, analogous to the United States Geological Survey (USGS) Prompt Assessment
of Global Earthquakes for Response (PAGER) impact analysis for earthquakes.
DisasterAWARE is maintained by end-user partners the Pacific Disaster Center, a University of
Hawaii Applied Research Center, which provides multi-hazard warning and situational
awareness information through mobile apps and web-based platforms. Its operational version is
used by multiple national and international agencies including the United Nations (U.N.), but
DisasterAWARE currently lacks a global flood identification and alerting component and does
not integrate remote sensing components to enable near real-time validation of simulated flood
modeling results. The flood severity and impact products generated in this project will be
disseminated by DisasterAWARE, thereby enhancing its capability to be a multi-hazard alerting
platform. These innovative, global results will be advanced to ARL 9 using a combination of
modeling, machine learning, and Earth observations, including SAR and optical sensors.
Spring 2020 Africa Floods
The current implementation of Model of Models (MoM) combines model outputs from the
Global Flood Monitoring System (GFMS) and the Global Flood Awareness System (GloFAS)
with risk score at watershed level calculated using a novel risk function algorithm. The current
implementation of MoM is also deployed on a demonstration platform on DisasterAWARE that
provides access to flood severity scores at watershed level across the globe daily. Using this first
version of MoM, we forecasted flood severity for Africa in May 2020 and continue to do so.
While the flood severity forecast and subsequent alert aid with preparedness activities, the SAR
products derived for countries experiencing high severity will be used to assess impacts and for
response efforts. The SAR products will be used for validation as well as determination of flood
extent and depth at a finer scale. A future version of the MoM will also incorporate flood outputs
derived from optical and precipitation data to forecast flooding from tropical storm events.
______________________________________________________________________________
NASA Earth Science • Applied Sciences Program: Disasters 2020 Annual Summary • 11Project Summary: Advancing Access to Global Flood Modeling and Alerting using the PDC
DisasterAWARE Platform and Remote Sensing Technologies
Application Products Model of Models
EO-based Flood Extraction
EO-based Damage Detection
End-to-end pipeline to PDC DisasterAWARE
ARL Advancement 5
Geographic Region Global
Publications 4
Media Features 1
Conference Presentations 6
Partners Pacific Disaster Center
Kirschbaum A.37 -- Enabling Landslide Disaster
Risk Reduction and Response throughout the
disaster life cycle with a multi-scale toolbox
Huyck A.37 -- Open Critical Infrastructure
Exposure for Disaster Forecasting, Mitigation and
Response
FEMA (Federal Emergency Management Agency)
Remote Sensing Working Group
Prospective Partners Meyer A.37 -- Integrating SAR Data for Improved
Resilience and Response to Weather-Related
Disasters
Melgar A.37 -- Local Tsunami Early Warning with
GNSS Earthquake Source Products
CEOS Flood Pilot
NASA GEO GFRM projects
______________________________________________________________________________
NASA Earth Science • Applied Sciences Program: Disasters 2020 Annual Summary • 12Coupled Interactive Forecasting of Weather, Fire Behavior and
Smoke Impact for Improved Wildland Fire Decision-Making
Principal Investigator: Kyle Hilburn/Colorado State University
Co-Investigators: Adam Kochanski and Angel Farguell/San Jose State
University (SJSU), Jan Mandel/Colorado University
The United States has entered a new era of increasing wildfire frequency and
intensity, with five of the top six largest fires in California history occurring in
2020. Fire-prone landscapes have become more densely populated and developed, resulting in
steeply rising fire-suppression costs. But fire plays a crucial ecosystem role, and its prevention
can lead to excessive fuel accumulation and catastrophic fires. Therefore, making decisions and
taking actions based on the risks and benefits associated with wildfires and prescribed burns
requires decision-support tools that integrate remote sensing with a coupled modeling framework
for fire, weather, fuel, and smoke impacts.
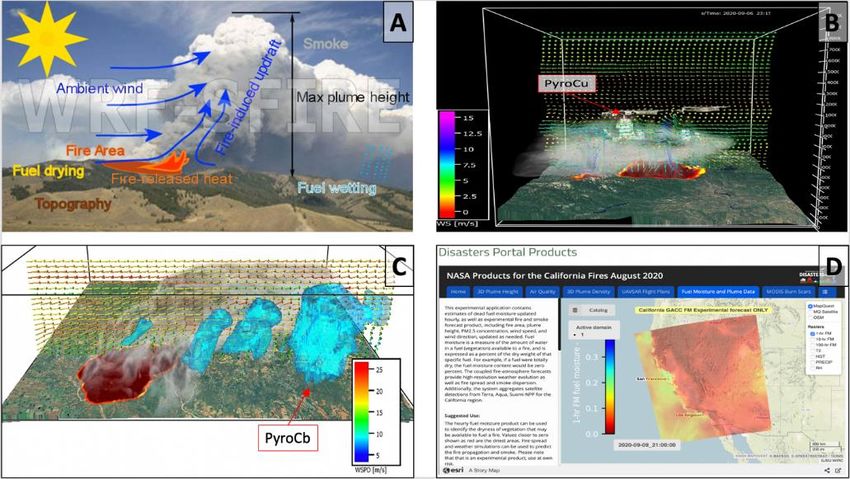
Figure 3. (A) Illustration of the physical coupling between fuel, fire, atmosphere, and smoke. (B) 3D visualization
of the Creek Fire (California 2020) showing two distinct updraft columns and pyro-convection clouds that
formed above the smoke (fire mesh has 33-m resolution). (C) 3D visualization of Mallard Fire (Texas 2018)
retrospective simulation showing the development of hail/graupel (light blue areas) associated with a
Pyrocumulonimbus (PyroCb). (D) Our team has embraced GIS technology for the visualization and
dissemination of WRF-SFIRE (Weather Research and Forecasting-Spread FIRE model) products. This image
shows fuel moisture maps being pushed to the NASA Disasters Portal in near real time.
______________________________________________________________________________
NASA Earth Science • Applied Sciences Program: Disasters 2020 Annual Summary • 13As U.S. Forest Service partner, Ned Nikolov, has stated, “WRF-SFIRE offers a new paradigm to assess and forecast the wildland fire environment, which integrates in a physically consistent manner all components of fire behavior, i.e., local weather dynamics and their two-way interactions with the released heat by fires, the 2-D fire spread, and fire smoke emissions and trajectories. There is no operational tool currently available to fire and air-quality managers at any land-management agency that can quantitatively account for these simultaneous interactions. This makes WRF-SFIRE uniquely valuable to the field.” WRF-SFIRE is an atmospheric model (Weather Research Forecast [WRF]) coupled with a fire spread model (SFIRE). What makes WRF-SFIRE unique among decision-support tools is that it is a fully coupled physical model capturing the interactions among the fuel, fire, atmosphere, and smoke components of the system. Figure 3A illustrates how heat release from the fire provides a heat flux that drives the atmosphere, which, in turn, drives the fire behavior through modulation of the wind. WRF-SFIRE explicitly models the plume, unlike other models such as High- Resolution Rapid Refresh-Smoke that parameterize the plume rise process. Pyro-convection is one of the most extreme forms of fire-atmosphere coupling, and the ability of WRF-SFIRE to simulate the pyro-convection observed with the Creek Fire (Figure 3B) and the Mallard Fire (Figure 3C) is a strong demonstration of its capabilities. This year our team advanced the ARL of our system from 4 to 5 by formalizing and documenting the workflow needed to initialize forecasts and the development of advanced satellite data assimilation techniques using machine learning/artificial intelligence. An important lesson from this year is the power of GIS technology for both visualization and dissemination of fire products. Figure 3D shows an example of GIS being used to push our WRF-SFIRE fuel moisture analysis products to the NASA Disasters Portal. Use of the Disasters Portal has enabled our forecasts to be accessible to more users, and our forecasts for the California fires have shown the utility of WRF-SFIRE for supporting air operations fire suppression activities. While satellites provide information on smoke’s geographic location, pilots need 3D vertical information about smoke, and currently only coupled modeling can provide that capability. These circumstances have led us to provide additional smoke and visibility variables needed by pilots, enabling better air resources usage by emergency managers. Our project has participated in six Disaster Application Response and Recovery Team (DARRT) activations. The Chernobyl fires activation is leading to improvements in WRF-SFIRE by showing the importance of extending the system for global coverage. The original system was built for the continental United States (CONUS) because that is where the most accurate and high-resolution fuel and fire ignition information is available. We have extended WRF-SFIRE to use land cover information for estimating fuel conditions to enable forecasting for locations such as Alaska, South America, and Australia, where fire information from the Joint Polar Satellite System (JPSS), GOES, or Himawari is available. We are also improving smoke initialization based on user feedback from DARRT activations. The project results are incorporated into the Fire in the Earth System class taught at SJSU, engaging first-generation students, promoting inclusive learning, and exposing racially and ethnically diversified classes to state-of-the-art fire modeling techniques. ______________________________________________________________________________ NASA Earth Science • Applied Sciences Program: Disasters 2020 Annual Summary • 14
Project Summary: Coupled Interactive Forecasting of Weather, Fire Behavior and Smoke Impact for
Improved Wildland Fire Decision-Making
Application Products            WRF-SFIRE Wildland Fire Information and Forecasting System.
                                WRF-SFIRE Smoke and Visibility
                                WRF-SFIRE Fire Spread and Behavior
                                WRF-SFIRE Fuel Moisture Analysis
ARL Advancement                 Current ARL 5, advanced one ARL level in 2020, Goal ARL 7
Geographic Region               CONUS, but extended system to provide global coverage
Partners                        United States Forest Service (USFS) Rocky Mountain Center (RMC)
                                for Fire-Weather Intelligence and USFS Wildland Fire-Management
                                Research, Development & Application (WFM RD&A), National
                                Predictive Services
Prospective Partners                 US Forest Service – Susan O'Neill, Richfield, Utah USFS (United
                                     States Forest Service) Office
                                     US Department of the Interior (DOI) Office of Wildland Fire –
                                     Kimber Roshelle Pederson
                                     NOAA National Weather Service – Mark Struthwolf and Darren
                                     Van Cleave
                                     Nick Nausler – National Predictive Services
                                     Louis Nguyen – NASA LaRC – NASA Earth Science Technology
                                     Office (ESTO) AIST NOS (Advanced Information System
                                     Technology New Observing Strategies) Program, Real-time data
                                     download and processing project
2020 Journal Papers             2
2020 Media Features             3
2020 Scientific                 4
Presentations

______________________________________________________________________________
NASA Earth Science • Applied Sciences Program: Disasters 2020 Annual Summary • 15
Open Critical Infrastructure Exposure for Disaster Forecasting,
Mitigation, and Response
Principal Investigator: Charles K. Huyck/ImageCat
Co-Investigators: Ron Eguchi/ImageCat, Shubharoop Ghosh/ImageCat, Roop
Dave/ImageCat, Mhairi O’Hara/Humanitarian Open Street Map, Tyler
Radford/OpenStreetMap, and Greg Yetman/Columbia Univ. – Center for
International Earth Science Information Network (CIESIN)
Damage to critical infrastructure from natural hazards and climate change can result in cascading
(indirect) economic impacts. These losses are often far greater than the (direct) cost to repair or
rebuild, but are poorly understood. Incorporation of economic modeling into risk analysis is
rarely achieved, given the complexity of disaggregating macro-based economic data to a spatial
resolution suitable for modeling. Therefore, we will use EO-based datasets to develop methods
of allocating production potential into a format suitable for incorporation into economic
modeling tools. This approach will yield two products: (1) the relative economic importance of
lifelines and regions of production Critical Infrastructure Interdependency Index (CIII), and (2) a
risk index based on assessing potential losses from a given peril Critical Infrastructure
Interdependency Risk Index (CIIRI).
Over the last year, the Open Critical Infrastructure Exposure for Disaster Forecasting, Mitigation
and Response project has migrated the analytical environment to the Google Earth Engine
platform, courtesy of a Google/GEO grant for the license. Now implemented, this migration has
significantly enhanced the scalability of the project. The project has isolated large industrial
production and energy generation areas associated with critical infrastructure, allocated
production from global economic models, assigned structural vulnerability, and run a full-scale
global sea-level rise and coastal flooding test using the pilot community of Vadodara, India.
This capability is achieved through the unique integration of economic and remote sensing data
sets. Although products remain in beta, they can be developed rapidly for any location on the
globe. In early 2021, results will be ported to an insurance platform (ARL 5) and used to explore
practical applications and pilot programs in the next round of discussions with key potential
users. The Global Facility for Disaster Risk Reduction (GFDRR) and WTW (Willis Towers
Watson) have been identified as key potential new collaborators. Based on discussions with
stakeholders, expected beneficiaries are anticipated to be global non-governmental organizations
(NGOs), insurers, and, surprisingly, international investment organizations, which are under new
pressure to address emerging climate risks and have limited understanding or tools to do so.
These are, ultimately, the entities that “own the risk.” Simon Young, Senior Director at WTW,
noted that “Global conglomerates are scrambling to understand their exposure to climate change
risk, and something like this properly served to end users could really be a substantial step in the
right direction. Right now, they have nothing.”
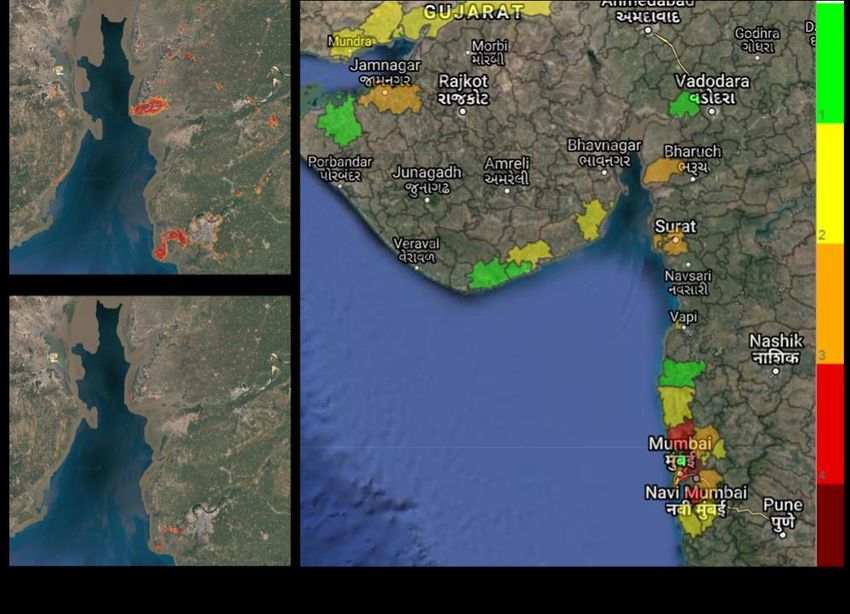
There has been significant progress on the pilot project for the city of Vadodara in Gujarat, India,
where the project team under the direction of Dr. Kristy Tiampo has continued the SAR-based
work for establishing flood extent and depth modeling using ESA’s Sentinel-1A/B satellite (C-
band SAR). The project team is investigating the potential for multi-look SAR data to assess
local flooding severity using a "red, yellow, green" alerting framework for floods. The project
team has coordinated with a local Vadodara University Professor, Dr. Sanskriti Mujumder of
Maharaja Sayajirao University (Vadodara), to provide validation for the SAR outputs and local
______________________________________________________________________________
NASA Earth Science • Applied Sciences Program: Disasters 2020 Annual Summary • 16context. The project team is planning a virtual workshop in early to mid-April 2021 to present the findings of the Vadodara pilot project to stakeholders, including the mayor and senior officers in key areas of water distribution, purification, sewage, sewer management, health, etc. This workshop will be an opportunity to present the research highlights, communicate the results to various stakeholders with the goal of developing capacity, and explore further opportunities beyond the project. Using Vadodara as a pilot test, our research team has been closely collaborating and coordinating with a NASA-funded research project, "Advancing Access to Global Flood Modeling and Alerting,” to establish the utility of extraction of flood boundaries and dissemination of flood alerts through the DisasterAWARE platform. This collaboration is part of the realignment plan to validate the flood severity and alerting outputs using Vadodara as the pilot study site. Figure 4: CIII captures the economic interdependency by isolating industrial and critical assets and allocating production capacity. CIIRI assesses the potential global economic impact from disruption of that capacity for a given peril, in this case, sea level rise and nuisance flooding in the year 2050. These raw results are then aggregated to the county level and used as an index to indicate the disruption capacity. These preliminary data demonstrate that for Northwestern India, Mumbai poses the greatest international economic risk from flooding due to coastal flooding and sea level rise. Following the 2020 severe wildfires in Oregon, ImageCat mapped burn areas using NASA VIIRS data along with building and critical infrastructure data. This effort caught the attention of Chris Vaughan, the Geospatial Information Officer at FEMA, who was interested in modeling results for the number of burned buildings (rather than simply acreage) so they could consider this information in the context of a disaster declaration. A review of the processes used in ______________________________________________________________________________ NASA Earth Science • Applied Sciences Program: Disasters 2020 Annual Summary • 17
national cost-benefit analysis (CBA) studies and personal communication with modelers from
the USDA (Mark Finney and Matthew Thompson) indicated that there was an opportunity for
significant advancement in this field, given the availability of increased accuracy of
temperature/intensity estimates, as well as the widespread availability of rural building density
and vegetation types. Teaming with personnel at the University of California-Irvine, whom we
have worked with in the wildfire area, we have collected and processed the data and are currently
assessing the feasibility of developing advanced damage functions, or “response functions,” as
they are known for fire. If feasible, teaming with others involved with the DARRT team may
provide opportunity to develop not only a loss-estimation tool for fire, but a tool that could be
tied to projections of burn area that are linked to weather forecasts–effectively providing a
wildfire damage forecasting system. Such a system would require sponsorship by a public or
private agency. The identification of this need and the success of this effort has come through the
DARRT team.
ImageCat has hired a Ph.D., Marina Mendoza. Dr. Mendoza is Argentinian by nationality and
identifies as Latina. Dr. Mendoza has been critical in incorporating economic modeling into the
loss modeling and EO process. The project team is also coordinating with Murtala M. Badamasi,
a native of Nigeria, to explore applications in the flood arena.

 Project Summary: Open Critical Infrastructure Exposure for Disaster Forecasting, Mitigation, and
 Response
 Application Products         Critical Infrastructure Interdependency Index (CIII) and
                              Critical Infrastructure Interdependency Risk Index (CIIRI)
 ARL Advancement              ARL 4, advancement to ARL 5 in early 2021
 Geographic Region            India, Southeast Asia
 Partners                     Humanitarian Open Street Map Team (HOT OSM)
                              Center for International Earth Science Information Network (CIESIN),
                              and City of Vadodara, Gujarat, India.
 Prospective Partners         Willis Towers Watson (WTW) and Global Facility for Disaster Risk
                              Reduction (GFDRR)
 2020 Journal Papers          3
 2020 Media Features          10
 2020 Scientific              12
 Presentations

______________________________________________________________________________
NASA Earth Science • Applied Sciences Program: Disasters 2020 Annual Summary • 18
Enabling Landslide Disaster Risk Reduction and Response Throughout
the Disaster Life Cycle with a Multi-scale Toolbox
Principal Investigator: Dalia B. Kirschbaum/NASA GSFC
Co-Investigators: Dimitrios Zekkos/University of Michigan, Marin Clark/
University of Michigan, Robert Emberson/ Universities Space Research
Association (USRA), Thomas Stanley/USRA, Jon Godt/USGS, Doug
Bausch/Pacific Disaster Center, Chris Chiesa/Pacific Disaster Center, Ricardo
D’Orsi/City of Rio de Janeiro, Felipe Mandarino/City of Rio de Janeiro
Landslides have pervasive impacts globally and effective modeling of the hazard and exposure
of these processes is critical for accurate and dynamic impact estimates to support decision-
making throughout the disaster lifecycle. But rarely do studies approach modeling processes
from different scales with the goal of using local-scale scenario-based assessment of cascading
landslide hazards to inform global-scale modeling. Therefore, we use Earth observation data
from multiple sensor types, platforms, and spatiotemporal scales to develop a suite of tools to
model susceptibility, hazard, and risk from landslide hazards to support key decision-making and
resilience-building.
In late 2020, two major hurricanes (Eta and Iota) made landfall in Central America within only a
few days of one another. Both hurricanes brought intense rainfall to parts of Nicaragua,
Guatemala, and Honduras and led to significant landsliding. Critical infrastructure and
populations throughout the region were exposed to landslide hazards. Decision-makers both at a
national level and within multinational agencies requested information about the likely location
of landslides and potential distribution of the hazard. NASA researchers provided several
experimental products based on
Earth observation (EO) data to
highlight the potential impacts of
these events, including near real-
time modeling of landslide hazard
for each day of both hurricane
events and associated estimates of
the exposure of people and
infrastructure (Figure 5). The
Landslide Hazard Assessment for
Situational Awareness (LHASA)
Version 2.0 and exposure model
built within this system were
developed as part of this project
Figure 5. Map of landslide hazard and exposure calculated from and have matured from research
the LHASA 2.0 model for November 5 for Guatemala. The map and development (ARL 2) to
shows district-level model results where shades of purple represent demonstrated prototype (ARL 5)
the hazard associated with landslides, with the darkest shades and the plan is to create a routine
having the highest risk. Shades of teal depict the size of the sub-daily product in early 2021.
population exposed to the risk. Areas where hazard and exposure
are both elevated may experience the most severe impacts.
This information draws upon
satellite rainfall data and landslide
______________________________________________________________________________
NASA Earth Science • Applied Sciences Program: Disasters 2020 Annual Summary • 19susceptibility information to highlight areas where hazards and exposure are elevated. In the immediate aftermath of the storms, the NASA team also mapped landslides that occurred due to both storms using high-resolution, rapid-return optical data from Planet (Figure 6). The Semi- Automatic Landslide Detection (SALaD) system has matured from ARL 3 to ARL 6 and is currently going through open-source review at NASA. The information was provided to a number of decision-makers in the affected areas to help inform critical decisions about landslide impact mitigation. It was also used to identify potential hazards in more remote locations of the countries. Figure 6. Left: pre-event image of San Pedro Saloma, Guatemala. Right: false-color post-event image of same location, with mapped landslides (green) using SALaD algorithm. Credits: Planet In another instance, widespread landsliding occurred in southwestern Puerto Rico related to the January 2020 Puerto Rico earthquake sequence. Landslides were concentrated nearest the epicenter, with sparse landsliding up to 40 km away from the epicenter. Most landslides can be attributed to the January 7, 2020, 6.7 magnitude mainshock, although foreshocks and significant aftershocks triggered some slope failures. Critical infrastructure and populated regions throughout the southwestern island were exposed to landslide hazards, especially near rock-fall areas and artificially altered slopes such as road cuts. NASA researchers worked closely with the USGS landslide hazard team that responded to the event and provided critical support to field teams through mapping landslide occurrence with EO data and providing preliminary co-seismic model predictions. Landslides were manually identified by NASA researchers using visual inspection of pre-/post-event high-resolution optical satellite imagery to a minimum landslide size of ~10 m2. This inventory was provided to a USGS field team, and subsequently revised based on field reports, with a collaborative final inventory of slope failures released as a USGS dataset in June 2020. A total of 309 landslide areas were mapped, along with additional point locations of 170 displaced boulders. Areas of elevated hazard and exposure are identified through landslide mapping from EO data and predictive modeling using earthquake shaking inputs. While events of this magnitude are modest, a high-quality inventory for moderate events is critical for model development and testing because most inventories have bias toward extreme events and can lead to overprediction ______________________________________________________________________________ NASA Earth Science • Applied Sciences Program: Disasters 2020 Annual Summary • 20
of hazard. In particular, this event provided critical site-specific information that, with
information from our partnership with USGS collaborators, will inform hazard scenario
predictions of a future fault rupture that threatens a vulnerable population. The mechanistic
modeling has matured from ARL 3 to ARL 5 and continues to mature with testing from new
event data collected during Disaster Application Response and Recovery Team (DARRT)
responses. The information provided through mapping and model outputs was provided to
stakeholders to inform decision-making with respect to the severity and location of landslide
hazard.

 Project Summary: Enabling Landslide Disaster Risk Reduction and Response Throughout the
 Disaster Life Cycle with a Multi-scale Toolbox
 Application Products               Landslide Hazard Assessment for Situational Awareness (LHASA)
                                    Semi-Automatic Landslide Detection (SALaD)
                                    Landslide Exposure Model (LEx)
                                    Co-seismic landslide model
 ARL Advancement                    Current ARL 6, advanced two ARLs in 2020.
                                    LHASA-Rio implementation is ARL 9
 Geographic Region                  Global and operational implementation in Rio de Janeiro (LHASA-
                                    Rio)
 Partners                           Pacific Disaster Center (PDC)
                                    USGS
                                    National Geospatial-Intelligence Agency (NGA) Rio de Janeiro
                                    Aga Khan Agency for Habitat (AKAH)
                                    Army Geospatial Center
                                    Global Facility for Disaster Risk Reduction (GFDRR)
 Prospective Partners               BGC Engineering
                                    Risk Management Solutions (RMS)
                                    Google Crisis Mapper
 2020 Journal Papers                5
 2020 Media Features                6
 2020 Scientific                    22
 Presentations

______________________________________________________________________________
NASA Earth Science • Applied Sciences Program: Disasters 2020 Annual Summary • 21
Day-Night Monitoring of Volcanic Sulfur Dioxide and Ash for Aviation
Avoidance at Northern Polar Latitudes
Primary Investigator: Nickolay Krotkov/NASA GSFC
Co-Investigators: Vince Realmuto/ NASA JPL, Kelvin Brentzel/NASA GSFC,
Can Li/University of Maryland, David Schneider/USGS, Martin
Stuefer/University of Alaska-Fairbanks, Ben Andrews/Smithsonian Institution
Dangers that volcanic ash clouds pose to inflight air traffic safety can lead to
prolonged flight cancellations that affect the airline industry, economy, and personal travel. Low-
latency satellite observations provide crucial information for rerouting air traffic around volcanic
clouds. But ultraviolet (UV)-based ash and sulfur dioxide (SO2) monitoring are unavailable at
night or under low-light conditions. Therefore, NASA Disasters supports Earth observation
applications for advanced monitoring capabilities that better serve the private sector (aviation
control services and operational users) and the public for the ever-increasing number of flights
that operate at night or fly over the Arctic polar region. The team is now developing direct-
readout (DR) volcanic ash and SO2 products based on thermal infrared (IR) data acquired by
several operational satellite-borne instruments.
PI Nickolay Krotkov, and Co-Is Can Li, Vincent Realmuto, and Kelvin Brentzel released the
enhanced UV-based and IR-based Science Processing Algorithms (SPAs) to our partners at
Geographic Information Network of Alaska (GINA) and the Finnish Meteorological Institute
(FMI) for evaluation (ARL 6). The UV-based SPA retrieves quantitative SO2 column density and
UV Ash Index Direct Readout products from the Ozone Mapping and Profiling Suite (OMPS)
aboard the NASA-NOAA Suomi National Polar Partnership (Suomi-NPP) satellite.
At the end of 2020, Co-I Martin Stuefer at GINA installed the latest version of NASA’s Direct
Readout Laboratory (DRL) International Planetary Observation Processing Package to process
VIIRS SO2 SPA v1.2-derived data. IR-based SPA outputs the VIIRS Volcanic Brightness
Temperature Difference (BTD) Data Product (VIIRS-SO2 v1.2) and the GeoTIFF image
products (ARL 6). Enhancements included incorporating atmospheric temperature profiles and
digital elevation models (DEM) to screen for meteorological (met) clouds and reduce false
detections of volcanic clouds. The updated OMPS and VIIRS SO 2 SPAs significantly improved
the quality of SO2 retrievals in a direct broadcast environment. However, false detections due to
surface emissivity and water vapor (H2O) absorption remained in the VIIRS-SO2 products
(Figure 7a). We have prototyped a new algorithm with corrections for surface emissivity and
H2O vapor for V.1.3 of the SPA (Figure 7b). The SPA supports both the Suomi-NPP and Joint
Polar Satellite System-1 (JPSS-1/NOAA-20) missions.
______________________________________________________________________________
NASA Earth Science • Applied Sciences Program: Disasters 2020 Annual Summary • 22Figure 7. The effects of surface emissivity and water vapor (H 2O) absorption on Brightness Temperature
Difference (BTD) values are illustrated by VIIRS-NOAA-20 observations of Mount Etna, Sicily (yellow circle),
acquired on 27 December 2018. (a) At the spectral resolution of VIIRS, the emissivity of quartz sand and H 2O
absorption appear similar to SO2 absorption, resulting in large BTD values over the deserts of North Africa
and enhanced BTD at the margins of a satellite scene. (b) We reduce the BTD values over North Africa by
applying an explicit correction for surface emissivity, and attenuating BTD due to H 2O absorption with a
gradient, or ramp, function applied to view zenith angles larger than 50o.
Partners at FMI’s DR satellite center in Sodankylä, Finland process OMPS Suomi-NPP data,
merge it with GINA DR products, and distribute SO2 and ash index maps for the Arctic on a
website that was redesigned in 2020 (https://sampo.fmi.fi/products) and provided to users of
EUMETSAT’s dissemination forum, EUMETCast (ARL 8). The USGS Co-I, David Schneider,
incorporates these new DR volcanic ash and SO2 products into the publicly available VolcView
image browser environment, evaluates their utility during eruption responses for the team at
USGS Alaska Volcano Observatory (AVO), and provides feedback to the team. He will provide
training to AVO satellite duty scientists on these new products (ARL 7, 8). Additionally, the
USGS Co-I will provide guidance (e.g., informal case studies, consultation about algorithm
strengths and limitations) to the Anchorage Volcanic Ash Advisory Center (VAAC) and to the
Science Officer from the National Weather Service (NWS) Alaska Aviation Weather Unit
(which houses the VAAC) as they develop training materials for forecasters (ARL 8, 9).
The application was improved as a result of participating in DARRT responses to volcanic
eruptions and responding to user questions and requests. The team responses included the
January 2020, Taal (Indonesia) eruption; April 2020 Anak- Krakatau eruption; June-August
2020, Nishinoshima (Japan) eruptions; November–December. 2020, Lewotolo (Indonesia)
eruption and the December 2020, Kilauea eruption. Lessons learned include:
• Analysis of the three-month Nishinoshima (Japan) eruption, which mostly dispersed over
the Pacific Ocean, forced development of a Sun-glint mask to address false-positive ash
signals over open water. In summer 2020, we started posting new automatic SO2 maps
for the “Tropical Western Pacific” region
(https://so2.gsfc.nasa.gov/pix/daily/0720/wpac_0720p.html).
• An unexpected OMPS DR processing failure on December 1 tested team resilience
during the Lewotolo volcanic eruption response. The OMPS team led by collaborator
Colin Seftor quickly identified the problem and fixed the expired file in OMPSnadir SPA.
The DRL team led by co-I Kelvin Brentzel quickly released a software patch to partners
to capture critical data and produced GeoTIFF files ingested into the disasters web portal
to create an SO2 plume dispersion movie
______________________________________________________________________________
NASA Earth Science • Applied Sciences Program: Disasters 2020 Annual Summary • 23(https://maps.disasters.nasa.gov/arcgis/apps/TimeAware/index.html?appid=ee9793ee83a
b41788b6405bc47d8b4f2). As a result of this lesson, we are developing the capability to
independently process NOAA-20/OMPS volcanic SO2 as a mitigation strategy. Not only
does NOAA-20 OMPS provide higher spatial resolution, processing two OMPS
“snapshots” 50 minutes apart allows “animation” of volcanic plume movements to help
enable plume dispersion forecasting. Processing two independent OMPS instruments will
strengthen resilience in responding to future eruptions.
Dr. David Schneider of the Alaska Volcano Observatory recently noted, “The operational impact
of near real-time information on the extent and amount of SO2 gas was demonstrated during the
2019 eruption of Raikoke volcano in the Kuril Islands.” This eruption injected large amounts of
volcanic ash and gas into the atmosphere and impacted aircraft operations in the North Pacific.
The lingering SO2 gas was observed in UV and IR satellite data, and the associated sulfate
aerosol cloud was visible to pilots, who reported it as volcanic ash. The NWS Anchorage VAAC
team consulted with satellite experts at the USGS Alaska Volcano Observatory regarding these
observations and was able to greatly reduce the region covered by the Volcanic Significant
Meteorological Information (SIGMET) warning message for ash. This effort demonstrated the
economic impact of improved detection of volcanic cloud constituents.”
Project Summary: Day-Night Monitoring of Volcanic Sulfur Dioxide and Ash for Aviation Avoidance at
Northern Polar Latitudes
Application Products Arctic Volcanic Plume Tracker (AVPT)
2 Applications (OMPSnadir v2.6.7, VIIRS-SO2 v1.2)
ARL Advancement Current ARL 6, advanced one ARL level in 2020.
Geographic Region Alaska, Aleutians, North Pacific, Kamchatka, Kuril Islands, Iceland,
and Scandinavia but globally extensible
Partners USGS AVO, NOAA’s NWS Alaska Volcanic Ash Advisory Center (A-
VAAC), European Support to Aviation Control Service, NASA Direct
Readout user community, Smithsonian Institution Global Volcanology
Program, Finnish Meteorological Institute
Prospective Partners Franz Mayer University of Alaska Fairbanks (UAF), Kyle Hilburn
Colorado State University (CSU), Jean-Paul Vernier LaRC, Simon
Carn Michigan Technological University (MTU)
2020 Journal Papers 5
2020 Media Features 3
2020 Scientific 7
Presentations
______________________________________________________________________________
NASA Earth Science • Applied Sciences Program: Disasters 2020 Annual Summary • 24You can also read