Differences in tropical high clouds among reanalyses: origins and radiative impacts - ACP
←
→
Page content transcription
If your browser does not render page correctly, please read the page content below
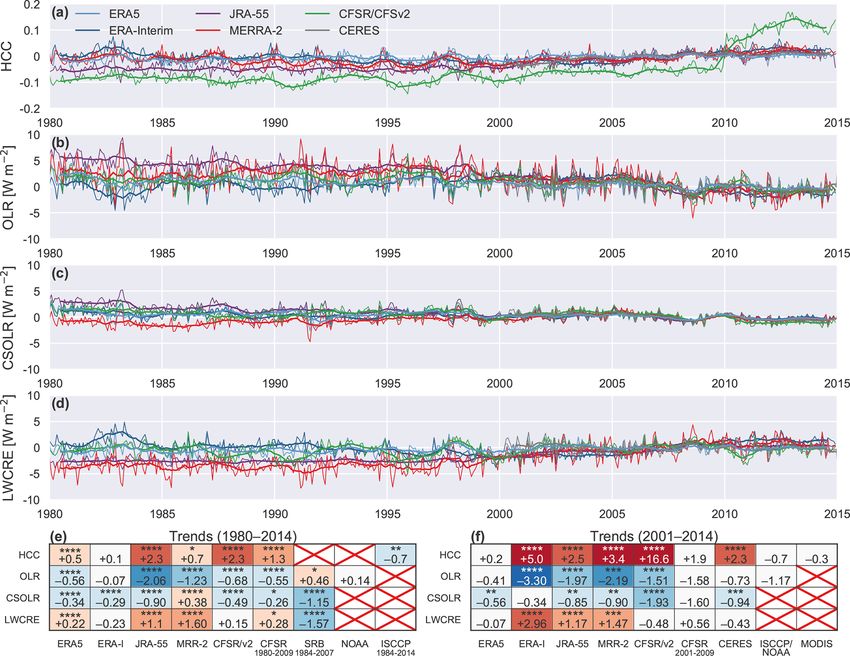
Atmos. Chem. Phys., 20, 8989–9030, 2020
https://doi.org/10.5194/acp-20-8989-2020
© Author(s) 2020. This work is distributed under
the Creative Commons Attribution 4.0 License.

Differences in tropical high clouds among reanalyses:
origins and radiative impacts
Jonathon S. Wright1 , Xiaoyi Sun1 , Paul Konopka2 , Kirstin Krüger3 , Bernard Legras4 , Andrea M. Molod5 ,
Susann Tegtmeier6 , Guang J. Zhang7 , and Xi Zhao8
1 Ministry  of Education Key Laboratory for Earth System Modeling, Department of Earth System Science,
Tsinghua University, Beijing, China
2 Forschungszentrum Jülich (IEK-7: Stratosphere), Jülich, Germany
3 Department of Geosciences, University of Oslo, Oslo, Norway
4 Laboratoire de Météorologie Dynamique, UMR CNRS 8539, IPSL, PSL-ENS/Sorbonne Université/École

Polytechnique, Paris, France
5 Global Modeling and Assimilation Office, NASA Goddard Space Flight Center, Greenbelt, Maryland, USA
6 Institute of Space and Atmospheric Studies, University of Saskatchewan, Saskatoon, Canada
7 Scripps Institution of Oceanography, La Jolla, California, USA
8 Department of Atmospheric Sciences, Texas A & M University, College Station, Texas, USA

Correspondence: Jonathon S. Wright (jswright@tsinghua.edu.cn)

Received: 21 December 2019 – Discussion started: 21 January 2020
Revised: 11 June 2020 – Accepted: 20 June 2020 – Published: 29 July 2020

Abstract. We examine differences among reanalysis high-           of the atmosphere that are very consistent with those ob-
cloud products in the tropics, assess the impacts of these dif-   served. The other reanalyses all exhibit substantial biases in
ferences on radiation budgets at the top of the atmosphere        at least one of these metrics, although compensation between
and within the tropical upper troposphere and lower strato-       the long-wave and short-wave effects helps to constrain bi-
sphere (UTLS), and discuss their possible origins in the con-     ases in the total cloud radiative effect for most reanalyses.
text of the reanalysis models. We focus on the ERA5 (fifth-       The vertical distribution of cloud water content emerges as
generation European Centre for Medium-range Weather               a key difference between ERA-Interim and other reanalyses.
Forecasts – ECMWF – reanalysis), ERA-Interim (ECMWF               Whereas ERA-Interim shows a monotonic decrease of cloud
Interim Reanalysis), JRA-55 (Japanese 55-year Reanaly-            water content with increasing height, the other reanalyses all
sis), MERRA-2 (Modern-Era Retrospective Analysis for Re-          produce distinct anvil layers. The latter is in better agreement
search and Applications, Version 2), and CFSR/CFSv2 (Cli-         with observations and yields very different profiles of radia-
mate Forecast System Reanalysis/Climate Forecast System           tive heating in the UTLS. For example, whereas the altitude
Version 2) reanalyses. As a general rule, JRA-55 produces         of the level of zero net radiative heating tends to be lower in
the smallest tropical high-cloud fractions and cloud wa-          convective regions than in the rest of the tropics in ERA-
ter contents among the reanalyses, while MERRA-2 pro-             Interim, the opposite is true for the other four reanalyses.
duces the largest. Accordingly, long-wave cloud radiative ef-     Differences in cloud water content also help to explain sys-
fects are relatively weak in JRA-55 and relatively strong in      tematic differences in radiative heating in the tropical lower
MERRA-2. Only MERRA-2 and ERA5 among the reanaly-                 stratosphere among the reanalyses. We discuss several ways
ses produce tropical-mean values of outgoing long-wave ra-        in which aspects of the cloud and convection schemes im-
diation (OLR) close to those observed, but ERA5 tends to un-      pact the tropical environment. Discrepancies in the vertical
derestimate cloud effects, while MERRA-2 tends to overes-         profiles of temperature and specific humidity in convective
timate variability. ERA5 also produces distributions of long-     regions are particularly noteworthy, as these variables are di-
wave, short-wave, and total cloud radiative effects at the top    rectly constrained by data assimilation, are widely used, and

Published by Copernicus Publications on behalf of the European Geosciences Union.
8990                                                                     J. S. Wright et al.: Tropical high clouds in reanalyses

feed back to convective behaviour through their relationships        inform both interpretation of model outputs and future efforts
with thermodynamic stability.                                        toward model development. Differences in cloud fields may
                                                                     likewise indicate pervasive biases in the model background
                                                                     state that influence more widely used reanalysis products,
                                                                     such as temperatures and winds. Data assimilation helps to
1   Introduction                                                     mitigate these effects in variables that are analysed, but the
                                                                     extent of this mitigation depends on the availability and qual-
Tropical high clouds play a central role in climate via their in-    ity of assimilated observations (with consequent variations in
fluences on the radiation budget, altering both the reflection       time and space), as well as the assimilation method used to
of incoming solar radiation and the atmospheric absorption           combine observations with the model background state. No
of long-wave radiation emitted by Earth’s surface (Trenberth         such mitigation can be expected for forecast-only variables
et al., 2009; Dessler, 2010). The net effect of an individual        that are not analysed, such as the radiative heating rates often
cloud on the radiation budget depends on several factors, in-        used to drive transport simulations in the upper troposphere
cluding the type, phase, height, and microphysical charac-           and stratosphere (Wright and Fueglistaler, 2013; Tao et al.,
teristics of the cloud (Stevens and Schwartz, 2012). These           2019). Data assimilation may even exacerbate disagreements
features are difficult to parameterize so that the integrated ra-    among these variables if the analysis pulls the model away
diative impacts of clouds remain poorly represented in global        from its internal equilibrium state.
models (Bony et al., 2015), including those used to produce             Cloud fields in reanalyses are essentially model products,
atmospheric reanalyses (Dolinar et al., 2016; Li et al., 2017).      but many variables that influence the distribution of clouds
   Clouds, circulation, and sea surface temperature (SST)            in the tropics are altered during the data assimilation step
are strongly coupled in the tropics (e.g. Hartmann and               (e.g. atmospheric temperatures, moisture, and winds). We
Michelsen, 1993; Emanuel et al., 1994; Fu et al., 1996; Su           therefore anticipate that differences in cloud fields among re-
et al., 2011). These coupled interactions transport energy           analyses may arise from several factors, including the pre-
away from convective regions, which tend to be anchored              scribed boundary conditions (such as SST), the physical pa-
over the warmest SSTs, into subsidence-dominated regions             rameterizations used in the atmospheric models (especially
where SSTs are usually cooler. Associated tracer transports          those pertaining to convection and large-scale condensa-
have extensive influences on humidity, ozone, and other con-         tion), the approach to data assimilation, and the data assimi-
stituents in the upper troposphere (Folkins et al., 2002; Jiang      lated (particularly satellite data from infrared and all-sky mi-
et al., 2007; Fiehn et al., 2017; Pan et al., 2017), while           crowave humidity sounders). Traditional 3-dimensional vari-
momentum transport, latent heat release, and radiative ef-           ational (3D-Var) or “first guess at appropriate time” (3D-
fects modulate circulation patterns in both the troposphere          FGAT) assimilation techniques provide only indirect con-
and stratosphere (LeMone et al., 1984; Carr and Bretherton,          straints on cloud fields via the use of previously anal-
2001; Lane and Moncrieff, 2008; Geller et al., 2016; Kim             ysed states to initialize subsequent forecasts. Constraints on
et al., 2017). Changes in precipitation are governed to lead-        cloud fields might be tightened by several approaches used
ing order by the balance of changes in radiative cooling and         in recent reanalyses, such as the incremental analysis up-
condensational heating in the atmosphere (O’Gorman et al.,           date (IAU) and incremental 4-dimensional variational (4D-
2011), both of which are intimately connected with the distri-       Var) methods. Under IAU, assimilation increments in anal-
bution and properties of high clouds. The radiative and con-         ysed fields are applied gradually during a “corrector” fore-
densational heating effects of clouds have also been shown to        cast after they are calculated (Bloom, 1996; Takacs et al.,
influence atmospheric water budgets associated with a wide           2018). Under incremental 4D-Var, the assimilation scheme
range of climatological phenomena, including the El Niño–            iteratively adjusts the entire forecast to optimize the fit be-
Southern Oscillation (e.g. Posselt et al., 2011), the Madden–        tween the full temporal evolution of the model state and the
Julian oscillation (e.g. Anber et al., 2016; Cao and Zhang,          available observations (Courtier et al., 1994). Both of these
2017), and the South Asian summer monsoon (e.g. Wang                 approaches produce cloud fields that are more consistent with
et al., 2015).                                                       analysed temperatures, humidities, and winds, although this
   Given the influential role of high clouds in the tropical cli-    internal consistency is still governed by parameterized rep-
mate system and the complexity of their interactions with            resentations of subgrid physics. Methods that directly make
other variables, evaluation and intercomparison of reanaly-          use of cloud and precipitation information in data assimila-
sis cloud products serves several purposes. First, reanalyses        tion, such as latent heat nudging or particle filters (e.g. Ban-
offer global coverage at relatively high resolution and regular      nister et al., 2020), have yet to be implemented in global at-
intervals. It is therefore useful to assess the level to which re-   mospheric reanalyses.
analysis cloud and radiation products may be considered “re-            The purpose of this paper is to examine and evaluate
alistic”. Second, systematic differences in cloud fields can be      upper-tropospheric cloud fields in the tropics (30◦ S–30◦ N)
used to diagnose problems or points of concern in the atmo-          as represented in recent atmospheric reanalyses, to identify
spheric model. Detailed evaluation of these biases can thus          differences among these reanalyses, and to explore the poten-

Atmos. Chem. Phys., 20, 8989–9030, 2020                                                https://doi.org/10.5194/acp-20-8989-2020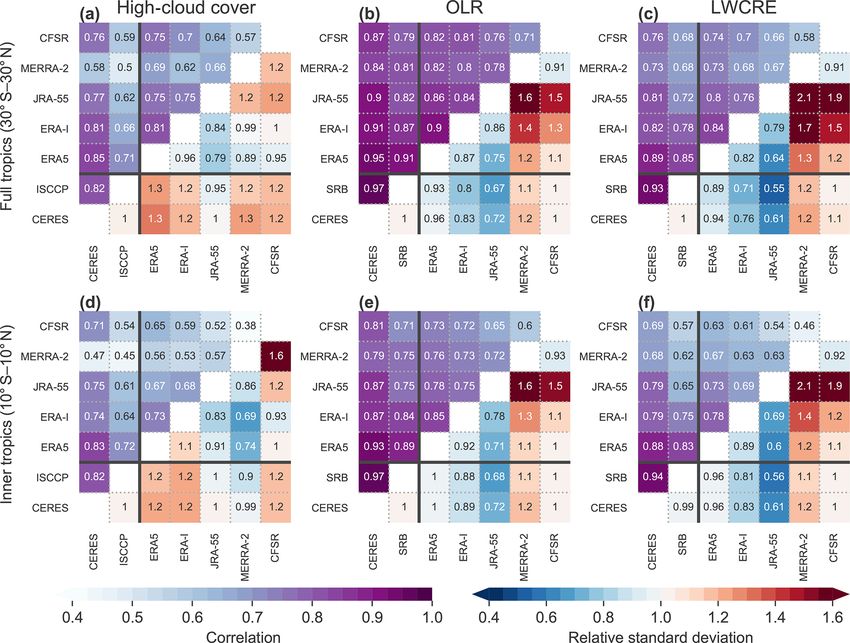
J. S. Wright et al.: Tropical high clouds in reanalyses 8991
tial reasons behind these differences. We consider the frac- data (Fujiwara et al., 2017); however, they differ from each
tional coverage of high clouds, total condensed water content other with respect to their atmospheric models, assimilation
in the tropical upper troposphere, and the radiative effects of techniques, and assimilated data sets. Summary information
clouds, both at the nominal top of the atmosphere (TOA) and on the forecast models and variables used are provided in
within the upper troposphere and lower stratosphere (UTLS). Table 1. We document additional details of the cloud, con-
Our approach differs from and builds on other recent efforts vection, and radiation schemes in Appendix A. Readers in-
in this direction (e.g. Dolinar et al., 2016) through an exclu- terested in these technical details may wish to consult this
sive focus on tropical high clouds (p < 500 hPa), a deeper appendix before proceeding to the results. With the excep-
exploration of co-variability at daily timescales in addition tion of ERA5, other relevant aspects have recently been re-
to monthly means, a discussion of cloud–radiation interac- viewed by Fujiwara et al. (2017). An expanded review (in-
tions in the tropical UTLS in addition to TOA fluxes, and cluding ERA5) is provided in Chapter 2 of the forthcoming
the inclusion of some recently released reanalyses. We also SPARC (Stratosphere–troposphere Processes And their Role
endeavour to systematically document key differences in pa- in Climate) Reanalysis Intercomparison Project (S-RIP) re-
rameterizations of clouds and radiation among the reanaly- port (Wright et al., 2020; digital version available at https:
ses and discuss some of the ways these differences impact //jonathonwright.github.io/S-RIPChapter2E.pdf, last access:
the state of the tropical atmosphere as represented in recent 15 July 2020). Further details on assimilated observations
reanalyses. and model treatments have been provided by Long et al.
We briefly introduce the reanalysis products, observation- (2017) for temperature, Davis et al. (2017) for water vapour,
ally based data sets, and methodology in Sect. 2. More de- and Tegtmeier et al. (2020) for the structure of the tropical
tailed descriptions of the cloud and radiation parameteriza- tropopause layer (TTL), among others.
tions used in these reanalyses are collected in Appendix A. The full intercomparison period covers January 1980
In Sect. 3, we summarize the climatological distributions through December 2014 and includes all five reanalyses. We
of high-cloud fraction, total condensed water content, and also conduct a more detailed intercomparison of daily co-
outgoing long-wave radiation produced by reanalyses in the variations among selected variables from January 2001 to
tropics. In Sect. 4, we examine how differences in the dis- December 2010. Results for the full intercomparison are pre-
tribution and properties of high clouds alter radiative fluxes sented in Sects. 3, 4, and 6, while results based on daily
and exchange at daily scales in the deep tropics, both at the co-variability are presented in Sects. 4 and 5. Our intercom-
TOA and within the tropical UTLS. In Sect. 5, we explore parison period includes the CFSR–CFSv2 transition in Jan-
the potential origins of differences in high clouds in the con- uary 2011 and the intermediate year 2010 (as discussed by
text of different reanalysis model treatments of deep convec- Fujiwara et al., 2017, among others). We show in Sect. 6
tion and in situ cloud formation near the tropical tropopause. that both transitions involved changes in the cloud fields that
In Sect. 6, we briefly assess temporal variability and agree- were much larger than the discontinuities at other produc-
ment amongst the reanalyses. We close the paper in Sect. 7 tion stream transitions. The January 2011 transition to CFSv2
by summarizing the results and providing recommendations also involved changes in the atmospheric-model formulation
and context for reanalysis data users. governing interactions between clouds and radiation. A brief
summary of differences in tropical cloud and radiation fields
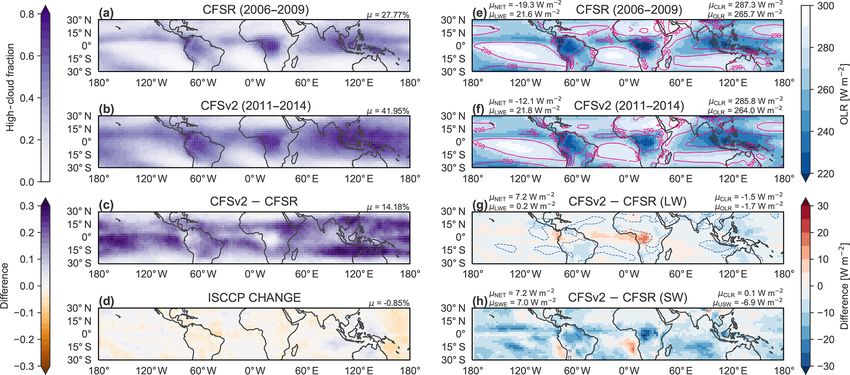
between CFSR and CFSv2 is provided in Appendix B.
2 Data and methodology
2.2 Observational data
2.1 Reanalysis products
We use several observationally based data products to sup-
Our intercomparison focuses mainly on five relatively recent ply context, including TOA radiative fluxes, cloud fraction,
atmospheric reanalyses: the fifth-generation European Cen- cloud ice water content, and atmospheric thermodynamic
tre for Medium-range Weather Forecasts (ECMWF) reanal- state variables (Table 2). Observations of these variables are
ysis (ERA5; Hersbach et al., 2020); the ECMWF Interim subject to a number of uncertainties, including lack of sen-
Reanalysis (ERA-Interim; Dee et al., 2011); the Japanese sitivity to optically thin clouds or clouds composed of small
55-year Reanalysis (JRA-55; Kobayashi et al., 2015); the particles (e.g. Dessler and Yang, 2003), uncertainties caused
Modern-Era Retrospective Analysis for Research and Ap- by overlapping cloud layers (e.g. Zhang et al., 2005), errors
plications, Version 2 (MERRA-2; Gelaro et al., 2017); and in cloud top height (e.g. Sherwood et al., 2004), and diurnal
the Climate Forecast System Reanalysis (CFSR; Saha et al., or spatial sampling biases (e.g. Fowler et al., 2000; Hearty
2010) and its extension via the Climate Forecast System Ver- et al., 2014). As our primary focus is on the intercompar-
sion 2 (CFSv2; Saha et al., 2014). The earlier MERRA re- ison of reanalysis products, we have not applied a satellite
analysis (Rienecker et al., 2011) is included in selected com- cloud observation simulator (e.g. Bodas-Salcedo et al., 2015;
parisons. All six of these products are “full-input” reanal- Stengel et al., 2018) to the reanalysis outputs. Use of a satel-
yses in that they assimilate both conventional and satellite lite simulator could address sensitivity and sampling biases
https://doi.org/10.5194/acp-20-8989-2020 Atmos. Chem. Phys., 20, 8989–9030, 2020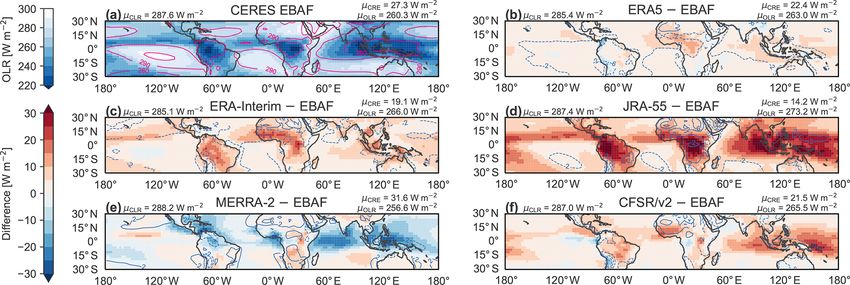
8992                                                                                        J. S. Wright et al.: Tropical high clouds in reanalyses

Table 1. Summary of reanalysis products. HCC stands for high-cloud fraction; CC stands for cloud fraction; CWC stands for cloud water
content; I/LWC stands for separate ice and liquid water contents; TOA stands for top-of-atmosphere fluxes (short-wave and long-wave
and clear-sky and all-sky); and RHR stands for radiative heating rates (short-wave and long-wave and all-sky). We use CFSR products
for 1980–2010, CFSv2 for 2011–2014, and all other reanalysis products for 1980–2014. IFS: Integrated Forecast System. JMA GSM: Japan
Meteorological Administration Global Spectral Model. NCEP CFS: National Centers for Environmental Prediction Climate Forecast System.

   Reanalysis          Model               Model grid              HCC∗               Profiles∗                   Fluxes∗            Reference
   ERA5                IFS 41R2            N320 (∼ 31 km)          σ < 0.45           T , q, z, CC, I/LWC         TOA, RHR           Hersbach et al. (2020)
                       (2016)              137 levels              1-hourly           3-hourly                    12 h forecasts
   ERA-Interim         IFS 31R2            N128 (∼ 79 km)          σ < 0.45           T , q, z, CC, I/LWC         TOA, RHR           Dee et al. (2011)
                       (2007)              60 levels               6-hourly           6-hourly                    12 h forecasts
   JRA-55              JMA GSM             N160 (∼ 55 km)          p < 500 hPa        T , q, z, CC, I/LWC         TOA, RHR           Kobayashi et al. (2015)
                       (2009)              60 levels               3-hourly           6-hourly                    6 h forecasts
   MERRA-2             GEOS 5.12.4         C180 (∼ 50 km)          p < 400 hPa        T , q, z, CC, I/LWC         TOA, RHR           Gelaro et al. (2017)
                       (2015)              72 levels               1-hourly           3-hourly                    3 h forecasts
   CFSR                NCEP CFS            F288 (0.3125◦ )         p < 400 hPa        T , q, z, CWC               TOA, RHR           Saha et al. (2010)
                       (2007)              64 levels               6-hourly           6-hourly                    6 h forecasts
   CFSv2               NCEP CFS            F440 (0.2045◦ )         p < 400 hPa        CWC                         TOA                Saha et al. (2014)
                       (2011)              64 levels               Monthly            Monthly                     Monthly
  ∗ Climatological means of HCC, CC, CWC (or I/LWC), and TOA fluxes from all reanalyses are calculated from monthly-mean products.

for easier comparison with observations; however, it could                            with model outputs (Loeb et al., 2020). Second, we use daily-
also obscure inter-reanalysis differences in cloud types that                         mean Synoptic Radiative Fluxes and Clouds (SYN1Deg)
are not well observed and complicate analysis of cloud ra-                            products at 1◦ × 1◦ spatial resolution (Doelling, 2017). The
diative effects in each reanalysis. Accordingly, comparisons                          SYN1Deg data set represents an intermediate step in the
between reanalysis products and satellite cloud observations                          production of the monthly EBAF data set. SYN1Deg pro-
in this paper should be interpreted with care.                                        vides several estimates of TOA radiative fluxes, including
   The International Satellite Cloud Climatology Project (IS-                         direct measurements, outputs from initial “untuned” radia-
CCP) has produced observationally based descriptions of                               tive transfer model simulations, and outputs from a second
clouds and their attributes using geostationary and polar-                            set of radiative transfer simulations in which the model in-
orbiting satellite measurements (Rossow and Schiffer, 1991).                          put variables are adjusted to bring the simulated fluxes into
We use the H-series Global Monthly (HGM) product for                                  better agreement with the observed fluxes. The initial atmo-
January 1984–December 2014 (Rossow and Schiffer, 1999;                                spheric state for radiative computations is taken from the
Rossow et al., 2017). As a supplement to the ISCCP cloud                              GEOS-5 data assimilation system, a different version of that
data, we use all-sky and clear-sky fluxes of long-wave (LW)                           used for MERRA-2. Only the final adjusted fluxes are dis-
radiation at the TOA from the NASA Global Energy and                                  cussed, as these products are most appropriate for comput-
Water Cycle Experiment (GEWEX) Surface Radiation Bud-                                 ing cloud radiative effects for comparison with reanalysis
get (SRB) project covering January 1984 through Decem-                                estimates. The results are qualitatively similar when the di-
ber 2007 (Stackhouse et al., 2011; Zhang et al., 2015). These                         rect measurements are used instead. Along with TOA ra-
data are based on radiative calculations that combine ob-                             diative fluxes, the SYN1Deg data set includes estimates of
served fluxes and ozone with Goddard Earth Observing Sys-                             cloud fraction retrieved using measurements collected by the
tem Data Assimilation System, Version 4 (GEOS-4) analy-                               Moderate-Resolution Imaging Spectroradiometer (MODIS)
ses of temperature and water vapour. Pixel-level data from                            and geostationary satellites (Minnis et al., 2011; Doelling
ISCCP are used to estimate cloud radiative effects in SRB.                            et al., 2013). We also use high-cloud fraction (HCC) data
   We use several products from the Clouds and the Earth’s                            from Collection 6 of the Terra MODIS Level 3 Atmosphere
Radiant Energy System (CERES) experiment (Wielicki                                    Product (MOD08; Platnick, 2015).
et al., 1996). First, we use time-mean TOA fluxes calcu-                                 For observations of the thermodynamic state of the atmo-
lated from Energy Balanced and Filled (EBAF) monthly-                                 sphere, we use level 3 data from the Atmospheric Infrared
mean products at 1◦ × 1◦ spatial resolution (Doelling, 2019).                         Sounder (AIRS) version 6 “TqJoint” collection (AIRS Sci-
We use CERES EBAF Edition 4.1, which provides clear-                                  ence Team and Teixeira, 2013). This data set provides grid-
sky TOA fluxes that are specifically intended for comparison                          ded representations of temperature, moisture, and other fields

Atmos. Chem. Phys., 20, 8989–9030, 2020                                                                      https://doi.org/10.5194/acp-20-8989-2020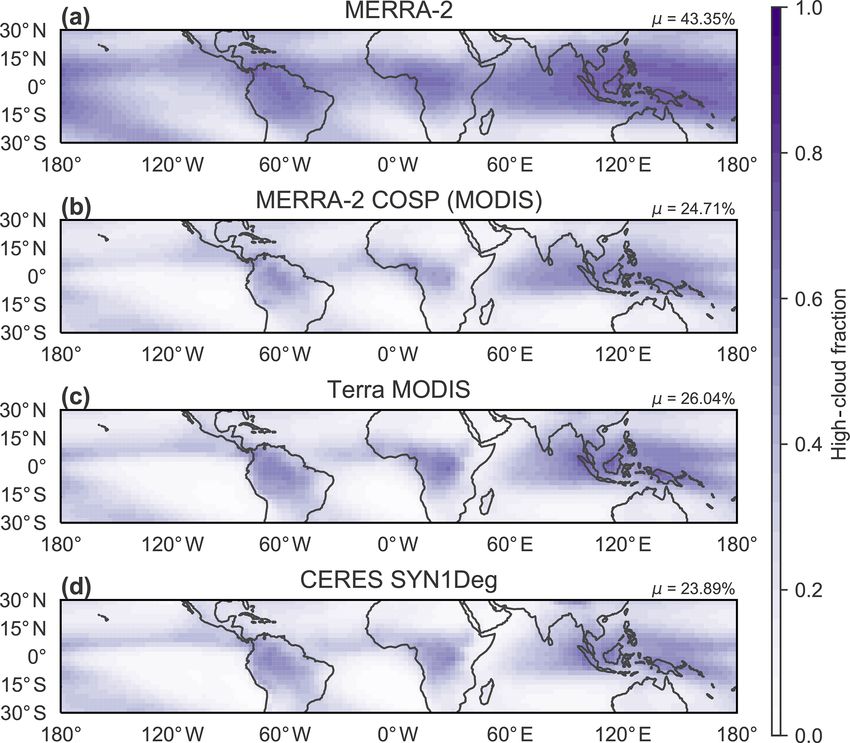
J. S. Wright et al.: Tropical high clouds in reanalyses                                                                             8993

Table 2. Summary of observational data sets, listed in alphabetical order by project. TOA stands for the top of the atmosphere, and UT
stands for upper troposphere, where the latter comprises pressures less than 500 hPa for CERES SYN1Deg and pressures less than 440 hPa
for ISCCP and MODIS. Other abbreviations are defined in the text. n/a: not applicable.

  Project          Product     Version   Variables         Period    Time step   Grid   Levels    Reference
  AIRS             TqJoint     v6        T , q, z        2003–2010   Daily        1◦    12 (p)    AIRS Science Team and Teixeira (2013)
  CERES            EBAF        Ed4.1     TOA radiation   2001–2014   Monthly      1◦    TOA       Doelling (2019)
  CERES            SYN1Deg     Ed4A      TOA radiation   2001–2010   Daily        1◦    TOA       Doelling (2017)
  CERES            SYN1Deg     Ed4A      HCC             2001–2010   Daily        1◦    UT        Doelling (2017)
  CFMIP2           GOCCP       v3.1.2    CC profile      2007–2014   Monthly      2◦    40 (z)    Chepfer et al. (2010)
  CloudSat         KG2009      v1        CC profile      2007–2010   Monthly      2◦    40 (z)    Kay and Gettelman (2009)
  CloudSat         2C-ICE      P1_R05    IWC profile     2007–2010   Monthly      n/a   104 (z)   Deng et al. (2015)
  ISCCP            HGM         v1        HCC             1984–2014   Monthly      1◦    UT        Rossow et al. (2017)
  Terra MODIS      MOD08       c6        HCC             2001–2014   Monthly      1◦    UT        Platnick (2015)
  NASA/GEWEX       SRB         r3.1      TOA radiation   1984–2007   Monthly      1◦    TOA       Zhang et al. (2015)

based on a consistent set of initial retrievals in each grid cell    troposphere, tropopause layer, and lower stratosphere. All
(Tian et al., 2013). As the finest temporal resolutions of other     vertically resolved variables are evaluated on pressure levels,
data examined in this study are daily means, we average              interpolated from height or model levels when necessary.
data from ascending and descending passes together. Vari-               Cloud radiative effects (CREs) are computed as clear-sky
ables taken from AIRS TqJoint include temperature, water             minus all-sky fluxes using positive-upward fluxes at the TOA
vapour mass mixing ratio, and geopotential height between            so that LWCRE (long-wave) is generally positive (the pres-
January 2003 and December 2014.                                      ence of clouds reduces outgoing long-wave radiation – OLR)
   Finally, we examine three products derived from Cloud-            and SWCRE (short-wave) is generally negative (the presence
Sat and Cloud-Aerosol Lidar and Infrared Pathfinder Satel-           of clouds increases the planetary albedo). CREs are sensitive
lite Observation (CALIPSO) measurements. These include               to differences in both all-sky and clear-sky fluxes (e.g. So-
two monthly estimates of cloud fraction vertical profiles,           den et al., 2004); accordingly, we report differences in both
one based on combined information from CloudSat and                  all-sky and clear-sky TOA fluxes below.
CALIPSO (Kay and Gettelman, 2009) and one based on                      Variables used to diagnose the potential origins of dif-
CALIPSO alone (Chepfer et al., 2010). We use the com-                ferences in high clouds include SST; vertical velocity at
bined CloudSat–CALIPSO product for the 4 years of 2007–              500 hPa; and vertical profiles of temperature, specific humid-
2010 and the GCM-Oriented CALIPSO Cloud Product (gen-                ity, and geopotential height between 1000 and 100 hPa. The
eral circulation model; GOCCP) for the 8 years of 2007–              latter three variables are used to compute moist static energy:
2014. The first product was discontinued after CloudSat
switched to sunlit-only observations in early 2011. We also          MSE = gz + cp T + Lv q,                                          (1)
use ice water content (IWC) measurements from Cloud-
Sat and CALIPSO based on the 2C-ICE (CloudSat and                    where g is gravitational acceleration in Earth’s lower atmo-
CALIPSO Ice Cloud Property Product) retrieval algorithm              sphere, z is geopotential height, cp is the specific heat ca-
(R05; Deng et al., 2015), averaged for all tropical profiles         pacity for dry air, T is temperature, Lv is latent enthalpy of
(10◦ S–10◦ N) over 2007–2010. CloudSat- and CALIPSO-                 vapourization at 0 ◦ C, and q is specific humidity. Tempera-
based data sets are provided on height grids, which we con-          ture and specific humidity are also used to calculate equiv-
vert to pressure using the barometric equation with a con-           alent potential temperature (θe ), which is then used to di-
stant scale height of 7.46 km. This approach introduces un-          agnose the potential instability of the lower troposphere as
certainty in the precise vertical location (in pressure coor-        the difference in equivalent potential temperature between
dinates) of features observed by CloudSat and CALIPSO,               the lower troposphere (850 hPa) and the middle troposphere
which should be taken into consideration when comparing              (500 hPa):
these features to those produced by the reanalyses.
                                                                     PI = θe,850 − θe,500 .                                           (2)

2.3   Derived variables and statistical treatments                   Equivalent potential temperature is computed according to
                                                                     the formula proposed by Bolton (1980) using the MetPy
Variables directly related to tropical high clouds include           software package (May et al., 2008–2020). Relative hu-
HCC and vertical profiles of cloud fraction and cloud wa-            midity (RH) is calculated with respect to liquid water us-
ter content, while variables used to explore the impacts of          ing MetPy. This approach avoids inconsistencies in the im-
differences in high clouds include TOA radiative fluxes and          plementation of the liquid–ice transition among the differ-
vertically resolved radiative heating rates within the upper         ent data sets (see Appendix A1). Ratios between saturation

https://doi.org/10.5194/acp-20-8989-2020                                                Atmos. Chem. Phys., 20, 8989–9030, 2020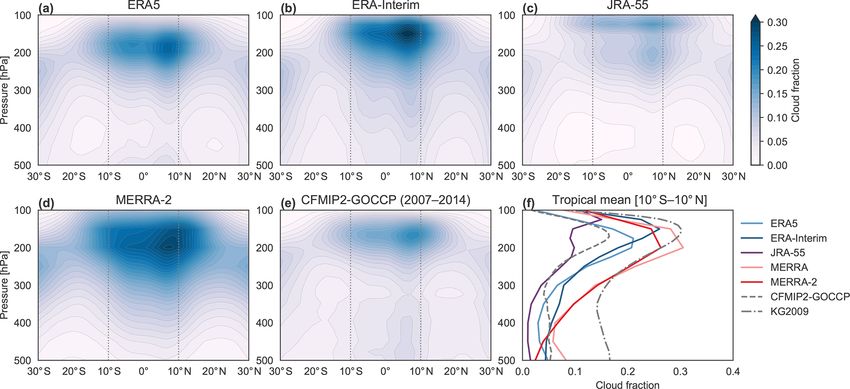
8994                                                                   J. S. Wright et al.: Tropical high clouds in reanalyses

vapour pressures with respect to ice and with respect to liquid    ical eastern Indian Ocean, equatorial Africa, and the Mar-
water are calculated using the empirical formulas suggested        itime Continent. By contrast, positive biases in MERRA-2
by Emanuel (1994).                                                 are largest around the flanks of the deep convective regions.
   The level of zero radiative heating (LZRH) is determined        Tropical-mean values of HCC are similar between ERA-
for all profiles for which the daily-mean net radiative heat-      Interim and CFSR/CFSv2 but with substantial differences
ing rate is positive at 100 hPa. All-sky total radiative heating   in the spatial patterns of HCC between these two reanaly-
rates (LW + SW; short-wave) are linearly interpolated onto a       ses. Most notably, ERA-Interim produces larger HCCs than
1000-level grid between 100 and 500 hPa with equal spacing         CFSR/CFSv2 in the deep convective regions of the tropics
in ln(p). The LZRH is then defined as the largest pressure         (especially in the Indo-Pacific region). The spatial pattern
for which all net radiative heating rates are positive between     in ERA5 is similar in many ways to that in ERA-Interim
100 hPa and that level (inclusive).                                but with further increases in HCC over tropical convec-
   Statistical treatments mainly consist of composite av-          tive regions (especially over land). ERA5 has larger HCCs
erages or distributions conditioned on ranked quartiles of         than ERA-Interim in tropical South America and Africa, as
LWCRE (i.e. four bins separated by the 25th percentile,            well as in the South Asian monsoon region, the Pacific por-
the median, and the 75th percentile). We focus in partic-          tion of the intertropical convergence zone (ITCZ), and the
ular on the largest values of LWCRE (denoted as Q4 ) in            South Pacific convergence zone (SPCZ). These differences
the inner tropics (10◦ S–10◦ N) as a proxy for strong con-         contribute to an increase of 0.04 (∼ 14 %) in the tropical-
vective activity. Results are very similar for ranked quar-        mean HCC between ERA-Interim and ERA5. Bechtold et al.
tiles of all-sky OLR, with OLR reversed so that Q4 corre-          (2014) reported that changes to parameterized convection
sponds to the smallest values of OLR. Using HCC instead            in the ECMWF atmospheric model implemented between
of LWCRE produces more substantial differences, particu-           ERA-Interim and ERA5 yielded lower biases against ob-
larly for MERRA-2. Given discrepancies in the precise def-         served brightness temperatures in land convective regions,
inition of HCC across reanalyses (Table 1) and the diffi-          especially for channels sensitive to the upper troposphere.
culty of defining an appropriate observational benchmark for       However, as differences in cloud top temperatures between
HCC, we judge HCC less suitable for this purpose. We select        the two model versions could also influence the simulated
LWCRE rather than OLR for convenience of presentation.             brightness temperatures, these lower biases cannot be di-
Averages taken in the horizontal dimension are weighted            rectly attributed to improvements in HCC.
by relative area; 2-dimensional kernel density estimates are          Initial comparison with ISCCP HGM suggests that the
computed using the k-dimensional tree-based implementa-            reanalyses systematically overestimate HCC, with the trop-
tion in scikit-learn (Pedregosa et al., 2011) with a Gaussian      ical mean from JRA-55 (25.74 %) falling closest to that
kernel. Optimal bandwidths for kernel density estimates are        from ISCCP (24.42 %). However, as discussed at the be-
identified using a 20-fold grid-search cross-validation on ran-    ginning of Sect. 2, direct comparisons between cloud vari-
domly selected subsets of the data and consistently converge       ables derived from satellite observations and those de-
to values near 1 (0.8–1.3) for LWCRE and values near 2 (1.5–       rived from models can be misleading. MERRA-2 provides
2.4) for SWCRE.                                                    outputs from the Cloud Feedback Model Intercomparison
                                                                   Project (CFMIP) Observation Simulator Package (COSP;
                                                                   Bodas-Salcedo et al., 2015) as an ancillary product in the
3   Climatological distributions                                   reanalysis. Included in this product are estimates emulat-
                                                                   ing HCC as observed by MODIS. Whereas MERRA-2 pro-
Figure 1 shows the time-mean distributions of high-cloud           duces a tropical-mean HCC of 43.35 % during 2001–2014,
fraction (HCC) in the tropics based on ISCCP HGM obser-            the MERRA-2 COSP product indicates that MODIS would
vationally based analysis and the five individual reanalyses       observe a tropical-mean HCC of only 24.71 %. This latter
for 1984–2014. Area-weighted mean values of HCC aver-              estimate is in good agreement not only with ISCCP HGM
aged over the tropics (30◦ S–30◦ N) are noted for each prod-       but also with Terra MODIS (26.04 %) and CERES SYN1Deg
uct. The definition of HCC varies somewhat among these             (23.89 %) gridded products (Fig. 2) and extends to the spa-
data sets, with the lower bound of the high-cloud layer rang-      tial distribution of HCC. The largest difference between the
ing from 500 to 400 hPa (Tables 1 and 2). We show below            standard MERRA-2 HCC product and the MERRA-2 COSP
(Fig. 3) that reanalysis-derived cloud fraction profiles have      product is a reduction in HCC outside the canonical deep
minima between 400 and 500 hPa in the tropics so that dif-         convective regions of the tropics. This difference suggests
ferences in the precise definition of HCC should not greatly       that the large HCCs produced by MERRA-2 in these ar-
impact qualitative comparisons based on Fig. 1.                    eas are associated with optically thin clouds having small
   Tropical-mean HCCs among the reanalyses are smallest            water paths, which cannot be readily observed by MODIS.
in JRA-55 and largest in MERRA-2. For JRA-55, differ-              The close agreement between MERRA-2 COSP and obser-
ences relative to the other reanalyses are most pronounced         vational estimates does not necessarily mean that the larger
over canonical deep convective regions, including the trop-        HCCs in MERRA-2 are more realistic (i.e. that the other

Atmos. Chem. Phys., 20, 8989–9030, 2020                                             https://doi.org/10.5194/acp-20-8989-2020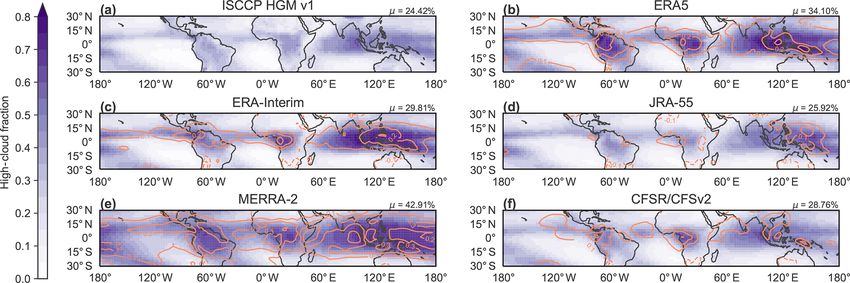
J. S. Wright et al.: Tropical high clouds in reanalyses                                                                            8995

Figure 1. Climatological mean spatial distribution of high-cloud cover (HCC) for (a) ISCCP HGM, (b) ERA5, (c) ERA-Interim, (d) JRA-55,
(e) MERRA-2, and (f) CFSR/CFSv2 over 1984–2014. Differences relative to ISCCP HGM are shown for each reanalysis as orange contours
(dashed for negative values) at intervals of 0.1. The area-weighted tropical-mean (30◦ S–30◦ N) HCC based on each product is shown at the
upper-right corner of the corresponding panel.

                                                                          Figure 3 shows time-mean zonal-mean profiles of cloud
                                                                       fraction in the tropical upper troposphere as functions of
                                                                       latitude and pressure. ERA5, ERA-Interim, JRA-55, and
                                                                       MERRA-2 all show maxima in cloud fraction near the base
                                                                       of the tropical tropopause layer. The peak value in ERA-
                                                                       Interim is centred at 150 hPa, slightly above that in ERA5
                                                                       (∼ 175 hPa) and MERRA-2 (∼200 hPa) and slightly below
                                                                       that in JRA-55 (∼ 125 hPa). JRA-55 also shows a secondary
                                                                       maximum near 200 hPa. All of these maxima are most pro-
                                                                       nounced in the Northern Hemisphere between 5 and 10◦ N,
                                                                       reflecting the preferred position of the intertropical conver-
                                                                       gence zone (ITCZ). CFSR does not provide vertical profiles
                                                                       of cloud fraction and is therefore not represented in Fig. 3.
                                                                          Observationally based estimates of vertically resolved
                                                                       cloud fraction from CALIPSO (CFMIP2-GOCCP; Chepfer
                                                                       et al., 2010) are shown in Fig. 3e and f, with a tropical-mean
                                                                       profile based on CloudSat and CALIPSO (KG2009; Kay and
                                                                       Gettelman, 2009) also included in Fig. 3f. The zonal-mean
Figure 2. As in Fig. 1a but for (a) direct output from MERRA-          distribution based on KG2009 is qualitatively similar to that
2, (b) MERRA-2-COSP (emulating MODIS observations of the               based on CFMIP2-GOCCP and is therefore omitted from
MERRA-2 atmosphere), (c) Terra MODIS, and (d) CERES                    Fig. 3; however, these two data sets show large differences
SYN1Deg (based primarily on Terra and Aqua MODIS) for 2001–            in the magnitude of cloud fraction within the tropical upper
2014. The area-weighted tropical-mean (30◦ S–30◦ N) high-cloud         troposphere (Fig. 3f). The range of cloud fractions spanned
cover based on each product is shown at the upper-right corner of      by the two observationally based estimates is comparable to
the corresponding panel.                                               that spanned by the reanalysis products. Like the reanalyses,
                                                                       the observational products indicate that the maximum cloud
                                                                       fraction is located in the Northern Hemisphere tropics. The
reanalyses substantially underestimate HCC in the tropics).
                                                                       vertical placement of this maximum is around 150–175 hPa,
Rather, it indicates only that MERRA-2 produces a reason-
                                                                       between that produced by ERA-Interim and that produced
ably realistic distribution of the high clouds that can be read-
                                                                       by ERA5. This indicates that the altitude of the maximum in
ily observed by passive infrared instruments like MODIS. A
                                                                       MERRA-2 is slightly too low, a known issue in the GEOS-
recent study in which a cloud simulator was applied to ERA-
                                                                       5 model. The bimodal structure of the cloud fraction profile
Interim outputs also indicates good agreement with observed
                                                                       and the extremely high altitude of the peak values (125 hPa)
HCCs in the tropics, with a slight positive bias in the inner-
                                                                       are unique to JRA-55. Together with the relatively small val-
tropical regions (Stengel et al., 2018).
                                                                       ues of HCC in JRA-55 (Fig. 1e), we conclude that this reanal-

https://doi.org/10.5194/acp-20-8989-2020                                                 Atmos. Chem. Phys., 20, 8989–9030, 2020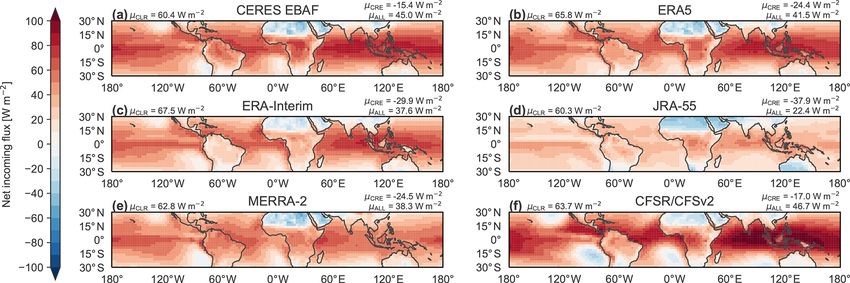
8996                                                                       J. S. Wright et al.: Tropical high clouds in reanalyses

Figure 3. Time-mean zonal-mean distributions of cloud fraction based on the (a) ERA5, (b) ERA-Interim, (c) JRA-55, and (d) MERRA-
2 reanalyses (1980–2014), along with (e) an observationally based distribution from the GOCCP CALIPSO-based product produced for
CFMIP2 (Chepfer et al., 2010), which covers 2007–2014. Inner-tropical-mean (10 ◦ S–10◦ N) profiles of cloud fraction based on these five
estimates are shown in (f), along with profiles from MERRA and the combined CloudSat–CALIPSO product derived by Kay and Gettelman
(2009). The latter is averaged over 2007–2011. Vertical lines in (a) through (e) mark the bounds of the averaging domain. CFSR does not
provide vertical profiles of cloud fraction.

ysis underestimates high-cloud fractions through most of the          much smaller magnitudes (maximum value: 2.4 mg kg−1 at
tropical upper troposphere. The observational estimates also          250 hPa). This difference is again consistent with JRA-55
include secondary maxima in cloud fraction between 400–               underestimating cloud cover in the tropical upper tropo-
500 hPa, while most of the reanalyses produce local min-              sphere. The zonal-mean distribution of CWC in ERA-Interim
ima in this region. This difference suggests that the reanal-         (Fig. 4b) is remarkably different from that in the other re-
ysis models may systematically underestimate the depth, fre-          analyses, including ERA5 (Fig. 4a), with no distinct maxi-
quency, or amount of cloud detrained by cumulus congestus             mum in the tropical upper troposphere. Instead, ERA-Interim
in the tropics (Johnson et al., 1999).                                shows a monotonic decrease in CWC with increasing altitude
   Differences among the reanalyses are even more pro-                above 500 hPa. Although it is difficult to pinpoint the reason
nounced with respect to time-mean zonal-mean distributions            for the difference in vertical profiles of CWC between ERA-
of cloud water content (CWC) in the tropical upper tropo-             Interim and ERA5, changes to the treatment of entrainment
sphere (Fig. 4). Here CWC represents the sum of ice and               and detrainment in the convective scheme (Appendix A2)
liquid water content, except for the CloudSat estimate shown          may contribute. These changes, together with improvements
in Fig. 4f, which includes only ice. Among the reanalyses,            in prognostic microphysics, alter the structure of the convec-
MERRA-2 (Fig. 4d) produces the largest CWCs in this re-               tive mass flux and improve coupling between convection and
gion, with a pronounced peak at 300 hPa. Although MERRA-              the tropical environment (Bechtold et al., 2008, 2014).
2 produces smaller cloud fractions in the tropical upper tro-            The tropical-mean profile of IWC based on the CloudSat
posphere than its predecessor, MERRA (Fig. 3f), it pro-               2C-ICE product between 2007 and 2010 is shown for context
duces substantially larger CWCs (Fig. 4f). The assumed ef-            in Fig. 4f. The diurnal sampling of CloudSat along its ini-
fective radius for ice particles was reduced between MERRA            tial orbit in the A-Train constellation (Equator-crossing times
and MERRA-2, along with several other changes aimed                   around 01:30 and 13:30 LST – local solar time) should be
at increasing upper-tropospheric humidity in the model                taken into account when comparing the CloudSat profile to
(Molod et al., 2012, 2015). The large CWCs in MERRA-2                 the reanalyses, as this orbit misses the late-afternoon peak of
have significant impacts on radiative transfer (see Sect. 4).         continental convective activity in the tropics (e.g. Yang and
CFSR/CFSv2 (Fig. 4e) produces a similarly pronounced ver-             Slingo, 2001). It is also important to note that the CloudSat
tical maximum in CWC but shifted slightly higher in alti-             estimate represents total IWC, including both precipitating
tude and with a peak magnitude (15.4 mg kg−1 at 250 hPa)              and cloud ice. We may therefore expect the profile maximum
roughly half that produced by MERRA-2 (30.1 mg kg−1                   to be both larger in magnitude and lower in altitude than one
at 300 hPa) when averaged over the inner tropics (10◦ S–              based on cloud ice alone (Li et al., 2012, 2016). This ex-
10◦ N). JRA-55 (Fig. 4c) shows a qualitatively similar dis-           pectation is supported by Fig. 4f, as the peak value of IWC
tribution to those of MERRA-2 and CFSR/CFSv2 but with                 based on CloudSat is larger and lower in altitude relative to

Atmos. Chem. Phys., 20, 8989–9030, 2020                                                  https://doi.org/10.5194/acp-20-8989-2020
J. S. Wright et al.: Tropical high clouds in reanalyses                                                                             8997

Figure 4. Time-mean zonal-mean distributions of total cloud water content based on the (a) ERA5, (b) ERA-Interim, (c) JRA-55,
(d) MERRA-2, and (e) CFSR/CFSv2 reanalyses (1980–2014). Inner-tropical-mean (10◦ S–10◦ N) profiles based on these five reanalyses
are shown in (f), along with profiles from MERRA and an observationally based estimate of total ice water content (cloud ice + snow) dur-
ing 2007–2010 from the CloudSat–CALIPSO 2C-ICE product. Vertical lines in (a) through (e) mark the bounds of the averaging domain.
Dashed lines in (f) indicate ice-only water contents from the reanalyses that provide this information (all but CFSR/CFSv2). The total ice
(TIWC; cloud ice + snow) profile from ERA5 is also included for comparison with 2C-ICE.

the reanalysis profiles (54.2 mg kg−1 at ∼ 370 hPa). Despite           4     Radiative impacts
this difference, the structure of the CloudSat profile is quali-
tatively more consistent with the pronounced anvil layers in           4.1    Top-of-atmosphere radiation budget
ERA5, MERRA-2, and CFSR/CFSv2 than with JRA-55 or
ERA-Interim.                                                           Figure 5 shows spatial distributions of all-sky and clear-sky
   The cumulus congestus peak in the middle troposphere                OLR based on CERES EBAF during 2001–2014, along with
that does not appear in reanalysis estimates of cloud frac-            differences between the five individual reanalysis products
tion (but does appear in observations) is evident in the re-           and CERES. Rather than direct observations (with clear-
analysis estimates of CWC but not in the CloudSat estimate.            sky fluxes taken only from cloud-free columns), the CERES
The latter may be attributable to the exclusion of liquid wa-          EBAF fluxes discussed in this section are estimates for the
ter from the CloudSat estimate, although previous analyses             entire column with clouds removed and are suitable for direct
of CloudSat CWCs did not show a clear maximum here                     comparison with model-generated clear-sky fluxes (Loeb
even when the liquid phase was included (see, e.g. Su et al.,          et al., 2020). CERES EBAF estimates a time-mean tropical-
2011). MERRA-2, ERA-Interim, ERA5, and JRA-55 all in-                  mean OLR of 260.3 W m−2 over 2001–2014, smaller than in
dicate large liquid water fractions in clouds at these altitudes.      any of the reanalyses except for MERRA-2. Better agreement
In ERA-Interim, 12.5 % of cloud water at 400 hPa averaged              is found for clear-sky OLR, with tropical-mean values from
over the inner tropics is liquid, rising to 63.3 % at 500 hPa.         all reanalyses within ±2.5 W m−2 of the CERES EBAF es-
These ratios are larger in ERA5 (28.6 % and 86.0 %, respec-            timate. Accordingly, the time-mean tropical-mean LWCRE
tively) and MERRA-2 (86.4 % and 99.8 %) and smaller in                 based on CERES EBAF (27.3 W m−2 ) was larger than that
JRA-55 (3.3 % and 60.4 %). CFSR does not provide sepa-                 produced by any of the reanalyses except for MERRA-
rate outputs for liquid and ice water contents. The preva-             2 (31.6 W m−2 ). ERA-Interim, ERA5, and CFSR/CFSv2
lence of liquid water content at these altitudes in MERRA              underestimate clear-sky OLR even as they overestimate
and MERRA-2 relative to CloudSat is a known feature of the             all-sky OLR so that negative biases in the tropical-mean
GEOS-5 data assimilation system (Su et al., 2011).                     LWCRE are approximately twice as large as positive bi-
                                                                       ases in tropical-mean OLR in each of these three reanaly-
                                                                       ses. Comparison with observationally based estimates with
                                                                       longer durations further indicates that most of the reanalyses
                                                                       overestimate OLR and underestimate LWCRE in the trop-
                                                                       ics. NASA/GEWEX SRB indicates tropical-mean values of

https://doi.org/10.5194/acp-20-8989-2020                                                 Atmos. Chem. Phys., 20, 8989–9030, 2020
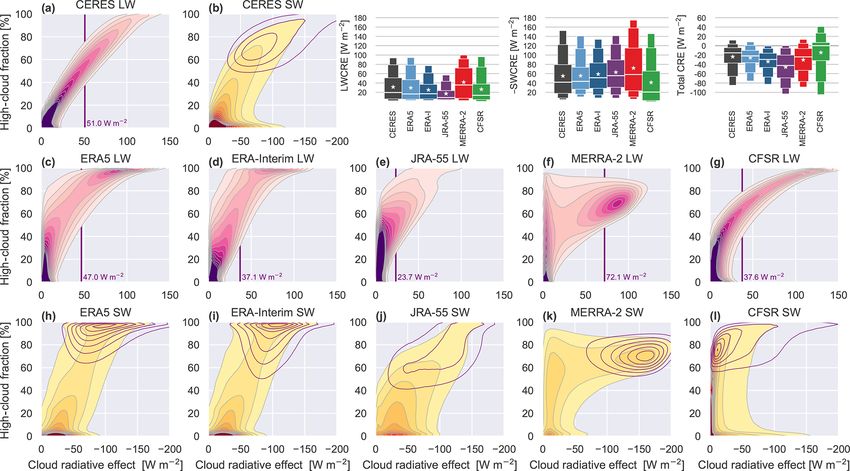
8998                                                                   J. S. Wright et al.: Tropical high clouds in reanalyses

259.4 W m−2 for all-sky OLR and 27.7 W m−2 for LWCRE               sky radiation, as the negative SWCRE outweighs the posi-
over 1984–2007, while the NOAA Interpolated OLR product            tive LWCRE. However, most of the reanalyses greatly over-
indicates a tropical-mean value of 250.7 W m−2 for all-sky         estimate the magnitude of this reduction relative to CERES.
OLR over 1980–2014.                                                Such overestimates have implications for atmospheric energy
   Many differences among the reanalyses indicate an in-           transport and could result at least in part from the lack of two-
verse relationship between relative biases in OLR and              way coupling between cloud fields and SST in the reanalyses
those in HCC. For example, JRA-55, which has the small-            (e.g. Kolly and Huang, 2018; Wall et al., 2019). For JRA-55,
est HCCs in the tropics among the reanalyses, likewise             which overestimates the net CRE by 22.5 W m−2 relative to
produces the largest tropical-mean OLR and the smallest            CERES, a little more than half of the bias in the net CRE
tropical-mean LWCRE. Conversely, MERRA-2, with the                 is attributable to the bias in LWCRE. The remainder is due
largest HCCs among the reanalyses, produces the smallest           to overestimated cloud albedo effects. Similar ratios hold for
tropical-mean OLR and the largest tropical-mean LWCRE.             ERA5 and ERA-Interim, with biases in LWCRE contributing
ERA5 produces a slightly smaller OLR and a slightly larger         approximately 55 % of the overall biases in each case. For
LWCRE than ERA-Interim and again shows maximum dif-                MERRA-2, overestimated cloud albedo effects more than
ferences over tropical land areas with strong convection. As       compensate for the stronger LWCRE, producing a net CRE
with HCC, ERA-Interim and CFSR/CFSv2 produce simi-                 similar to that in ERA5 (approximately 9 W m−2 stronger
lar tropical-mean values of both OLR and LWCRE (within             than that from CERES). CFSR/CFSv2 produces a net CRE
±0.5 W m−2 ). Most differences between these two reanaly-          very similar to that indicated by CERES, implying compen-
ses obey the same type of inverse relationship: ERA-Interim        sating biases in SWCRE and LWCRE. However, the horizon-
produces smaller values of OLR in the Indo–Pacific do-             tal gradients of net radiation are much sharper in this reanal-
main (consistent with larger HCCs in this region), while           ysis than in any of the other data sets included in Fig. 6.
CFSR/CFSv2 produces smaller values of OLR over tropical               Relationships between tropical HCC and TOA radiation
mountain ranges (consistent with relatively large HCCs in          fluxes are examined in more detail in Fig. 7, which shows
these locations). There are some notable exceptions though,        joint distributions of HCC against the LW and SW cloud ra-
such as over Africa. ERA-Interim produces slightly larger          diative effects. The joint distributions shown in Fig. 7 are
HCCs in this region (Fig. 1), but CFSR produces smaller val-       2-dimensional frequency distributions analogous to scatter-
ues of OLR (this difference is mitigated somewhat in CFSv2;        plots, where the shading indicates the density of the points
cf. Fig. B2g). This type of inconsistency, in which biases in      and outliers are omitted. The data used to construct these dis-
HCC and OLR do not align with simple expectations, may             tributions are daily-mean gridded values within 10◦ S–10◦ N
reflect systematic differences in the depth of convection (and     during the period 2001–2010 and thus reflect both spatial and
thus cloud top temperature) or the water paths associated          temporal covariability of TOA radiative fluxes and HCC. For
with convective anvil clouds. Although we do not directly          this and other analyses that do not span the CFSR/CFSv2
evaluate differences in cloud top height here (owing in part       transition (1 January 2011), we omit any reference to CFSv2
to the lack of vertically resolved cloud fraction profiles in      and refer to this reanalysis only as CFSR. Data have been
CFSR/CFSv2), we note that CFSR/CFSv2 produces a more               interpolated when necessary to 1◦ × 1◦ spatial grids. The ab-
pronounced peak in cloud water content extending to rela-          scissa is reversed for plots of SWCRE so that larger abso-
tively higher altitudes than ERA-Interim in the tropical mean      lute magnitudes of both LWCRE and SWCRE are located
(Fig. 4f).                                                         toward the right. Distributions of daily-mean gridded values
   Figure 6 shows spatial distributions of all-sky net radiation   of LWCRE, SWCRE, and total CRE are included at the up-
based on CERES EBAF and the five reanalyses, with positive         per right of Fig. 7.
values indicating time-mean energy fluxes into the tropical           The joint distribution of HCC against LWCRE based on
climate system. Mean values across the tropics are positive        CERES SYN1Deg indicates a tight, nearly linear relation-
(incoming solar radiation exceeds OLR), as indicated here          ship between these two variables, in which a large value
by CERES EBAF (net gain of 45.0 W m−2 ). This excess of            of HCC corresponds to a large LWCRE. The 75th per-
incoming energy in the already energy-rich tropics is essen-       centile value of LWCRE based on CERES SYN1Deg is
tial to the “heat engine” model of the atmospheric circula-        51.0 W m−2 , which corresponds to an HCC of roughly 0.57.
tion and is contributed primarily by imbalances in the clear-      Among the reanalyses, CFSR is most similar to CERES
sky fluxes (e.g. Stephens and L’Ecuyer, 2015, and references       SYN1Deg in its joint distribution of HCC against LWCRE.
therein). Net clear-sky fluxes into the tropics are typically      However, the CFSR distribution has a stronger curvature so
somewhat larger in the reanalyses than in CERES, with over-        that the 75th percentile of LWCRE corresponds to a smaller
estimates as large as 7 W m−2 (in ERA-Interim). The closest        value of LWCRE (37.6 W m−2 ) despite a similar value of
match in the tropical mean is provided by JRA-55, which is         HCC (0.58). JRA-55 has the smallest 75th percentile value of
within 0.1 W m−2 of CERES (this good agreement does not            LWCRE (23.7 W m−2 ). This value of LWCRE corresponds
extend to the all-sky net radiation flux, as detailed below).      to an HCC value of around 0.56 in JRA-55, whereas it corre-
Cloud effects reduce the energy excess provided by clear-          sponds to an HCC of only 0.27 in CERES SYN1Deg, imply-

Atmos. Chem. Phys., 20, 8989–9030, 2020                                              https://doi.org/10.5194/acp-20-8989-2020
J. S. Wright et al.: Tropical high clouds in reanalyses                                                                          8999

Figure 5. Climatological mean spatial distributions of all-sky outgoing long-wave radiation (OLR; shading) and clear-sky outgoing long-
wave radiation (CLR; contours at intervals of 10 W m−2 ) for (a) CERES EBAF over 2001–2014. Differences relative to CERES EBAF
for the same period are shown for (b) ERA5, (c) ERA-Interim, (d) JRA-55, (e) MERRA-2, and (f) CFSR/CFSv2 (abbreviated CFSR/v2).
Contours in (c) through (f) cover the range within ±10 W m−2 at intervals of 4 W m−2 . Tropical-mean (30◦ S–30◦ N) values of OLR and
CLR based on each product are shown at the upper-right and upper-left corners, respectively, of the corresponding panel. Tropical-mean
values for the long-wave cloud radiative effect (LWCRE = CLR − OLR) are listed above those for OLR.

Figure 6. Climatological mean spatial distributions of all-sky net incoming radiation (ALL; shading) for (a) CERES EBAF, (b) ERA5,
(c) ERA-Interim, (d) JRA-55, (e) MERRA-2, and (f) CFSR/CFSv2 during 2001–2014. Tropical-mean (30◦ S–30◦ N) values of ALL and
clear-sky net incoming radiation (CLR) based on each product are shown at the upper-right and upper-left corners, respectively, of the
corresponding panel. Tropical-mean values for the net cloud radiative effect (CRE = CLR − ALL) are listed above those for ALL.

ing that the relatively small mean HCC in JRA-55 is not the           ilar to that based on ERA-Interim but with a greater frac-
only reason behind relatively weak LWCRE in this reanal-              tion of the data (and greater variability) in the large-LWCRE
ysis. Joint distributions based on ERA5, ERA-Interim, and             mode. The 75th percentile value is thus substantially larger
MERRA-2 are qualitatively more distinct, with secondary               in ERA5 (47.0 W m−2 ) than in ERA-Interim, as is the mean
modes at large values of LWCRE. In ERA-Interim, there is a            cloud fraction associated with this value (0.75). Bimodality
clear distinction in both variables between the primary mode          in MERRA-2 takes a different form. The first mode corre-
(associated with small values of both HCC and LWCRE) and              sponds to small values of LWCRE. Although the peak of this
the secondary mode (associated with large values of HCC               distribution is at small values of HCC, this small-LWCRE
and LWCRE). HCCs associated with the latter mode are al-              mode still exhibits relatively large occurrence frequencies at
most exclusively greater than 0.9. The 75th percentile value          values of HCC approaching 1. The mean HCC associated
(37.1 W m−2 ) falls between the two modes and corresponds             with this mode is around 0.35. The second mode peaks at
to an HCC of 0.65. The distribution based on ERA5 is sim-             relatively large values of both LWCRE (∼ 88 W m−2 ) and

https://doi.org/10.5194/acp-20-8989-2020                                               Atmos. Chem. Phys., 20, 8989–9030, 2020
9000                                                                         J. S. Wright et al.: Tropical high clouds in reanalyses

Figure 7. Joint distributions of daily-mean HCC against (a) LWCRE and (b) SWCRE based on CERES SYN1Deg using gridded data
from 2001 to 2010. Corresponding joint distributions are shown for (c, h) ERA5, (d, i) ERA-Interim, (e, j) JRA-55, (f, k) MERRA-2, and
(g, l) CFSR. The 75th percentile of LWCRE is marked in (a) and (c–g). Sub-distributions of HCC against SWCRE associated with the values
of LWCRE that exceeded the corresponding 75th percentile threshold are then shown as purple contours in (b) and (h–l). Distributions of
LWCRE, SWCRE, and total CRE are shown in the upper right (in which ERA-Interim is abbreviated ERA-I), with SWCRE multiplied by −1
for convenience of presentation. The thickest boxes mark the interquartile ranges, with the medians marked as horizontal lines and the means
marked as stars. The narrower extended boxes indicate the 5th, 10th, 90th, and 95th percentiles.

HCC (∼ 0.7). The 75th percentile of LWCRE (72.1 W m−2 )                 (Appendix A1), JRA-55 and MERRA-2 produce very dif-
is contained within the second mode, meaning that the large-            ferent relationships between cloud fraction and condensate.
LWCRE mode contains more than 25 % of the inner-tropical                Tuning efforts to increase the amount of cloud ice in the
data points in MERRA-2. An LWCRE of 72.1 W m−2 cor-                     upper troposphere in MERRA-2 were motivated by a de-
responds to an HCC of approximately 0.68 in MERRA-                      sire to improve OLR (recognizing that convective detrain-
2, slightly less than that associated with the same value of            ment altitudes are too low in GEOS-5, the developers ac-
LWCRE in CERES SYN1Deg (0.73).                                          cepted overestimating cloud ice to get OLR right) and upper-
   The unique bimodality of the HCC–LWCRE distribution                  tropospheric humidity (Molod et al., 2015). The anvil cloud
in MERRA-2 is a consequence of the separation of cloud                  fraction was then kept small relative to the cloud ice content
condensate in the prognostic cloud scheme into “large-scale”            to prevent a worsening of SWCRE as LWCRE was increased.
and “anvil” cloud types. Of these two types, anvil clouds are              Joint distributions of HCC against SWCRE are consistent
assigned higher number densities that translate into greater            with SWCRE being less tightly linked than LWCRE to HCC
values of optical thickness when the radiation calculations             in the tropics. However, large HCCs are typically associ-
are performed (Bacmeister et al., 2006). The model used to              ated with both large LWCREs and large SWCREs. CERES
produce MERRA-2 also uses different procedures to relate                SYN1Deg and four of the five reanalyses show extensive
the evolution of cloud fraction to autoconversion between               overlap between large values of LWCRE and large values of
the large-scale and anvil cloud types, which appears to re-             SWCRE. CFSR is a notable exception, with large values of
sult in relatively large values of cloud fraction persisting even       LWCRE often corresponding to small values of SWCRE. As
as CWC declines (the small-LWCRE mode in Fig. 7f). Al-                  a consequence, the distribution of total CRE based on CFSR
though the treatment of prognostic cloud fraction used in               is broader than that based on CERES or the other reanalyses,
MERRA-2 is conceptually similar to that used in JRA-55                  with the middle 90 % spanning from less than −100 W m−2

Atmos. Chem. Phys., 20, 8989–9030, 2020                                                    https://doi.org/10.5194/acp-20-8989-2020
You can also read


